
The human-AI scoring system: A new method for CT-based assessment of COVID-19 severity
Abstract
BACKGROUND:
Chest computed tomography (CT) plays an important role in the diagnosis and assessment of coronavirus disease 2019 (COVID-19).
OBJECTIVE:
To evaluate the value of an artificial intelligence (AI) scoring system for radiologically assessing the severity of COVID-19.
MATERIALS AND METHODS:
Chest CT images of 81 patients (61 of normal type and 20 of severe type) with confirmed COVID-19 were used. The test data were anonymized. The scores achieved by four methods (junior radiologists; AI scoring system; human-AI segmentation system; human-AI scoring system) were compared with that by two experienced radiologists (reference score). The mean absolute errors (MAEs) between the four methods and experienced radiologists were calculated separately. The Wilcoxon test is used to predict the significance of the severity of COVID-19. Then use Spearman correlation analysis ROC analysis was used to evaluate the performance of different scores.
RESULTS:
The AI score had a relatively low MAE (1.67–2.21). Score of human-AI scoring system had the lowest MAE (1.67), a diagnostic value almost equal to reference score (
CONCLUSION:
The human-AI scoring system can help radiologists to improve the accuracy of COVID-19 severity assessment.
1.Introduction
Chest computed tomography (CT) plays an important role in the diagnosis and assessment of coronavirus disease 2019 (COVID-19) [1]. Compared with nucleic acid testing, chest CT can provide quicker diagnosis of COVID-19, which is of great importance for clinical treatment establishment.
As the number of affected patients is still on rapid rise, severity assessment based on manual chest CT has become time-consuming and laborious. New methods are in urgent need. Recently, artificial intelligence (AI) has been widely used in imaging technologies, but no studies have investigated the usefulness of AI-supported CT in the diagnosis of COVID-19 [2, 3, 4, 5, 6].
Including 81 COVID-19 patients, this study was designed to compare the diagnostic values of scores (common and severe disease types) made by junior radiologists, AI scoring system, human-AI segmentation system, and human-AI scoring system.
2.Materials and methods
This was a retrospective study. Our institutional review board waived written informed consent because only de-identified data were evaluated and no potential risks were brought to patients.
2.1Chest CT images
The study was conducted at the First Affiliated Hospital of University of Science and Technology of China. Between January 20 and February 20, 2020, 81 patients with confirmed COVID-19 were included (age 45.37
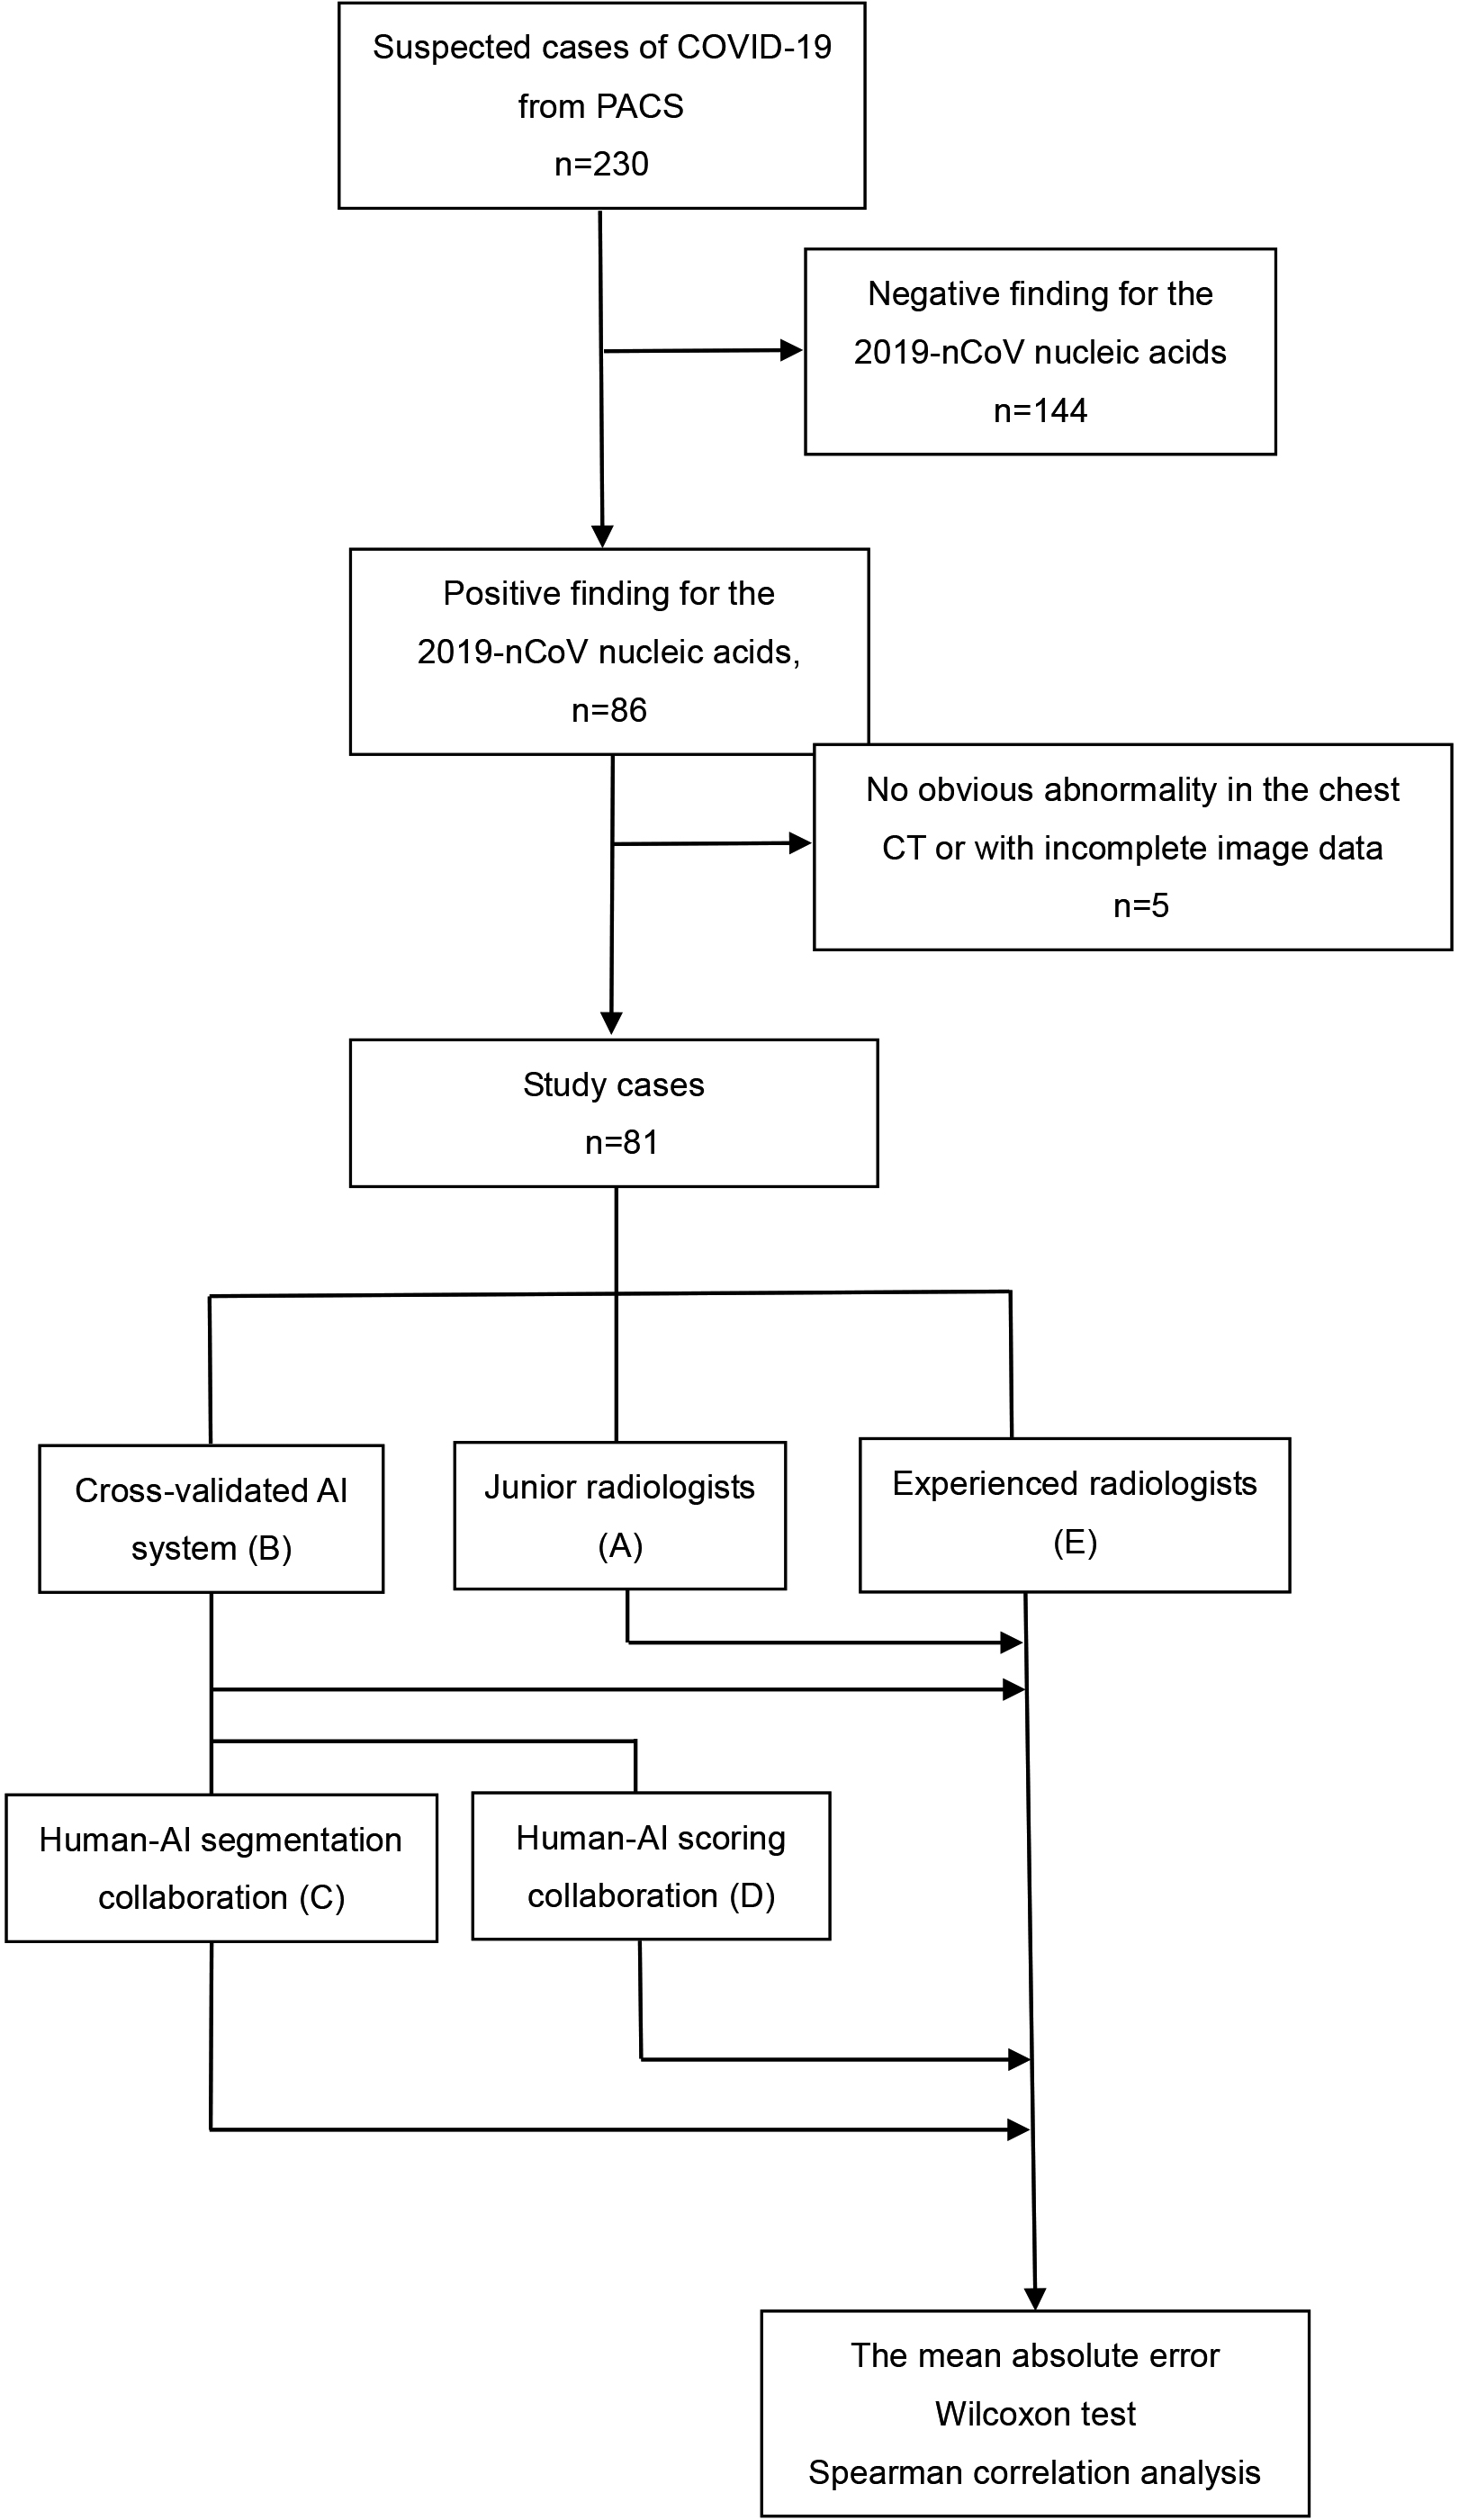
Figure 1.
Flowchart of the evaluation process of different scoring methods for severity assessment of COVID-19. PACS: picture archiving and communication systems.
2.2Clinical conditions of COVID-19
According to the 2019-nCoV (trial version 7) guideline [7], 81 patients were enrolled, including 61 common and 20 severe patients.
2.3Development of the AI scoring system
We proposed an AI scoring system that comprised a coarse-to-fine infection region segmentation module and a severity scoring module (Fig. 2). CT images were isotopically resampled and normalized before being sent to the system.
Figure 2.
Overall model architecture of the deep learning-based CT scoring system.
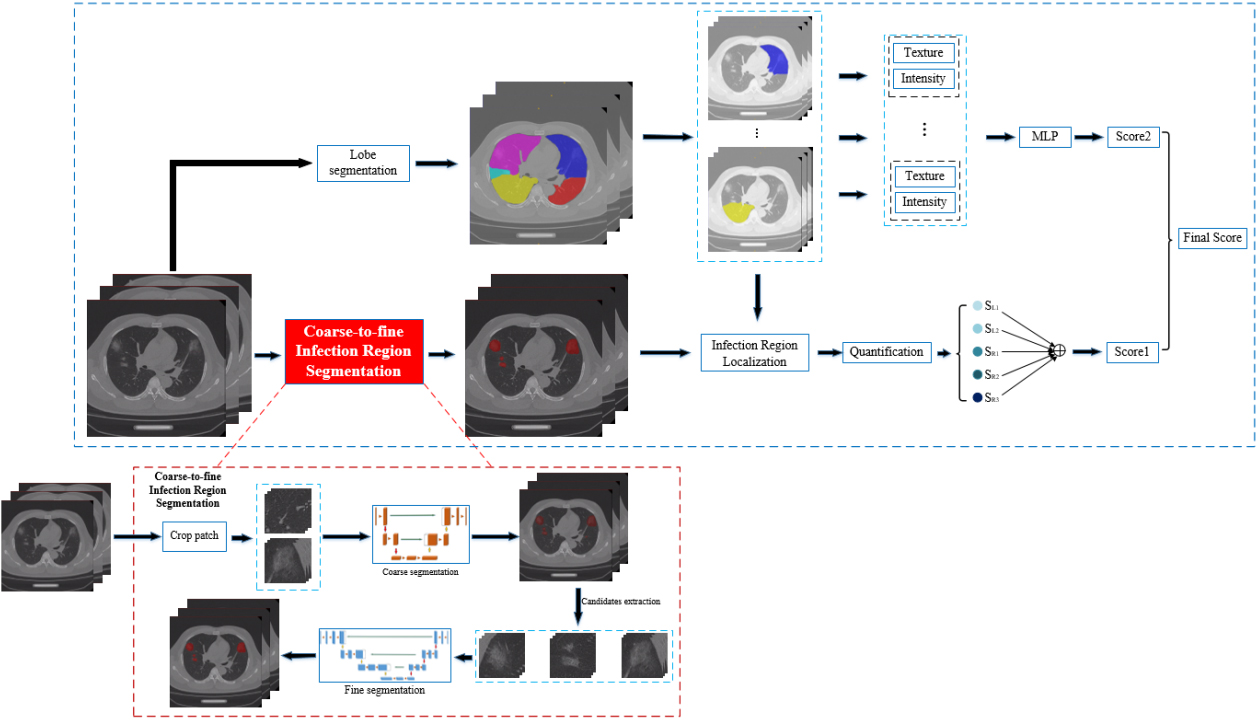
2.3.1Segmentation of lesions
Segmentation of the lobes was first performed based on V-Net [8], with down-sampled images by one of four factors in each dimension. However, down sampling was not suitable for lesions segmentation, because some extremely small lesions in mild or early COVID-19 CT images may be missed. In the meantime, the original images with a high resolution could decrease the radiologists’ efficiency. To address this issue, we proposed a two-stage segmentation: coarse stage segmentation and a fine stage segmentation. Concretely, high-resolution CT images were first cropped to small patches of size 96
2.3.2Severity score assessment
The severity scoring module started to work after the accomplishment of segmentation [1]. However, the AI-given scores typically lacked interpretability. Hence, we employed texture and intensity, two conventional image parameters, to increase the model’s accuracy. An independent multilayer perceptron-based regression model was trained for each lobe’s texture and intensity to obtain an additional severity score. The two scores were averaged as the final severity score.
2.4Performance comparison between AI and radiologists
To compare AI’s performance with that of radiologists, the data were anonymized and independently scored by (A) four junior radiologists with 1–3 years of experience, (B) AI scoring system (This system identified lesions and calculated the severity score automatically), (C) human-AI segmentation system (Four junior radiologists scored the images with the assistance of the AI segmentation system), and (D) human-AI scoring system (Four junior radiologists scored images with the help of the AI scoring system). Scores from these four methods were compared with (E) the reference score, which was the averaged score of those made by two experienced radiologists with 15–20 years independently.
2.5Statistical analysis
The mean absolute error (MAE) of infection scores achieved by methods A–E were calculated separately. Wilcoxon test was used to assess methods A–E for determining clinical severity. Spearman correlation analysis was applied to assess the clinical severity and each score. ROC curves analysis was applied to evaluate the performance of different infection scores. Statistical analyses were conducted with R software, version 3.5.1.
3.Results
Eighty-one patients with confirmed COVID-19 were included in this study: 47 (58%) males and 34 (42%) females, 20 (25%) with severe and 61 (75%) with common COVID-19. Their mean age was 45.37
Five-fold cross-validation was performed for AI assessment. The data of all cases were combined. The average scores of two experienced radiologists with more than 15 years’ experience were set as reference scores. The annotation proceeded in a double-blind manner. Then, we conducted four rounds of assessment for the data of the same case.
Table 1
Mean absolute error between experimental groups and controls
| Experimental group | Control group | Mean absolute error (MAE) |
|---|---|---|
| A (Junior) | Reference score | 2.51 |
| B (AI) | Reference score | 2.21 |
| C (Human-AI segmentation system) | Reference score | 2.04 |
| D (Human-AI scoring system) | Reference score | 1.67 |
| Radiologist1 | Radiologist 2 | 2.11 |
First, the data were scored by junior radiologists individually (method A) and AI scoring system (method B). We showed the MAEs of methods A and B according to reference score (Table 1):
The AI scoring systems (methods B, C, and D) achieved scores close to reference score and lower MAEs (
Figure 3.
Error accumulation curves of different experimental groups. The horizontal axis shows the absolute error and the vertical axis the proportion of samples with greater absolute error than
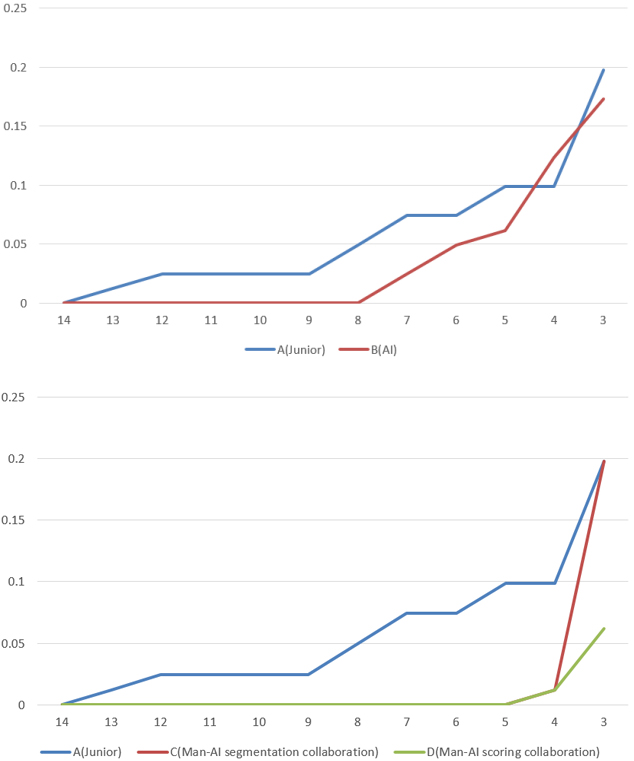
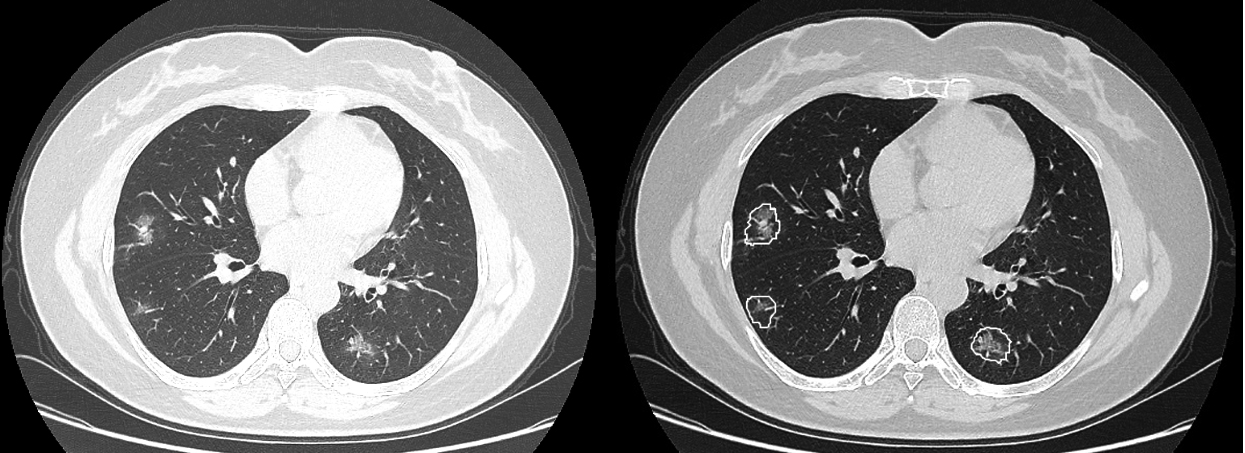
Figure 4.
A woman aged 47 years presented with a 7-day history of fever, cough, and sputum. CT imaging revealed scattered pure ground glass opacities (GGOs) and GGOs with fine grid in the bilateral lobes. Some small GGOs were missed by junior radiologists but were detected by the AI scoring system (b).
However, the diagnostic performance of AI scoring system was inferior to that of senior radiologists, suggesting that the AI scoring system’s result could not be regarded as the final diagnosis. Thus, we explored the performance of human-AI. Two modes of human-AI systems were established.
The first was human-AI segmentation system, a human-made scoring system assisted by AI segmentation for COVID-19 infection regions. With this method, both MAEs (Table 1) and the error accumulation curves (Fig. 3) were improved. The second mode was human-AI scoring system, which integrated the human-made and AI-made scores. We observed that the MAE between the two senior radiologists’ results was approximately 2, so we considered 2 as the subjective error. As shown in Fig. 3, after the subjective error was excluded, the two human-AI systems had performance comparable to that of senior radiologists.
The Wilcoxon test was used to assess the significance of the reference score for determining clinical severity. Methods A–E all showed significant diagnostic differences (
Figure 5.
Scatterplot show the five scores’ distributions in terms of patients’ COVID-19 severity.
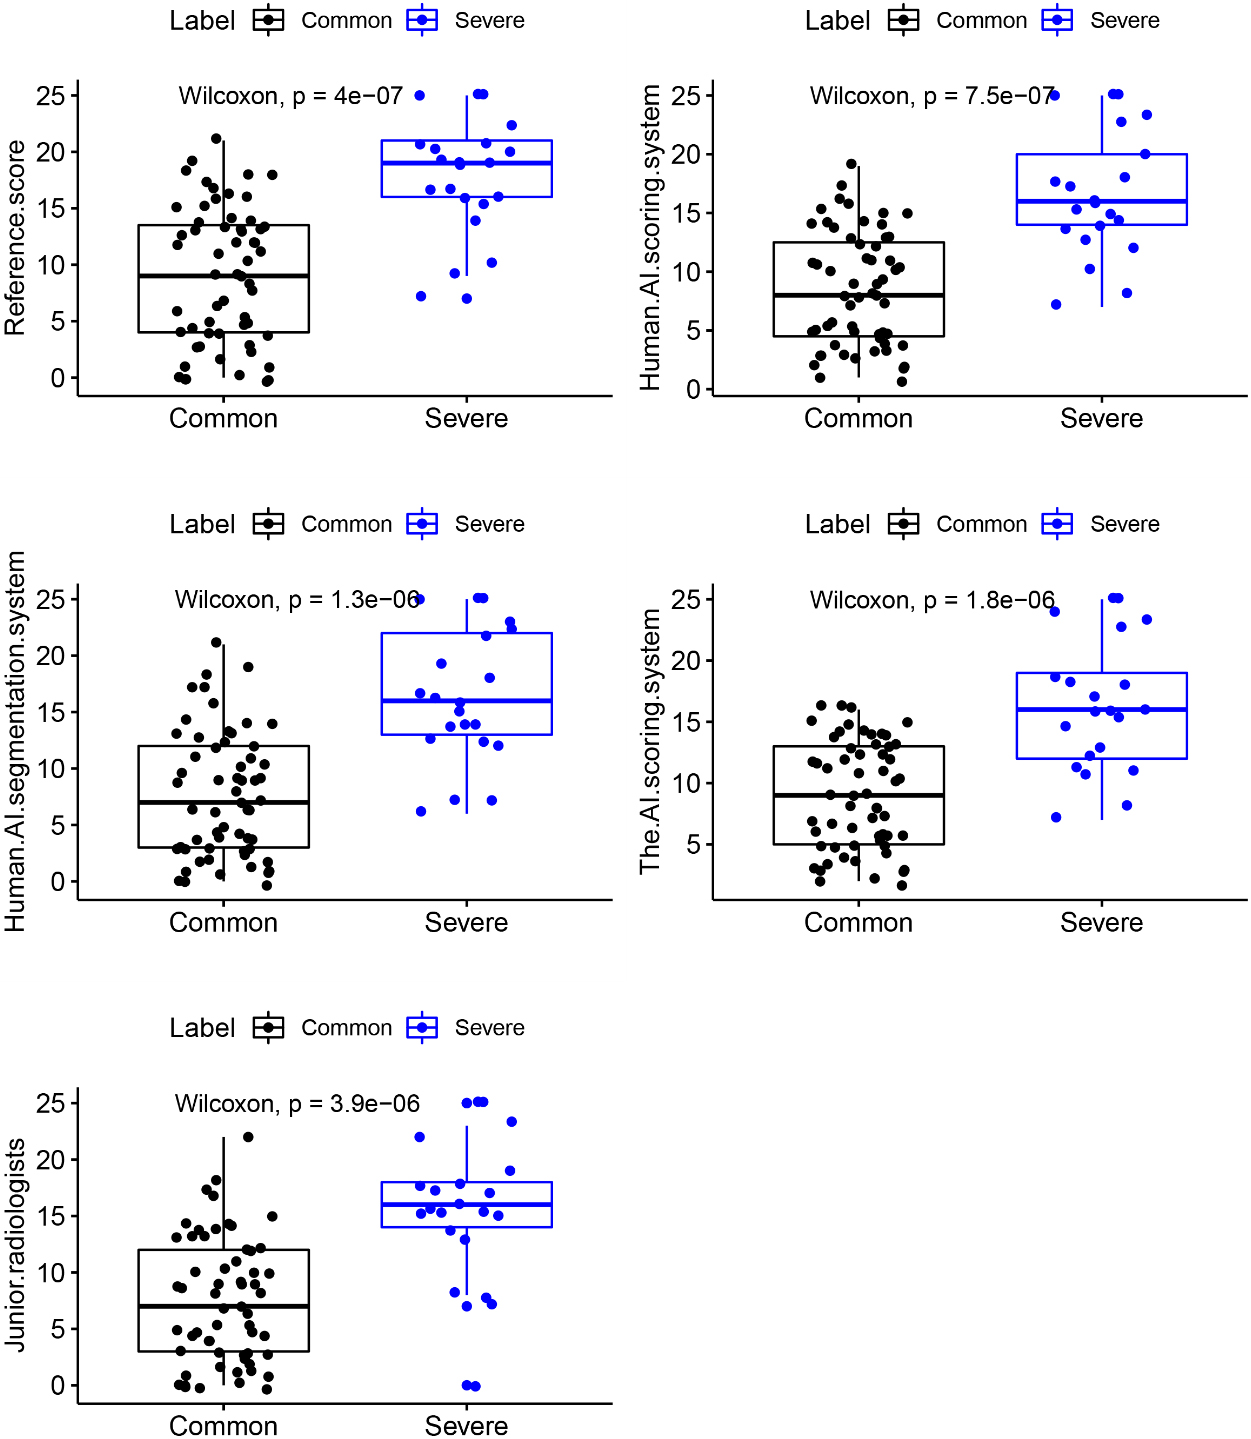
Figure 6.
Correlations between scores and clinical severity of COVID-19. Deeper colors represent stronger correlations between factors. (A: Junior radiologists; B: The AI scoring system; C: Human-AI segmentation system; D: Human-AI scoring system; E: Reference score.)
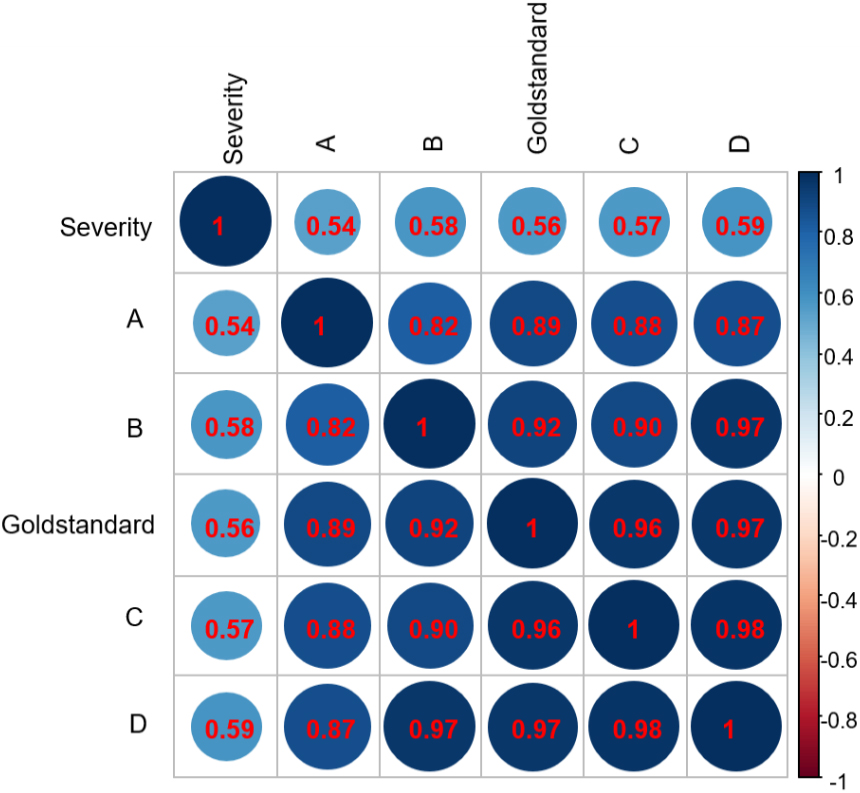
Figure 7.
ROC curves of these different scores to assess the severity of COVID-19.
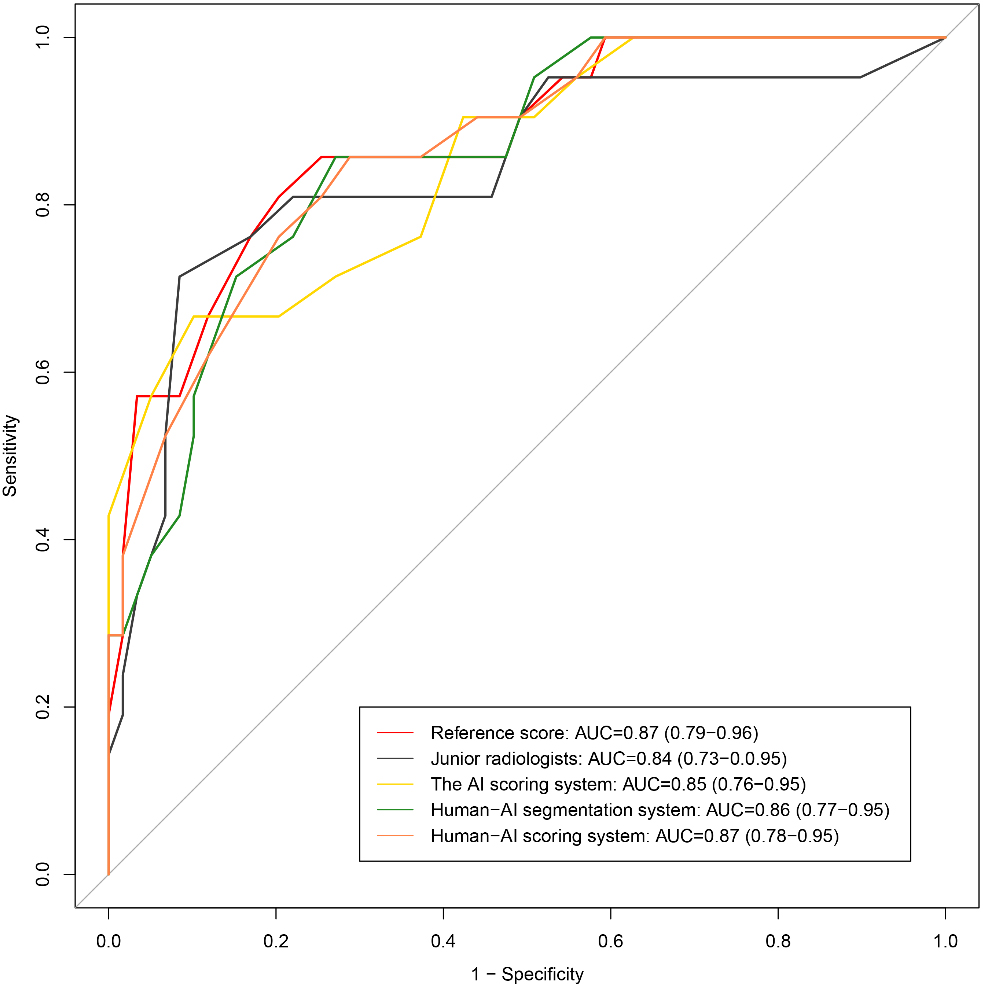
As shown in Fig. 7, all the methods showed good performances, with AUCs
4.Discussion
In this study, we described an AI-assisted method for assessing disease severity. To our knowledge, the AI-based scoring system has not yet been applied to assess the severity of COVID-19. Our AI-assisted CT scoring system comprised a coarse-to-fine infection region segmentation module and a severity scoring module. To compare the performance of AI system and radiologists, the imaging data of 81 COVID-19 cases were anonymized and scored using four methods. Method A (junior radiologists) exhibited the highest MAE, but this MAE dropped with the help of the AI system. Method D (human-AI scoring system) demonstrated the lowest MAE. Spearman correlation analysis showed that the score achieved by method D had the strongest correlation with reference score (
The reverse transcription-polymerase chain reaction (RT-PCR) test serves as the gold standard of confirming COVID-19 [11]. However, medical materials are often insufficient to carry out large-scale RT-PCR assays in countries heavily hit, especially during the early outbreak of COVID-19. The RT-PCR is also restricted for it high false-negative rates due to interferences from sample preparation and quality control [1, 12]. In clinical practice, chest CT plays a critical role in confirming and countering COVID-19 epidemic. However, chest CT image series contain hundreds of slices, the interpretation of which is time-consuming. Furthermore, COVID-19 is a new disease that has similar but non-identical manifestations, compared to other types of pneumonia; therefore, experience is critical for radiologists to make diagnosis. In this light, AI may has its implications. AI has been used in COVID-19 related imaging, lung and infection region segmentation, clinical assessment and diagnosis, and pioneering basic and clinical research. Furthermore, various studies have proposed to implement AI-assisted-CT [13, 14, 15, 16]. However, AI-derived features typically lack interpretability. Hence, our study introduced some conventional features to boost the performance of AI. In this study, an independent multilayer perceptron-based regression model was trained on each lobe’s texture and intensity to optimize the AI score.
This study has several limitations. First, this was a single-center retrospective study, and the sample size was small, especially that of the severe group, which had only 20 cases. Second, clinical context was not modeled into the AI system, but disease diagnosis should be based on both clinical and imaging data. Finally, the current AI system could not identify whether the infection was caused by COVID-19 or other factors, such as bacteria.
5.Conclusion
Conventional CT features are still indispensable for AI-assisted diagnosis. The AI’s performance exceeded that of junior radiologists, and AI-scored values showed moderate correlations with clinical severity and strong correlations with the reference value. The score of the human-AI scoring system had the strongest correlation with clinical severity and the reference score. Thus, the AI system can help radiologists to diagnose COVID-19.
Conflict of interest
None to report.
References
[1] | Sarkodie BD, Mensah YB. CT scan chest findings in symptomatic COVID-19 patients: A reliable alternative for diagnosis. Ghana Med J. (2020) Dec; 54: (4 Suppl): 97–99. |
[2] | Kong B, Wang X, Bai J, Lu Y, Gao F, Cao K, et al. Learning tree-structured representation for 3D coronary artery segmentation. Computerized Medical Imaging and Graphics. (2020) ; 80: : 101688. |
[3] | Kermany DS, Goldbaum M, Cai W, Carolina CS, Liang HY, Sally LB, et al. Identifying medical diagnoses and treatable diseases by image-based deep learning. Cell. 172: (5): 1122–1131. |
[4] | Lakhani P, Sundaram B. Deep learning at chest radiography: Automated classification of pulmonary tuberculosis by using convolutional neural networks. Radiology. (2017) ; 284: (2): 574–582. |
[5] | Andreas MR, Jeffery DR, Xie L, Wang J, Michael TD, Emmanuel JB, et al. Artificial intelligence system approaching neuroradiologist-level differential diagnosis accuracy at brain MRI. Radiology. (2020) ; 00: 1–122. |
[6] | Li L, Qin L, Xu Z, Yin Y, Wang X, Kong B, et al. Artificial Intelligence Distinguishes COVID-19 from Community Acquired Pneumonia on Chest CT. Radiology 2020. 200905. doi: 10.1148/radiol.2020200905. |
[7] | China National Health Commission. Diagnostic and treatment protocol for Novel Coronavirus Pneumonia: Trial version 7. (2020) . Available. |
[8] | Fausto Milletari, Nassir Navab, Seyed-Ahmad Ahmadi. V-Net: Fully Convolutional Neural Networks for Volumetric Medical Image Segmentation. 2016 Fourth International Conference on 3D Vision (3DV). (2016) : pp. 565–571. |
[9] | Ronneberger O, Fischer P, Brox T. U-Net: Convolutional Networks for Biomedical Image Segmentation. Medical Image Computing and Computer-Assisted Intervention – MICCAI. (2015) : 234–241. |
[10] | Pan F, Ye T, Sun P, Gui S, Liang B, Li L, et al. Time course of lung changes on chest CT during recovery from 2019 Novel Coronavirus (COVID-19) pneumonia. Radiology. Published Online: Feb 13 (2020) . |
[11] | Tao Ai, Zhenlu Yang, Hongyan Hou, Chenao Zhan, Chong Chen, Wenzhi Lv, et al. Correlation of Chest CT and RT-PCR Testing in Coronavirus Disease 2019 (COVID-19) in China: A Report of 1014 Cases. Radiology. Published Online: Feb 26 (2020) . |
[12] | Fang Y, Zhang H, Xie J, Lin M, Ying L, Pang P, Ji W. Sensitivity of Chest CT for COVID-19: Comparison to RT-PCR. Radiology 2020. doi: 10.1148/radiol.2020200432. Published February 19, 2020. Accessed February 29, 2020. |
[13] | Cao Y, Xu Z, Feng J, Jin C, Han X, Wu H, et al. Longitudinal assessment of COVID-19 using a deep learning-based quantitative CT pipeline: Illustration of two cases. Radiology: Cardiothoracic Imaging, vol. 2(2). Published Mar 23, (2020) . |
[14] | Huang L, Han R, Ai T, Yu P, Kang H, Tao Q, et al. Serial quantitative chest CT assessment of COVID-19: Deep-Learning Approach. Radiology: Cardiothoracic Imaging, vol. 2, Published April 6, (2020) . |
[15] | Shen C, Yu N, Cai S, Zhou J, Sheng J, Liu K, et al. Quantitative computed tomography analysis for stratifying the severity of Coronavirus Disease 2019. Journal of Pharmaceutical Analysis. (2020) . |
[16] | Wang S, Kang B, Ma J, Zeng X, Xiao M, Guo J, et al. A deep learning algorithm using CT images to screen for Corona Virus Disease (COVID-19). MedRxiv, (2020) . |


