
Quantitative measures of postural tremor at the upper limb joints in patients with essential tremor
Abstract
BACKGROUND:
It is important to quantitatively assess tremor for accurate diagnosis and evaluation of the response to interventions in patients with essential tremor (ET).
OBJECTIVE:
The purpose of this study was to investigate the relationship between quantitative measures of postural tremor and clinical rating scale in patients with ET.
METHODS:
18 ET patients performed a postural tremor task that required them to hold their arms outstretched parallel to the floor while wearing a gyro sensor based measurement system. The time domain variables were derived from the sensor signals. Additionally, the frequency domain variables were derived from the power spectrum of the angular velocity signal. Spearman correlation analysis was employed in the relationship between the variables and clinical score.
RESULTS:
The RMS angular velocity of roll and yaw directions at the hand joint were strongly correlated with the clinical rating scale (
CONCLUSION:
These results indicate that hand tremor of roll and yaw directions are more associated with assessment of severity of ET compared to other joints. This study suggests that quantitative measurements of postural tremor should be considered as tremor directionality as well as attachment location.
1.Introduction
Essential tremor (ET), characterized by postural and kinetic tremor, is one of the most frequent movement disorder and involuntary oscillatory movement of a body part [1]. In the USA, 2.2% of the general population suffer from ET, and the prevalence is increasing with age [2]. ET affects the activities of daily living (ADL) and deteriorates the quality of life because it can typically appear when holding the hands outstretched, holding a cup and spoon, and writing [3, 4]. Furthermore, it affects the mental components of quality of life, especially when the symptoms occur in public [3, 4].
Fahn-Tolosa-Marin (FTM) tremor rating scale, which rates tremor severity from 0 (none) to 4 (severe) by body part, is the most widely used rating tool for the evaluation of disease severity in patients with ET [5]. However, this rating scale relies upon a rater’s subjective evaluation based on their clinical experience and suffers from the discrimination of sensitive changes. That is, it has a number of limitations, which include poor inter- and intra-rater variability. Actually, it was previously reported that the FTM tremor rating scale had undergone limited validation [6]. Therefore, more quantitative and objective systems for evaluation of tremor would be helpful in accurate diagnosis and in evaluating the response to interventions, e.g., medications and surgeries.
Many studies have been tried to feasibility of the quantification of tremor by using electromyography (EMG) [7], electromagnetic tracking devices [8], three-axial accelerometers [9] and optical systems [10]. However, these systems have some limitations as follows: EMG has uncomfortable wearing, such a system has limited usability in clinical applications [11]. Accelerometers can suffer from gravitational artifact [12]. Moreover, electromagnetic devices are influenced by experimental environments because they are sensitive to electric or magnetic fields [13]. The optical systems have limitations that used only a distal finger joint and only in two directions.
Actual tremor is rotational movement in nature and a gyro sensor measure of angular movements in terms of angular velocity. Furthermore, the gyro sensor is free from gravitational artifact and magnetic fields, so that it is expected to improve some limitations of the above devices. That is, the gyro sensor was shown to be helpful for the evaluation of tremor patterns. Actually, it has been reported that the gyro sensor based system was used to quantify upper limb bradykinesia [14, 15, 16] as well as lower limb bradykinesia [17] in patients with Parkinson’s disease (PD). Moreover, quantitative evaluation of motor function in patients with mild-to-moderate carpal tunnel syndrome was investigated using the gyro sensor [18].
Postural tremor is one of the clinical features of ET. Specifically, ET is most troublesome when a body part is held straight out from the body in a stable position against gravity. Even though many studies have investigated the quantification of postural tremor, few have attempted to investigate the quantitative measures of tremor considering various joints of the upper limb and various directions. Therefore, this study quantitatively measured the postural tremor pattern of the fingers, hands and arms during out-stretched posture of the hands using multi-axis gyro sensors.
2.Methods
2.1Subjects
Eighteen patients with ET (8 men, 10 women; age, 50–78 years; FTM score, 0
Table 1
Clinical profile of the patients
| Gender | Age [Years] | FTM score | Duration [Years] | Family history | |
|---|---|---|---|---|---|
| Subject 1 | W | 62 | 2 | 7 | Y |
| Subject 2 | W | 74 | 1 | 3 | N |
| Subject 3 | W | 56 | 2 | 7 | N |
| Subject 4 | M | 71 | 2 | 13 | Y |
| Subject 5 | M | 68 | 0 | 2 | Y |
| Subject 6 | W | 74 | 1 | 12 | N |
| Subject 7 | W | 70 | 1 | 50 | Y |
| Subject 8 | W | 76 | 2 | 30 | Y |
| Subject 9 | W | 71 | 3 | 9 | Y |
| Subject 10 | W | 71 | 2 | 40 | Y |
| Subject 11 | M | 78 | 2 | 8 | N |
| Subject 12 | W | 58 | 1 | 8 | Y |
| Subject 13 | M | 70 | 2 | 8 | N |
| Subject 14 | M | 72 | 2 | 50 | N |
| Subject 15 | M | 67 | 2 | 50 | Y |
| Subject 16 | M | 78 | 3 | 1 | Y |
| Subject 17 | M | 50 | 2 | 13 | N |
| Subject 18 | W | 73 | 1 | 10 | Y |
Note: M
2.2Experiments and analysis
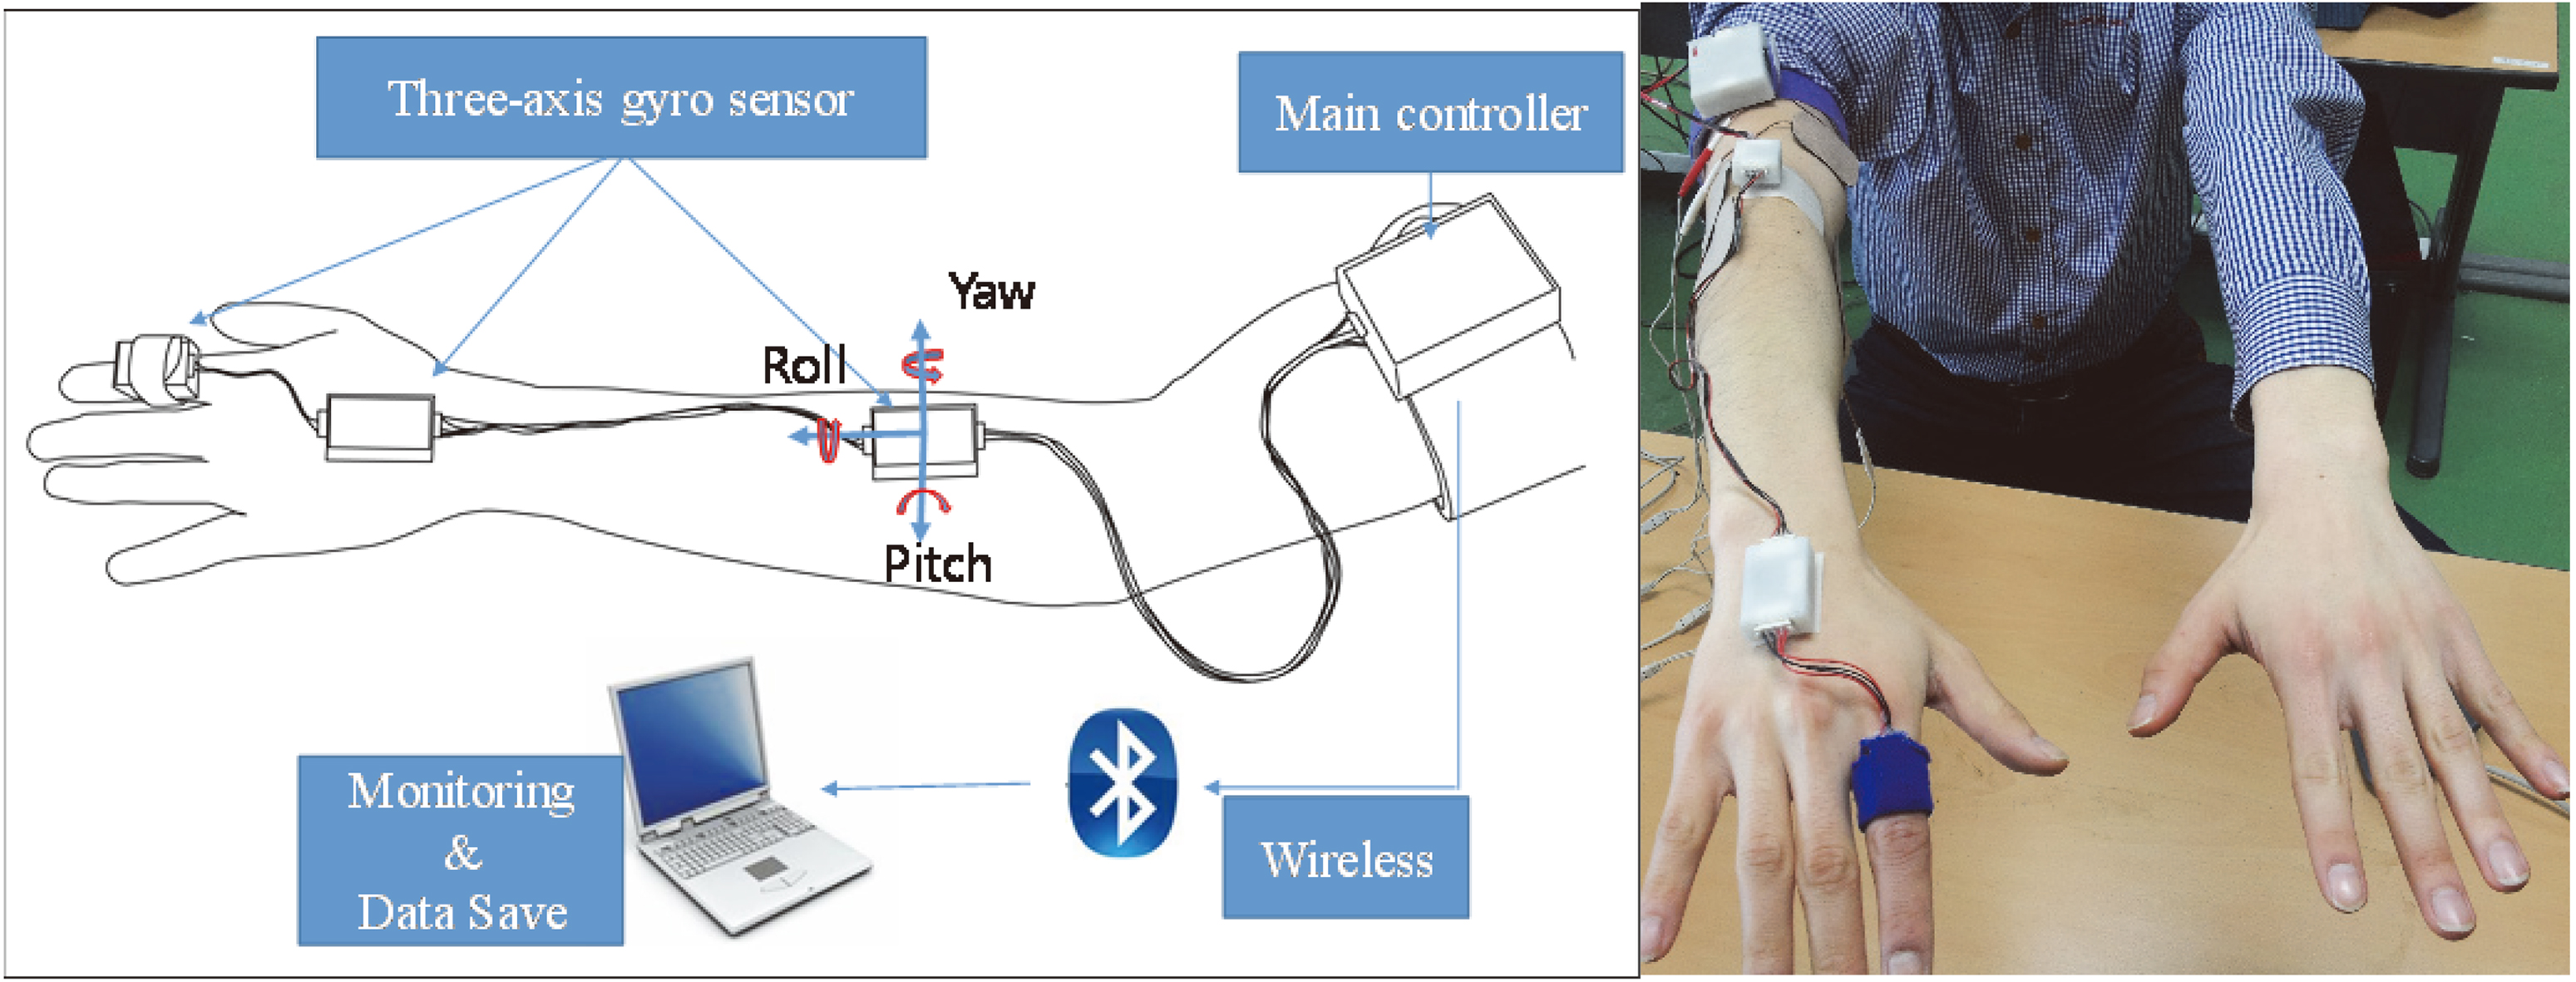
Figure 1 shows the developed wearable system for the measurement of the fingers, hands and forearm tremors. A gyro sensor (L3G4200D, STMicroelectronics, Germany) was attached on the index finger, dorsum of the hand and forearm with the sensing axis aligned to tremor directions (pitch, yaw, roll). The gyro sensor signal was sampled at 100 Hz by a microprocessor (MSP430F5522) and was wirelessly transmitted to the personal computer through a Bluetooth. The sensor data was stored by a self-developed software program using LabVIEW (National Instruments, USA). MATLAB (The Mathworks Inc., USA) was used for calculations of outcome measure. The selection of the measuring site (right or left upper limb) was identified by the patient as being more affected by ET. The postural tremor task was selected as one of the clinical tasks. Postural tremor appears when a patient voluntarily maintains a position against gravity. All the patients performed the task with seated in a chair as shown in Fig. 1. That is, they attempted to maintain the upper limbs outstretched parallel to the floor for 15 seconds. Before the main test, the task was explained in detail to ensure each patient was familiar with it. The main test, which was composed of six trials, was performed for each patient. The average of the six trials was used for subsequent analysis. It has been reported that ET has a frequency between 4 and 12 Hz [20, 21]. Therefore, digital Butterworth filter with a passband of 3–12 Hz was used to eliminate high frequency noises and low frequency drifts in the angular velocity data [22]. Four variables were derived from the angular velocity data of each segment as the outcome measures. Root mean squared (RMS) angular velocity and displacement were calculated from the angular velocity signals as time domain variables. Each variable means the average speed and amplitude of the involuntary movement due to tremor, respectively. The angular displacement was calculated from the numerical integration of the angular velocity. The peak power and frequency were derived from the power spectrum of the angular velocity signal for the frequency domain variables. Each means the intensity of the main tremor component and frequency at which the power spectrum was at its maximum, respectively. FTM tremor rating scores were assessed for comparison with the quantitative variables. As shown in Table 1, the rating was performed only once by a neurologist before quantitative measurement.
Figure 1.
The gyro sensor based wearable device for quantitative measurement of tremors at the fingers, hands and forearm.
For statistical analysis, the relationship between the outcome measure and clinical FTM tremor rating scale was evaluated by the Spearman’s correlation analysis. SPSS version 16 for Windows (SPSS Inc., Chicago, IL, USA) was used to perform for all statistical analyses. The level of significance was defined as
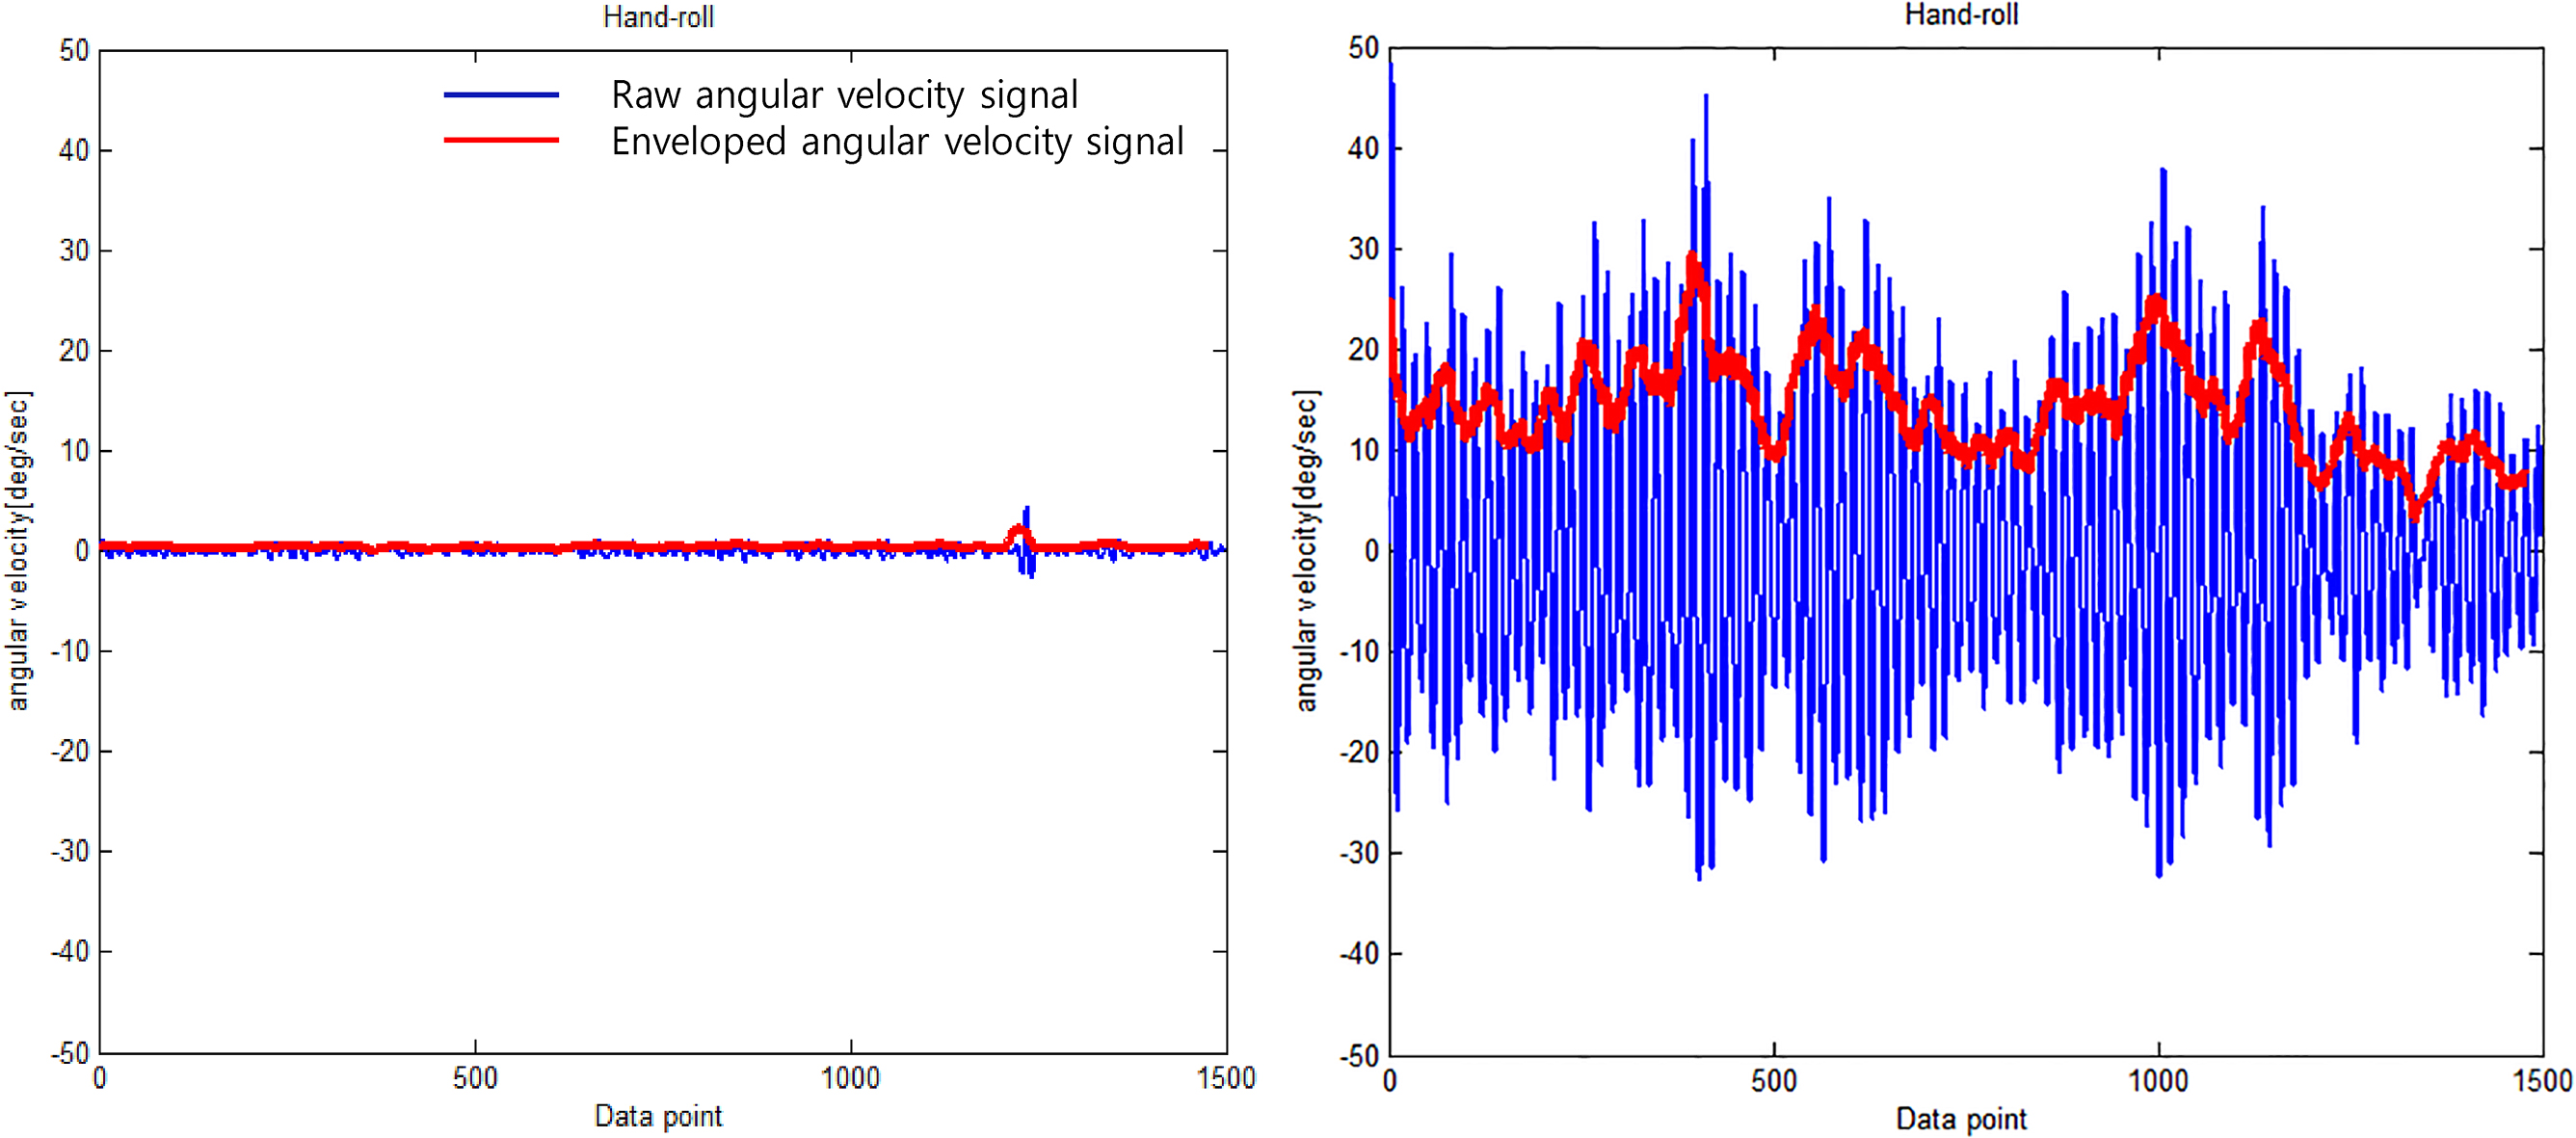
Figure 2.
Typical angular velocity signal of the roll direction in patients with mild tremor (left) and severe tremor (right).
3.Results
Figure 2 shows a representation of the angular velocity signal used in comparing patients with mild tremor and those with severe tremor. The patients with severe tremor showed faster oscillating angular velocity compared to those with mild tremor (severe tremor: 15.2 deg/sec, mild tremor: 0.5 deg/sec). Similarly, Fig. 3 shows representative power spectrum of the angular velocity signal. The peak power of patients with severe tremor was markedly greater than that of patients with mild tremor (severe tremor: 62150 deg/sec2/Hz, mild tremor: 14 deg/sec2/Hz). Peak frequency was similar between the patients (severe tremor: 6.2 Hz, mild tremor: 6.5 Hz). Figure 4 shows the representative relationship between the RMS angular velocity and FTM tremor rating scale in the roll direction of the hand tremor. RMS angular velocity by hand tremor increased with severity score.
Table 2
Results of correlation coefficients between time domain variables and clinical scores
| Outcome measures | Segment | Direction | Correlation coefficient | Significance |
|---|---|---|---|---|
| RMS angular velocity | Finger | Roll | 0.57 | * |
| Pitch | 0.59 | * | ||
| Yaw | 0.41 | |||
| Hand | Roll | 0.70 | ** | |
| Pitch | 0.54 | * | ||
| Yaw | 0.70 | ** | ||
| Forearm | Roll | 0.65 | ** | |
| Pitch | 0.48 | * | ||
| Yaw | 0.57 | * | ||
| RMS angular displacement | Finger | Roll | 0.60 | ** |
| Pitch | 0.65 | ** | ||
| Yaw | 0.42 | |||
| Hand | Roll | 0.66 | ** | |
| Pitch | 0.39 | |||
| Yaw | 0.42 | |||
| Forearm | Roll | 0.29 | ||
| Pitch | 0.56 | * | ||
| Yaw | 0.58 | * |
Figure 3.
Typical power spectrum of angular velocity signal in patients with mild tremor (left) and severe tremor (right).
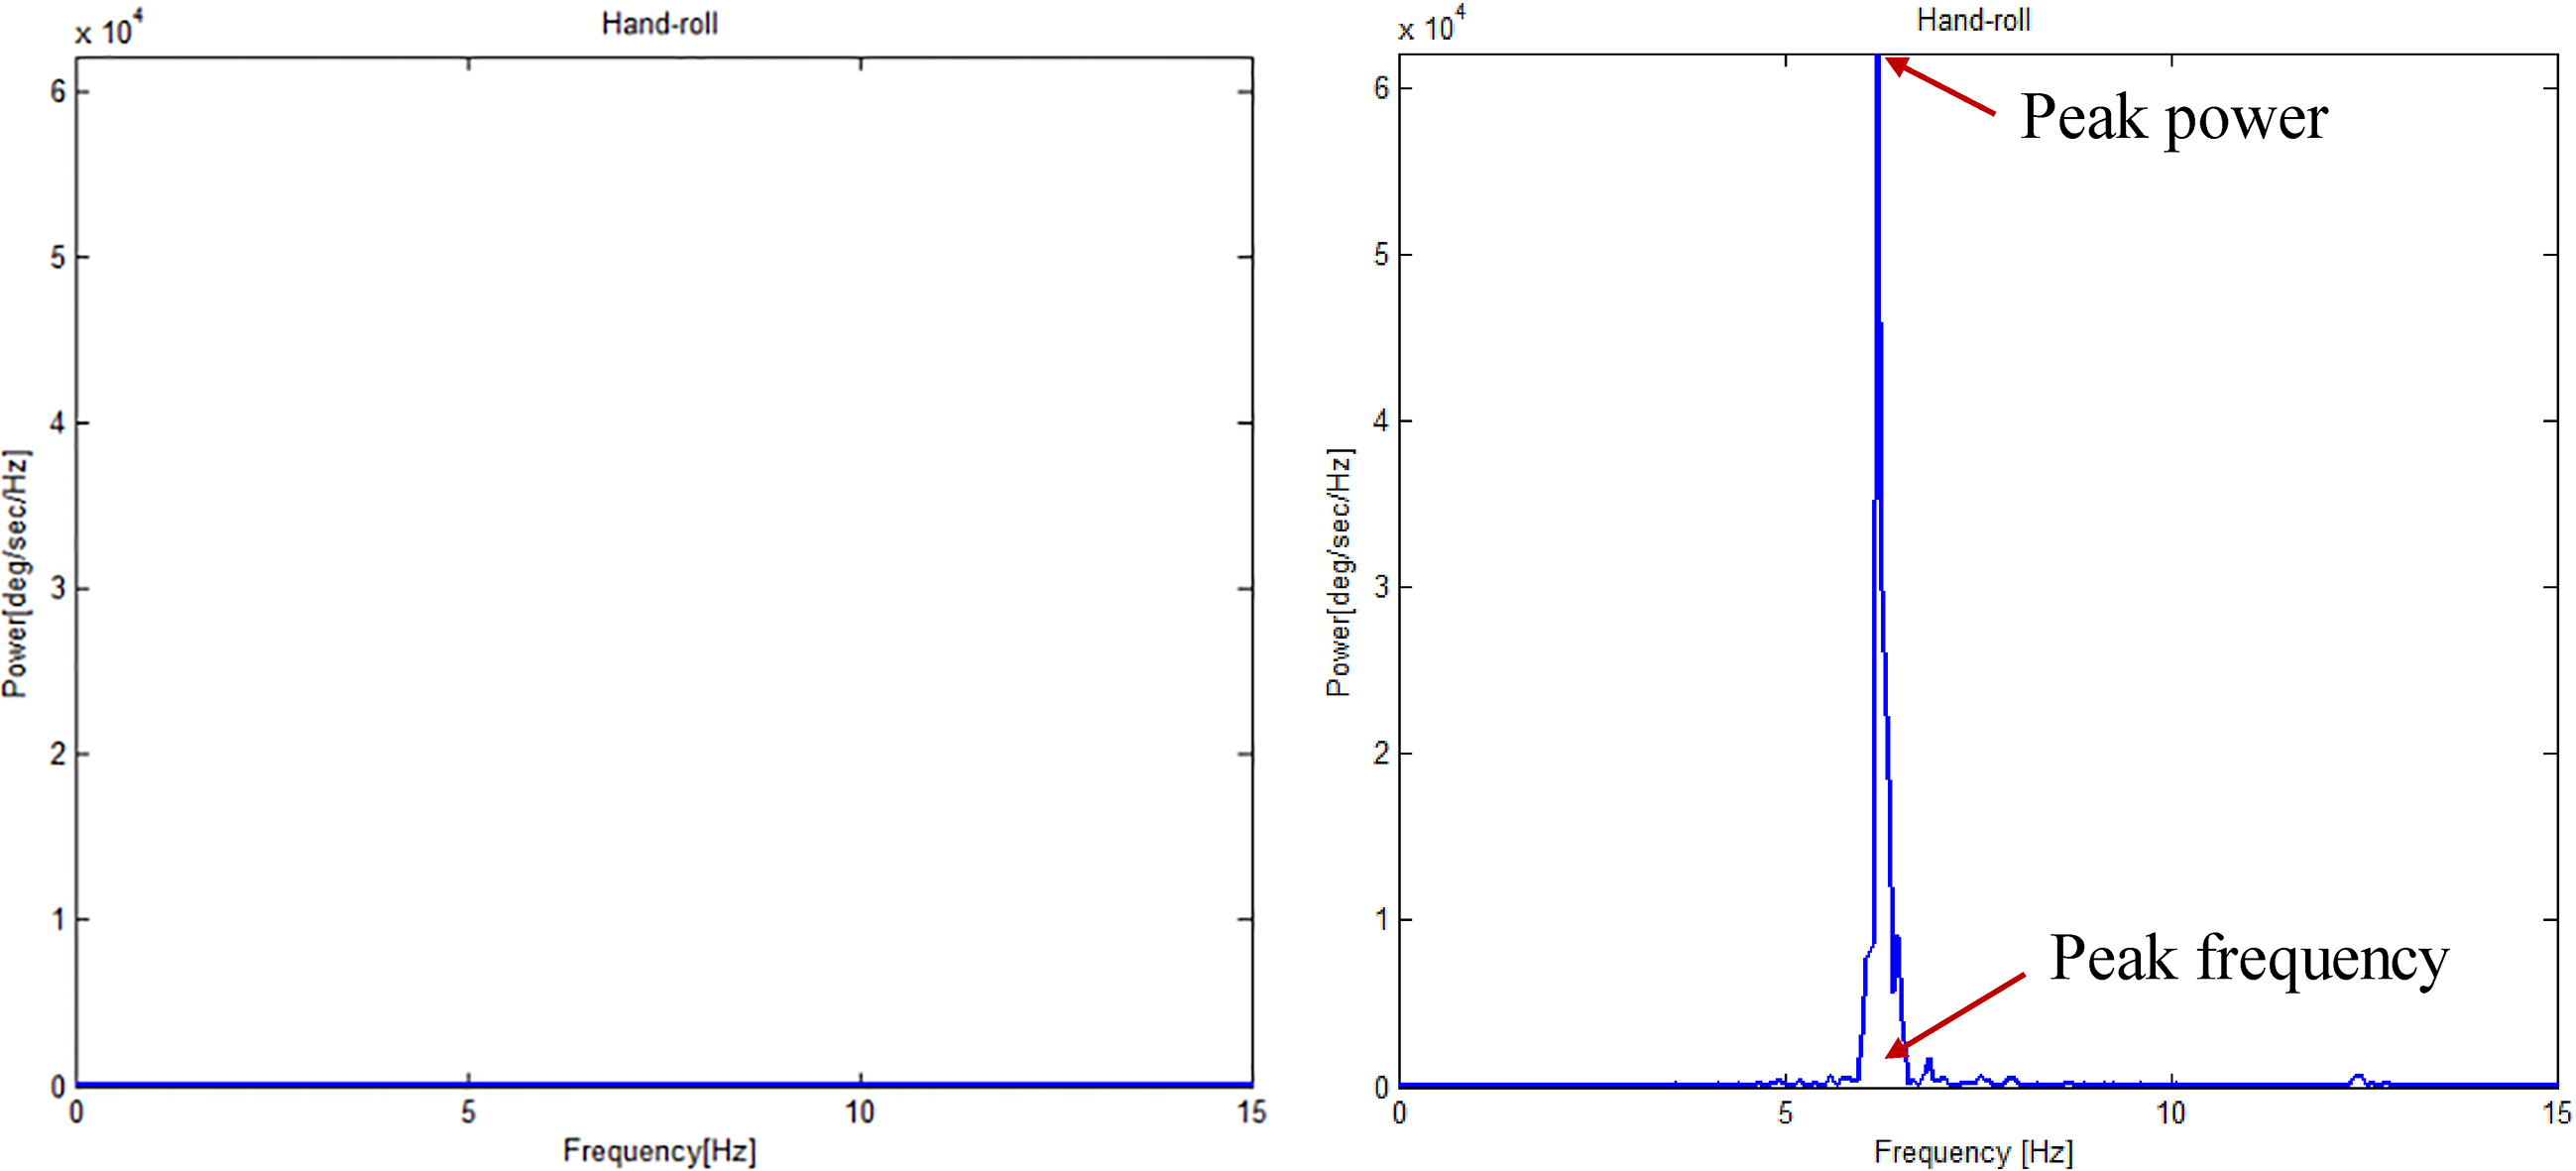
Table 2 shows the results for the relationship between the time domain variables and FTM tremor rating scale. The RMS angular velocity was significantly correlated with all the joints except the yaw direction of the finger joint (
Table 3
Results of correlation coefficients between frequency domain variables and clinical scores
| Outcome measures | Segment | Direction | Correlation coefficient | Significance |
|---|---|---|---|---|
| Peak frequency | Finger | Roll | 0.28 | |
| Pitch | ||||
| Yaw | 0.25 | |||
| Hand | Roll | 0.07 | ||
| Pitch | ||||
| Yaw | 0.24 | |||
| Forearm | Roll | 0.19 | ||
| Pitch | 0.29 | |||
| Yaw | ||||
| Peak power | Finger | Roll | 0.54 | * |
| Pitch | 0.55 | * | ||
| Yaw | 0.51 | * | ||
| Hand | Roll | 0.61 | ** | |
| Pitch | 0.49 | * | ||
| Yaw | 0.67 | ** | ||
| Forearm | Roll | 0.60 | ** | |
| Pitch | 0.46 | |||
| Yaw | 0.58 | * |
Figure 4.
The relationship between RMS angular velocity of the roll direction at hand and clinical severity score.
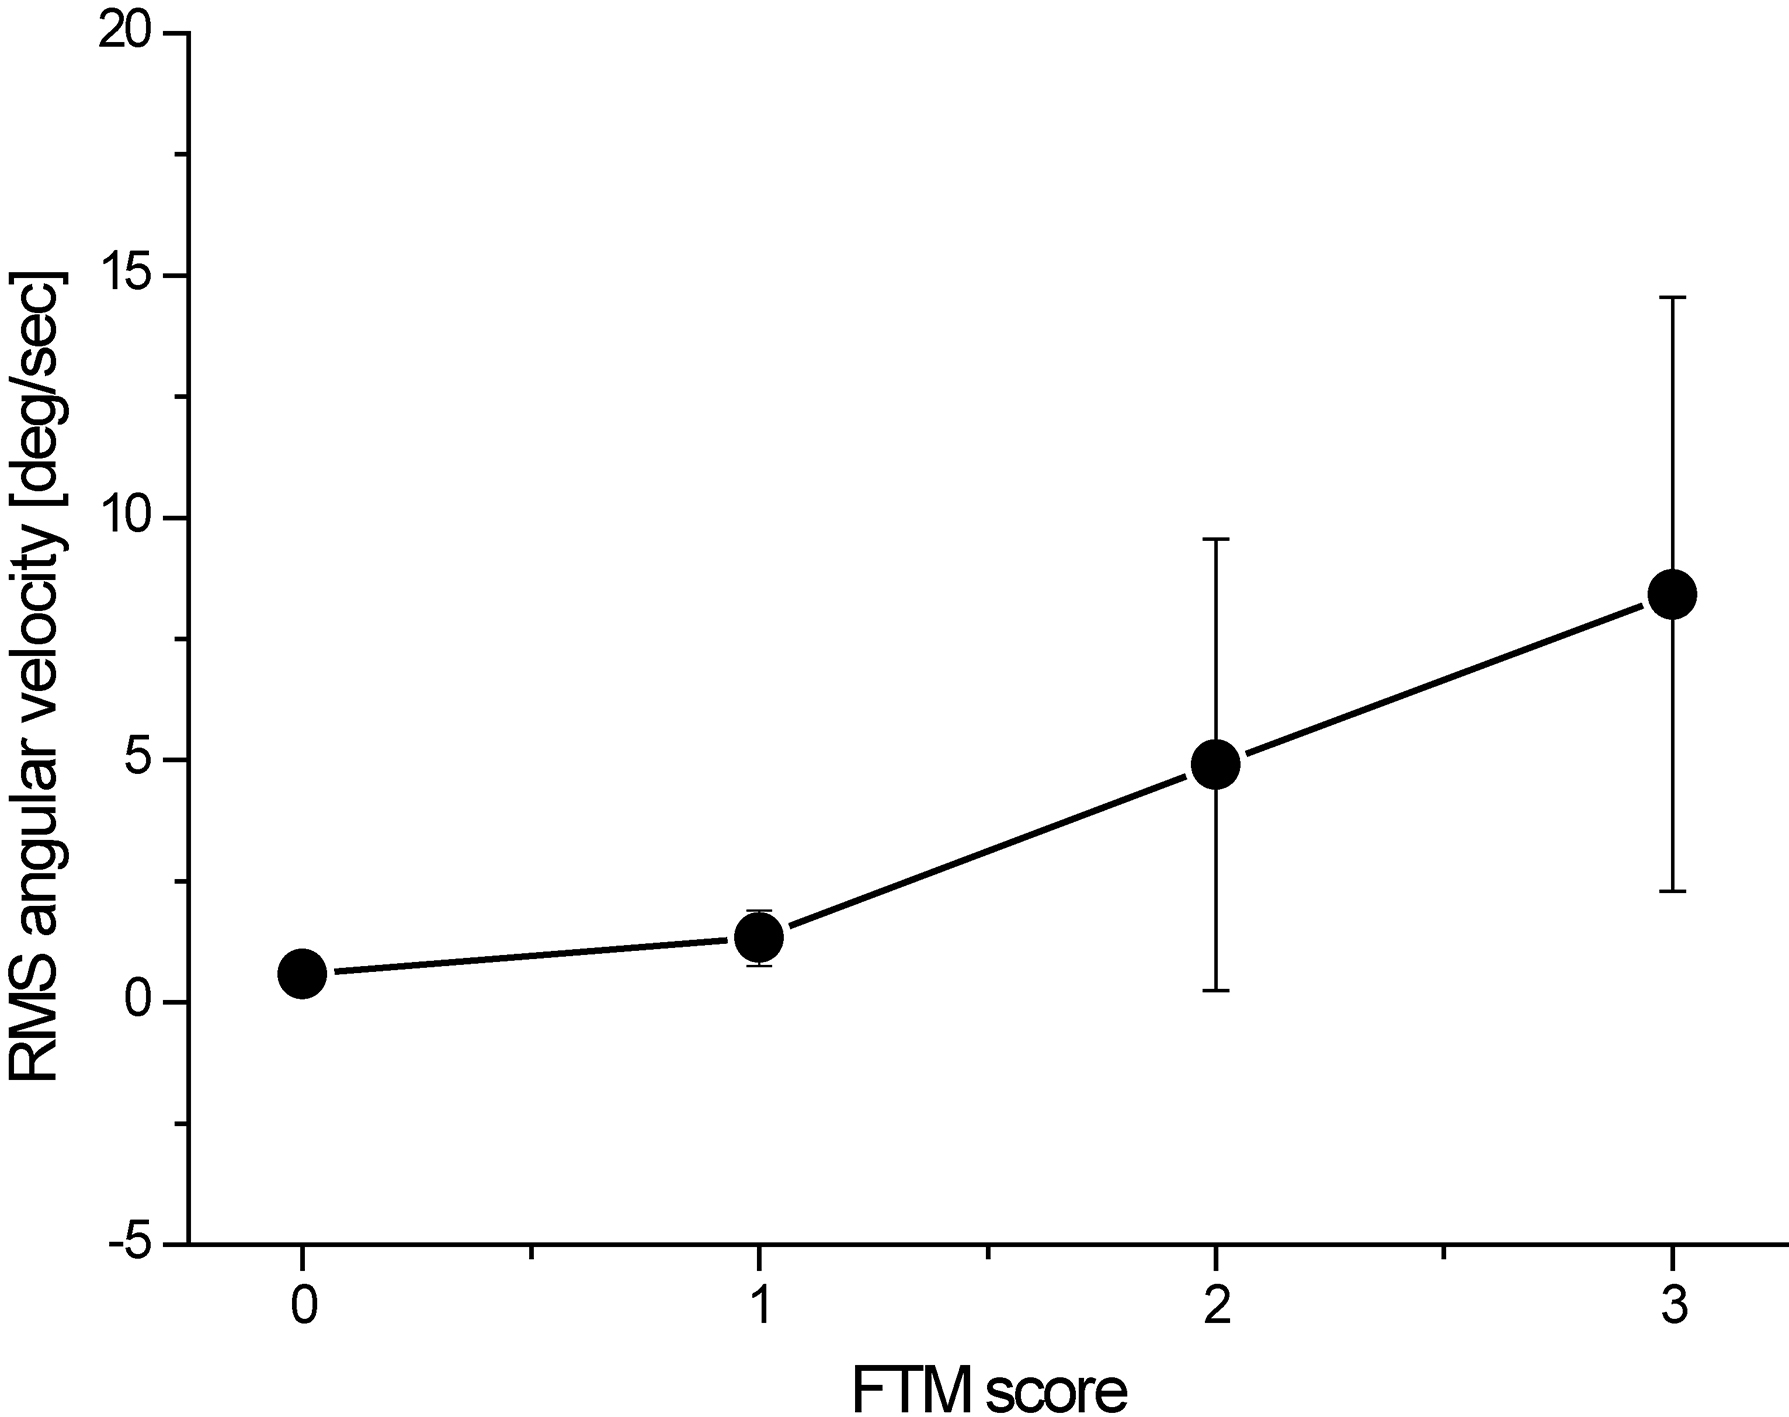
Figure 5.
The comparison of correlation coefficients in time domain variables (
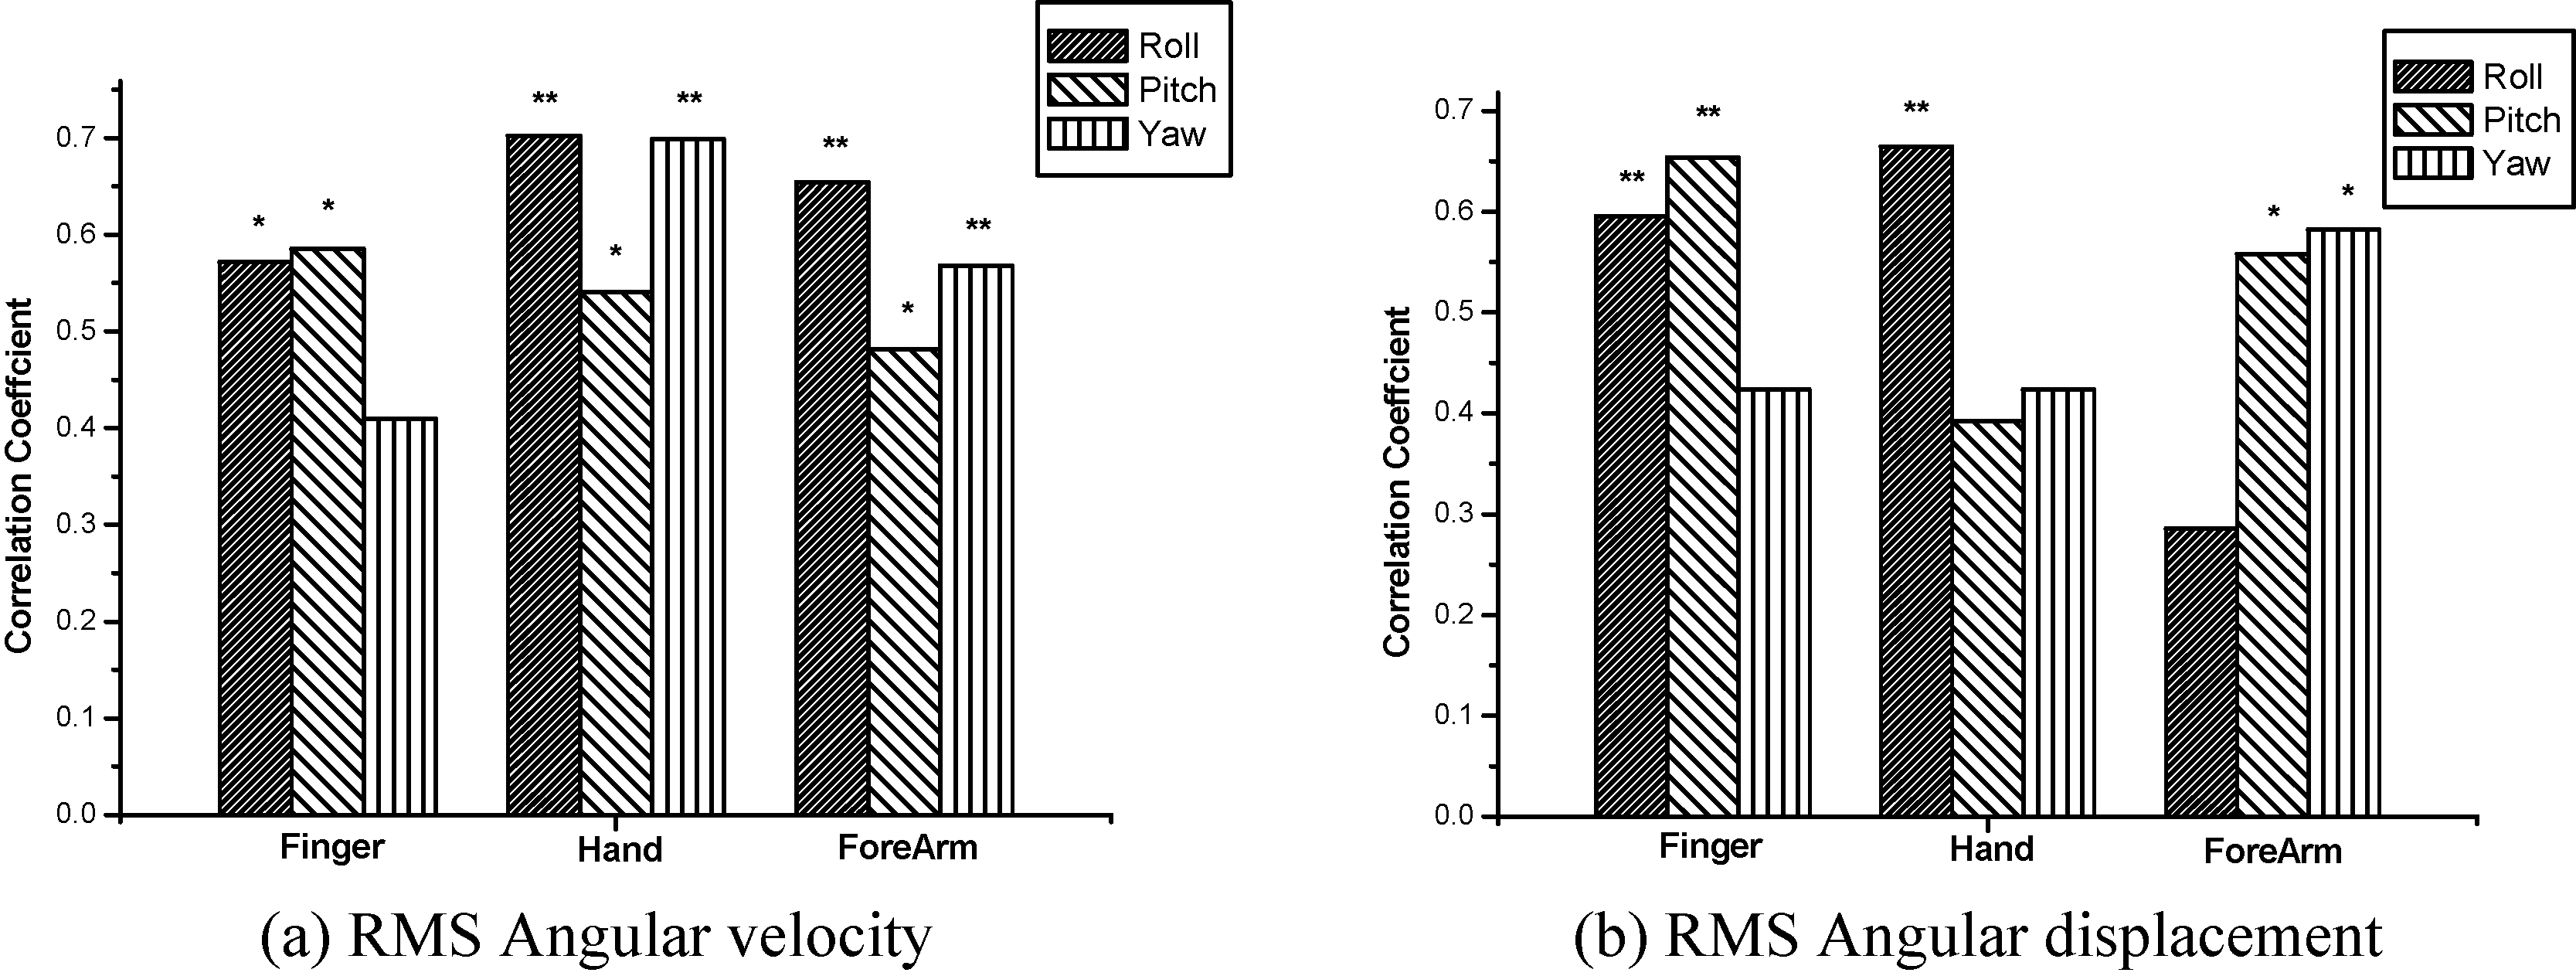
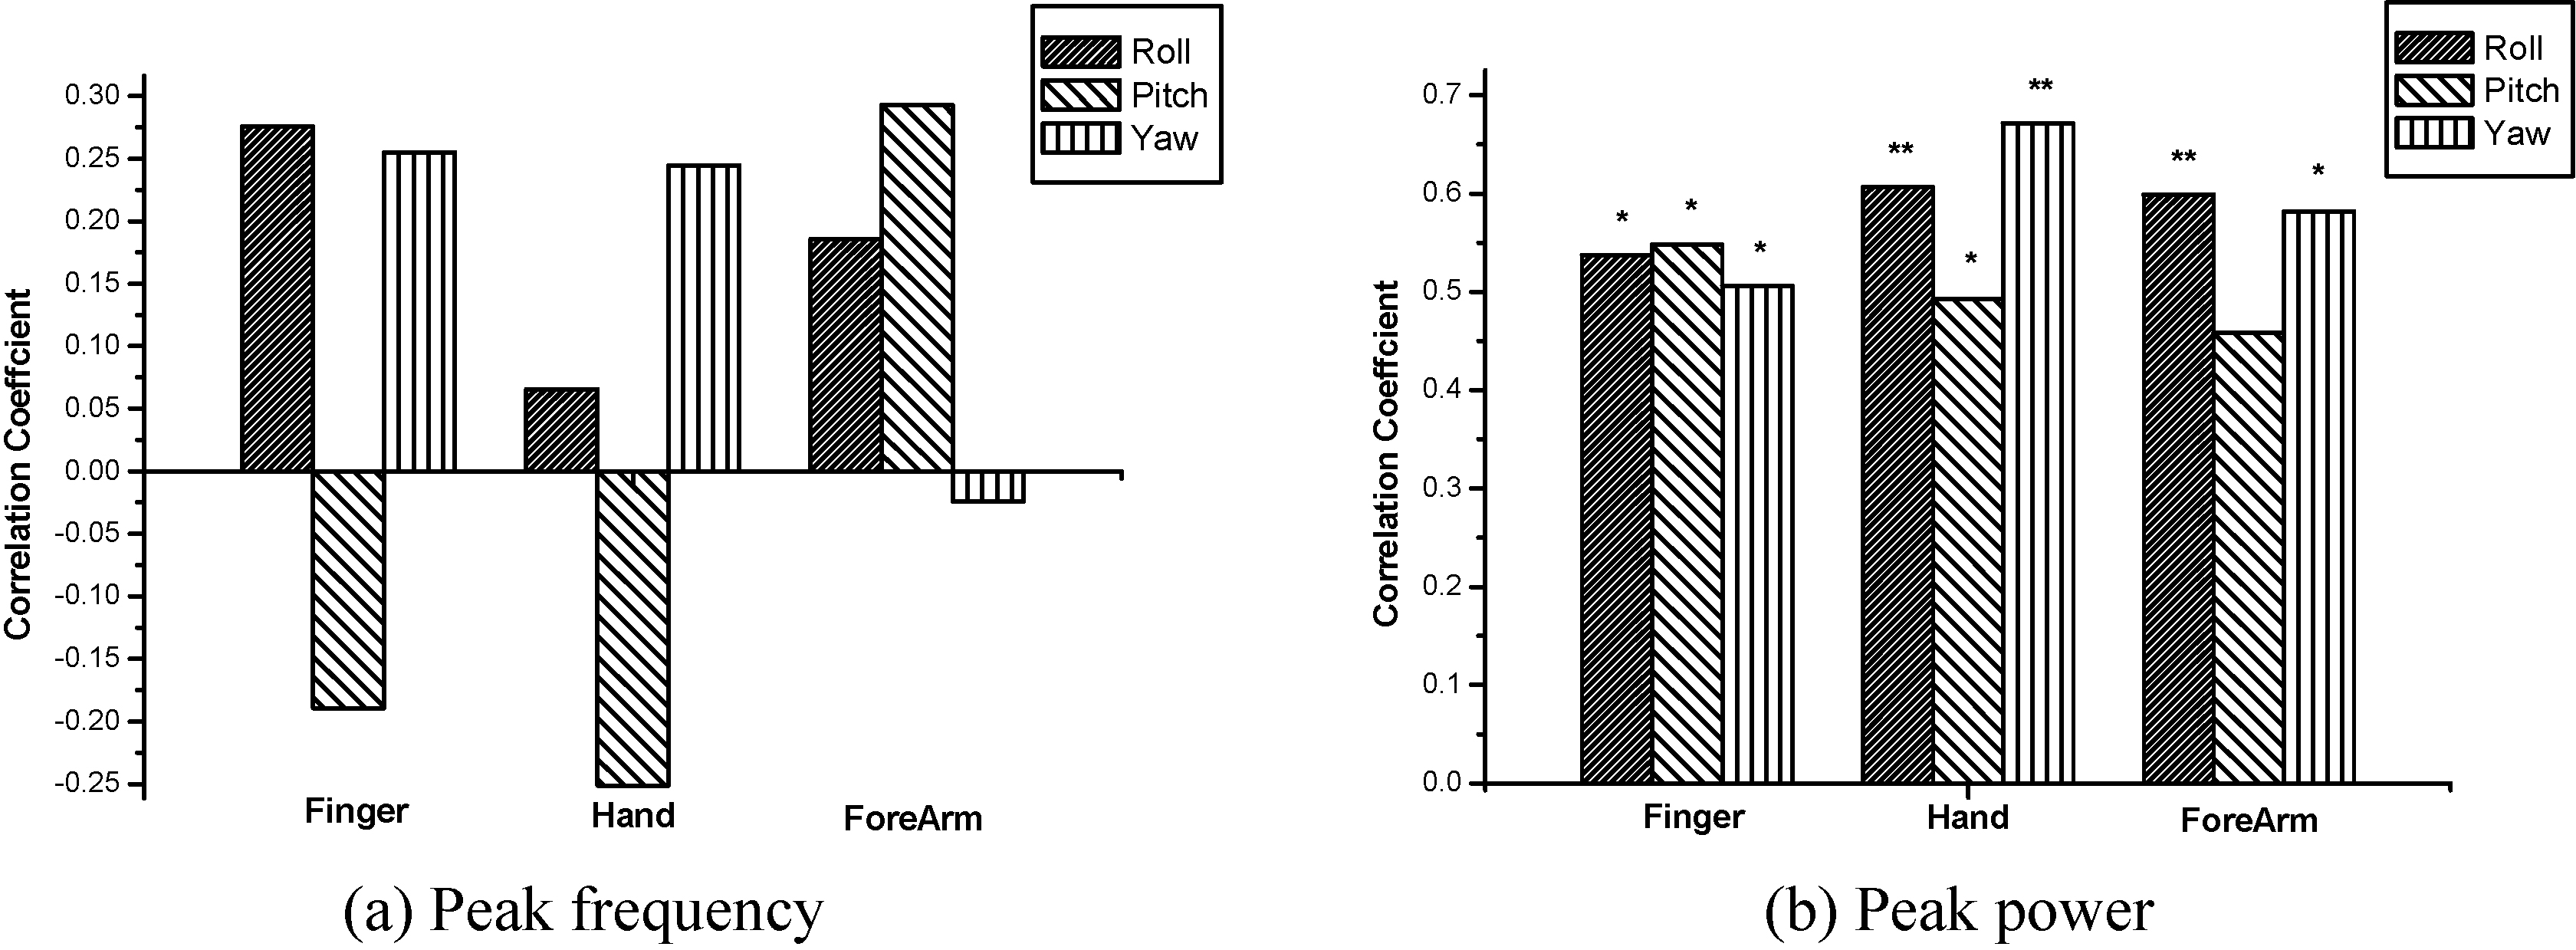
Table 3 shows the correlation coefficient between the frequency domain variables and FTM scores. The peak power was significantly correlated with all the joints except the pitch direction of the forearm joint (
Figure 6.
The comparison of correlation coefficients in the frequency domain variables (
4.Discussion
ET has been evaluated by clinical assessments tools, such as FTM tremor rating scale [5]. However, the assessment tool still has a number of limitations, such as subjectiveness and poor validation [6]. It is important to objectively and quantitatively assess the severity of disease, prognosis, surgery and medication effects for efficient interventions of ET patients. In this study, postural tremor patterns of the fingers, hands and forearms during holding arm outstretched were quantitatively measured in patients with ET by using three axial gyro sensors. The relationships between outcome variables and FTM tremor rating scale were investigated in each direction and at each joint. The main findings from the study indicated that the correlation of the outcome measures with clinical severity scores differed with the joints and tremor directions. Specifically, the RMS angular velocity and peak power of hand tremors showed better correlation coefficients in comparison with other joints. The RMS angular velocity of the roll and yaw directions, especially, could reflect well the severity of ET. On the other hand, the peak frequency could not reflect the severity of ET.
The gyro sensor has been used to quantitatively analyze the clinical features for patients with movement disorders because it can measure angular movements and is free from gravity artifact. Indeed, many studies have attempted quantitative analysis of bradykinesia by using gyro sensors in PD patients [14, 15, 16, 17] and scans without evidence of dopaminergic deficit (SWEDD) [15]. Although Parkinson’s tremor has been investigated by using the gyro sensor [23, 24], quantitative measures of ET have still been required because of the difference of clinical features between ET and Parkinson’s tremors. Particularly, this study considered the directionality as well as attachment location in patients with ET.
In time domain variables, significant positive correlations between the RMS angular velocity and FTM tremor rating scale indicate that the average velocity of the upper limb tremor during arm outstretch tasks are associated with clinical score ratings. Strong correlation coefficients were especially observed in the roll (
On the other hand, the peak frequency had very weak correlation with the FTM tremor rating scale, and there was no significance of the correlation coefficient in all the directions and joints. The peak frequency has been often used in the classification of the underlying pathology, e.g., ET, Parkinson’s tremors and dystonic tremors [26, 27]. The peak frequency of our study was in the range of 4.20 Hz to 9.26 Hz and was consistent with the literatures that ET have a frequency between 4 and 12 Hz [20, 21]. However, the peak frequency was not associated with the severity of ET.
The limitations of this study are as follows: (1) A small population of patients and only one neurologist participated in this study. Thus, distributions of the FTM rating scores were not uniformed. Specifically, patients with score two were converged on our study compared to patients with other scores. Additional verification on a larger population of patients as well as many neurologists should be investigated as in a further study. (2) We focused on the basic symptomatology of only ET patients. Quantitative analysis of various tremor types, i.e., Parkinson’s tremor and dystonic tremor, would suggest good informative insights. (3) This study focused on only postural tremor task. Many patients suffer from action tremor when holding a cup and spoon, and writing. Therefore, the suggestion of this study needs to be additionally verified in terms of action tremor during activity of daily living.
5.Conclusions
In conclusion, the relationship between quantitative measures and clinical severity scores differed with the attachment locations and tremor directions. This study demonstrated that (1) RMS angular velocity as well as the peak power of hand tremor was significantly correlated with the severity score. (2) In the hand tremor, the average speed of the roll and yaw directions reflected well the severity scores. (3) The peak frequency only described the underlying pathology and could not reflect the severity of disease. These results contribute to more quantitative and objective evaluation in patients with ET for effective treatments.
Acknowledgments
This research was partly supported by the Technology development Program of MSS (no. S2588829) and the National Research Foundation of Korea (NRF) funded by the Ministry of Education (no. 2018R1C1B6008083).
Conflict of interest
None to report.
References
[1] | Deuschl G, Bain P, Brin M. Consensus statement of the movement disorder society on tremor. Ad Hoc Scientific Committee. Mov Disord. (1998) ; 13: (Suppl 3): 2-23. |
[2] | Louis ED, Ottman R. How many people in the USA have essential tremor? Deriving a population estimate based on epidemiological data. Tremor Other Hyperkinet Mov (N Y). 4: ; 259. |
[3] | Lorenz D, Schwieger D, Moises H, Deuschl G. Quality of life and personality in essential tremor patients. Mov Disord. (2006) Aug; 21: (8): 1114-8. |
[4] | Hariz GM, Blomstedt P, Koskinen LO. Long-term effect of deep brain stimulation for essential tremor on activities of daily living and health-related quality of life. Acta Neurol Scand. (2008) Dec; 118: (6): 387-94. |
[5] | Fahn S, Tolosa E, Marin C. Clinical rating scale for tremor. In: Jankovic J, Tolosa E, editors. Parkinson’s Disease and Movement Disorders. Baltimore (MD): Urban & Schwarzenberg; (1988) ; pp. 225-34. |
[6] | Stacy MA, Elble RJ, Ondo WG, Wu SC, Hulihan J. Assessment of interrater and intrarater reliability of the Fahn-Tolosa-Marin Tremor Rating Scale in essential tremor. Mov Disord. (2007) Apr 30; 22: (6): 833-8. |
[7] | Deuschl G, Krack P, Lauk M, Timmer J. Clinical neurophysiology of tremor. J Clin Neurophysiol. (1996) Mar; 13: (2): 110-21. |
[8] | O’Suilleabhain PE, Dewey RB, Jr. Validation for tremor quantification of an electromagnetic tracking device. Mov Disord. (2001) Mar; 16: (2): 265-71. |
[9] | Zheng X, Vieira Campos A, Ordieres-Mere J, Balseiro J, Labrador Marcos S, Aladro Y. Continuous monitoring of essential tremor using a portable system based on smartwatch. Front Neurol. 8: : 96. |
[10] | Asyali M, Dalbasti T. An image analysis based method for the quantification of tremor. J Yasar Univ. (2007) ; 2: (7): 1-7. |
[11] | Phwa R, Lyons KE, Koller W. Handbook of Parkinson’s Disease, 4th ed., CRC Press: New York, NY, USA, (2007) ; pp. 53-59. |
[12] | Elble RJ. Gravitational artifact in accelerometric measurements of tremor. Clin Neurophysiol. (2005) Jul; 116: (7): 1638-43. |
[13] | Matsumoto JY, Dodick DW, Stevens LN, Newman RC, Caskey PE, Fjerstad W. Three-dimensional measurement of essential tremor. Mov Disord. (1999) Mar; 14: (2): 288-94. |
[14] | Kim JW, Lee JH, Kwon Y, Kim CS, Eom GM, Koh SB, et al. Quantification of bradykinesia during clinical finger taps using a gyrosensor in patients with Parkinson’s disease. Med Biol Eng Comput. (2010) Mar; 49: (3): 365-71. |
[15] | Kwon DY, Kwon Y, Kim JW. Quantitative analysis of finger and forearm movements in patients with off state early stage Parkinson’s disease and scans without evidence of dopaminergic deficit (SWEDD). Parkinsonism Relat Disord. (2018) Dec; 57: : 33-8. |
[16] | Kim JW, Kwon Y, Yun JS, Heo JH, Eom GM, Tack GR, et al. Regression models for the quantification of Parkinsonian bradykinesia. Biomed Mater Eng. (2015) ; 26: (Suppl 1): S2249-58. |
[17] | Kim JW, Kwon Y, Kim YM, Chung HY, Eom GM, Jun JH, et al. Analysis of lower limb bradykinesia in Parkinson’s disease patients. Geriatr Gerontol Int. (2011) Apr; 12: (2): 257-64. |
[18] | Seok HY, Kim JW, Kim YH, Park MH, Kwon DY. Quantitative evaluation of hand motor function using a gyrosensor in mild and moderate carpal tunnel syndrome. Muscle Nerve. (2019) Apr; 59: (4): 465-9. |
[19] | Elble RJ. Diagnostic criteria for essential tremor and differential diagnosis. Neurology. (2000) ; 54: (11 Suppl 4): S2-6. |
[20] | Thanvi B, Lo N, Robinson T. Essential tremor-the most common movement disorder in older people. Age Ageing. (2006) Jul; 35: (4): 344-9. |
[21] | Elble RJ. Essential tremor frequency decreases with time. Neurology. (2000) Nov 28; 55: (10): 1547-51. |
[22] | Mansur PH, Cury LK, Andrade AO, Pereira AA, Miotto GA, Soares AB, et al. A review on techniques for tremor recording and quantification. Crit Rev Biomed Eng. (2007) ; 35: (5): 343-62. |
[23] | Dai H, Zhang P, Lueth TC. Quantitative Assessment of Parkinsonian Tremor Based on an Inertial Measurement Unit. Sensors (Basel). (2015) Sep 29; 15: (10): 25055-71. |
[24] | Jeon H, Lee W, Park H, Lee HJ, Kim SK, Kim HB, et al. Automatic Classification of Tremor Severity in Parkinson’s Disease Using a Wearable Device. Sensors (Basel). Sep 9; 17: (9). |
[25] | Sternberg EJ, Alcalay RN, Levy OA, Louis ED. Postural and Intention Tremors: A Detailed Clinical Study of Essential Tremor vs. Parkinson’s Disease. Front Neurol. (2013) ; 4: : 51. |
[26] | Deuschl G, Raethjen J, Lindemann M, Krack P. The pathophysiology of tremor. Muscle Nerve. (2001) Jun; 24: (6): 716-35. |
[27] | Beuter A, Edwards R. Using frequency domain characteristics to discriminate physiologic and Parkinsonian tremors. J Clin Neurophysiol. (1999) Sep; 16: (5): 484-94. |


