
Reading fluency and pitch discrimination abilities in children with learning disabilities
Abstract
BACKGROUND:
Pitch perception and pitch matching may link to individual reading skills.
OBJECTIVE:
In this study, we examined pitch perception and pitch matching tasks in children with learning disabilities to determine whether there was any connection between these tests and the reading fluency in these children.
METHOD:
The study used different types of pitch discrimination tests and reading fluency tests to compare the two groups.
RESULTS:
Results indicated that the accuracy of pitch discrimination and reading fluency was significantly different in these children with learning disabilities relative to typically developing children. This study also indicated that they exhibit impaired pitch matching, which linked to their reading skills.
CONCLUSION:
The results indicate that processing and production of speech may be impacted by individuals’ musical pitch perception and matching ability. The results may also give us a piece of evidence that we need further research on how these deficits in musical pitch perception affect our speech and language production in children and adults.
1.Introduction
Many children are diagnosed with learning disabilities each year, including up to a total of 8% of American children [1]. Learning disabilities (LD) represent a broad class of symptoms that ultimately result in delays or difficulties in the abilities to listen, speak, read, write, reason, and/or perform math in an age-appropriate manner [2]. Theories on why individuals suffer from learning impairments have included those based on rapid auditory processing speed, phonological awareness, speech processing, and cognitive deficits. Auditory discrimination and processing, as well as phonological awareness, are related to receptive hearing, and further influence the ability to learn to read and write [3, 4, 5, 6]. Katz et al. [7] found in a study of 94 children with learning disabilities that only a single child exhibited normal central auditory processing, while most children were unable to process auditory information, particularly in response to spoken language. Chermak et al. [8] performed a similar study on a larger amount of children, ultimately determining that between 30–50% of children with learning disabilities exhibited auditory processing disorders, and this finding was further validated by King et al. [5].
In 2005, the American Speech-Language-Hearing Association (ASHA) defined auditory processing as a process that involves the following: sound localization and lateralization, auditory discrimination, auditory pattern recognition, temporal audition, and auditory performance in the context of either degraded or competing for acoustic signals. Pitch perception is known to be a key facet of phonological development closely linked to the development of reading abilities [9]. Hämäläinen et al. [10] suggested that relevant auditory tasks should include: pitch discrimination, detection of slow frequency modulations, discrimination between rates of amplitude increase, and discrimination between sound durations. Ziegler et al. [11] suggested that pitch pattern processing is important, with disrupted pitch processing and abnormal phonological development being closely associated with one another in dyslexic children. In their studies, they found that dyslexia students attended a greater deficit in tonal patterns detecting. Ozernov-Palchik et al. [12] found that at age five, students who can discriminate between two rhythm patterns will have a better ability to transfer speech sounds to letters. Fernandez-Prieto et al. [13] determined that in children with nonverbal learning disorders, pitch task performance is poorer and slower, and pitch training has shown to enhance the development of relevant skills [14]. Not only reading disorders, but researchers also found this in other types of learning disorders. Geary et al. [15] identified such pitch perception issues in children with mathematical learning disabilities, and Capraro et al. [16] found that when elementary school teachers integrate music into mathematics lessons, this can influence the resultant mathematical abilities of the students.
Auditory perception has been suggested to be a relevant factor for the development of reading skills in those with dyslexia [17]. Recent studies of rhythm reproduction abilities have found them to be significantly predictive of reading ability in children [18]. When studying two groups of students with or without dyslexia, aged 10 to 16 years, without any formal music instruction, researchers found that those with dyslexia were significantly less accurate in a tapping task, and had more difficulty adjusting to a new tempo [19]. Other studies have used a pitch matching task to see if there is any relationship between auditory processing and reading. Pitch matching is the action of replicating perceived pitch, with a rest subject singing or playing a note which they heard. This can involve generating a corresponding pitch when given a specific note, or it can involve imitation of singing or matching a pitch via the use of an instrument. Pitch matching is a prerequisite for all musical activities, and there is a close relationship between rhythm and the inability to differentiate between pitches [20]. In some cases, auditory recognition of a pitch is also linked to pitch matching. Mantell and Pfordresher [21] found that a given individual’s ability to imitate music also predicts their ability to imitate speech accurately. Indeed, many studies have found that music training can improve language and auditory skills in adolescents [22, 23, 24, 25].
Takeshi et al. [26] found that defective rhythm perception may result from fundamental issues with pitch perception. Studies from adults’ right hemisphere brain check found that he posterior parietal lobe linked to perceiving and processing pitch and loudness contours of the human voice, thereby facilitating speech signal processing [27]. Some work suggests that there may be structural abnormalities in the right hemisphere of individuals with learning disorders, consistent with the observed difficulties in pitch-based task performance, as the right hemisphere is associated with verbal rhythm processing [28, 29]. While Chinese and English have different rules, it has been suggested that children with dyslexia who are native speakers of both languages have correlations between their ability to imitate perceived rhythm and their reading ability [30].
Reading aloud is defined as a part of fluency assessment, as it forces individuals to confront sounds and words that may otherwise be avoided [31, 32]. Although there is little agreement regarding the definition of fluency [33, 34] in clinical settings, such definitions should incorporate pausing, intonation, and speaking rate [35]. Until now, little research has been performed on how learning disorders influence pitch perception or pitch matching, and how this is associated with oral reading fluency. As Mandarin is a tonal language dependent on pitch patterns for differentiation between identical segmental phonological structures [36], we aimed to assess rhythm perception as an alternative to a single tone perception test for the assessment of learning disabilities in Chinese children. In this study, we aimed to assess the rhythm processing abilities of children with learning disorders. We hypothesized that Chinese students with learning disabilities differ from typically developing children with respect to their pitch and rhythm perception abilities, and that they exhibit impaired pitch matching, which linked to their reading skills. To test this hypothesis, we prepared three computer-based tests: 1) A pitch perception experiment, in which we assessed the accuracy of interval and rhythm perception; 2) A pitch matching experiment, in which we measured single tone, interval, and rhythm imitation; and 3) A reading rhythm test which assessed reading rhythm as this is a skill that improves decoding accuracy and speed while reading, and has been found to be important to reduce pausing time while reading [37].
2.Methods
2.1Participants
Children (Grades 3–5) from two primary schools in Shanghai participated in the tasks, including a total of 23 children (7 girls and 16 boys) with diagnoses of academic disabilities, and 19 (9 girls and 10 boys) age-matched typically developing children. Academic disability screening criteria used were as follows: 1) Rank among the bottom 5% of students for the year; 2) A Raven’s Standard Progressive Matrices (SPM) score of
2.2Experimental tasks
There were two parts to this study: a pitch perception experiment composed of assessments of interval and rhythm perception, and a pitch matching experiment assessing single tone, interval, and rhythm imitation abilities. All test items were recorded using the syllable (/ma/) while modulating the pitch. Studies usually use tones modulated according to music tonal format, so in this study, we also modulated those tests into five notes [40]. Five notes were used in the test were C, D, E, F, and G of the C4 group of notes. The test format was “CX”, with C being the standard sound between texts. The target sounds were all represented by a sung form of the single syllable /ma/, with both the C and X notes lasting for 1 second and being separated by 500 ms. A trained female singer recorded all notes in a soundproof room using a unidirectional microphone connected to a pre-filter amplifier (low-pass filter 20 kHz, amplification gain 25 dB), connected to a personal desktop computer via linear input. Sony Sound Forge v7.0 was used to record all sounds at 44100 Hz, in 16-bit mono. These sounds files were then imported into Adobe Audition 3.0 to standardize their duration and volume. We inserted those sounds into a PowerPoint file, and the examiner clicks those compared sounds and records the participants’ results. All the testing sounds were played by an AUSU laptop. The recording device for testing was identical to that used to record the original experimental sounds, and microphones were positioned 10 cm from the subject at a 40 degree to horizontal angle.
2.2.1Pitch perception test
The pitch perception experiment incorporated both interval and rhythm perception tests, with test items shown in Table 1. The interval perception experiment aimed to assess an individual’s ability to perceive differences between two frequencies, while rhythm perception is the perception of differences in frequencies of a continuous series of sounds. The six groups of test sounds for rhythm perception were: “C-#DDG,” “CEDG,” “CFDG,” “GD-#DC,” “GDEC,” and “GDFC,” with two trends in the direction of the rhythm. The first three groups started with the lowest C and the highest G, with an overall rise in the rhythm leading to this being referred to as a “rising rhythm”. In the remaining three groups, the rhythm decreased, and so these were termed “falling rhythms”. For all test items, rising intervals went from D-#D (1 semitone), D-E (2 semitones), D-F, and C-#D (3 semitones), C-E (4 semitones), C-F, and D-G (5 semitones) or the reverse of these. For each rising and falling rhythm, there were three groups, each of which was composed of four items, and the rhythms in each item were compared side by side to determine whether they were identical.
2.2.2Pitch matching test
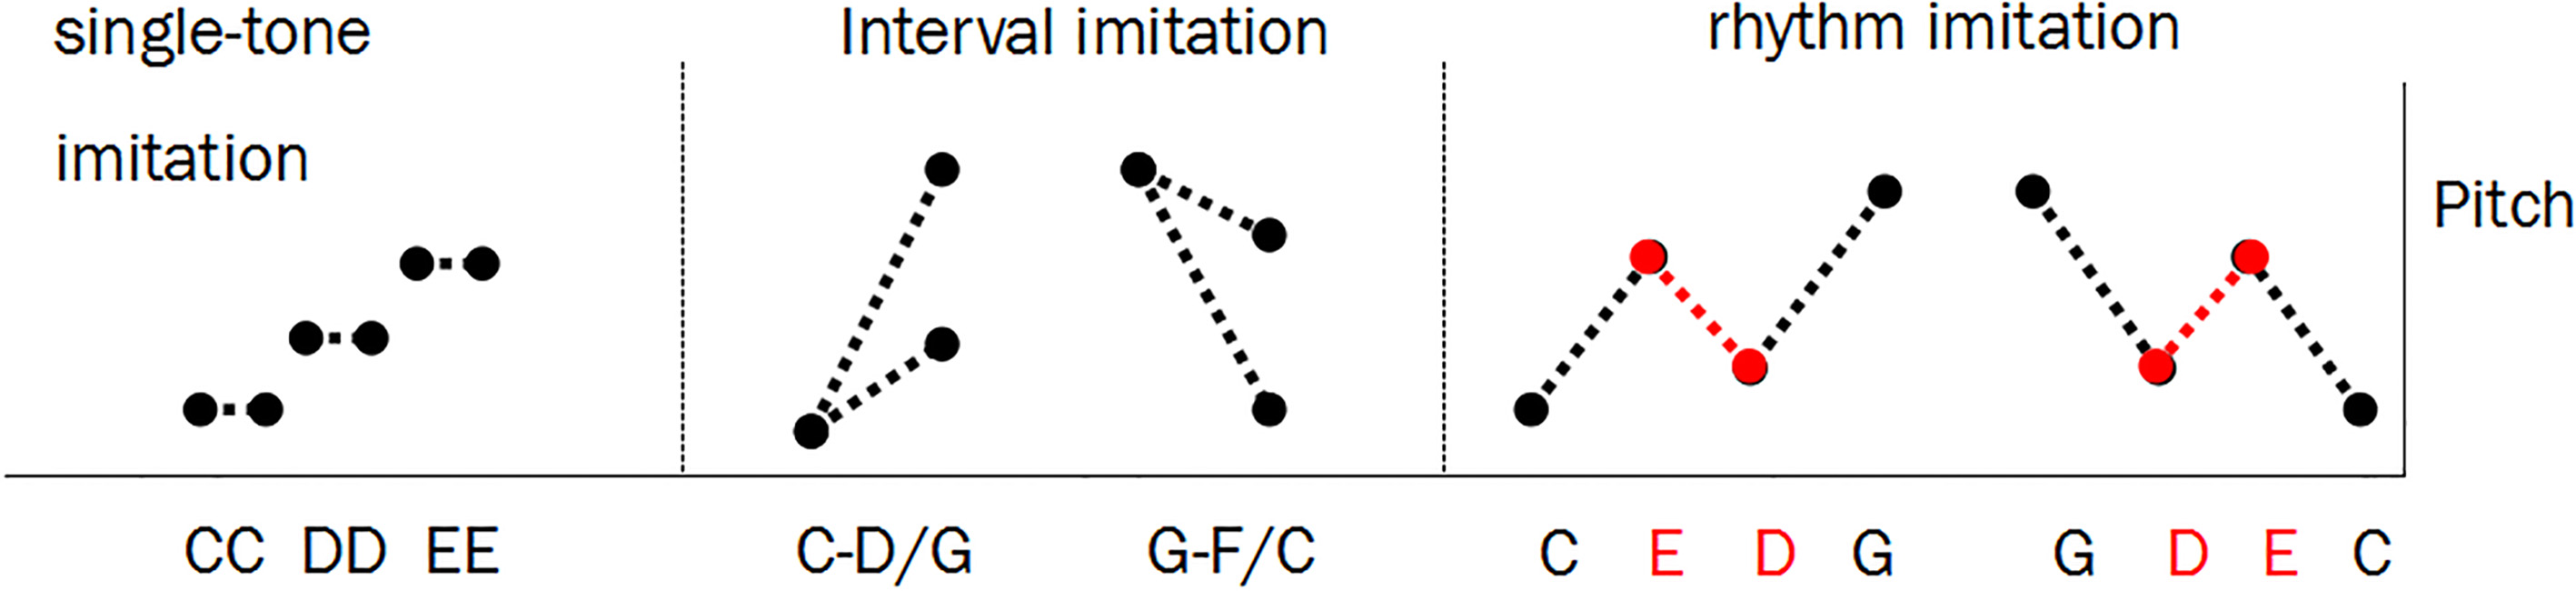
Table 1 and Fig. 1 compile the pitch matching testing items, including tests of a single tone, interval, and rhythm imitating using the same recording method as mentioned above. Single-tone imitation measures the differences between the original and the target pitch produced by the subject to understand the error made, whereas interval imitation experiments were used to determine differences between the produced interval and the associated error types, and rhythm imitation experiments recorded the compression ratio of the different groups of rhythms.
Table 1
Pitch perception and pitch matching experiments
| Pitch perception experiment | Pitch matching experiment | |||
| Interval perception experiment | Rhythm perception (imitation) experiment | Single-tone matching ability | Interval imitation | Rhythm imitation |
| C vs D | C-#D vs DG | CC | C-D | C-#D vs DG |
| G vs E | C-E vs DG | DD | C-E | C-E vs DG |
| C vs F | C-F vs DG | EE | C-F | C-F vs DG |
| G vs F | G-D vs #DC | FF | C-G | G-D vs #DC |
| G vs C | G-D vs EC | GG | G-F | G-D vs EC |
| C vs E | GD vs F-C | G-E | GD vs F-C | |
| G vs D | G-D | |||
| C vs G | G-C | |||
Figure 1.
Examples of pitch matching test material.
Pitch difference (mean note deviation) refers to the difference between the original pitch and the pitch of each individual target note sung. This measurement is more extensive as the difference between the original and produced pitch increases, but it does not provide information as to whether the produced pitch is above or below the target pitch.
Pitch interval difference (mean interval deviation) refers to the difference between the test interval and the target interval for each original interval. The higher the pitch difference, the more significant the gap between the original sample and the target pitch interval. However, this measurement does not provide information as to whether the produced pitch interval is above or below the target interval.
The compression ratio range (compression ratio) refers to the ratio of what an individual can sing from highest to lowest, divided by the interval values for the subject’s most senior and lowest notes [41]. When the compression ratio range is
2.2.3Reading fluency test
We additionally assessed oral reading fluency (ORF) in the test subjects. This test approach generally involves a subject reading either a standardized and grade-appropriate text, or a piece of their coursework from school [42]. Readouts of interest include time spent reading (reading speed), the number of words read accurately (accuracy), and fluency indicators based on these values (including correct words per minute).
In this study, students were asked to read a section of their Chinese textbook which they had read previously, and we used a Sony HDR-XR 150E camera to record their readouts:
1. The average number of pauses (AP), referring to the average number of pauses over 2 s long per minute.
2. The average number of repetitions (AR), referring to the average number of times in which a word or phrase is repeated at least three times within one minute.
All the results were checked by three persons who had been trained on how to count the AP and AR.
2.3Testing procedure
All testing was conducted in a quiet classroom with a noise floor of
2.4Data collection
For pitch perception, correctness was recorded by assigning scores of either 0 or 1. For rhythm matching, sound files were imported into Praat 4.0, clips were extracted, the fundamental frequency was extracted in Hz, and it was then converted to the original pitch in semitones using Microsoft Excel 2010 according to the following conversion formula based on the C4 frequency of 262 Hz:
F
Where F
3.Results and analysis
3.1Comparison of pitch perception abilities between children with learning disabilities and typically developing children
We found that children with learning disabilities exhibited lower rates of correct pitch and rhythm perception than typically developing children (Table 2). Upon analyzing variance in the data, we found that differences in pitch perception between these two groups were significant (
Table 2
Pitch perception and pitch imitation results
| Test item | LD mean (SD) | TD mean (SD) |
|
|---|---|---|---|
| Pitch perception | |||
| Interval perception | 0.46 (0.21) | 0.79 (0.04) | 0.000 |
| Rhythm perception | 0.65 (0.23) | 0.73 (0.15) | 0.015 |
| Single-tone imitation | |||
| Pitch difference | 0.31 (0.24) | 0.29 (0.53) | 0.462 |
| Compression ratio range | 0.87 (0.46) | 0.91 (0.24) | 0.998 |
| Interval imitation | |||
| Pitch difference | 0.40 (0.97) | 0.17 (1.09) | 0.038 |
| Compression ratio range | 0.96 (0.13) | 1.02 (0.13) | 0.256 |
| Rhythm imitation | |||
| Pitch difference | 0.50 (1.08) | 0.32 (1.03) | 0.317 |
| Compression ratio range | 1.26 (0.33) | 1.15 (0.14) | 0.020 |
Table 3
Reading fluency results
| LD | TD |
| |
|---|---|---|---|
| Average number of pauses (AP) | 0.89 | 0.13 | |
| Average number of repetitions (AR) | 1.82 | 0.61 |
3.2Comparison of the ability of pitch matching between children with learning disabilities and typically developing children
We found that children with learning disabilities were closer to the target pitch at the base level, but as the pitch rises, typically developing children are instead more intimate to the target pitch.
We also observed a significant difference between these two groups for the interval imitation test, with children who had learning disabilities leaving a larger difference between the target pitch and the produced pitch relative to normal controls (
With respect to rhythm imitation, we observed a significant difference between groups. Children with learning disabilities again exhibited poorer performance with compression ratios further from 1 than in typically developing children (
3.3Comparison of reading fluency between groups
When we compared the average number of pauses and the average number of repetitions between these two groups of children, we observed significant differences between the groups (
We next aimed to determine whether reading fluency and pitch perception imitation are related in individuals. We determined that there was a significant association between the average number of repetitions and pitch perception/pitch imitation.
We found that while reading, individuals with learning disabilities had numbers of repetitions associated with their pitch perception and pitch matching abilities, as can be seen in Table 4. We also compared the findings in typical students. Reading fluency in typical students was also linked to pitch perception and pitch matching, although unlike in those with learning disabilities, it was more closely linked to pitch perception, as can be seen from Table 5.
Table 4
Associations between fluency and pitch perception in children with learning disorders
| Variable | Pitch perception | Pitch matching | Reading fluency | ||||
|---|---|---|---|---|---|---|---|
| IP | RP | IIPD | RICRR | AP | AR | ||
| Pitch perception | IP | ||||||
| RP | 0.825 | ||||||
| Pitch matching | IIPD | 0.06 | 1.085 | ||||
| RICRR | 3.473 | 2.648 | 3.733 | ||||
| Reading fluency | AP | 1.866 | 1.042 | 2.127 | 1.606 | ||
| AR | 5.903 | 5.079 | 6.164 | 2.431 | 4.037 | ||
A: IP
Table 5
Associations between fluency and pitch perception in typically developing children
| Variable | Pitch perception | Pitch matching | Reading fluency | ||||
|---|---|---|---|---|---|---|---|
| IP | RP | IIPD | RICRR | AP | AR | ||
| Pitch perception | IP | ||||||
| RP | 0.339 | ||||||
| Pitch matching | IIPD | 3.498 | 3.16 | ||||
| RICRR | 2.031 | 2.37 | 5.53 | ||||
| Reading fluency | AP | 4.458 | 4.119 | 0.959 | 6.489 | ||
| AR | 1.016 | 0.677 | 2.483 | 3.047 | 3.442 | ||
a: IP
4.Discussion
Pitch matching allows the assessment of whether an individual can reproduce a specific sound, and this matching process requires accurate listening, distinguishing of the provided pitch, storing it, and then reproducing it as needed. Accurate pitch reproduction requires the auditory system to be functional and intact, both with respect to its peripheral and central components. Previous research indicates that pitch identification is important in the process of auditory feedback when perceiving things such as speech, and when listening to speaking individuals, we rely on pitch identification to gauge language comprehensibility. When people sing a song, they control their pitch and adjust it according to their perceived auditory feedback, allowing them to effectively compare their emitted sound to the original model, which they are attempting to reproduce. Information transmitted via sound as speech or music primarily depends upon changes in sound as a function of time, encoding temporal information that affects all aspects of the central auditory nervous system, which serves as a mediator of neural activity accurate to within milliseconds. This accuracy is essential, as the temporal structure of sound is vital to decoding the information contained therein accurately.
Imitation is a process dependent on the output of specific sounds, whereas perception depends on inputting these sound signals. Impaired perception will inevitably affect sound imitation. The results of our study indicate that children with learning disabilities have significantly reduced pitch perception abilities relative to typically developing children, both with respect to interval and rhythm perception, with interval ability being the worse of the two. We also found that the difference between target and produced pitch is significantly higher for children with learning disabilities relative to normal controls, suggesting that children with learning disabilities are more likely to have difficulty singing accurately. Consistent with this, our results suggest that children with learning disabilities have clear difficulties in pitch perception and pith matching, and those abilities may also affect their reading fluency. Tong et al. [43] found that lexical pith perception, also known as suprasegmental phonological processing, may influence difficulties reading the Chinese language. Such difficulties can arise early during development in infants and small children. Tallal and Paula [3] found that the abnormal time processing systems in infancy can result in children having difficulties in discriminating between and classifying sounds, making it difficult for children to accurately detect the rapid auditory components of speech, resulting in difficulties with discrimination and phoneme awareness in children that have dyslexia. Siegel et al. [44] similarly found that individuals with dyslexia have difficulty properly ordering and distinguishing between rapidly presented auditory stimuli, with less sensitivity to changes in sound amplitude and frequency relative to normal individuals. Shulma et al. [45] developed a rapid auditory presentation technology and cross-channel techniques which the used to demonstrate that individuals with difficulties distinguishing between rapidly changing visual signals also have difficulty differentiating between rapid changes in sound, with severe versions of such defects being linked to literacy problems. Law et al. [46] examined hearing abilities in adults with dyslexia, and they determined that these adults have difficulty with the perception of sound and the speed of its presentation.
We also found that individuals with learning disabilities exhibit an average number of repetitions that is linked to pitch perception and pitch matching. This suggests that in these individuals, their reading fluency is more affected by the auditory processing deficits. Some previous research supports that musical pitch perception and speech perception share many of the same processing requirements. Furthermore, work by Wang et al. [47] argues that much of auditory processing occurs at a level above which is dependent on basic temporal information. As neural representations of a sound proceeds into the cortex, the fine temporal resolution associated with that sound is reduced, while emissivity-based neural encoding is enhanced, as such encoding is necessary in order to integrate this information with other sensory and cognitive systems. Time-based information associated with sound is processed, and music is particularly dependent on this temporal information. We furthermore assessed the number of repetitions and found that those with learning disabilities exhibited more repetitions than typical students, suggesting that they may require more time to pronounce words.
5.Conclusions
Our findings suggest that deficits in the perception of rhythm sounds may affect a person’s understanding of sounds which may further affect his/her reading or other working combined with language comprehension. Our results indicate that processing and production of speech may be affected by the individuals’ musical pitch perception and matching ability. Furthermore, the results may also give us a piece of evidence that we need further research on how these deficits in musical pitch perception affect our speech and language production in children and adults in order to determine which other processing components (e.g. reading, spelling) are uniquely involved in mediating deficits in musical pitch perception and which are not. In the future, additional studies on this topic will be needed, including those who aim to select appropriate psychometric variables and auditory measurement models.
Acknowledgments
This work was sponsored by the Peak Discipline Construction Project of Education at East China Normal University, the Shanghai Philosophy and Social Science Planning Project (grant no. B1602), and the National Planning Office of Philosophy and Social Science of China (grant no. CBA160183).
Conflict of interest
None to report.
References
[1] | James H. Wendorf, N.C.F.L., 2014-State-of-LD. (2014) . |
[2] | American Psychiatric Association. ((2013) ). Diagnostic and statistical manual of mental disorders, 5th ed. Arlington: American Psychiatric Association. |
[3] | Tallal P. ((1981) ). Speech acoustic-cue discrimination abilities of normally developing and language-impaired children. The Journal of the Acoustical Society of America, 69: (2): 568. |
[4] | Brandt J, Rosen J. ((1980) ). Auditory phonemic perception in dyslexia: Categorical identification and discrimination of stop consonants. Brain Lang, 9: : 324–337. |
[5] | King C, Warrier CM, Hayes E, Kraus N. ((2002) ). Deficits in auditory brainstem pathway encoding of speech sounds in children with learning problems. Neuroscience Letters, 319: (2): 111–115. |
[6] | Mirici E, Ocak E, Bayrak S, et al. ((2018) ). A noteworthy pathology in children with learning disabilities: Late latency response failure in central auditory processing. The Journal of International Advanced Otology, 14: (3): 404–407. |
[7] | Katz J, Stecker NA, Henderson D. ((1992) ). Central auditory processing: A transdisciplinary view. St. Louis, MO: Mosby Year Book. |
[8] | Chermak GD, Hall RJ, Musiek FE. ((1999) ). Differential diagnosis and management of central auditory processing disorder and attention deficit hyperactivity disorder. Journal of the American Academy of Audiology, 10: (6): 289. |
[9] | American Speech-Language-Hearing Association. Acoustics in educational settings: Technical report. Retrieved (2005) , From http://www.asha.org/members/deskref-journals/deskref/default. |
[10] | Hamalainen JA, Salminen HK, Leppanen PHT. ((2012) ). Basic auditory processing deficits in dyslexia: Systematic review of the behavioral and event-related potential/field evidence. Journal of Learning Disabilities, 0022219411436213. |
[11] | Ziegler JC, et al. ((2012) ). Global and local pitch perception in children with developmental dyslexia. Brain & Language, 120: (3): 265–270. |
[12] | Ozernov-Palchik O, Wolf M, Patel A. ((2018) ). Relationships between early literacy and nonlinguistic rhythmic processes in kindergarteners. Journal of Experimental Child Psychology, 167: : 354–368. doi: 10.1016/j.jecp.2017.11.009. |
[13] | Fernández-Prieto I, et al. ((2016) ). Pitch perception deficits in nonverbal learning disability. Research in Developmental Disabilities, 59: : 378–386. |
[14] | Pinheiro FH, Capellini SA. ((2010) ). Auditory training in students with learning disabilities. Jornal Da Sociedade Brasileira De Fonoaudiologia, 22: (1): 49–54. |
[15] | Geary DC, Hoard MK, Byrd-Craven J, Nugent L, Numtee C. ((2007) ). Cognitive mechanisms underlying achievement deficits in children with mathematical learning disability. Child Development, 78: (4): 1343–1359. |
[16] | An S, Capraro MM, Tillman DA. ((2013) ). Elementary teachers integrate music activities into regular mathematics lessons: Effects on students’ mathematical abilities. Journal for Learning Through the Arts, 9: (1): 21. |
[17] | Tong X, Mcbride C, Shu H, Ho SH. ((2017) ). Reading comprehension difficulties in chinese-english bilingual children: Reading difficulties in chinese-english bilinguals. Dyslexia, 24: (32). |
[18] | Flaugnacco E, Lopez L, Terribili C, Zoia S, Buda S, Tilli S, et al. ((2014) ). Rhythm perception and production predict reading abilities in developmental dyslexia. Frontiers in Human Neuroscience, 8. |
[19] | Wolff PH. ((2002) ). Timing precision and rhythm in developmental dyslexia. Reading and Writing, 15: (1–2): 179–206. |
[20] | Mcdermott JH, Oxenham AJ. ((2008) ). Music perception, pitch, and the auditory system. Current Opinion in Neurobiology, 18: (4): 452–463. |
[21] | Mantell JT, Pfordresher PQ. ((2013) ). Vocal imitation of song and speech. Cognition, 127: (2): 177–202. |
[22] | Slater J, et al. ((2015) ). Music training improves speech-in-noise perception: Longitudinal evidence from a community-based music program. Behavioural Brain Research, 291: : 244–252. |
[23] | Parbery-Clark A, Skoe E, Lam C, Kraus N. ((2009) ). Musician enhancement for speech-innoise. Ear Hear, 30: (6): 653–661. |
[24] | Parbery-Clark A, Strait DL, Anderson S, Hittner E, Kraus N. ((2011) ). Musical experience and the aging auditory system: Implications for cognitive abilities and hearing speech in noise. PLoS One, 6: (5): e18082. |
[25] | Tierney AT, Krizman J, Kraus N. ((2015) ). Music training alters the course of adolescent auditory development. Proc Natl Acad Sci U S A, 112: (32): 10062–10067. |
[26] | Arimitsu T, Uchida-Ota M, Yagihashi T, et al. ((2011) ). Functional hemispheric specialization in processing phonemic and prosodic auditory changes in neonates. Frontiers in Psychology, 2: : 202. |
[27] | Trainor LJ, Chang A, Cairney J, Li YC. ((2018) ). Is auditory perceptual timing a core deficit of developmental coordination disorder? Annals of the New York Academy of Sciences. |
[28] | Acosta MT. ((2000) ). Right hemisphere syndrome in children: Functional and maturity correlation of non-verbal learning disabilities. Revista De Neurologia, 31: (4): 360. |
[29] | Schaal NK, Pollok B, Banissy MJ. ((2017) ). Hemispheric differences between left and right supramarginal gyrus for pitch and rhythm memory. Scientific Reports, 7: : 42456. |
[30] | Hom-Yi L, Yung-Siang S, Sz-Chi C, Man-Chen C. ((2015) ). The music perception performance of children with and without dyslexia in taiwan. Psychol Rep, 116: (1): 13–22. |
[31] | Guitar B. ((2014) ). Stuttering: an integrated approach to its nature and treatment (4th ed.). Baltimore, MD: Lippincott Williams & Wilkins. |
[32] | Ward D. ((2006) ). Stuttering and cluttering: frameworks for understanding and treatment. Hove, East Sussex: Psychology Press. |
[33] | Tilsen S, Arvaniti A. ((2013) ). Speech rhythm analysis with decomposition of the amplitude envelope: Characterizing rhythmic patterns within and across languages. The Journal of the Acoustical Society of America, 134: (1): 628. |
[34] | Lickley RJ. ((2015) ). Fluency and disfluency. In Redford MA, (Ed.), The handbook of speech production, pp. 445–474. |
[35] | Richards JC, Schmidt R. ((2013) ). Longman dictionary of language teaching and applied linguistics (4th ed.). Abingdon, Oxon: Longman. |
[36] | Xie X, Myers E. ((2015) ). The impact of musical training and tone language experience on talker identification. The Journal of the Acoustical Society of America, 137: (1): 419. |
[37] | Binder KS, Tighe E, Jiang Y, Kaftanski K. ((2013) ). Reading expressively and understanding thoroughly: An examination of prosody in adults with low literacy skills. Read Writ, 26: (5): 665–680. |
[38] | Raven J. ((2000) ). The Raven’s progressive matrices: Change and stability over culture and time. Cognitive Psychology, 41: (1): 1–48. |
[39] | Lynn R, Chen HY, Chen YH. ((2010) ). Intelligence in Taiwan: Progressive matrices means and sex differences in means and variances for 6,17-yearolds. Journal of Biosocial Science, 1–6. |
[40] | Pfordresher PQ, Brown S, Meier KM, Belyk M, Liotti M. ((2010) ). Imprecise singing is widespread. The Journal of the Acoustical Society of America, 128: (4): 2182–2190. |
[41] | Xu L, Zhou N, Chen XW, Li YX, Schultz HM, Zhao XY, Han DM. ((2009) ). Vocal singing by prelingually-deafened children with cochlear implants. Hearing Research, 255: : 129–134. |
[42] | Denton CA, Barth AE, Fletcher JM, et al. ((2011) ). The relations amongoral and silent reading fluency and comprehension in middle school: Implications for identification and instructions of students with reading difficulties. Scientific Studies of Reading, 15: (2): 109–135. |
[43] | Tong X, King YF. ((2017) ). Beyond auditory sensory processing deficits: lexical tone perception deficits in chinese children with developmental dyslexia. Journal of Learning Disabilities, 002221941771201. |
[44] | Siegel LS. ((2006) ). Perspectives on dyslexia. Paediatrics & Child Health, 11: (9): 581–7. |
[45] | Shulman GL, Sullivan MA, Gish K, Sakoda WJ. ((1986) ). The role of spatial-frequency channels in the perception of local and global structure. Perception, 15: : 259–273. |
[46] | Law JM, Maaike V, Pol G, Jan W. ((2014) ). The relationship of phonological ability, speech perception, and auditory perception in adults with dyslexia. Frontiers in Human Neuroscience, 8. |
[47] | Wang X, Lu T, Bendor D, Bartlett E. ((2008) ). Neural coding of temporal information in auditory thalamus and cortex. Neuroscience, 157: : 484–494. |


