
Experimental study on differential diagnosis of cerebral hemorrhagic and ischemic stroke based on microwave measurement
Abstract
BACKGROUND:
Hemorrhagic stroke and ischemic stroke have similar symptoms at the onset of the disease, but their clinical treatment is completely different. The early, effective identification of stroke types can effectively improve the cure rate.
OBJECTIVE:
In this study, an early, noncontact identification of the stroke type, i.e., hemorrhagic or ischemic, based on a microwave measurement technique was investigated.
METHODS:
This study was based on animal models of cerebral hemorrhage and cerebral ischemia and the design of a microwave scattering parameter measurement system.
RESULTS:
The accuracy of the cerebral hemorrhage model with a blood loss interval of 2 ml reached 93.75%. While the accuracy of the cerebral ischemia model with an ischemic interval of 42 minutes reached 91.7%.
CONCLUSION:
The experimental results show that the system for identifying cerebral stroke based on microwaves can distinguish between cerebral hemorrhage and cerebral ischemia models and effectively distinguish between different degrees of cerebral hemorrhage or different durations of cerebral ischemia. This experimental system is inexpensive, portable, noninvasive, simple, and rapid and thus has good potential as a method for identifying the stroke type prior to hospitalization.
1.Introduction
Stroke is a major threat to human health worldwide [1, 2]. In Europe alone, the social damage caused by stroke can be as high as tens of billions of euros per year. The current situation of stroke in China is not optimistic. For many years, stroke has been the leading cause of death and disability in the Chinese population. If the time from onset to treatment is too long, even if the patient survives, the patient could be left with different degrees of disability. A few severely disabled patients need lifelong care or develop cerebrovascular dementia. Stroke causes millions of laborers to die every year, resulting in major economic losses. The impact of stroke on national economic and social stability is greater than that of severe infectious diseases.
Stroke can be divided into ischemic stroke [3] and hemorrhagic [4] stroke. Hemorrhagic cerebrovascular disease is caused by cerebral vascular rupture, and this bleeding damages the nervous system. In contrast, ischemic cerebrovascular disease is caused by cerebral vascular occlusion. However, the clinical symptoms of both stroke types are similar and include sudden headache, disturbance of consciousness, aphasia, and hemiplegia, among others. As crossover treatment will worsen the patient’s condition, research related to the identification of the stroke type is very urgent [5, 6, 7, 8].
So far, doctors have relied mainly on CT or MRI to diagnose the type of stroke in hospitals and clinics. However, these systems are expensive, bulky, cumbersome to operate, and difficult to popularize. According to European clinical guidelines, thrombolytic therapy is not recommended beyond 4.5 hours after the onset of ischemic stroke. Therefore, it is particularly important to be able to determine the stroke type at the site of the emergency, before the patient reaches the hospital [9, 10, 11], to ensure that the subsequent treatment is accurate and targeted. Thus, a small, portable, inexpensive, user-friendly device for the prehospital identification of the stroke type in emergency situations would be of great significance. Based on microwave measurement technology, along with data processing and pattern recognition technology, this work explores and verifies technology for the early, noncontact, rapid identification of cerebral hemorrhagic stroke and cerebral ischemic stroke.
This study begins with an animal experiment [12]. We selected the rabbit as the experimental object, used an antenna for measurements, and used a vector network analyzer as a transmitter and receiver. These components formed the microwave scattering parameter measurement system [13, 14, 15]. To obtain electromagnetic data corresponding to cerebral hemorrhage and cerebral ischemia [17, 18], the scattering parameter data were collected from a wide band at multiple frequency points [16]. Then, the measurement data were processed by dimension reduction and classified. The main purpose of this work was to verify whether the proposed stroke identification system could identify cerebral hemorrhage and cerebral ischemia in rabbits and further quantify characteristics of cerebral hemorrhage and cerebral ischemia on this basis [19].
2.Materials and methods
2.1Experimental system
In this study, the measurement system consists of an antenna, a vector network analyzer, blood alcohol medium and an injection pump, among other components, as shown in Fig. 1.
Figure 1.
Composition of the measurement system.
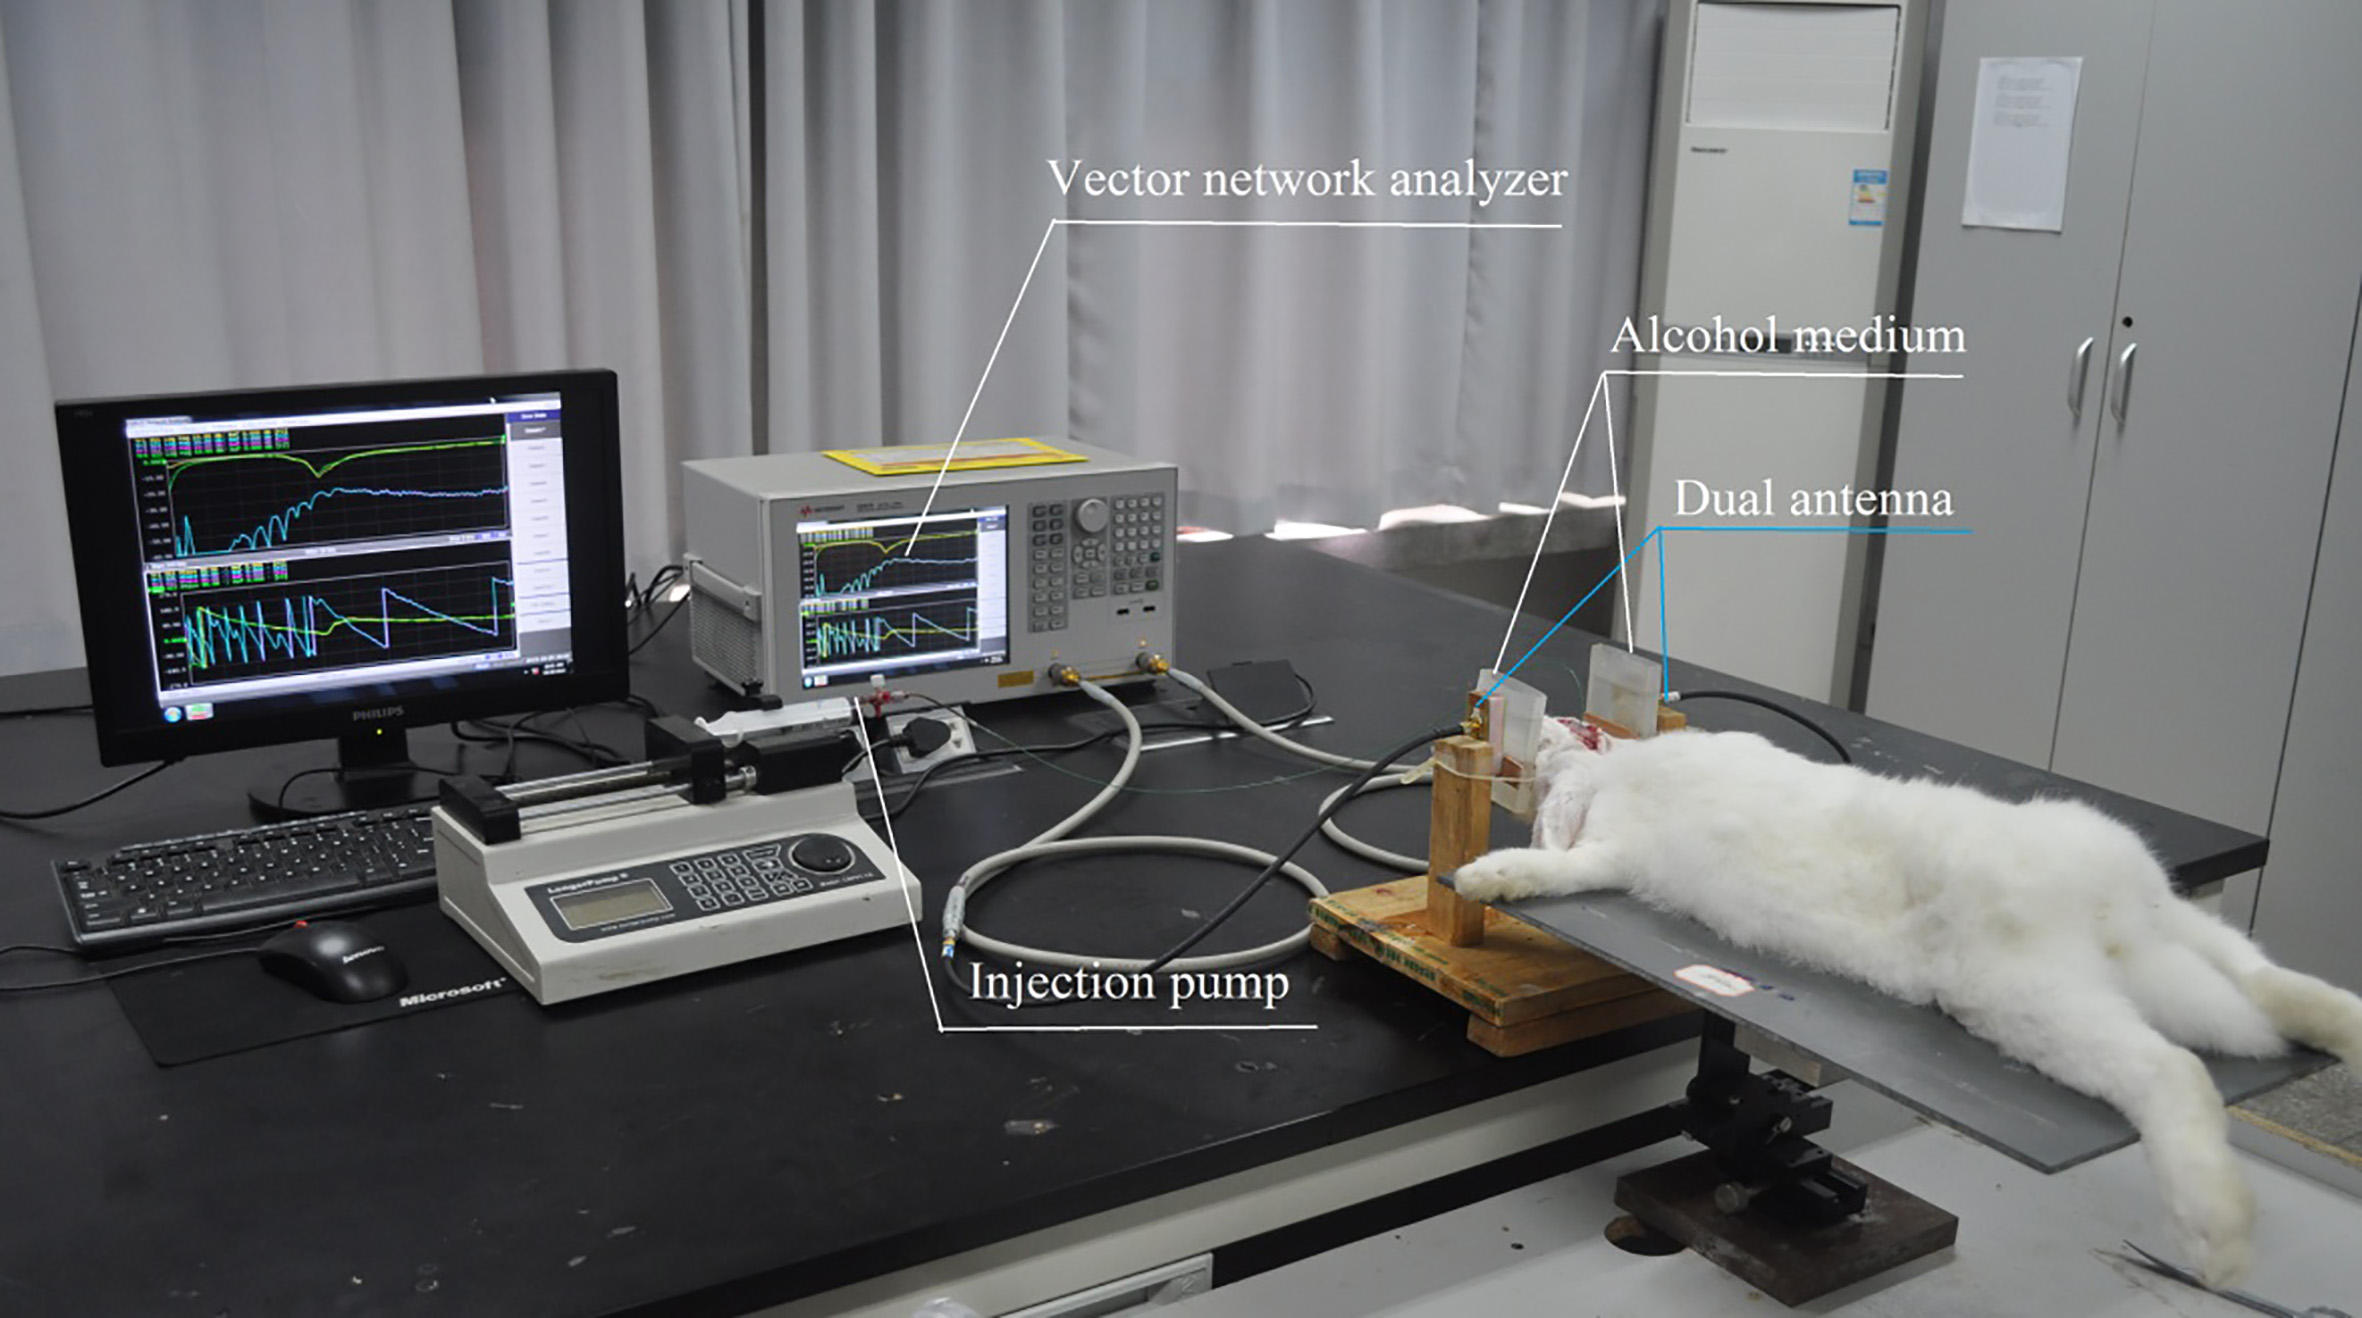
Figure 2.
The designed antenna.
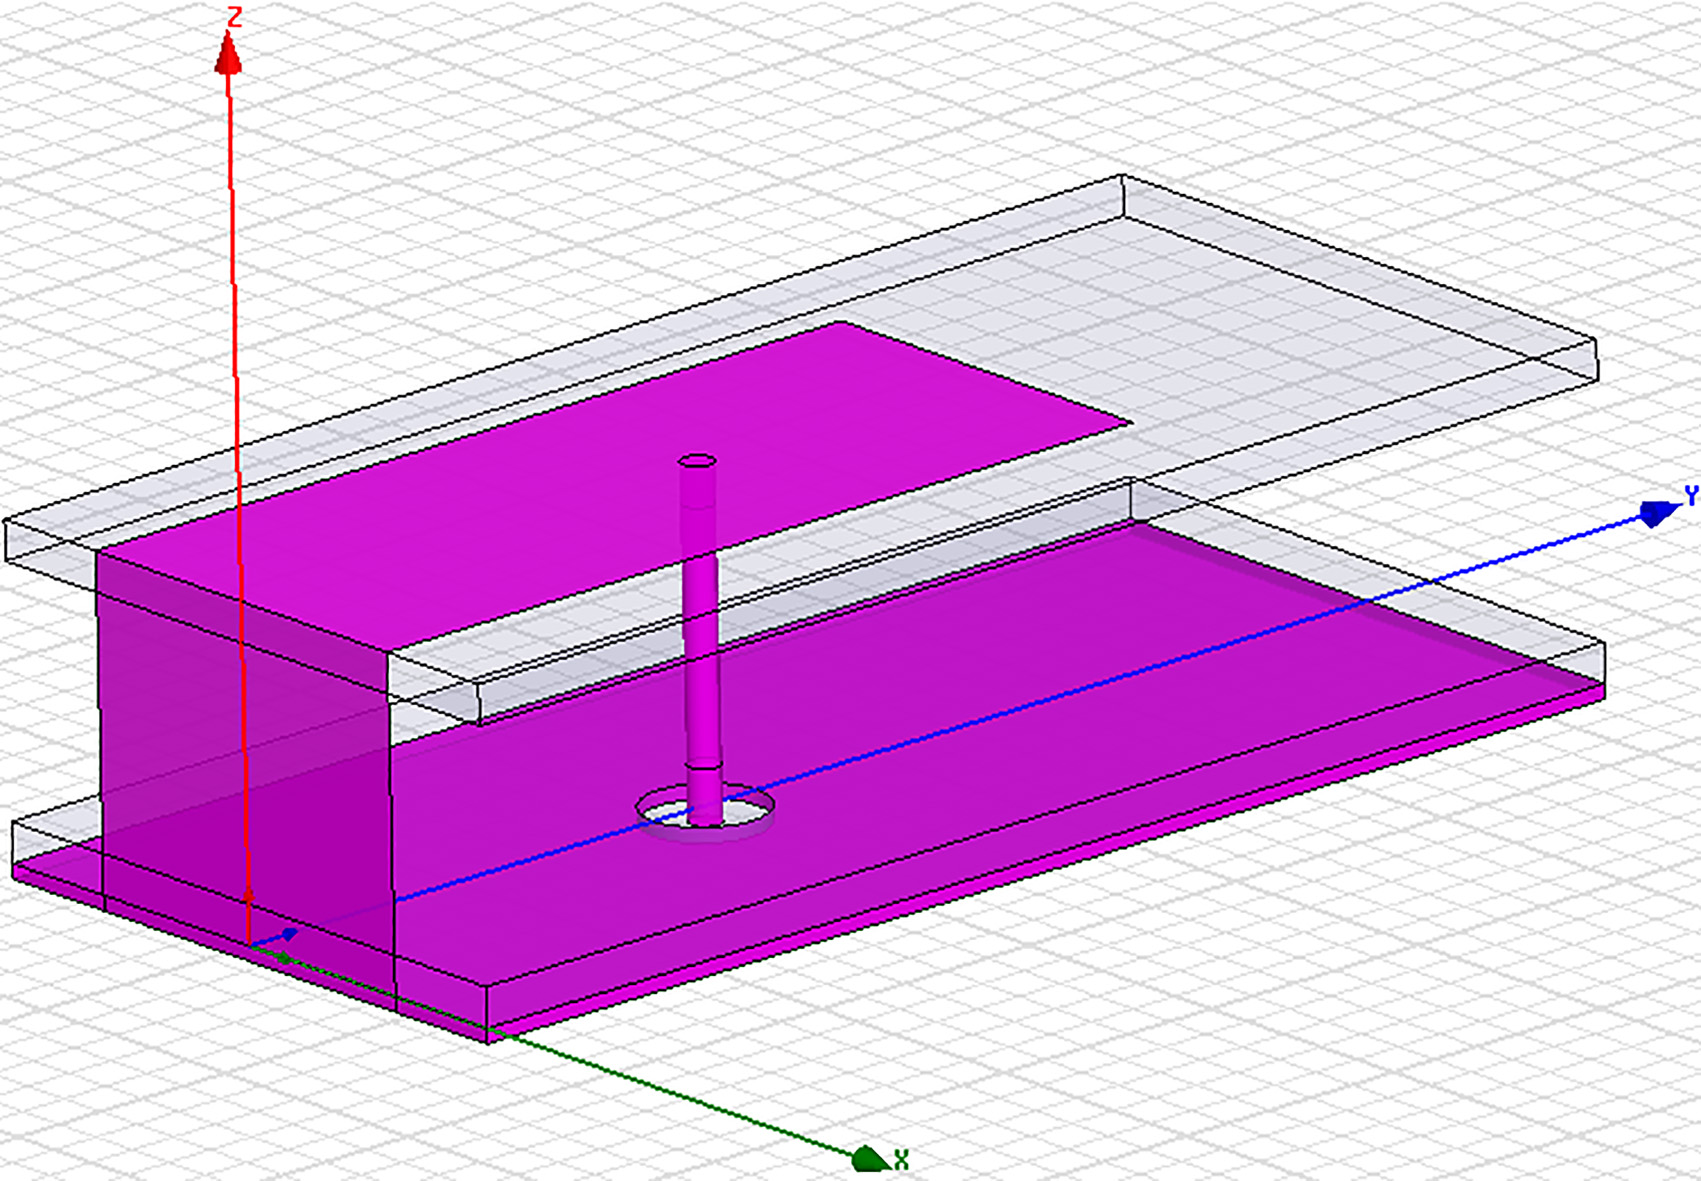
The patch antennas used in this system were the same as those used in our earlier work [20], and the structure is shown in Fig. 2. The device containing alcohol is closely attached to the electrode, and because the material is transparent and soft plastic, it can effectively improve the port-matching degree of the vector network and reduce the central frequency of the measurement, thereby increasing the microwave tissue penetration depth and the resolution of the tissue. The auxiliary experimental tools include urethane solution with a mass fraction of approximately 25%, syringes, blood sampling needles, blood collection bottles containing heparin, three-way catheters, ligation lines, and an RM6280 system for biological signal acquisition and processing.
2.2Detection principle
The basis of the technology for measuring microwave scattering parameters is that different tissues in different human bodies have different dielectric properties, resulting in different microwave scattering modes. According to the work of Gabriel [21], the dielectric constant and conductivity of blood, white matter and gray matter are significantly different in the frequency band of 1.2–3 GHz [22]. Therefore, changes in the volume of blood in the brain will change the overall conductivity and dielectric constant of the brain, and changes in the conductivity and dielectric constant of the brain will change the amplitude attenuation and phase change of the electromagnetic wave passing through the cranial cavity. This change can be reflected by the scattering parameter S21. This provides a rationale for measuring and identifying hemorrhagic stroke and ischemic stroke.
In the experiment system, the S-parameter matrix is measured through a vector network analyzer (Agilent E5061B), which includes S11, S21, S12 and S22. The S11 and S22 represent the reflection coefficients of the two ports, and the S21, S12 represent the transmission coefficients between the two ports. The experimental system is a reciprocal network, so the amplitudes and phases of the parameters S21 and S12 are the same, and the amplitudes and phases of the parameters S11 and S22 are also identical. In this system, the antennas are arranged on both sides of the rabbit’s head, so the parameter S21 is closely related to the measured object between the antennas. However, the reflection coefficient S11 is not suitable for global detection of the brain, and it may be more advantageous in other detection systems. In fact, in the following experiments we found that the S21 parameter was the most sensitive to bleeding and ischemia, so the S21 parameter was chosen as the basis of detection.
2.3Animal model
2.3.1Animal model of cerebral hemorrhage
In this experiment, we used the autologous blood injection method to establish a model of internal capsule bleeding caused by autologous blood injection in rabbits, as shown in Fig. 3. The specific steps were as follows:
Figure 3.
Model of cerebral hemorrhage.
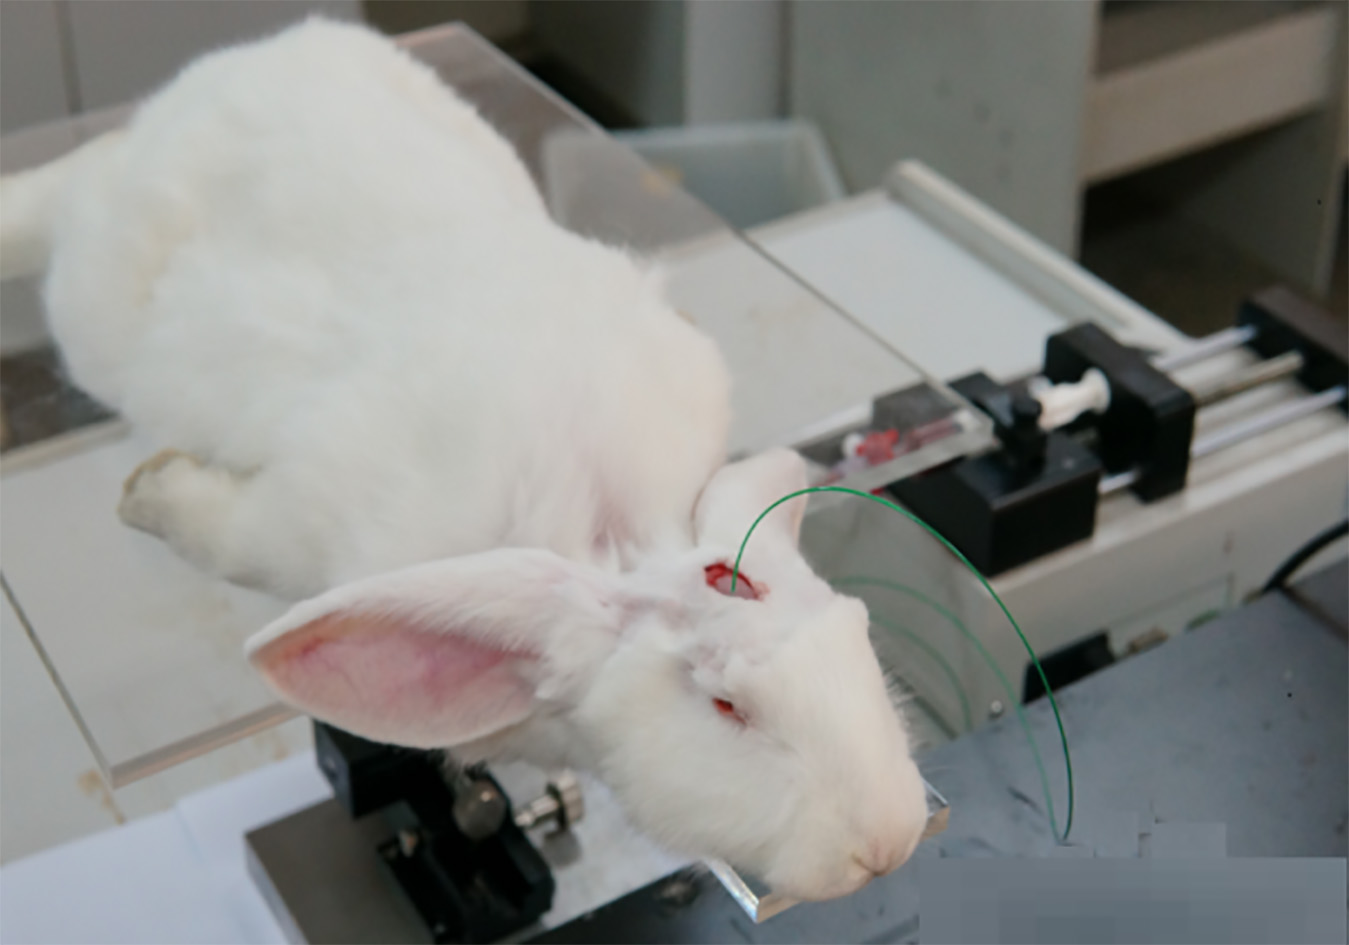
1. Urethane (25%, 5 ml/kg) was used to anesthetize the rabbit through the ear vein, and hair on the posterior limb was removed. A heparin sodium vacuum blood collection tube and a blood collection needle were used to collect 5 ml of blood from the posterior limb medial artery once; after the blood was collected, hemostasis was established.
2. After hemostasis, the rabbit was placed in the prone position and fixed into a stereotactic device. Along the median line, the subcutaneous fascia was peeled away to expose the skull, and the periosteum was removed. The sutures that resemble the Chinese characters for “ten” and “person” were exposed. Using the intersection of the sutures as the base point, the needle was inserted 6 mm to the right along the coronal suture and 1 mm to the back along the sagittal suture.
3. A dental drill (diameter, 1 mm) was used to drill the skull, and the plastic tube containing the blood (diameter, 1 mm) was used to rapidly puncture the skull perpendicularly to a depth of 13 mm. Local compression was used to stop the bleeding for 2 minutes. After the bleeding completely stopped, the hole was sealed with dental glue.
2.3.2Animal model of cerebral ischemia
The cerebral ischemia model was prepared using bilateral common carotid artery clamping plus hypotension, which is a global cerebral ischemia model that closes the bilateral common carotid artery (CCA) and lowers the blood pressure at the same time, as shown in Fig. 4. There are two ways to create hypotension. First, the blood pressure can be lowered by femoral artery bleeding. Otherwise, the blood pressure can be lowered to 40 mmHg (7.5 mmHg
Figure 4.
Model of cerebral ischemia.
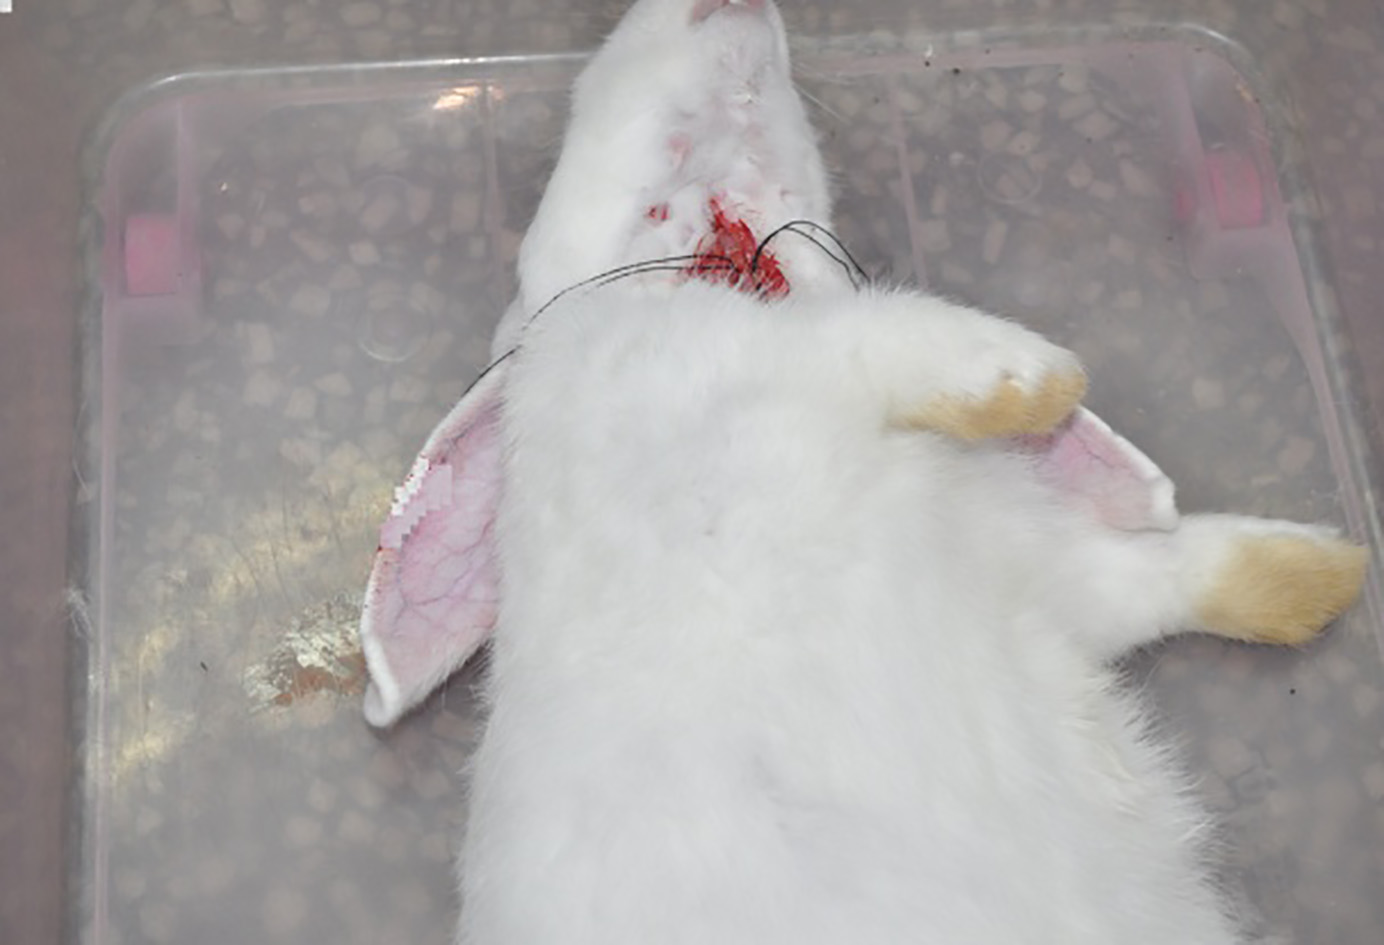
After completing the bilateral common carotid artery ligation in the rabbit, when the bloodletting operation is continued, the arterial blood pressure needs to be monitored in real time. We used the RM6280 biosignal acquisition and processing system to monitor the blood pressure. One end of the sensor was connected to a three-way catheter of a blood vessel cannula, and the other end was inserted into the hardware interface of the RM6280 biosignal acquisition and processing system. After bleeding, the arterial pressure changed from 102.45 mmHg to 53.96 mmHg.
3.Results and analysis
We selected 14 rabbits, both male and female, for the experiment. They weighed approximately 2.3 kg. Eight rabbits were included in the cerebral hemorrhage group, and six rabbits were included in the cerebral ischemia group. The ambient temperature during the experiment was between 15 and 25 degrees, and the air humidity was between 60% and 70%. The animals were fed normally 6 hours before the experiment. The animals were obtained from the Animal Experimental Center of the Army Medical University.
3.1Processing and analysis of hemorrhage experimental data
Eight rabbits were included in the cerebral hemorrhage experiment. For each test rabbit, S21 was measured once for 1 ml, 2 ml, 3 ml, and 4 ml of bleeding and without bleeding; all postbleed data were subtracted from the no-bleeding measurement data to obtain the source data for later processing.
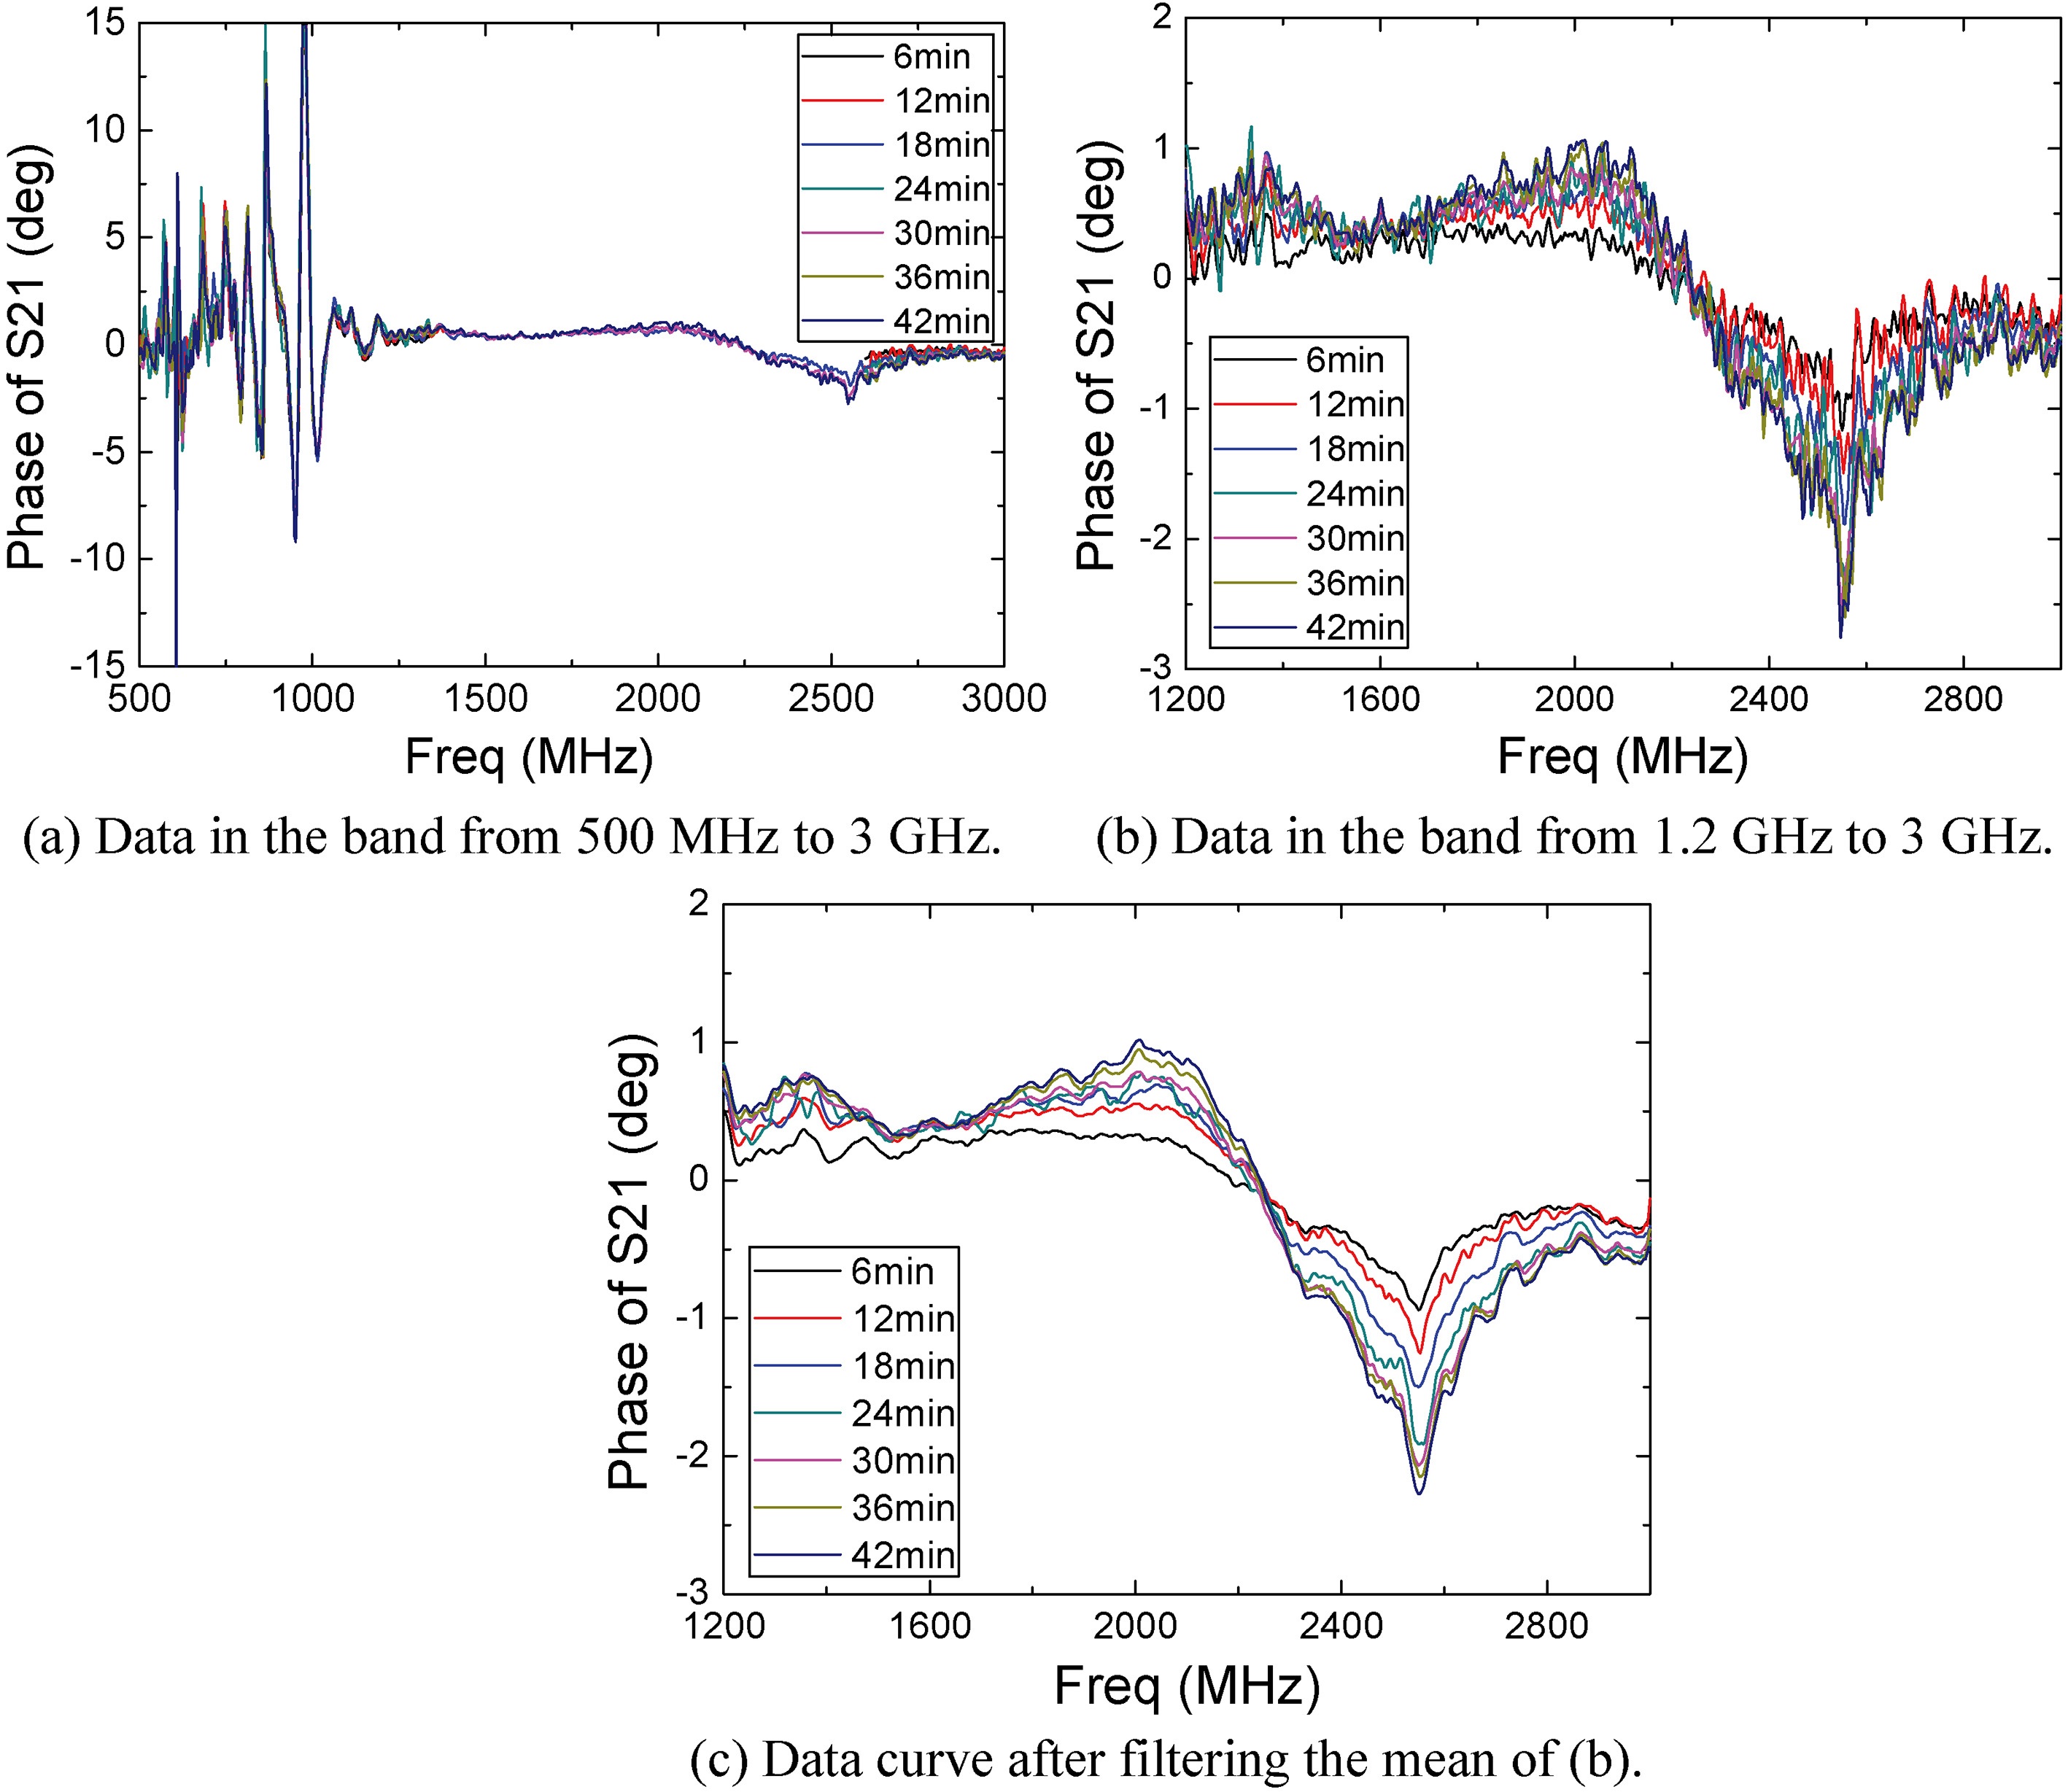
As shown in Fig. 5a, the detection signal showed poor stability in the frequency range from 500 MHz to 1.2 GHz, while the data in the frequency range of 1.2–3 GHz was relatively stable; thus, we chose data in that range for further analysis as raw cerebral hemorrhage data detected, as shown in Fig. 5b.
Figure 5.
Phase of S21 obtained from the bleeding test.
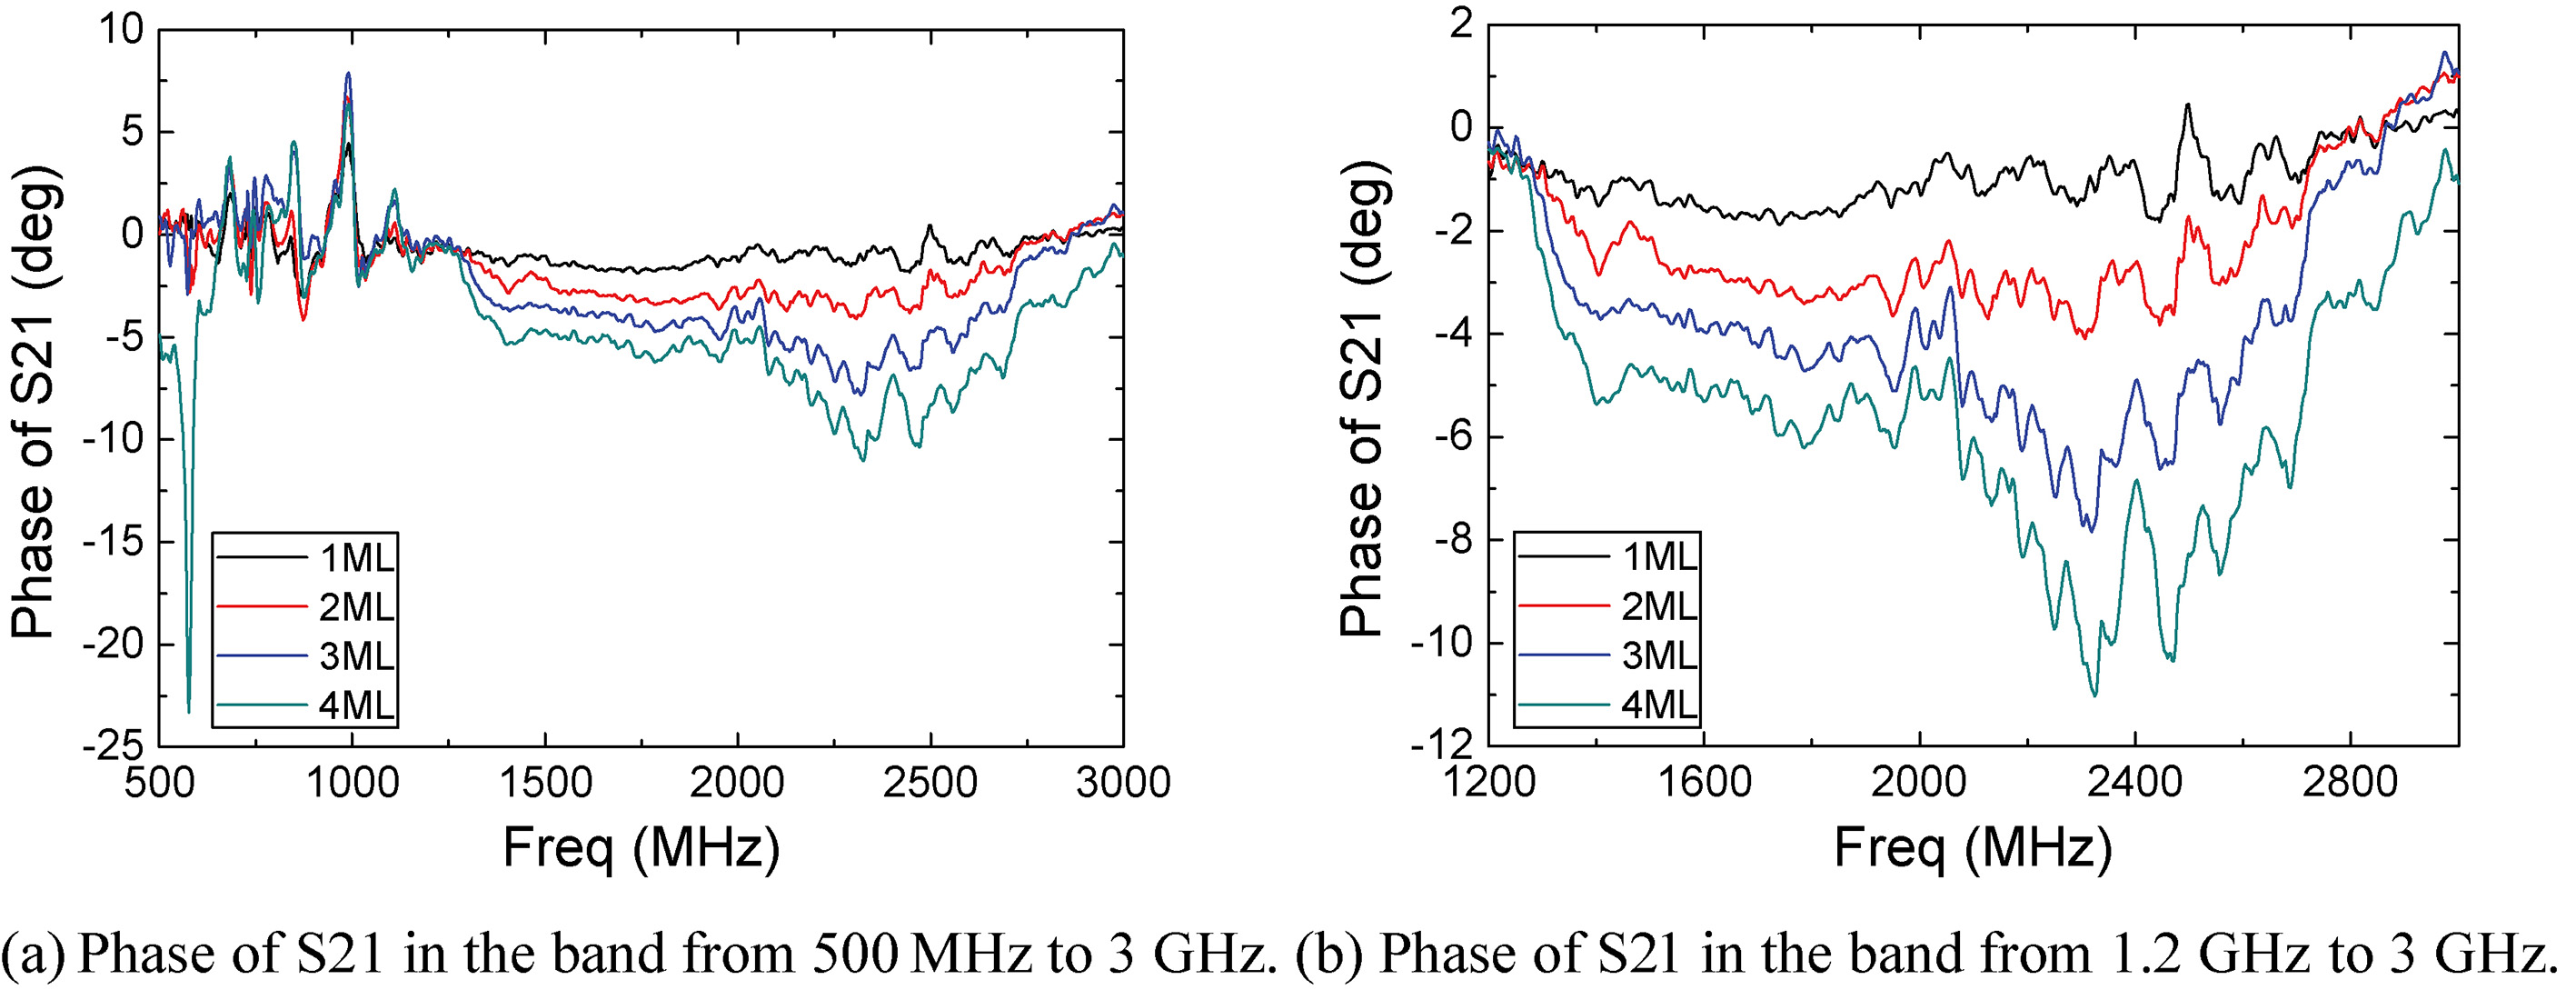
Figure 6.
Phase of S21 after mean filtering.
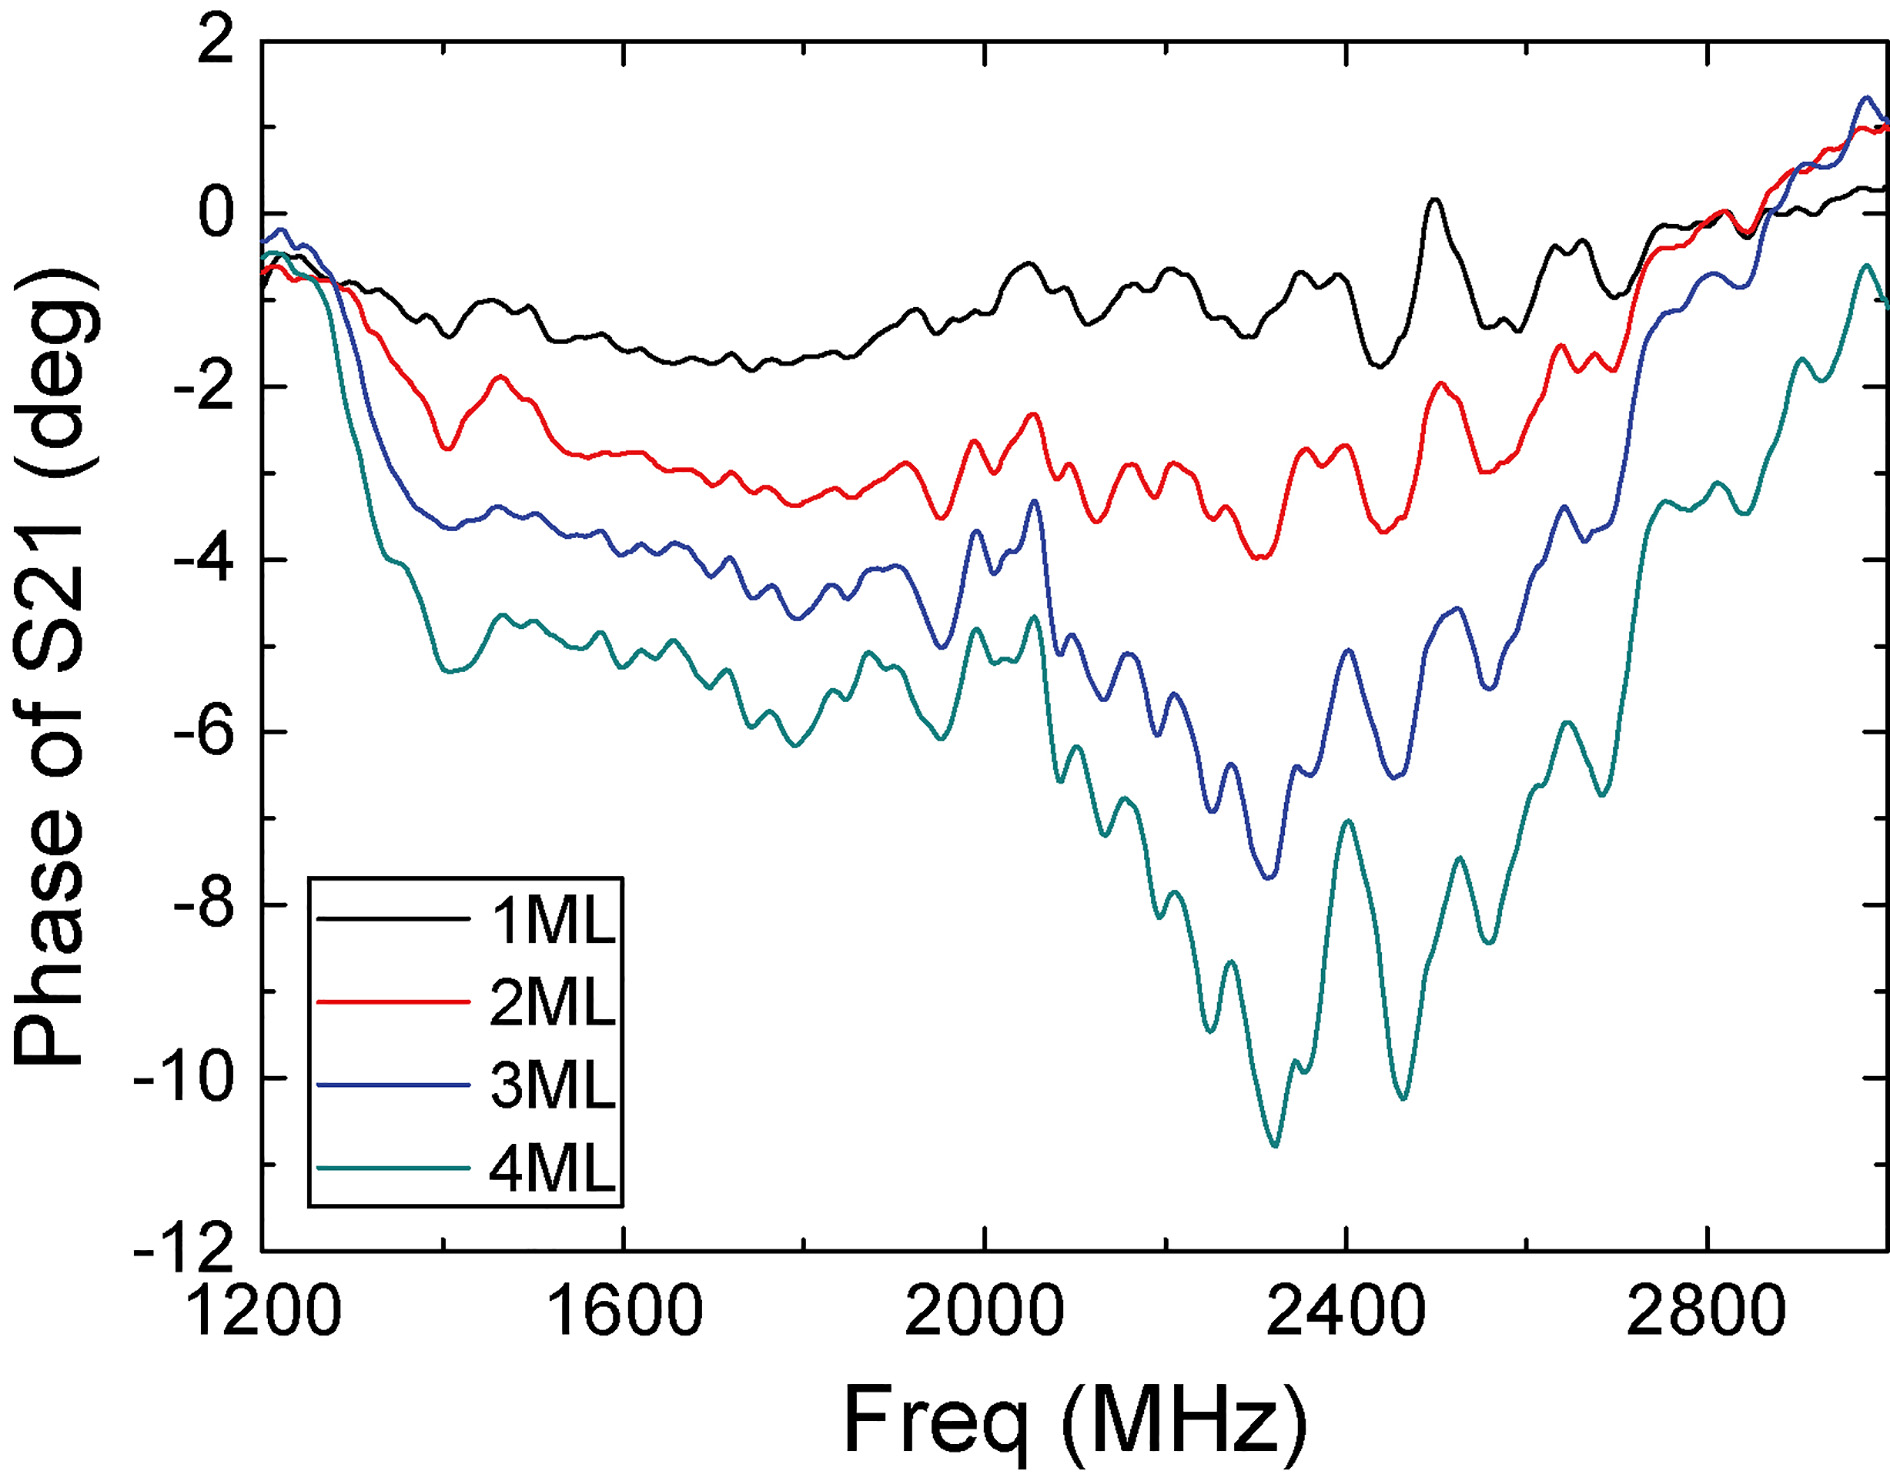
As shown in Fig. 5b, the position of the band with the highest detection sensitivity was approximately 2.5 GHz. Among these microwave scattering parameters, the S21 phase data directly reflect the amount of bleeding. With the change in bleeding volume from 1 mL to 2 mL, 3 mL and 4 mL, the corresponding S21 phase gradually increased in the negative direction.
Figure 5b shows that the phase curves were disturbed by noise, resulting in fluctuations; thus, noise reduction processing was performed by means of average filtering, and the processed curves are shown in Fig. 6.
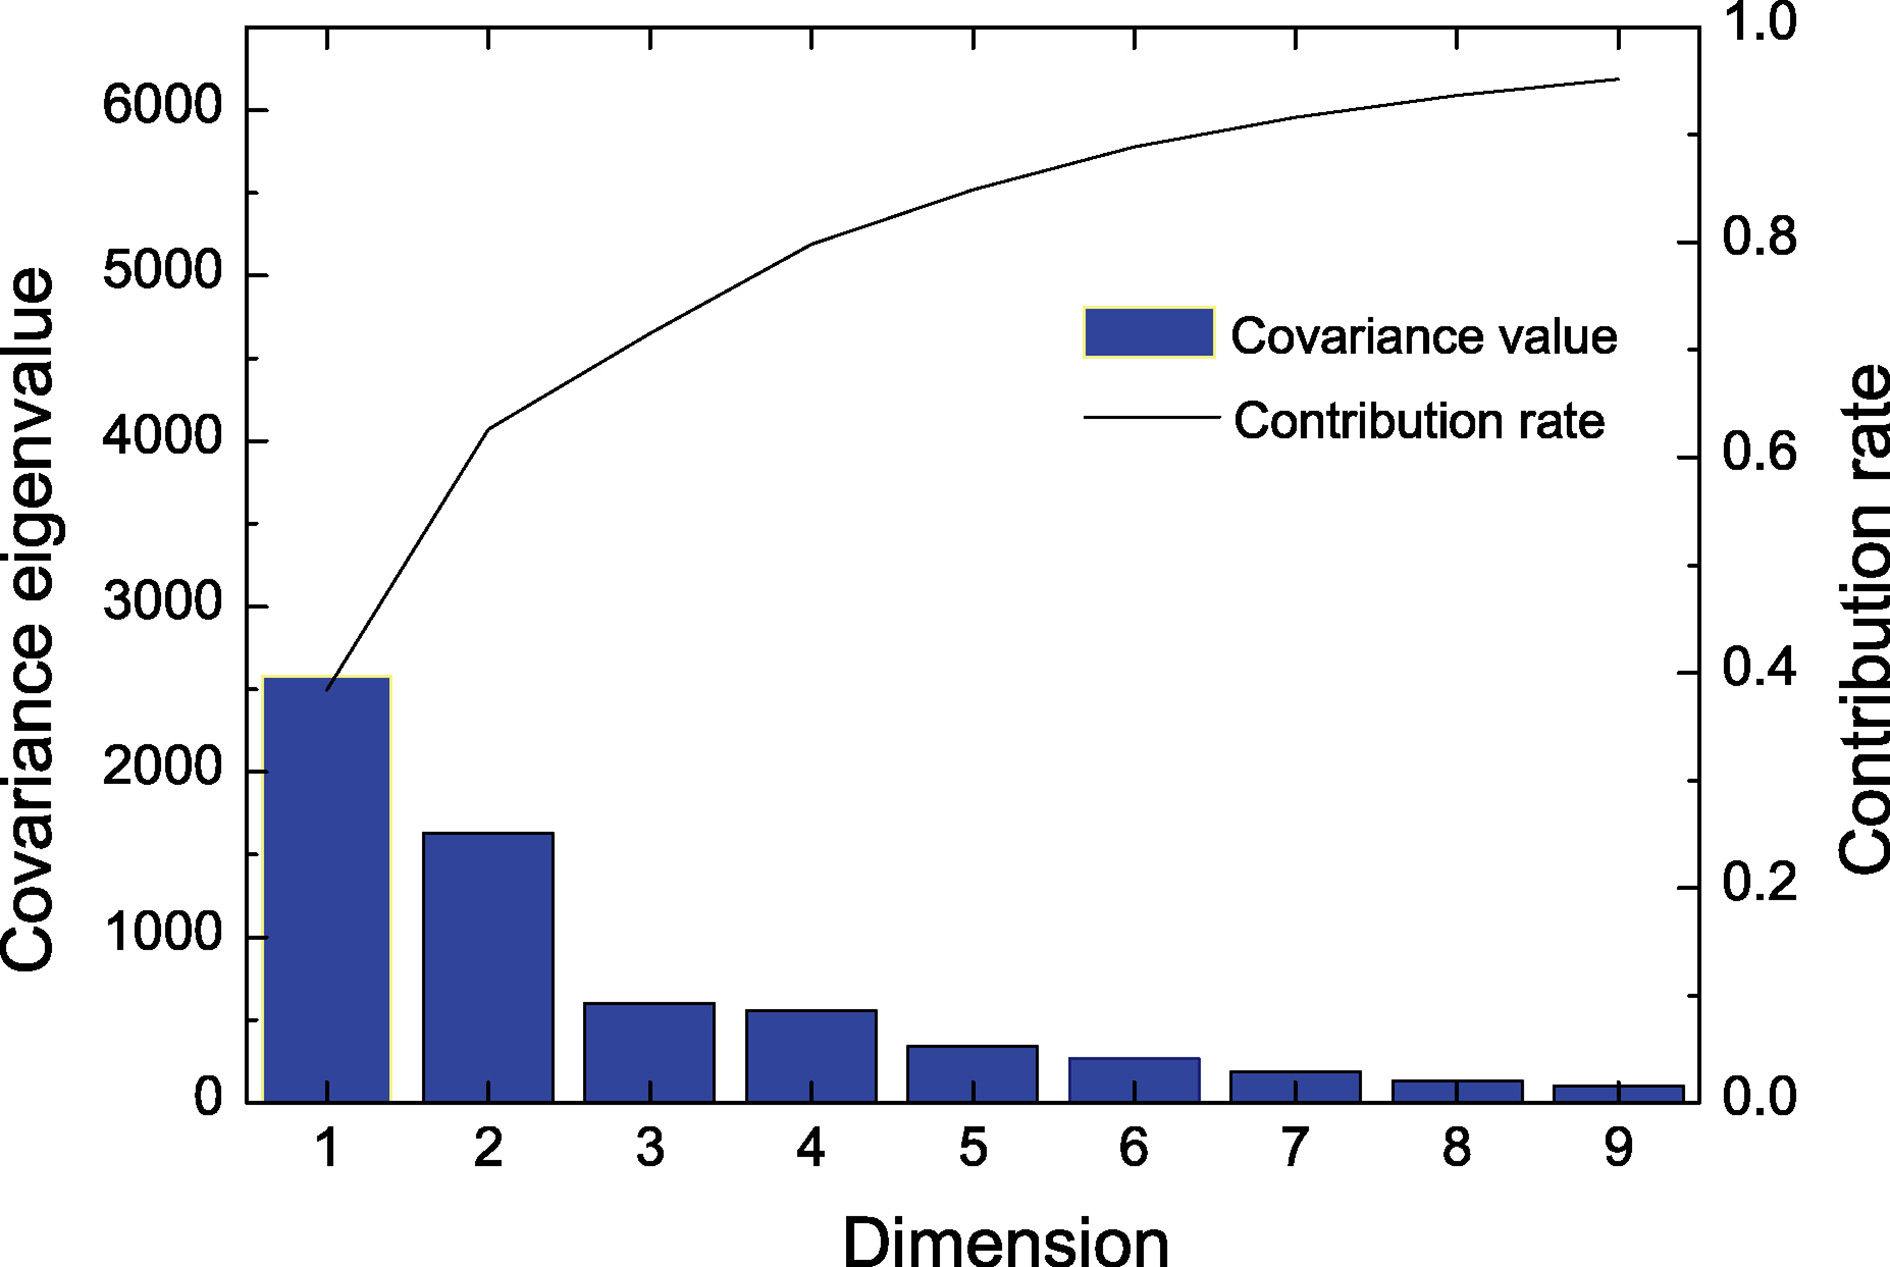
Because of the high similarity of the data between similar frequency points and the large quantity of redundant data, it was necessary to reduce the data to improve the processing efficiency. The sample data were reduced by principal component analysis. The sampling interval was 3 MHz in the frequency range from 1.2–3 GHz, so the phase measurement data of 1 rabbit was represented by a vector of 601
For the processed component matrix, nearest neighbor cluster analysis was used to determine the amount of bleeding, the degree of ischemia or the type of stroke in the subjects. Nearest neighbor clustering analysis is a multivariate statistical analysis method for classification. The general rule is to classify points with a larger “similarity coefficient” or “distance” in the same category and to do the same for points with a smaller “similarity coefficient” or “distance”; larger points are classified into different classes.
In the hemorrhage group, the data of all eight rabbits were included; seven datasets were used as original samples, and the remaining dataset was used as the sample to be tested. After training, the volume of blood was determined by the sample to be tested. One of the eight rabbits was used as a test sample, as shown in Tables 1 and 2. The final results were obtained by calculating and analyzing the bleeding volume of 2 ml (training dataset and sample dataset, including only 1 ml and 3 ml of bleeding, or only 2 ml and 4 ml of bleeding and microwave scattering parameter acquisition data).
Table 1
Difference between 1 ml and 3 ml of bleeding
| Rabbit 1 | Rabbit 2 | Rabbit 3 | Rabbit 4 | Rabbit 5 | Rabbit 6 | Rabbit 7 | Rabbit 8 | |
| 1 ml |
|
|
|
|
|
|
|
|
| 3 ml |
|
|
|
|
|
|
|
|
Table 2
Difference between 2 ml and 4 ml of bleeding
| Rabbit 1 | Rabbit 2 | Rabbit 3 | Rabbit 4 | Rabbit 5 | Rabbit 6 | Rabbit 7 | Rabbit 8 | |
| 2 ml |
|
|
|
|
|
|
|
|
| 4 ml |
|
|
|
|
|
|
|
|
Figure 7.
Dimensionality reduction.
In Tables 1 and 2, “
All the rabbits were correctly distinguished in the case of 1 ml and 2 ml of bleeding, as shown in Fig. 8, but the accuracy of identifying 3 ml and 4 ml of bleeding was 87.5%, while the accuracy of distinguishing between blood volumes with a difference of 2 ml (1 ml vs 3 ml or 2 ml vs 4 ml of bleeding) was 93.75%.
Figure 8.
Rate of correct discrimination in rabbits with different bleeding volumes (All
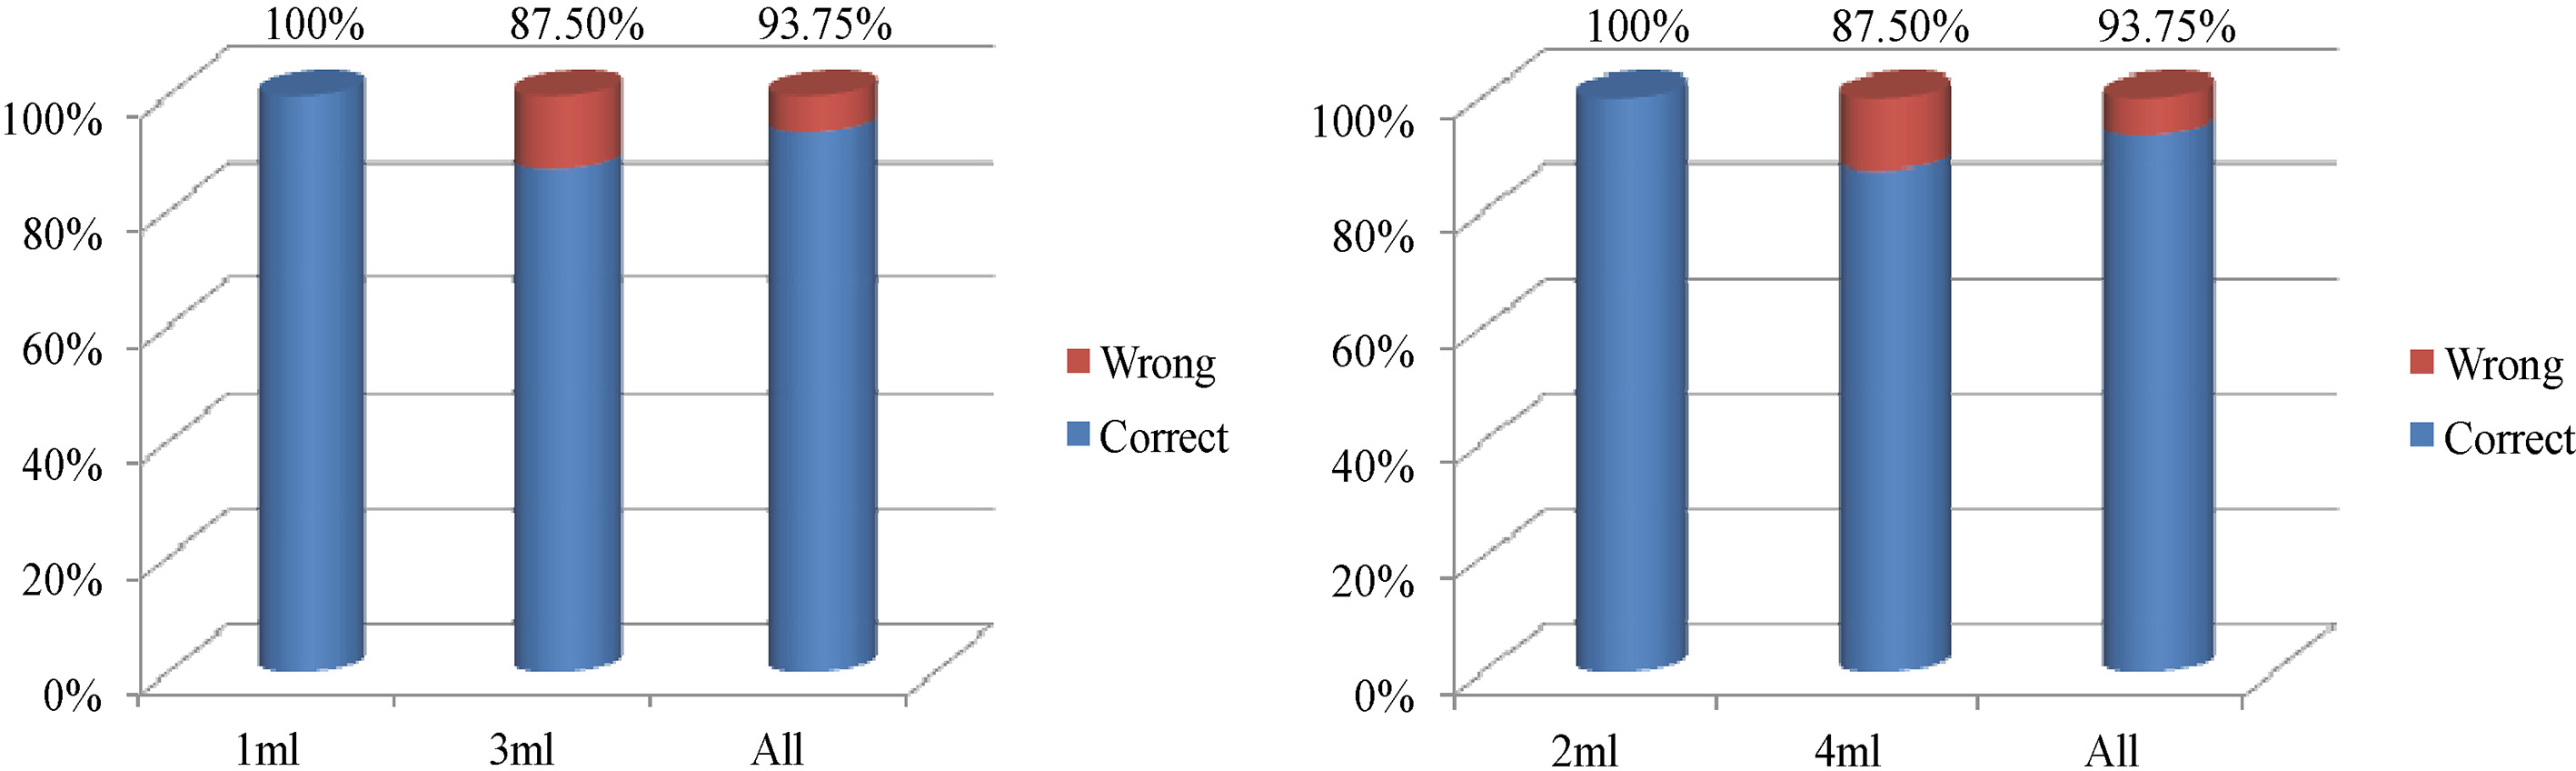
Figure 9.
Data obtained in the ischemia experiment.
The above experimental results of cerebral hemorrhage detection indicate that 1) the change in the S21 phase reflects the bleeding volume, with larger phase differences reflecting larger bleeding volumes, and 2) the detection system described herein has 93.75% accuracy in distinguishing between blood volumes with a difference of 2 ml.
3.2Processing and analysis of ischemia experimental data
Table 3
Experimental results of six rabbits with an ischemic interval of 24 minutes in group 1
| Rabbit 1 | Rabbit 2 | Rabbit 3 | Rabbit 4 | Rabbit 5 | Rabbit 6 | |
|---|---|---|---|---|---|---|
| 6 min |
|
|
|
|
|
|
| 30 min |
|
|
|
|
|
|
Table 4
Experimental results of six rabbits with an ischemic interval of 24 minutes in group 2
| Rabbit 1 | Rabbit 2 | Rabbit 3 | Rabbit 4 | Rabbit 5 | Rabbit 6 | |
|---|---|---|---|---|---|---|
| 18 min |
|
|
|
|
|
|
| 42 min |
|
|
|
|
|
|
Table 5
Experimental results of rabbits with no ischemia and an ischemic interval of 42 minutes
| Rabbit 1 | Rabbit 2 | Rabbit 3 | Rabbit 4 | Rabbit 5 | Rabbit 6 | |
|---|---|---|---|---|---|---|
| 0 min |
|
|
|
|
|
|
| 42 min |
|
|
|
|
|
|
Figure 10.
Discriminative accuracy among rabbits with different degrees of ischemia (All
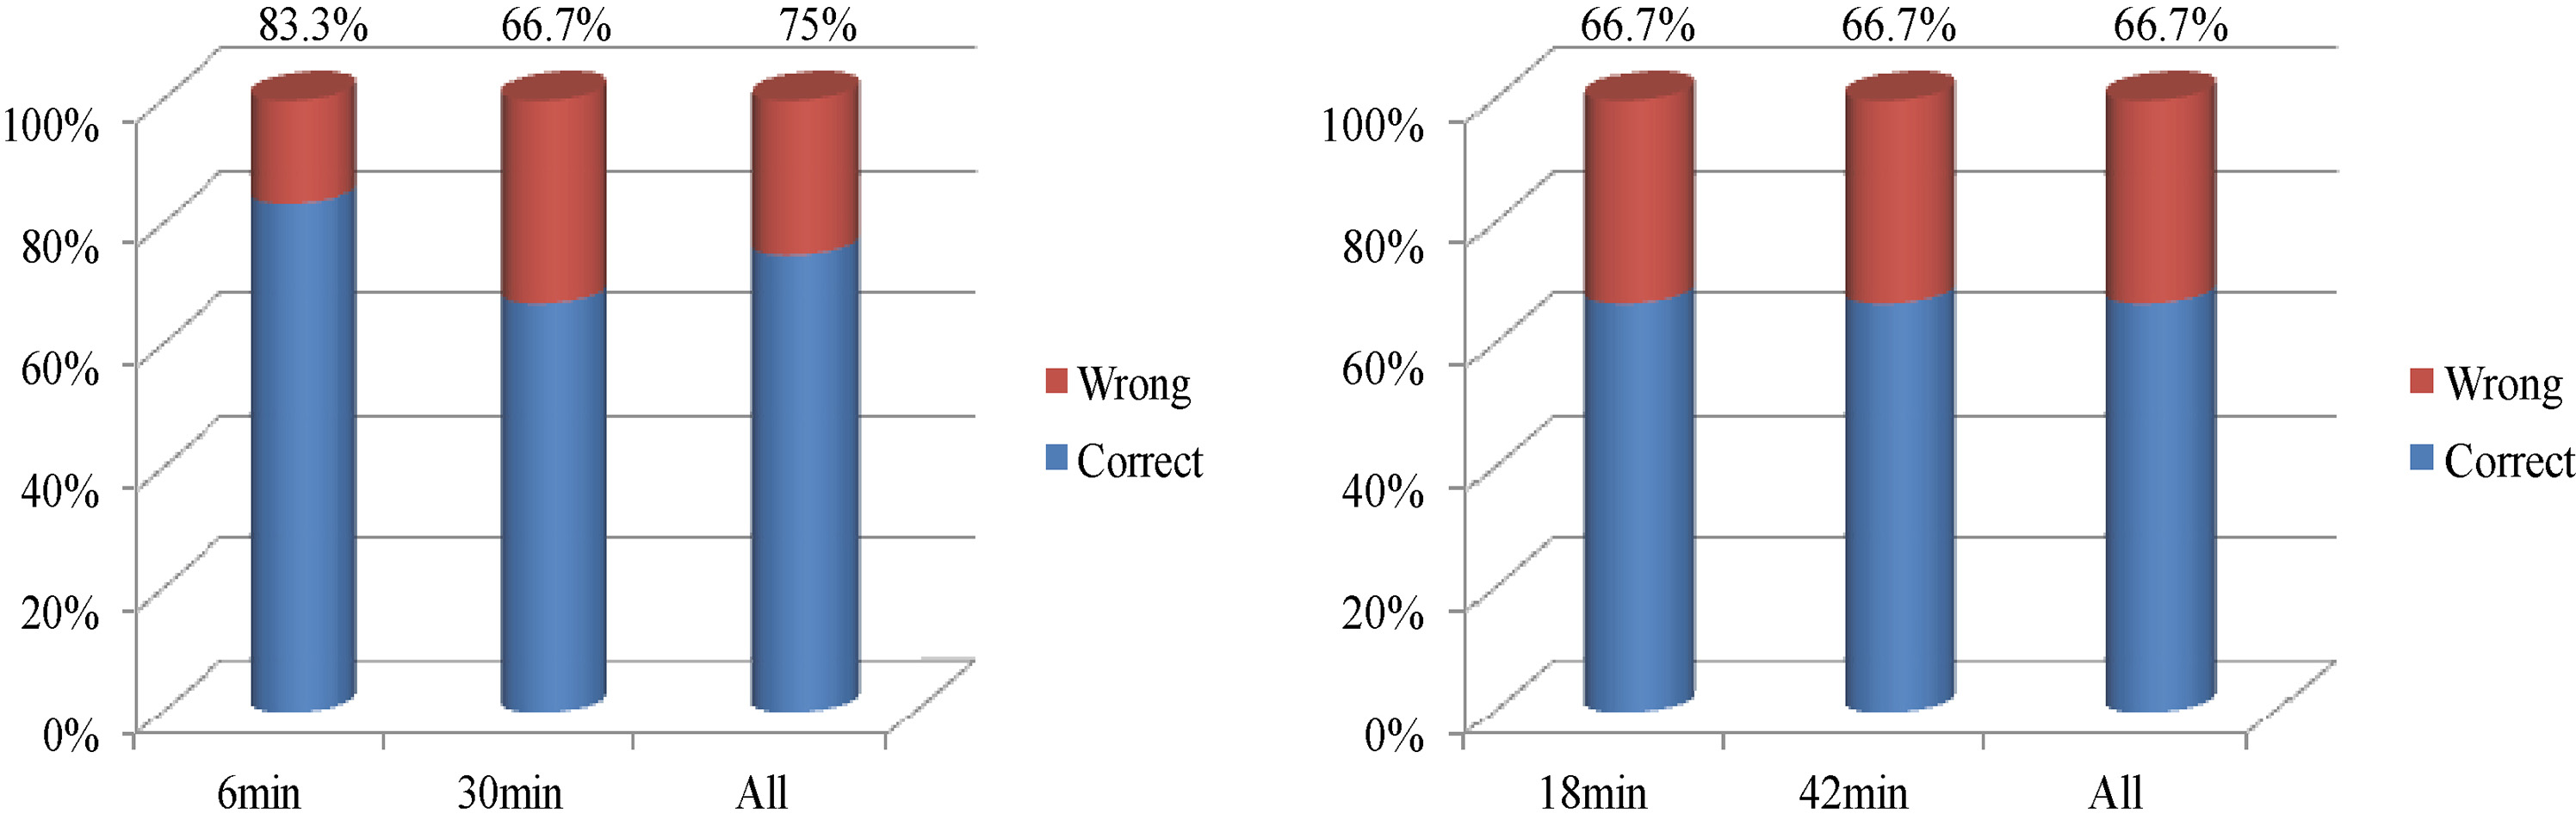
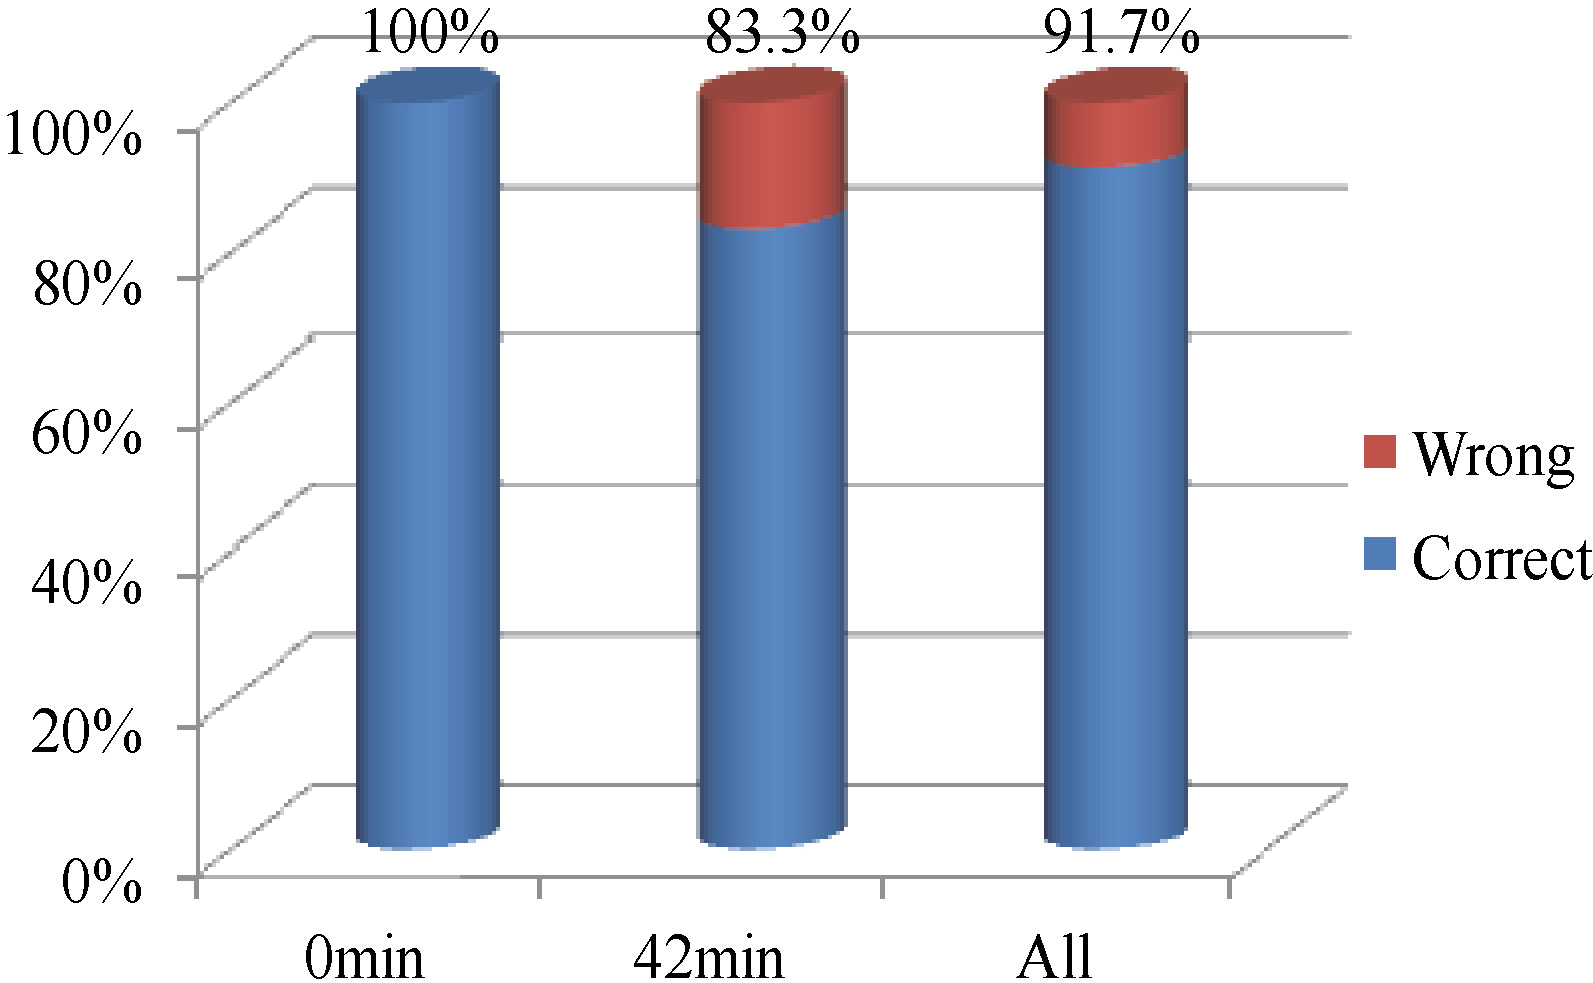
Figure 11.
Discriminative accuracy among rabbits with different degrees of ischemia (All
Measurements of the bilateral common carotid arteries were made every 6 minutes until 1 hour after ligation for each rabbit, and then all measured data after ligation were subtracted from those before ligation to obtain the source data for subsequent processing. The processing of the source data was the same as that in the bleeding experiment. Figure 9 shows the test data of a representative rabbit experiment, which is the same as in the bleeding experiment; finally, data in the frequency range of 1.2 GHz to 3 GHz were selected.
Six rabbits were included in the ischemia group. One rabbit was selected as the test sample each time, and the data of the other five rabbits were used as the training samples. We classified the ischemia severity after 6 minutes and 30 minutes and after 18 minutes and 42 minutes; both pairs of timepoints were separated by a 24-minute interval. The results are shown in Tables 3 and 4.
Tables 3 and 4 and Fig. 10 show that the accuracy of the detection system in rabbits with cerebral ischemia at an interval of 24 minutes is 75% and 66.7% in groups 1 and 2, respectively. Finally, the rabbits were tested with an ischemic interval of 42 minutes, as shown in Table 5.
Table 5 shows the difference between 0 and 42 minutes in the 6 ischemic test samples. Detection only failed in the last sample, yielding an overall accuracy of 91.7%, as shown in Fig. 11.
3.3Comparison of cerebral hemorrhage and ischemia
In this study, the differentiation of stroke types for different degrees of hemorrhage and ischemia was analyzed.
(1) Differential diagnosis of cerebral hemorrhage and cerebral ischemia in the case of the maximum difference.
The maximum difference in the animal models described herein is determined by the maximum degree of the bleeding (4 ml of intracerebral hemorrhage) and the maximum degree of ischemia (42 minutes of ischemia).
Figure 12 shows that the detection system could completely distinguish between hemorrhage and ischemia by comparing the two cases with the largest difference.
Figure 12.
Differential diagnostic accuracy in the case of max and min difference (min
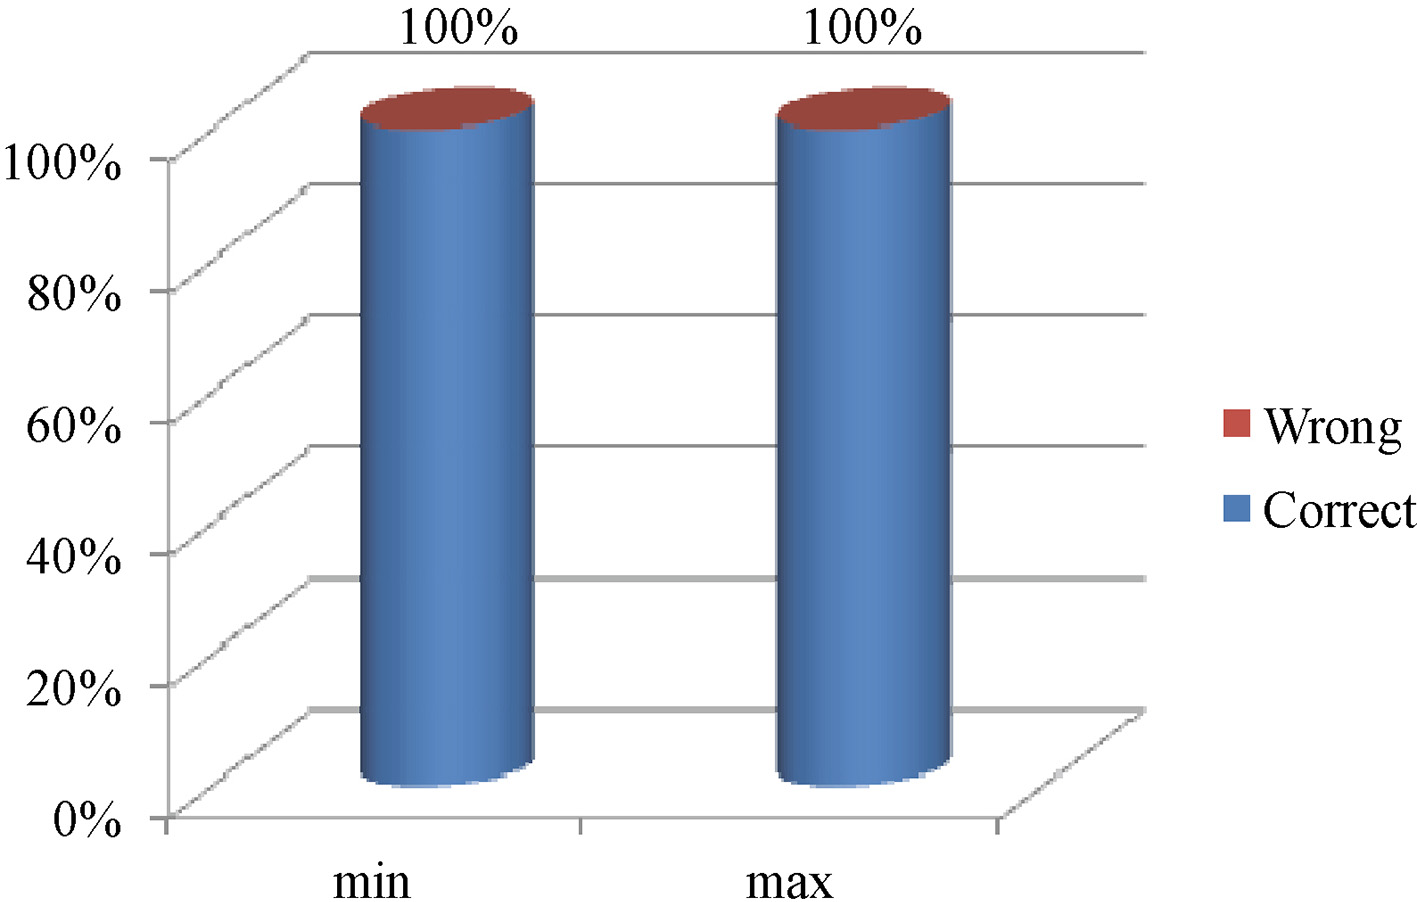
(2) Differential diagnosis of cerebral hemorrhage and cerebral ischemic in the case of the minimum difference.
The minimum difference refers to the comparison of the mildest cerebral hemorrhage (1 ml of intracerebral hemorrhage) and minimal cerebral ischemic interval (6 minutes of ischemia) in the animal models. In the differentiation of 1 ml of hemorrhage in eight rabbits in the hemorrhage group and 6 minutes of ischemia in six rabbits in the ischemia group, we found that all identification results were correct. Figure 12 indicates that even with the minimal difference, this approach correctly identified cerebral hemorrhage and cerebral ischemia in 14 rabbits.
4.Discussion
Through the detection and discrimination of ischemia in rabbits, the following observations can be made:
1. The phase of the scattering parameter S21 increases with gradually increasing severity of ischemia; thus, the phase of S21 can reflect the ischemic condition in the cerebral ischemia model.
2. Due to individual differences and other factors, the relationship between the severity of ischemia and the ischemic interval for each rabbit was not the same. The S21 phase difference after 42 minutes of ischemia varied on average from 0.8 to 1.5
3. Among the six test rabbits in the cerebral ischemia group in this paper, the accuracy of distinguish samples separated by an ischemic interval of 24 minutes was 70.8%, and that of an ischemic interval of 42 minutes was 91.7%.
The experimental system has the advantages of being inexpensive, portable, noninvasive, simple to operate and able to provide fast measurements. It is a very promising method for identifying types of prehospital cerebral apoplexy.
However, the distribution of the microwave field is a complex problem. This paper addresses the problem of diagnosing the type of stroke via a data-driven approach. The field distribution is to be studied in the future. The detection system used in this paper is based on microwave measurement theory. Some interference electromagnetic that comes from free space influences the brain detection experiments by the microwave measurement system in the paper. In the future, an important work will be done to establish electromagnetic shielding for the detection system to resist the interference electromagnetic from free space. It can be implemented by adopting the microwave shielding material [23] or the microwave absorbing material [24], which have been widely used for military.
This article is based on animal experiments, but the number of experimental samples was not large, as we included eight rats in the hemorrhage group. Although the experimental results show that the condition of all 14 rabbits was correctly identified, the sample size is still small. More rabbit experiments are needed to verify the 100% accuracy of the identification system. The sample size will be increased in future work.
5.Conclusion
Based on animal models of cerebral hemorrhage and cerebral ischemia, a microwave scattering parameter measurement system was designed. The microwave scattering parameters in the two models were measured and classified according to the measured data. The experimental results show the following: (1) The stroke microwave-based authentication system is capable of identifying cerebral hemorrhage and cerebral ischemia in rabbit models. (2) The measurement system is capable of measuring differences in cerebral hemorrhage; the phase of the measured scattering parameter S21 gradually decreases as the blood volume gradually increases. (3) The measurement system is capable of measuring differences in cerebral ischemia; the phase of the measured scattering parameter S21 gradually increases as the length of the ischemic period increases. (4) The measurement system can rely on the measured data to determine the severity of bleeding in the cerebral hemorrhage model; the accuracy of the cerebral hemorrhage model with a blood loss interval of 2 ml reached 93.75%. (5) The measurement system can rely on the measured data to determine the ischemic severity in the cerebral ischemia model; the discriminative accuracy of the animal model with an ischemic interval of 24 minutes was 70.8%, and that of the cerebral ischemia model with an ischemic interval of 42 minutes was 91.7%.
Acknowledgments
This work was supported by the National Nature Science Foundation of China (no. 61801483), the Military Scientific Research (no. LJ2018B020152), and the Natural Science Foundation of Chongqing, China (no. cstc2018jcyjAX0671). The funders had no role in the study design, data collection and analysis, decision to publish, or preparation of the manuscript.
Conflict of interest
None to report.
References
[1] | Feigin VL, Krishnamurthi R. Stroke is largely preventable across the globe: Where to next? Lancet, (2016) ; 388: (10046): 733-734. |
[2] | Committee ESOE. Guidelines for management of ischemic stroke and transient ischemic attack. Cerebrovasc Dis, (2008) ; 25: : 457-507. |
[3] | Newman DH. Thrombolysis in acute stroke. Lancet, (2015) ; 385: (9976): 1395. |
[4] | Mcdowell MM, Kellner CP, Barton SM, et al. The role of advanced neuroimaging in intracerebral hemorrhage. Neurosurgical Focus, (2013) ; 34: (E24). |
[5] | Abedi V, Goyal N, Tsivgoulis G, et al. Novel screening tool for stroke using artificial neural network. Stroke, (2017) ; 48: (6). |
[6] | Fassbender K, Balucani C, Walter S, et al. Streamlining of prehospital stroke management: The golden hour. Lancet Neurol, (2013) ; 12: (6): 585-596. |
[7] | Goyal N, Tsivgoulis G, Male S, et al. FABS an intuitive tool for screening of stroke mimics in the emergency department. Stroke, (2016) ; 47: (9). |
[8] | Guo L, Abbosh A. Stroke localization and classification using microwave tomography with k-means clustering and support vector machine. Bioelectromagnetics, (2018) ; 4: (39): 312-324. |
[9] | Anonymous. Thrombolysis for stroke: Clinical judgment at its apogee. Lancet, (2015) ; 385: (9976): 1366. |
[10] | Meretoja A, Strbian D, Mustanoja S, et al. Reducing in-hospital delay to 20 minutes in stroke thrombolysis. Neurology, (2012) ; 79: (4): 306-313. |
[11] | Investigators CASP. Prioritizing interventions to improve rates of thrombolysis for ischemic stroke. Neurology, (2005) ; 64: : 654-659. |
[12] | A review on animal models of stroke – An update. (2016) . |
[13] | Candefjord S, Winges J, Malik AA, et al. Microwave technology for detecting traumatic intracranial bleedings-tests on phantom of subdural hematoma and numerical simulations. Medical & Biological Engineering & Computing, (2017) ; 55: (8): 1177-1188. |
[14] | Bjelogrlic M, Volery M, Fuchs B, Thiran J-P, Mosig JR, Mattes M. Stratified spherical model for microwave imaging of the brain: Analysis and experimental validation of transmitted power. Microwave and Optical Technology Letters, (2018) ; 4: (60): 1042-1048. |
[15] | Inum R, Rana M, Shushama KN, Quader A. EBG Based Microstrip Patch Antenna for Brain Tumor Detection via Scattering Parameters in Microwave Imaging System. International Journal of Biomedical Imaging, (2018) : 1-12. |
[16] | Peyman A, Holden SJ, Watts S, et al. Dielectric properties of porcine cerebrospinal tissues at microwave frequencies: In vivo, in vitro and systematic variation with age. Physics in Medicine, (2007) ; 52: (8): 2229-2245. |
[17] | Salucci M, Vrba J, Merunka I, et al. Real-time brain stroke detection through a learning-by-examples technique An experimental assessment. Microwave and Optical Technology Letters, (2017) : 2796-2799. |
[18] | Schmid G, Neubauer G, Mazal PR. Dielectric properties of human brain tissue measured less than 10 h postmortem at frequencies from 800 to 2450 MHz. Bioelectromagnetics, (2003) ; 24: (6): 423-430. |
[19] | Yu Y, Mckelvey T. A unified subspace classification framework developed for diagnostic system using microwave signal, (2013) . |
[20] | Zhang H, Chen M, Jin G, Xu J, Qin M. Experimental Study on the Detection of Cerebral Hemorrhage in Rabbits Based on Broadband Antenna Technology. Computer Assisted Surgery, (2019) : 2. |
[21] | Gabriel S, Lau RW, Gabriel C. The dielectric properties of biological tissues: II. Measurements in the frequency range 10 Hz to 20 GHz. Physics in Medicine and Biology, (1996) ; 41: (11): 2251-2269. |
[22] | Andreuccetti D, Fossi R, Petrucci C. An Internet resource for the calculation of the dielectric properties of body tissues in the frequency range 10 Hz–100 GHz. Website at http://niremf.ifac.cnr.It/tissprop/, (1997) . |
[23] | Magisetty R, Shukla A, Kandasubramanian B. Terpolymer (ABS) cermet (Ni-NiFe2O4) hybrid nanocomposite engineered 3D-carbon fabric mat as a X-band electromagnetic interference shielding material. Materials Letters, (2019) ; 238: (1): 214-217. |
[24] | Magisetty R, Shukla A, Kandasubramanian B. Magnetodielectric microwave radiation absorbent materials and their polymer composites. Journal of Electronic Materials, (2018) ; 47: (11): 6335-6365. |


