
Analysis of physiological data from long- term physical exercise: A basis for improving the health of rural residents of Korea
Abstract
BACKGROUND:
Analysis of the change pattern of a user’s physiological signals collected over a long time and user health information prediction technology based on personal history data can provide the user with accurate health information.
OBJECTIVE:
In this study, we analyzed the change pattern of health information that was altered by performing personal training (PT) at the beginning of the study and subsequently quitting exercise and only performing activities of daily living (ADL).
METHODS:
The subject performed PT for 75 days, and then consistently performed relatively simple ADL, such as standing, sitting, and walking, for 325 days that followed. After 400 days, the health information was analyzed through the change patterns of various physiological signals. Personal exercise information and heart rate data were collected through a smart watch (Apple watch Nike
RESULTS:
We found that the weight and body fat rate linearly decreased and the body muscle rate increased for the first 75 days when hard training was performed whereas they repeatedly increased or decreased when only ADL were performed. As the daily exercise distance increased, weight and body fat rate tended to decrease while body muscle rate tended to increase. There was no significant change in the weight, body fat rate, and body muscle rate while daily activities were performed, but continuous exercise is expected to improve cardiac function by increasing the cardiac output of the heart.
CONCLUSION:
We expected that the simple physiological data measured with smart watches and smart scales can be used for the health management of the elderly living in rural areas in the future.
1.Introduction
Due to rapid aging in Korea, the elderly population over 65 years of age is expected to be 14.3% in 2018 and 41.0% in 2060, and various welfare policies for the elderly are required [1]. This aging rate is accelerating in rural areas compared to urban areas [2], and the aging population in rural areas is becoming a serious problem due to the weakness of physical function related to old age, decreased physical strength due to diseases and health problems [3].
While urban residents can easily receive medical services in real time because cities have sufficient medium and large medical facilities, such as university hospitals, residents in rural areas have difficulty receiving sufficient medical services when required due to relatively insufficient medical facilities. Comparative studies on the health levels of and medical facilities for residents in urban and rural areas have been conducted [4, 5, 6]. Many studies have been carried out on insufficient medical services in rural areas, including a study on health levels by gender and residential area and on the difference in the use of medical facilities [7] as well as one on the imbalance of healthcare resources that makes the use of medical services by residents in rural areas relatively more difficult due to the concentration of medical facilities, including large hospitals, and professional medical personnel in cities [8]. As residents in rural areas with relatively poor medical environments cannot reach large hospitals in cities within the golden time – even in emergency situations that require fast medical services, such as cardiovascular and brain diseases – health management strategies are required in everyday life. According to the 2018 statistics on the elderly in South Korea, the proportion of the elderly was highest in Jeonnam (21.8%), followed by Gyeongbuk (19.1%) and Jeonbuk (19.0%), indicating that the proportion of the elderly was high in Korean rural areas. Jeonnam, Gyeongbuk, Jeonbuk, and Gangwon, which include rural areas, exhibited proportions higher than 18%, but metropolitan cities, such as Seoul, Gwangju, and Daejeon, showed proportions lower than 13% [1].
The elderly aged 65 years or older in rural areas often have certain diseases such as degenerative arthritis and back pain. Therefore, it is difficult to select appropriate exercise and it is difficult to actively perform physical activity due to secondary risk such as falls. This study was conducted to investigate the changes of functional fitness and blood pressure and the changes of blood pressure according to walking exercise in the elderly with hypertension in the rural area by using the elastic band, sports dance and yoga [9, 10]. Considering the health status and exercise capacity of the elderly, it is desirable to apply exercises that can increase the range of motion and increase the strength of the joints without any strain on the joints. It should be included in the physical activity plan [11]. It is important for the elderly in rural areas to improve their overall fitness to perform daily living activities. In particular, in addition to the elderly, the population of the pre-elderly aged between 40 and 60 – who are referred to as middle-aged people and are subject to many physical, mental, and social changes as they enter the declining stage of their life – is also increasing. Such middle-aged people require customized health management services because they have relatively less diseases than the elderly with chronic diseases.
In this study, based on the personal physiological signals measured for 400 days, we analyzed changes to the health information, which was acquired through the physical training (PT) performed for the first 75 days and subsequently performing daily activities of everyday life for the next 325 days.
2.Experimental method
2.1Experimental method
An obese subject with a body mass index (BMI) higher than 25 was selected. The basic information of the subject prior to participation was as follows: age, 37 years; height, 177 cm; weight, 90 kg; and BMI, 29. The body fat rate and body muscle rate, which are additional parameters related to obesity, were found to be 29% and 68%, respectively.
Most long-term physical exercise for the elderly usually means a period of 6 months, 12 months, and 30 months [12, 13, 14, 15, 16]. In particular, long-term criteria for diseases related to the daily life of the elderly, such as falls and knee joints, are being studied on the basis of 6 months or 12 months [14, 15, 16]. In this paper, the subject performed two different types of exercises for 400 days. For the first 75 days, the subject performed relatively hard training, such as lunge and squat movements, under the guidance of a personal trainer. The PT under the guidance of the personal trainer was performed for 2–3 hours a day. For the remaining 325 days, the subject did not perform specific exercises, such as workout, swimming, and tennis, but performed exercises with simple and easy movements in everyday life, such as standing, sitting, walking, and running. These two different types of exercises were performed to analyze the change pattern of the health information acquired through the hard training at the beginning of the study period and subsequently performing the simple movements of everyday life without PT.
The obesity parameters of the subject were measured twice a day – immediately after waking up in the morning and immediately before going to bed – using an impedance smart scale (PICOOC S1 Pro, EasySolar). The obesity parameters measured using the smart scale included weight (kg), body fat rate (%), and body muscle rate (%). They were measured for 400 days.
During the experiment period of 400 days, the subject performed PT for the first 75 days and ADL for the remaining 325 days. The exercise parameters involved in everyday life and PT were measured using a smart watch (Apple watch 2 Nike
Figure 1.
Smart devices for measuring the physiological data of the user.
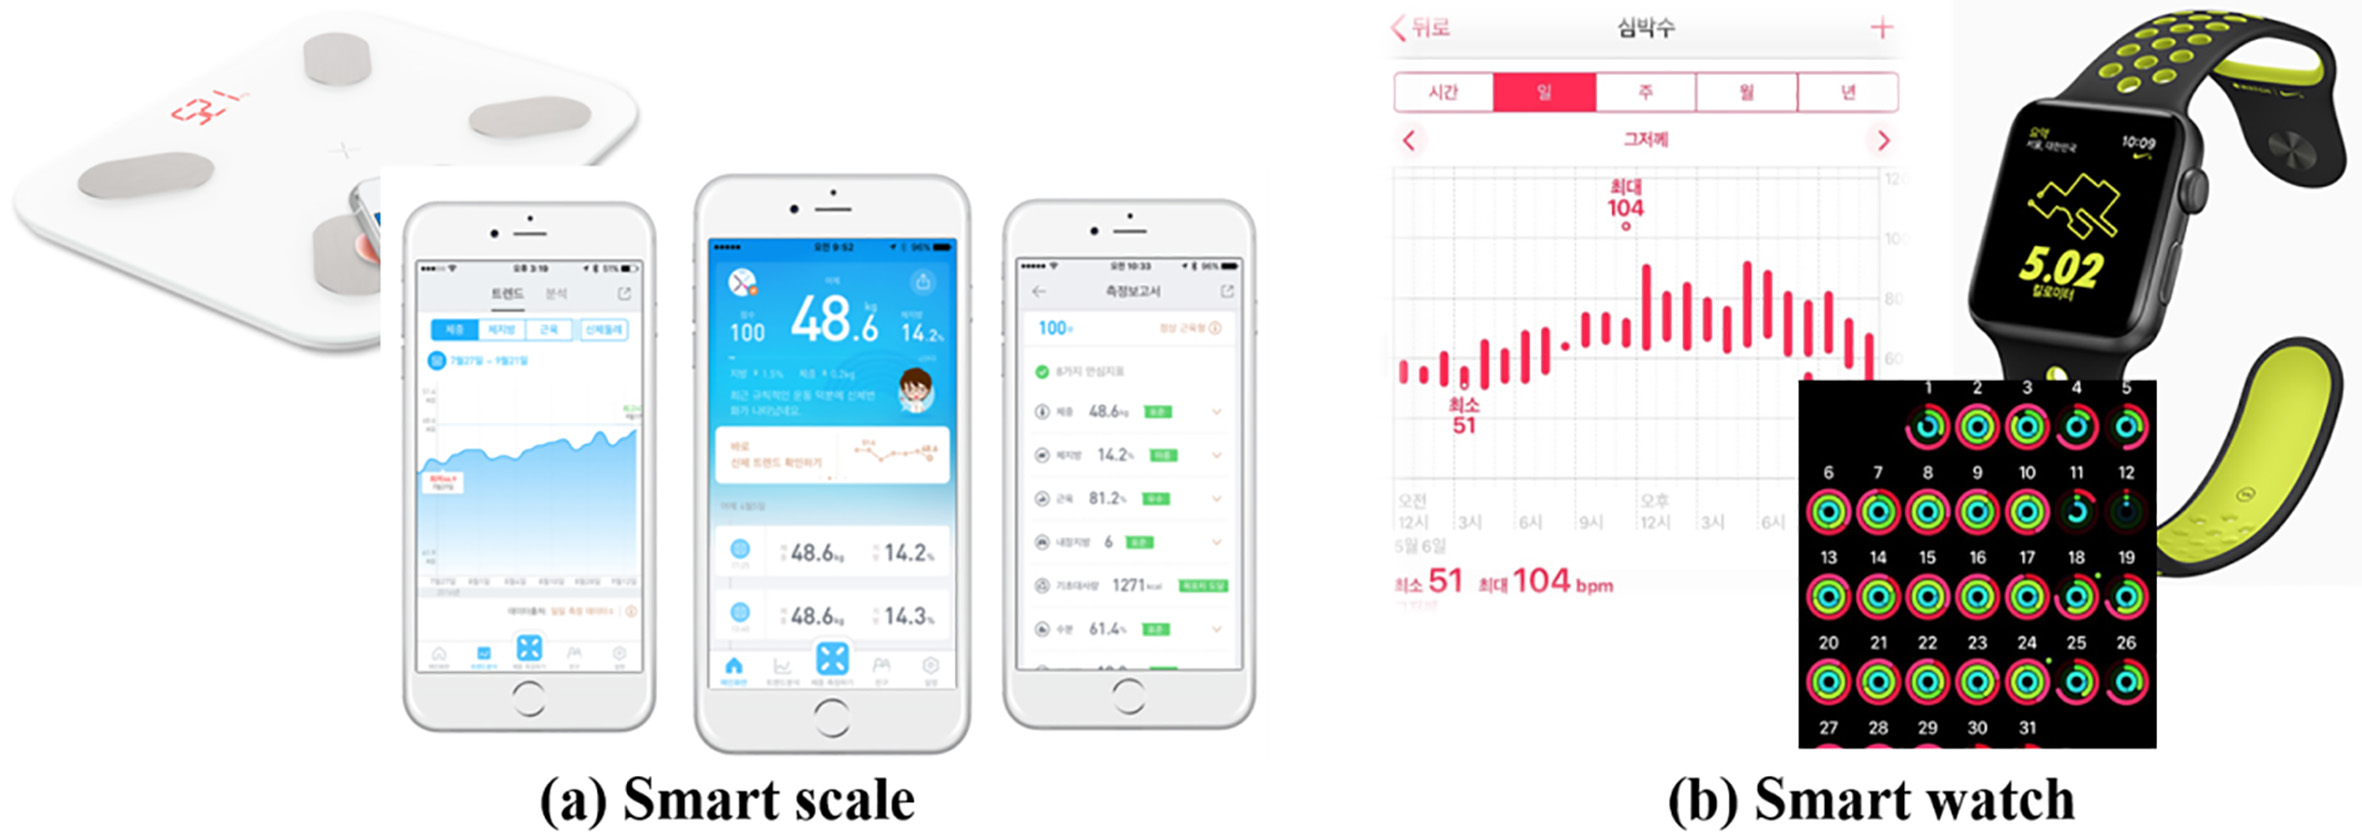
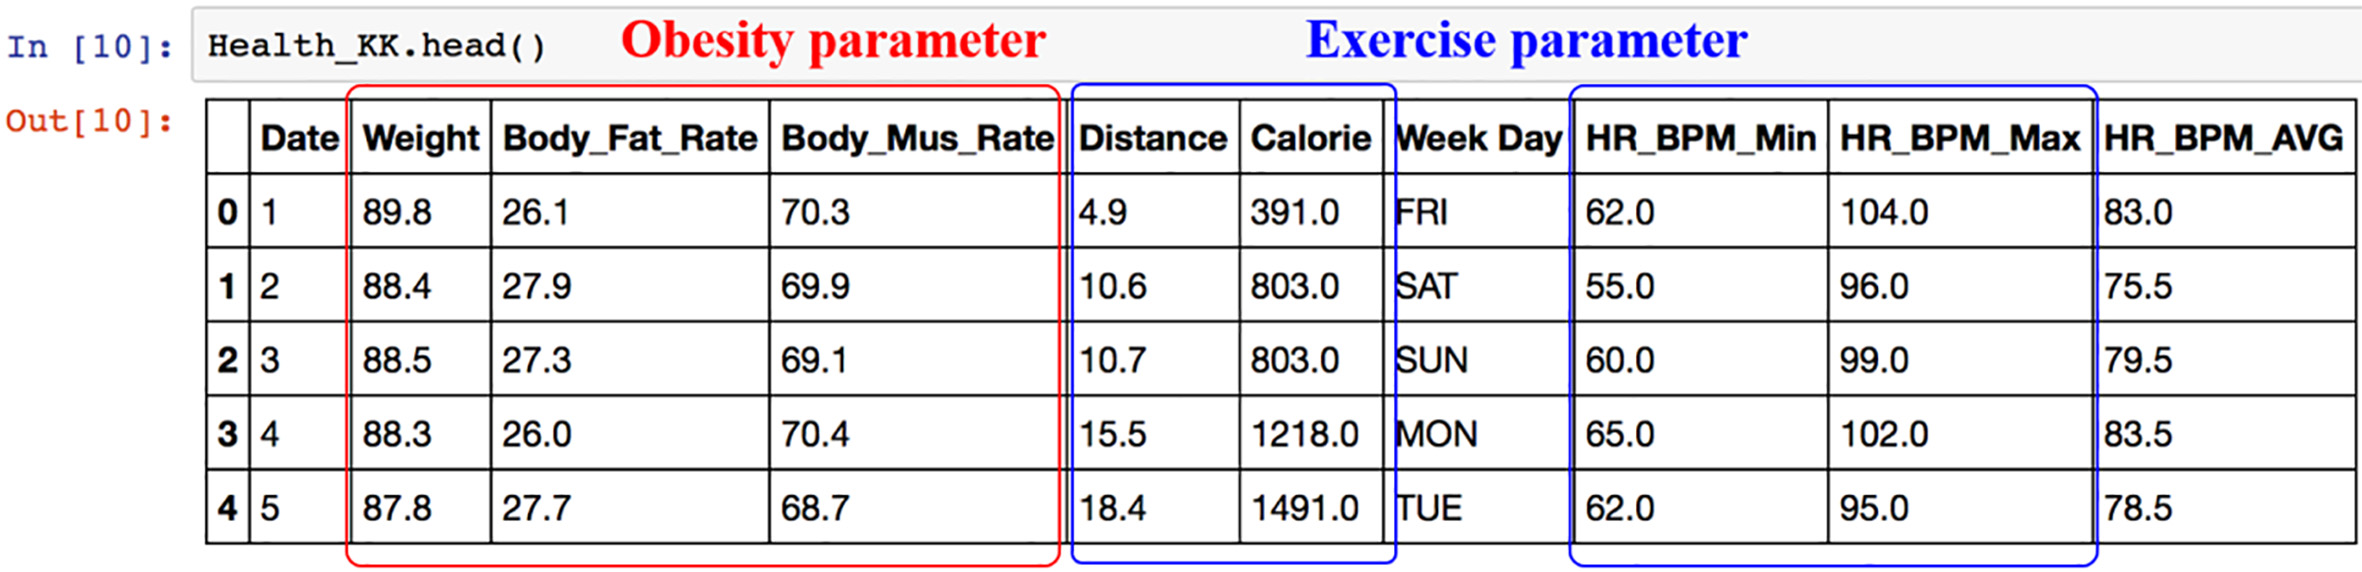
Figure 2.
Head file for physiological data analysis using Python (ver. 3.6.1).
2.2Method of analysis
The personal physiological data collected for 400 days were analyzed using Python software (Python 3.6.1, Python Software Foundation). Figure 2 summarizes the exercise parameters, i.e., the daily exercise distance (Distance) and heart rate (beats per minute, BPM), and the obesity parameters, i.e., weight (Weight), body fat rate (Body_Fat_Rate), and body muscle rate (Body_Mus_Rate).
Based on the data summarized (see Fig. 2), changes in the obesity parameters, i.e., weight, body fat rate, and body muscle rate, during the exercise period of 400 days were analyzed.
First, the health information obtained due to the PT and ADL performed for 400 days was analyzed. Changes to the weight, body fat rate, and body muscle rate, which were acquired through the PT performed for the first 75 days, during the period of performing ADL were analyzed. The correlation between the daily exercise distance parameter and each obesity parameter was then analyzed to compare the change patterns of the weight, body fat rate, and body muscle rate due to daily exercise. Finally, the correlations between the heart rate data (maximum/minimum heart rates) measured every day using the smart watch and the weight and daily exercise distance parameters were analyzed to examine the influence of the heart rate.
3.Results and discussion
3.1Changes in obesity parameters during the period
The subject performed PT for the first 75 days and ADL for the next 325 days. Prior to participation, the subject weighed 90 kg, had a 29% body fat rate, and a 68% body muscle rate. The BMI of the subject before participating in the experiment was 29, which indicated a considerably higher degree of obesity than the value of 25 corresponding to the standard weight, considering the height of the subject. Figures 3–5 show changes in the weight, body fat rate, and body muscle rate of the subject for 400 days.
Figure 3.
Weight change according to the exercise period.
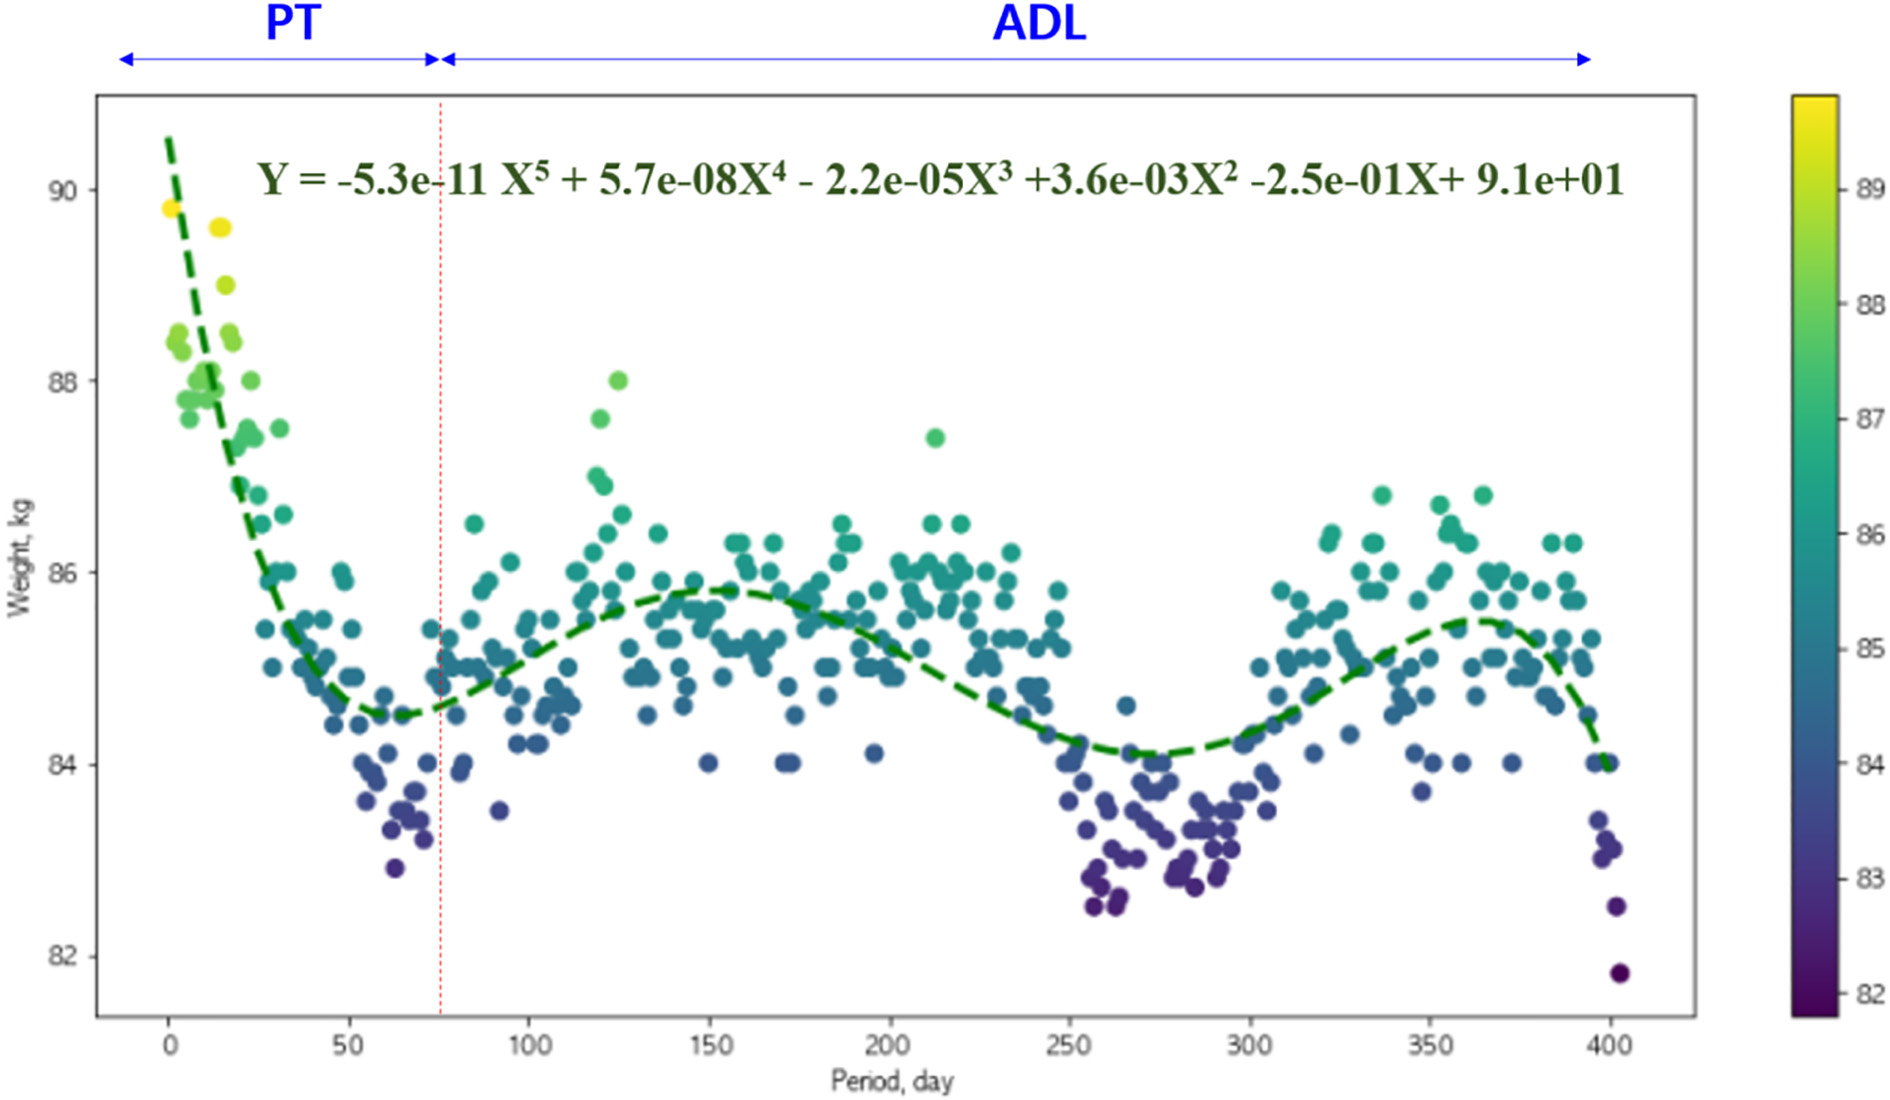
Figure 4.
Changes in the body fat rate according to the exercise period.
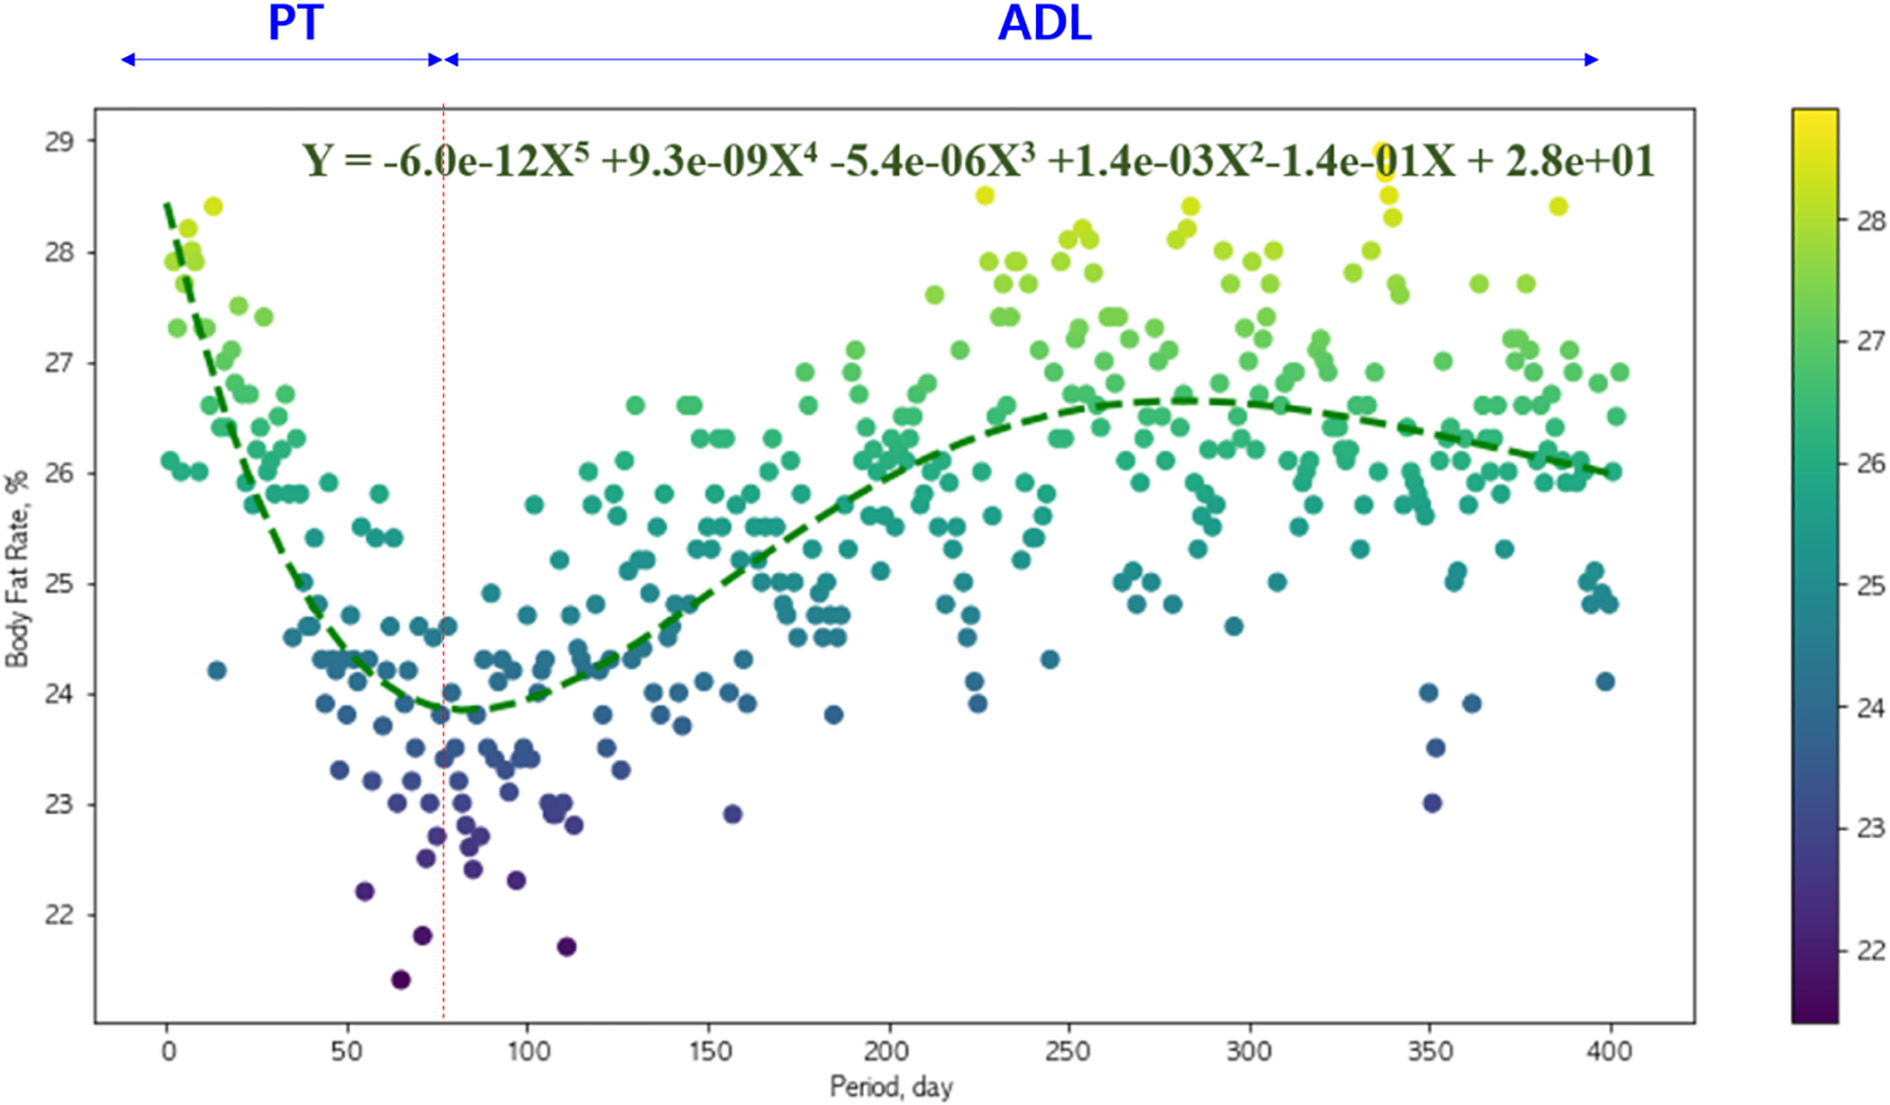
Figure 5.
Changes in the body muscle rate according to the exercise period.
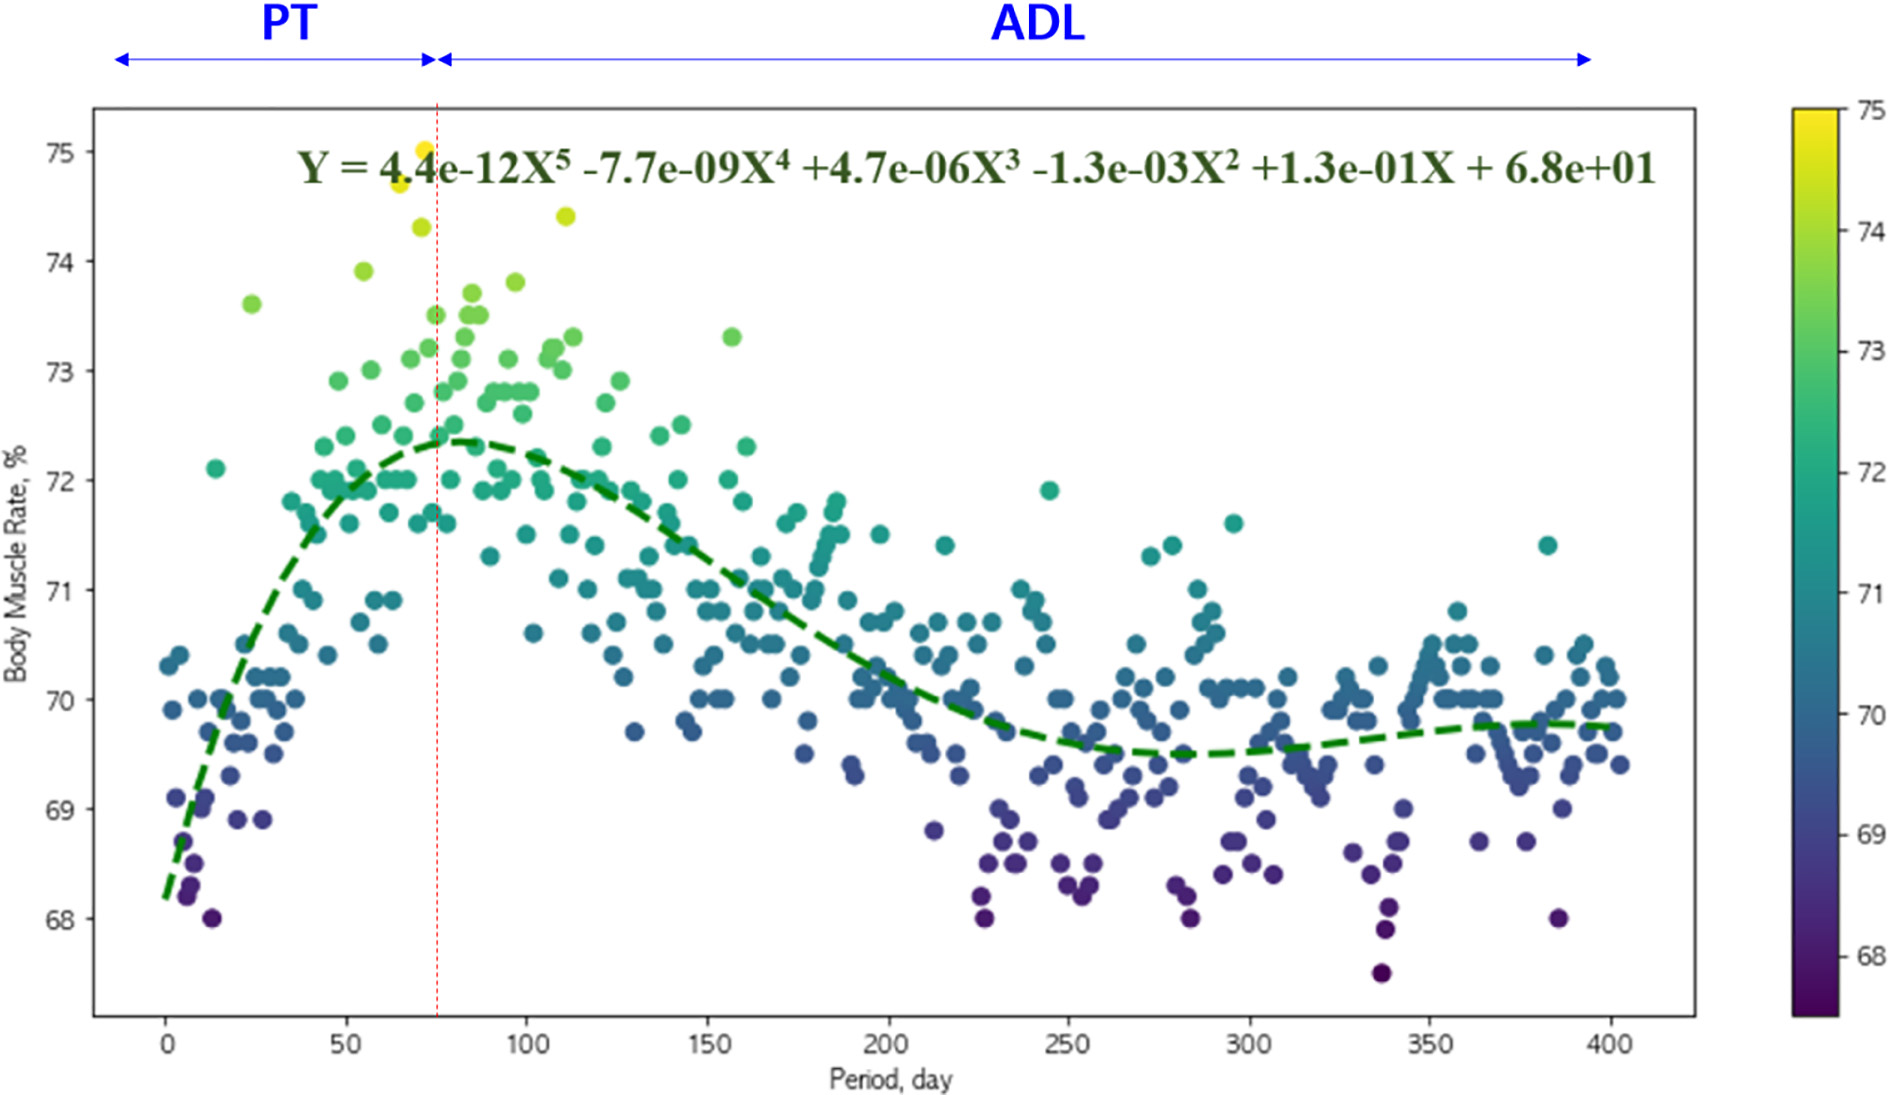
Figure 3 shows the weight change of the subject over 400 days. The weight showed a tendency to linearly decrease for the first 75 days. It was found that the weight of the subject was reduced by approximately 7 kg to 83 kg through PT. The correlation coefficient (
Figure 4 shows the changes in the body fat rate of the subject over 400 days. It was found that the body fat rate linearly decreased for the first 75 days. The body fat rate of the subject was reduced by approximately 8% to a minimum of 21% through PT for 75 days. The correlation coefficient (
Figure 5 shows the changes in the body muscle rate of the subject over 400 days. The body muscle rate linearly increased for the first 75 days. The body muscle rate of the subject was increased by approximately 9% to a maximum of 75% through PT for 75 days. The correlation coefficient (
The weight and body fat rate of the subject showed a tendency to decrease and the body muscle rate showed a tendency to increase while active activities were performed due to PT. After the first 75 days, however, all of the weight, body fat rate, and body muscle rate could not maintain the previous linearity because ADL involved relatively low activities compared to PT. While ADL was performed for 325 days, the weight exhibited the “increase/decrease” pattern twice and the body fat rate showed the “increase/decrease” pattern once. The body muscle rate increased to a maximum of 74% and then showed a tendency to remain between 70% and 71%. It appears that the health of the user was maintained to some degree by the repeated simple movements in everyday life, such as standing, sitting, and walking, even though they were not as rigorous as PT.
3.2Analysis of the correlations between the exercise and obesity parameters
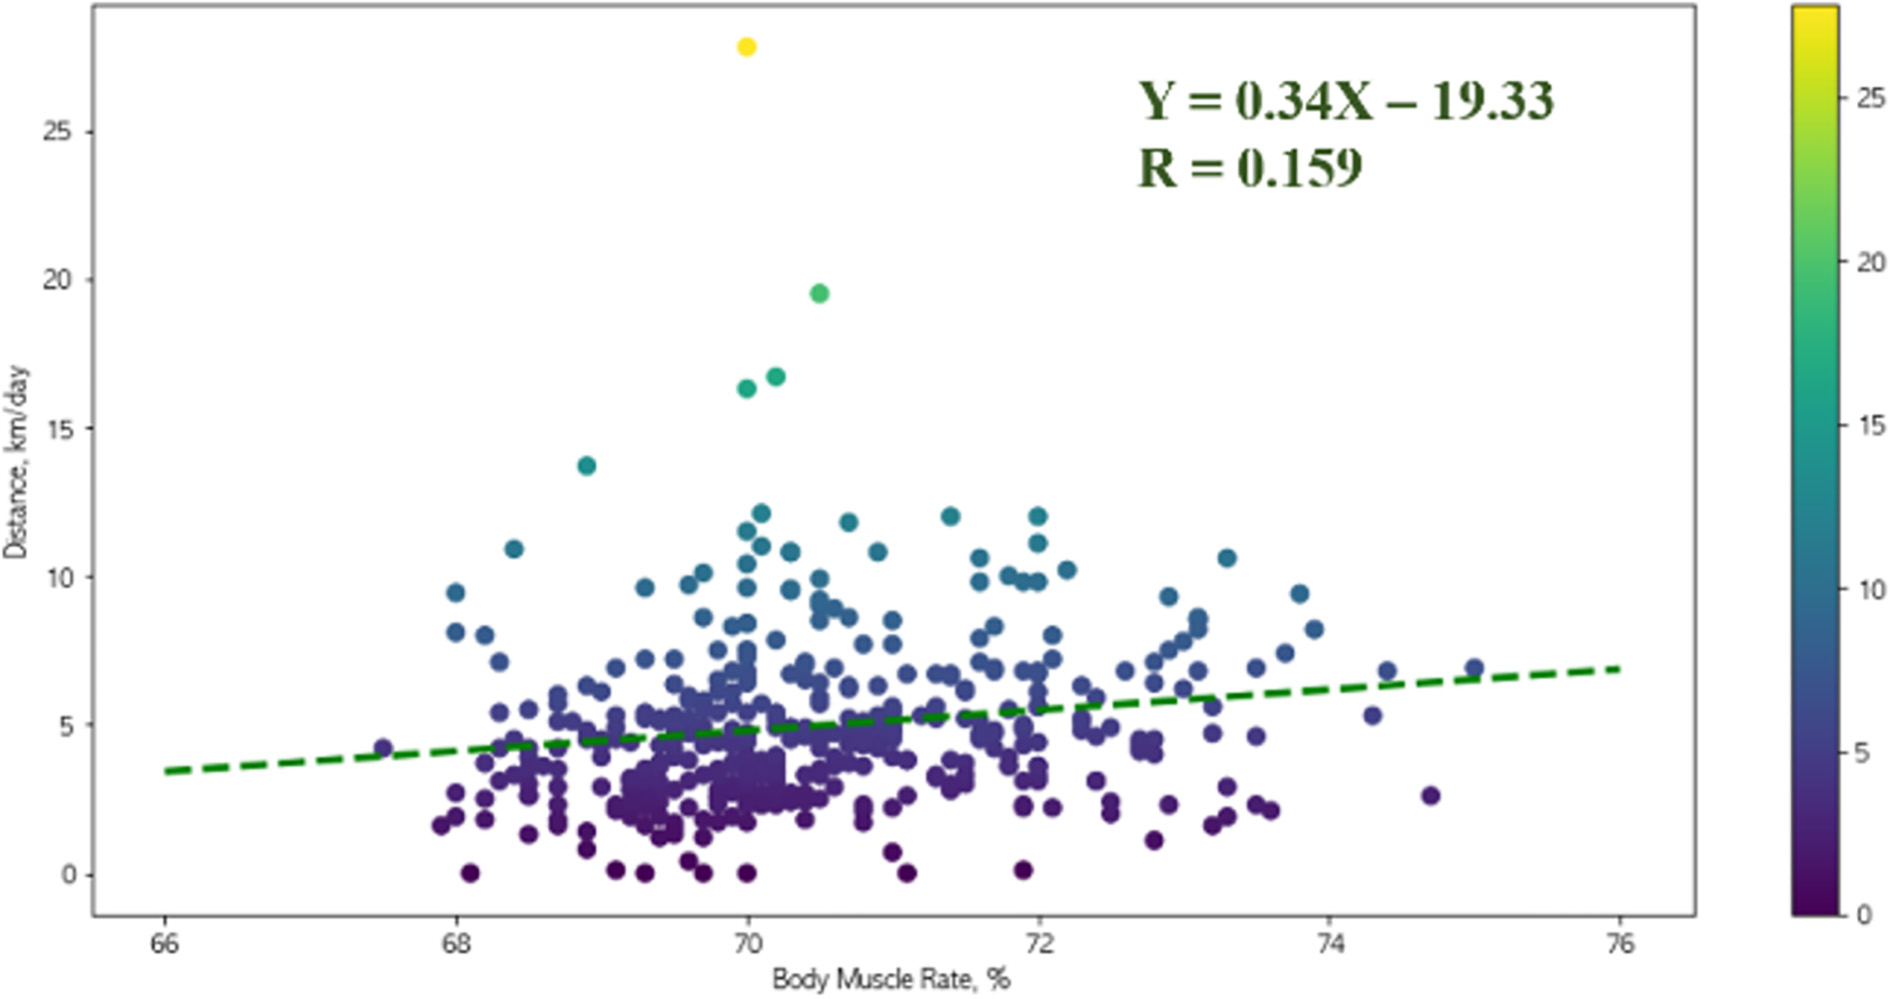
To identify the relationship between the exercise performed by the subject and the obesity-related health information, the correlations between the daily exercise distance parameter and the three obesity parameters were analyzed as shown. Figures 6–8 show the correlations between the daily exercise distance and the obesity parameters, i.e., weight, body fat rate, and body muscle rate. As the daily exercise distance increased, the weight (
Figure 6.
Analysis of the correlation between the exercise distance and weight.
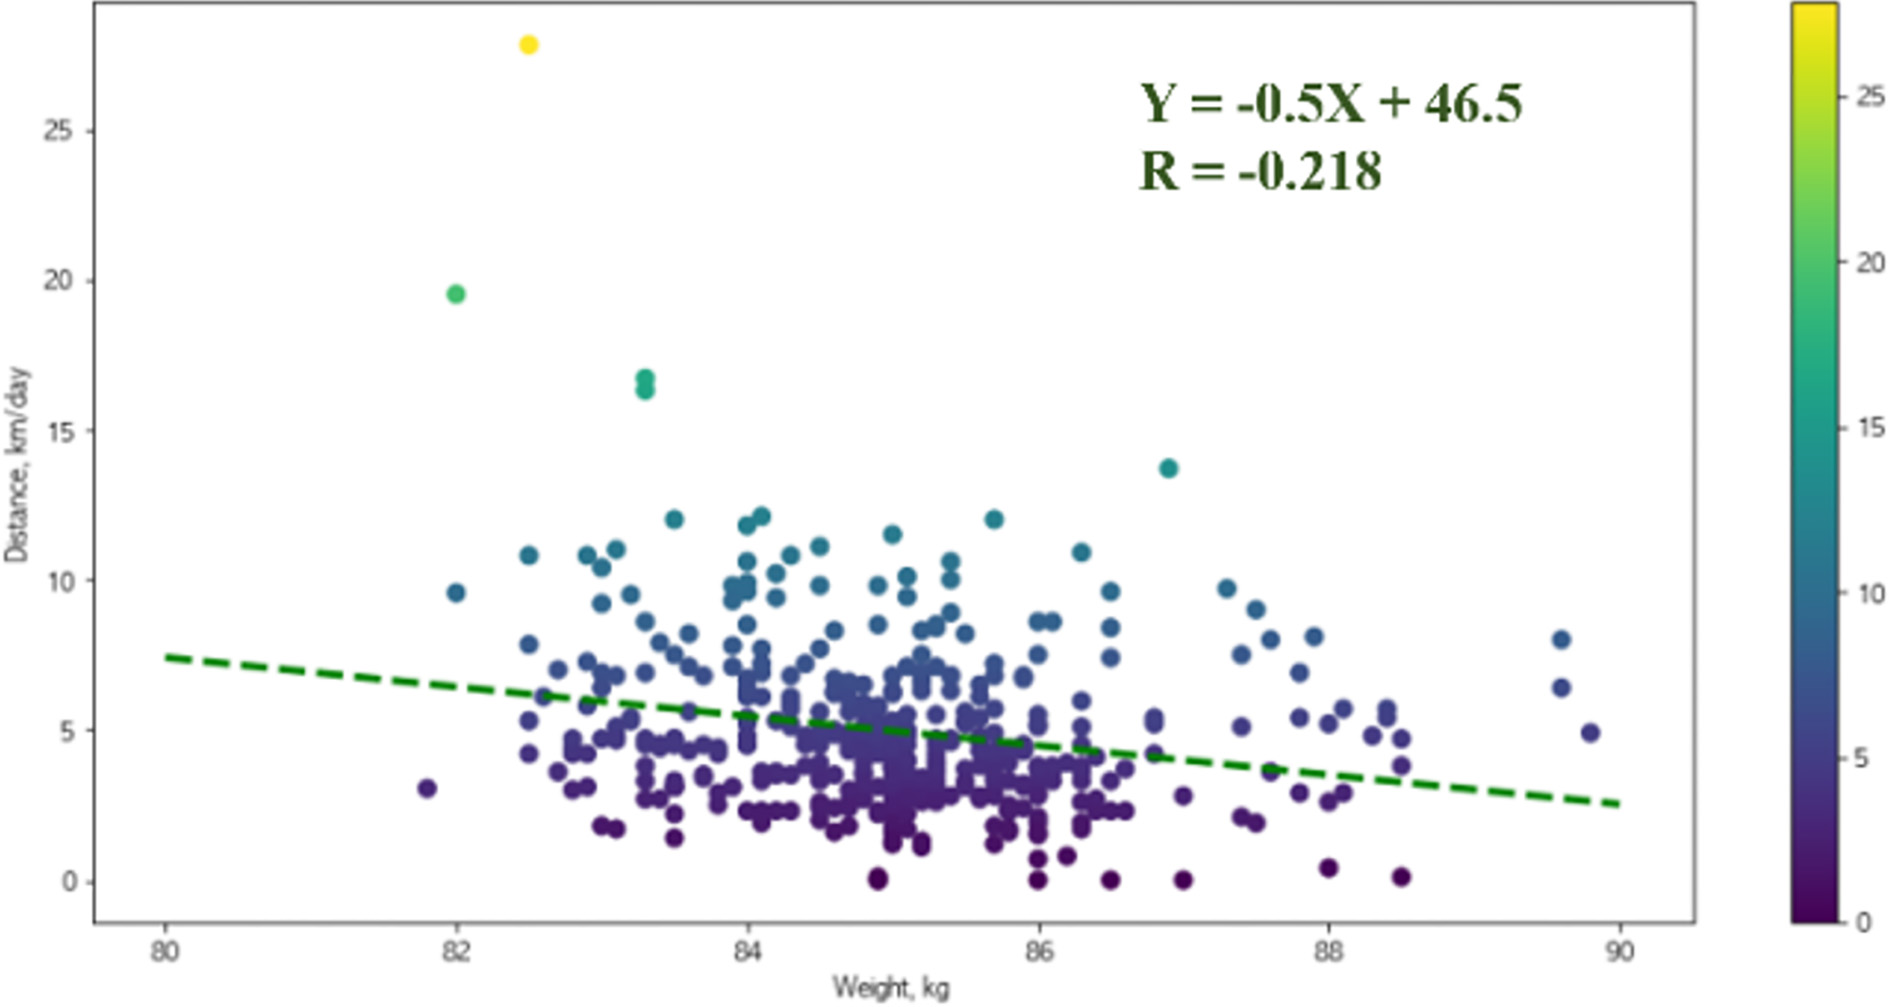
Figure 7.
Analysis of the correlation between the exercise distance and body fat rate.
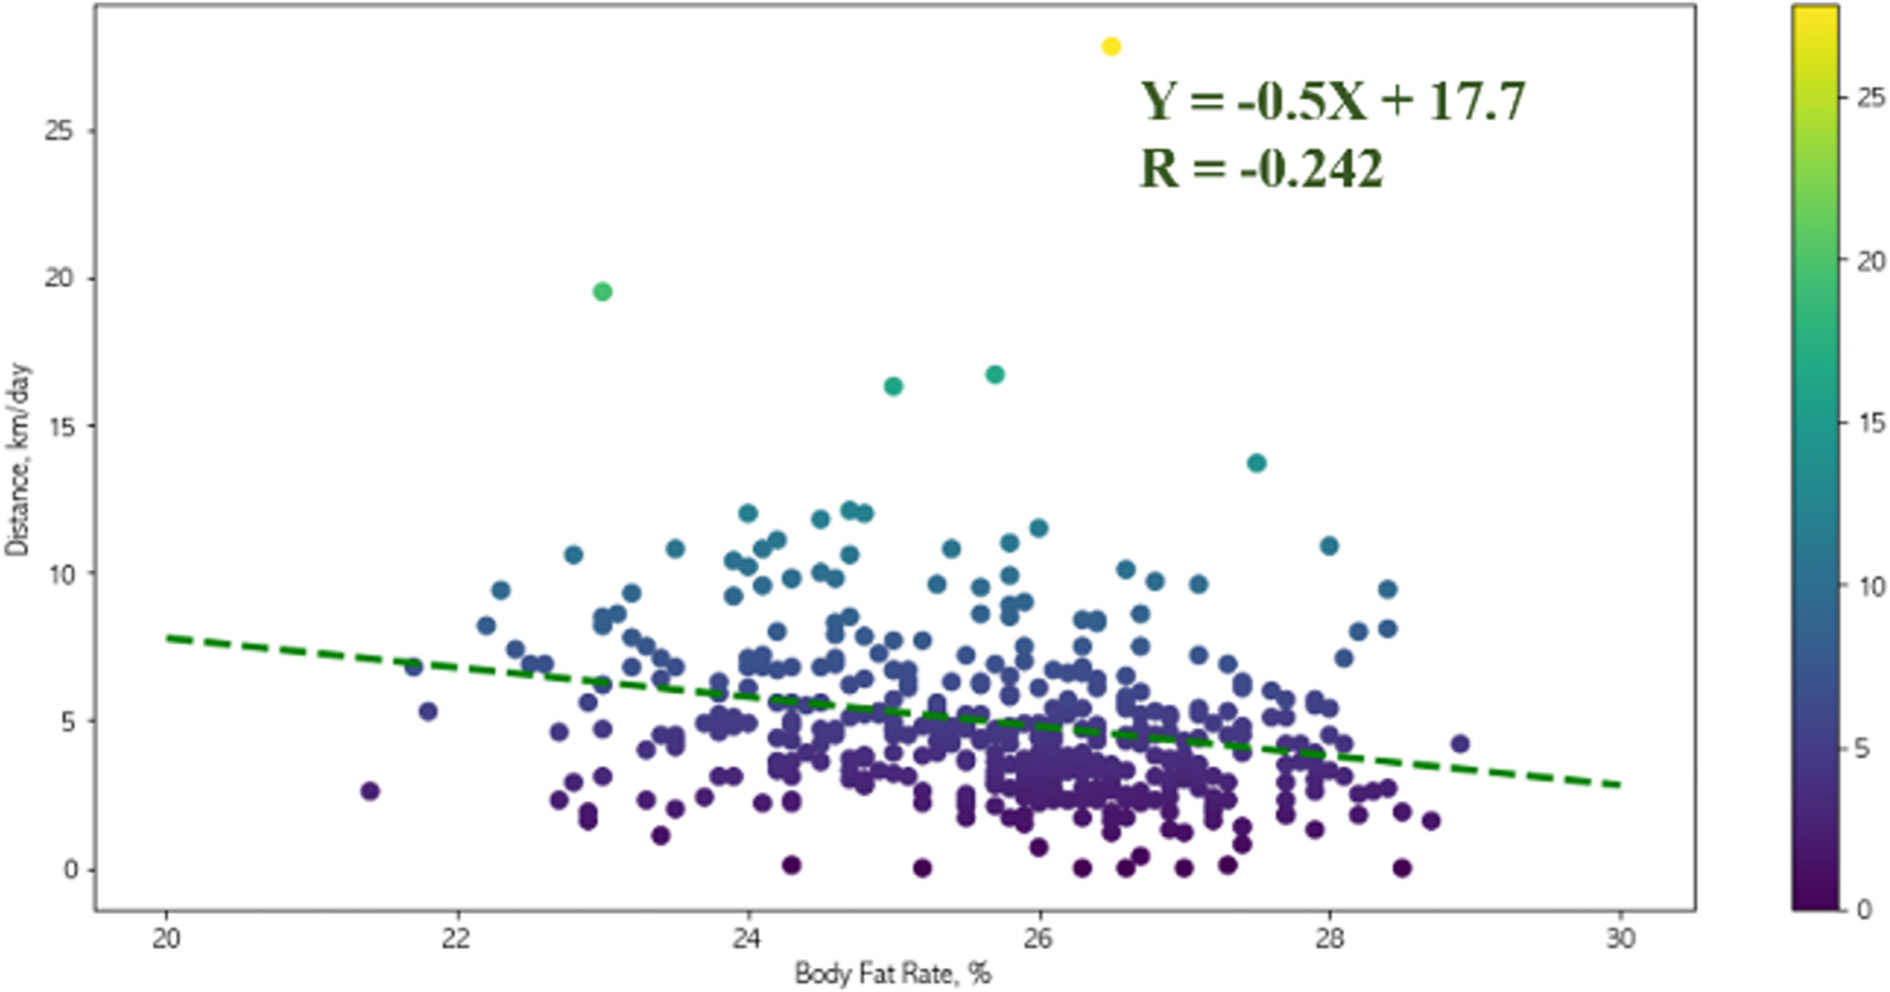
Figure 8.
Analysis of the correlation between the exercise distance and body muscle rate.
The analysis of Figs 3–5 revealed that the weight and body fat rate of the subject showed a sharply and linearly decreasing pattern while the body muscle rate exhibited a linearly increasing pattern through PT for the first 75 days. For the 325 days of performing ADL, however, the linear changes in the obesity parameters could not be maintained. The weight showed the repeated pattern twice, but the body fat rate and body muscle rate exhibited relatively small changes.
In the correlations between the daily exercise distance and the obesity parameter shown in Figs 6–8, the weight and body fat rate showed a tendency to decrease while the body muscle rate showed a tendency to increase as the daily exercise distance was longer compared to the average daily exercise distance. This shows the possibility of changing the values of the obesity parameters by increasing the number of the repetitions of the small movements performed in everyday life even though they are not as rigorous as PT.
3.3Analysis of the heart rate change due to long-term exercise
To analyze the heart rate over 400 days while the exercise and obesity parameters were collected, the maximum BPM and the minimum BPM of each day were collected through the smart watch as shown in Fig. 2b, and the correlation between the weight, an obesity parameter, and the daily exercise distance, an exercise parameter, was analyzed.
Figure 9.
Analysis of the correlation between the heart rate and weight.
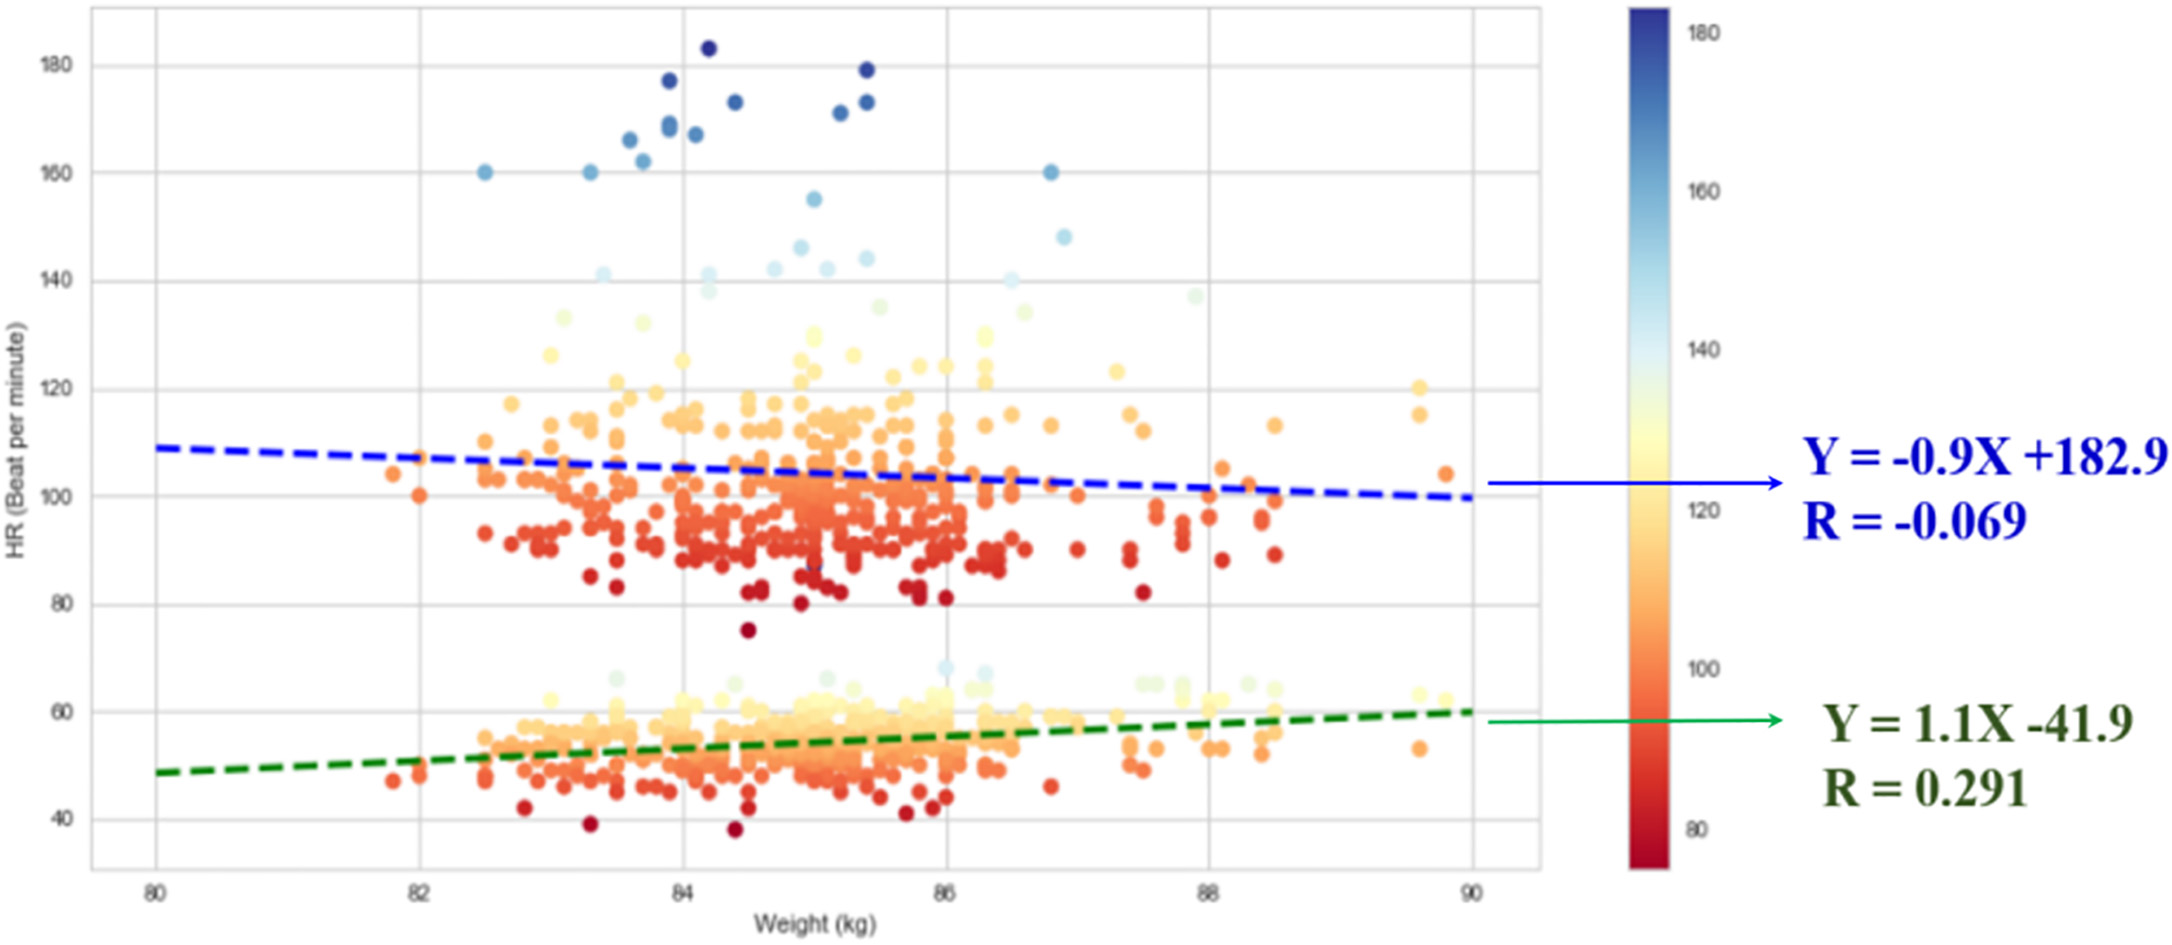
Figure 9 shows the correlations between the maximum/minimum BPM and the weight. The maximum BPM represents the 80–120 range, which is relatively higher than 70 BPM, while the minimum BPM represents the 40–60 range, which is relatively lower than 70 BPM. Linear regression analysis was conducted for the correlations between the maximum/minimum BPM and the weight. Figure 9shows the equations and correlation coefficients of the straight lines. The analysis of the correlation between the heart rate and weight for 400 days revealed that the maximum BPM showed a tendency to increase while the minimum BPM showed a tendency to decrease as the weight decreased due to exercise.
Figure 10.
Analysis of the correlation between the heart rate and daily exercise distance.
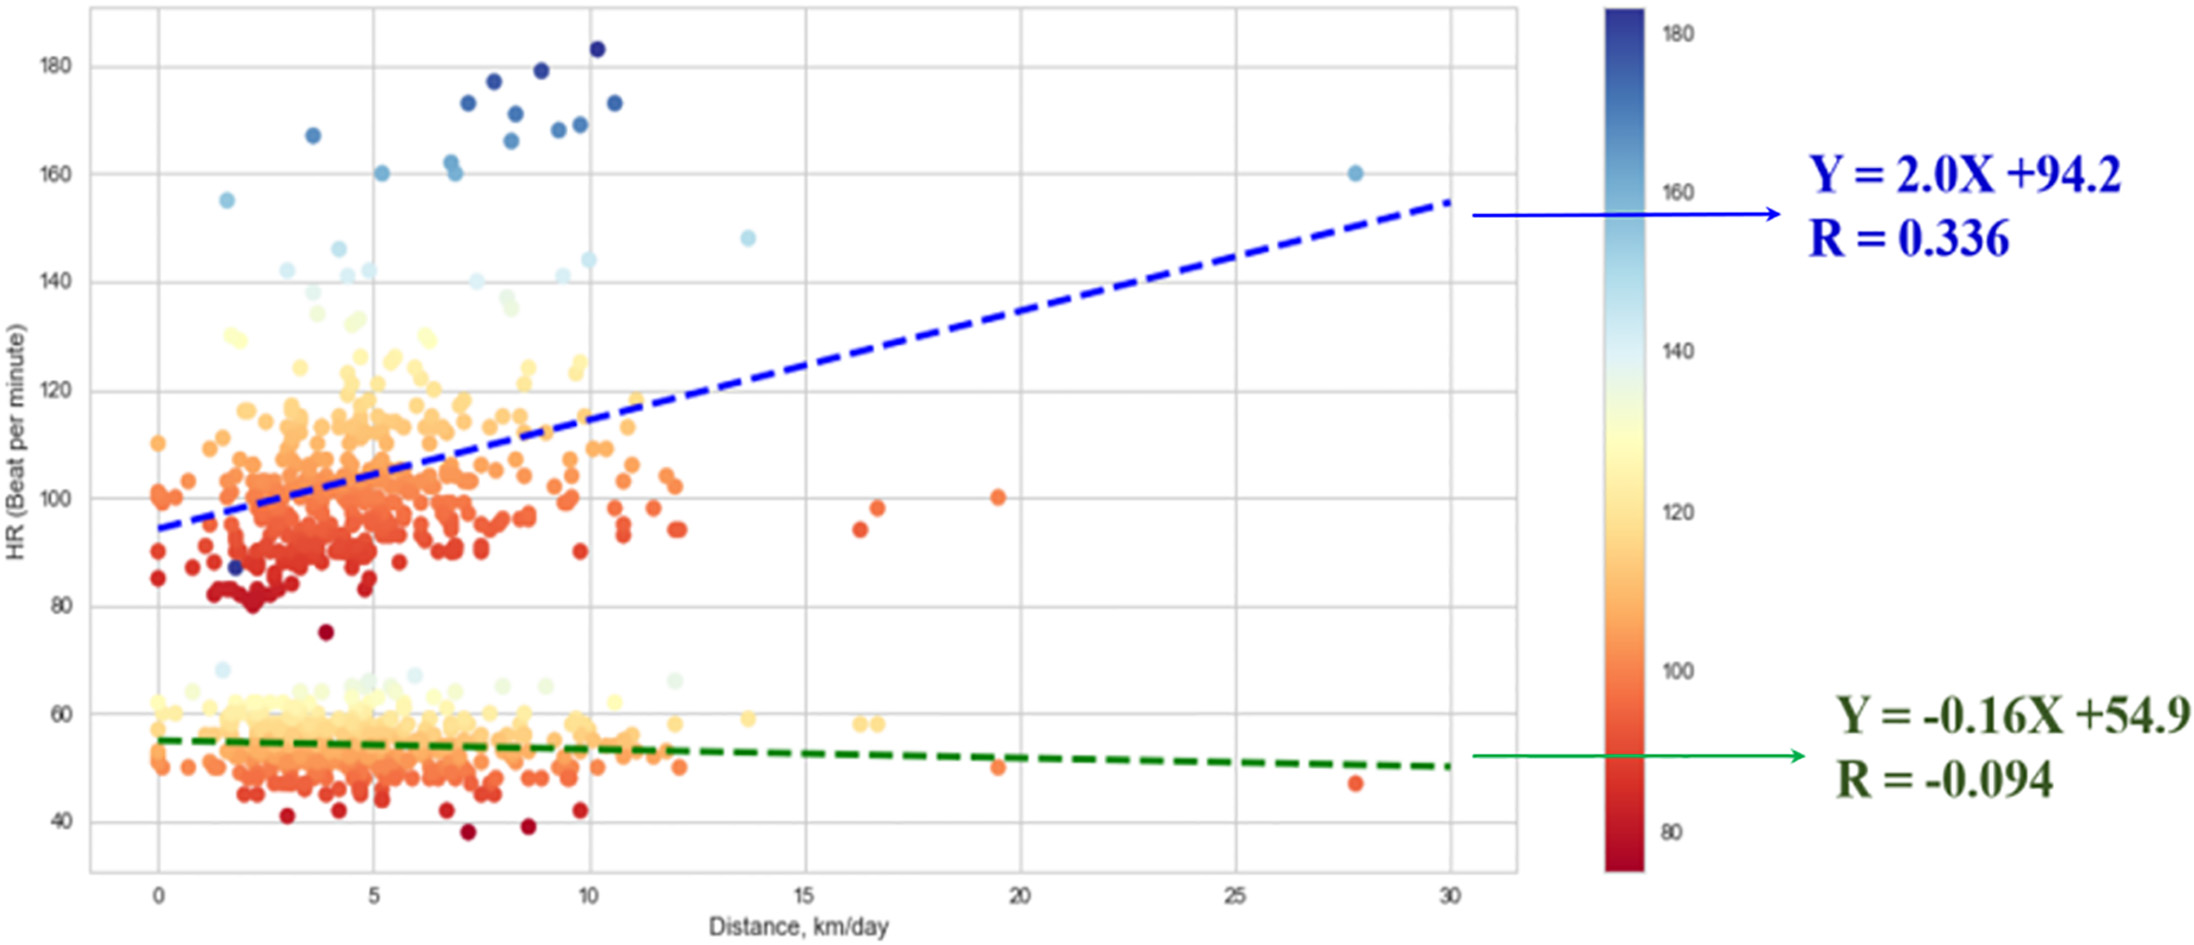
Figure 10 shows the correlations between the maximum/minimum BPM data and the daily exercise distance. Linear regression analysis was conducted for the correlations between the maximum/minimum BPM and the daily exercise distance. The analysis of the correlation between the heart rate and daily exercise distance for 400 days revealed that the maximum BPM showed a tendency to increase while the minimum BPT showed a tendency to decrease as the daily exercise distance increased.
The weight loss of the subject, who was obese prior to the experiment, because of the exercise means that the subject became healthier because the initial BMI of 29 could be reduced to less than 25, a healthy state. Moreover, the maximum BPM showed a tendency to increase as the weight decreased in the entire experiment period. This appears to be because the cardiac output of the heart increased as exercise was continued, thereby improving the exercise capacity. Additionally, the minimum BPM showed a tendency to decrease. This means that the amount of blood that can be released per heartbeat increased, which appears to be due to the increase in the cardiac output. The results in Figs 9 and 10 indicate that the exercise continued for a long time in everyday life can improve the function of the heart and thus contribute to the health management of the user.
4.Conclusion
In this study, the change patterns of the obesity parameters and heart rate of the subject under PT for 75 days and the activity of daily living (ADL) for 325 days were analyzed. It was confirmed that the increase in the number of the repetitions of simple movements in everyday life, such as standing, sitting, walking, and climbing stairs, showed a tendency to decrease the weight and body fat rate of the user and a tendency to increase the body muscle rate. Moreover, when the heart rate, which indirectly represents the function of the heart, was analyzed, it was found that consistent long-term exercise could be helpful in improving the function of the heart because it improved the exercise capacity of the user and increased the amount of blood released per heartbeat. It is expected that the simple physiological data measured with smart watches and smart scales can be used for the health management of the elderly living in rural areas in the future. However, the experimental results of this paper are the result of long-term physiological signal analysis for a healthy adult living in rural area. Because most residents of rural areas in Korea are elderly, it is a limitation of this paper to analyze only one healthy adult without involving the elderly as subjects. This study was preceded by experiments in healthy adults to confirm the safety of the experiment and the possibility of collecting data over a long period of time before experimenting with large numbers of elderly people. Furthermore, the cardiac function was analyzed using only the heart rate data measured with a simple smart watch in this study. In future studies, the influence of consistent long-term exercise on the heart will be analyzed for the elderly living in rural areas by collecting the obesity parameters as well as cardiac parameters, such as electrocardiogram and cardiac output.
Acknowledgments
This work was supported by the Ministry of Trade, Industry and the Korea Evaluation Institute of Industrial Technology Energy Science (KEIT) in 2017 (Core Medical Equipment Technology Development Project/10068076).
Conflict of interest
None to report.
References
[1] | Elderly person statistics 2018, Statistics Korea, (2018) . |
[2] | Kim H.C., Kang C.K., Investigation of participation in exercise in farmers, Korean Journal of Sports Science, 18: (4) ((2007) ), 95–103. |
[3] | Park I.R., Effects of 12 weeks aerobic exercise on health-related physical fitness and bone density in elderly, Journal of Sports and Leisure Studies, 22: ((2004) ), 459–469. |
[4] | Yu S.H., Cho W.H., Park C.Y., Lee M.K., Healthcare utilization and its determinants among island inhabitants, Korean J. of Preventive Medicine, 20: (20) ((1987) ), 287–300. |
[5] | Lee J.H., Ko K.H., Kim Y.S., Rhee J.A., Physician utilization and its determinants in rural and urban slum areas, Korean J. of Preventice Medicine, 21: (2) ((1988) ), 404–418. |
[6] | Joo K.S., Kim H.J., Lee S.H., Min H.Y., A comparative study on medical utilization between urban and rural, Korea. Korean J. of Preventive Medicine, 29: (2) ((1996) ), 311–330. |
[7] | Shin H.C., Kang J.Y., Park W.S., Kim S.A., Health status and medical utilization of women in rural area, J. Agri. Med. & Community Health, 34: (1) ((2009) ), 67–75. |
[8] | Lee Y.J., The effects of regional characteristics on inequality of healthcare resource distribution, Journal of Critical Social Welfare, 21: ((2005) ), 49–78. |
[9] | Jeong S.B., Oh I.W., Effects of 24 week combined exercise on body composition, functional fitness and blood pressure in the rural elderly, Korean Journal of Exercise Rehabilitation, 6: (2) ((2010) ), 115–124. |
[10] | Hyun S.S., The effects walking exercise program on blood pressure as a related indicator for aged hypertension patients in rural areas, Journal of Korean Academy of Rural Health Nursing, 1: (1) ((2006) ). |
[11] | Nelson M.E., Rejeski W.J., Blair S.N., Duncan P.W., Judge J.O., King A.C., Physical activity and public health in older adults: Recommendation from the american college of sports medicine and the american heart association, Medicine and Science in Sports and Exercise, 39: (8) ((2007) ), 1435–1445. |
[12] | Bríainó H., Laura C.L., Marco P., Thomas W.B., John A.D., Daniel E.F., Matthew P.B., Jamehl L.D., Adam J.S., Christine L., Michael E.M., Mary M.M., Thomas M.G., Effect of a long-term physical activity intervention on resting pulse rate in older persons: Results from the LIFE study, J Am Geriatr Soc., 64: (12) ((2016) ), 2511–2516. |
[13] | Reetta R., Riitta L., Jani R., Kirsi M., Eija T., Clas-Håkan N., Short- and long-term effects of a physical exercise intervention on work ability and work strain in symptomatic menopausal women, Safety and Health at Work, 5: ((2014) ), 186–190. |
[14] | Susanne F., Kate S., Julie B., Long-term follow-up of exercise interventions aimed atpreventing falls in older people living in the community: A systematic review and meta-analysis, Physiotherapy, 105: ((2019) ), 187–199. |
[15] | Ans V.G., Michelle H., Fiona D., Patrick C., Effects of long-term exercise therapy on knee joint structure in people with knee osteoarthritis: A systematic review and meta-analysis, Seminars in Arthritis and Rheumatism, 48: ((2019) ), 941–949. |
[16] | Jaime L.L., Justin J.R., Marcus M.L., Benjamin F.M., Long-term aerobic exercise preserves muscle mass and function with age, Current Opinion Physiology, 10: ((2019) ), 70–74. |


