
Identification of blood pressure reflecting personalized traits using bilateral photoplethysmography
Abstract
BACKGROUND:
Blood pressure (BP) is currently diagnosed by cuff-based devices, which are inconvenient and provide discontinuous measurements. Photoplethysmography (PPG)-based cuffless techniques have recently been used to accurately estimate both systolic BP (SBP) and diastolic BP (DBP). However, it is difficult to use these SBP and DBP estimations to reflect the personalized traits in the peripheral vascular condition; thus, their accuracy is limited.
OBJECTIVE:
The purpose of this study is to describe a technique that can be distinguished simply among three BP categories (normotensive, prehypertensive, and hypertensive) and reflect individual traits using PPG only.
METHODS:
We measured BP over 120 s using the fingers of 105 subjects. The PPG waveforms varied in size and amplitude over time. Therefore, normalization for uniform features for individual traits was done after the extracted waveforms were divided into multiple windows. The feature is determined by the lowest amplitude in the waveform within each divided window. The features have been applied to distinguish three BP categories using the first-eigenvector (1-EV) and second-eigenvector (2-EV) in linear discriminant analysis.
RESULTS:
The best decision boundary for each BP category was estimated using 1-EV (
CONCLUSION:
Discrimination among the three BP categories reflecting individual traits was successfully achieved using PPG. This method could improve limitations of cuff-based techniques.
1.Introduction
Blood pressure (BP) is the most common method for diagnosing hypertension. BP refers to pressure exerted on the walls of blood vessels as blood flows along the vessels, where the pressure during heart contraction is systolic BP (SBP) and the pressure during heart expansion is called diastolic BP (DBP) [1]. BP may adapt according to the condition or surrounding situations, increasing due to increased vascular resistance as the blood vessel walls become stiffer with aging [2]. Even when measured under the same conditions, BP may vary between morning and evening. Moreover, due to the so-called white coat effect, people may become more tense or nervous in front of others wearing a white coat, such as a doctor or nurse, and their BP appears higher than usual. Furthermore, BP may appear even higher in hypertensive patients [3]. Therefore, BP is sensitive to individual traits.
Cuff-based BP measurement methods have been widely used to date. However, due to limitations in continuous measurements and poor portability, various cuffless BP measurement methods have recently been developed [4, 5, 6, 7, 8, 9, 10, 11]. The trend among these studies show the measurement of pulse transit time [4, 5, 6, 7] and pulse arrival time [8] of the pulse wave from the heart to the tips of fingers, with radiofrequency radar [4], phonocardiography [5], and photoplethysmography (PPG) [5, 6, 9, 10, 11] as the primary measuring instruments. Technique using PPG alone [10] and finger-pressing method using PPG and force sensor [11] have recently been developed. However, such PPG-based BP measurement methods are also suspected to have difficulty accurately reflecting individualized traits due to their sensitivity.
Methods that use PPG to measure bio-signals are non-invasive and capable of measuring various signals such as respiratory rate, pulse rate, pulse wave, and oxygen saturation (SpO
The present study analyzed waveform patterns and signal cycle characteristics of PPG and presents a simple technique for discriminating BP status that reflects individualized traits. With a short measurement time of 60–120 s, convenience of being a non-invasive measurement method on the left or right fingers, and use as a measurement device attachable to portable smartphones, PPG is expected to become a technique that can conveniently measure and manage BP anywhere at any time. In particular, data measured from the index finger of both hands could be used to extract BP values that reflect capillary elasticity and is expected to overcome the limitations of sensitivity of existing SBP/DBP-based measurement methods through two-dimensional spatial domain recognition based on BP pattern analyses.
2.Methods and materials
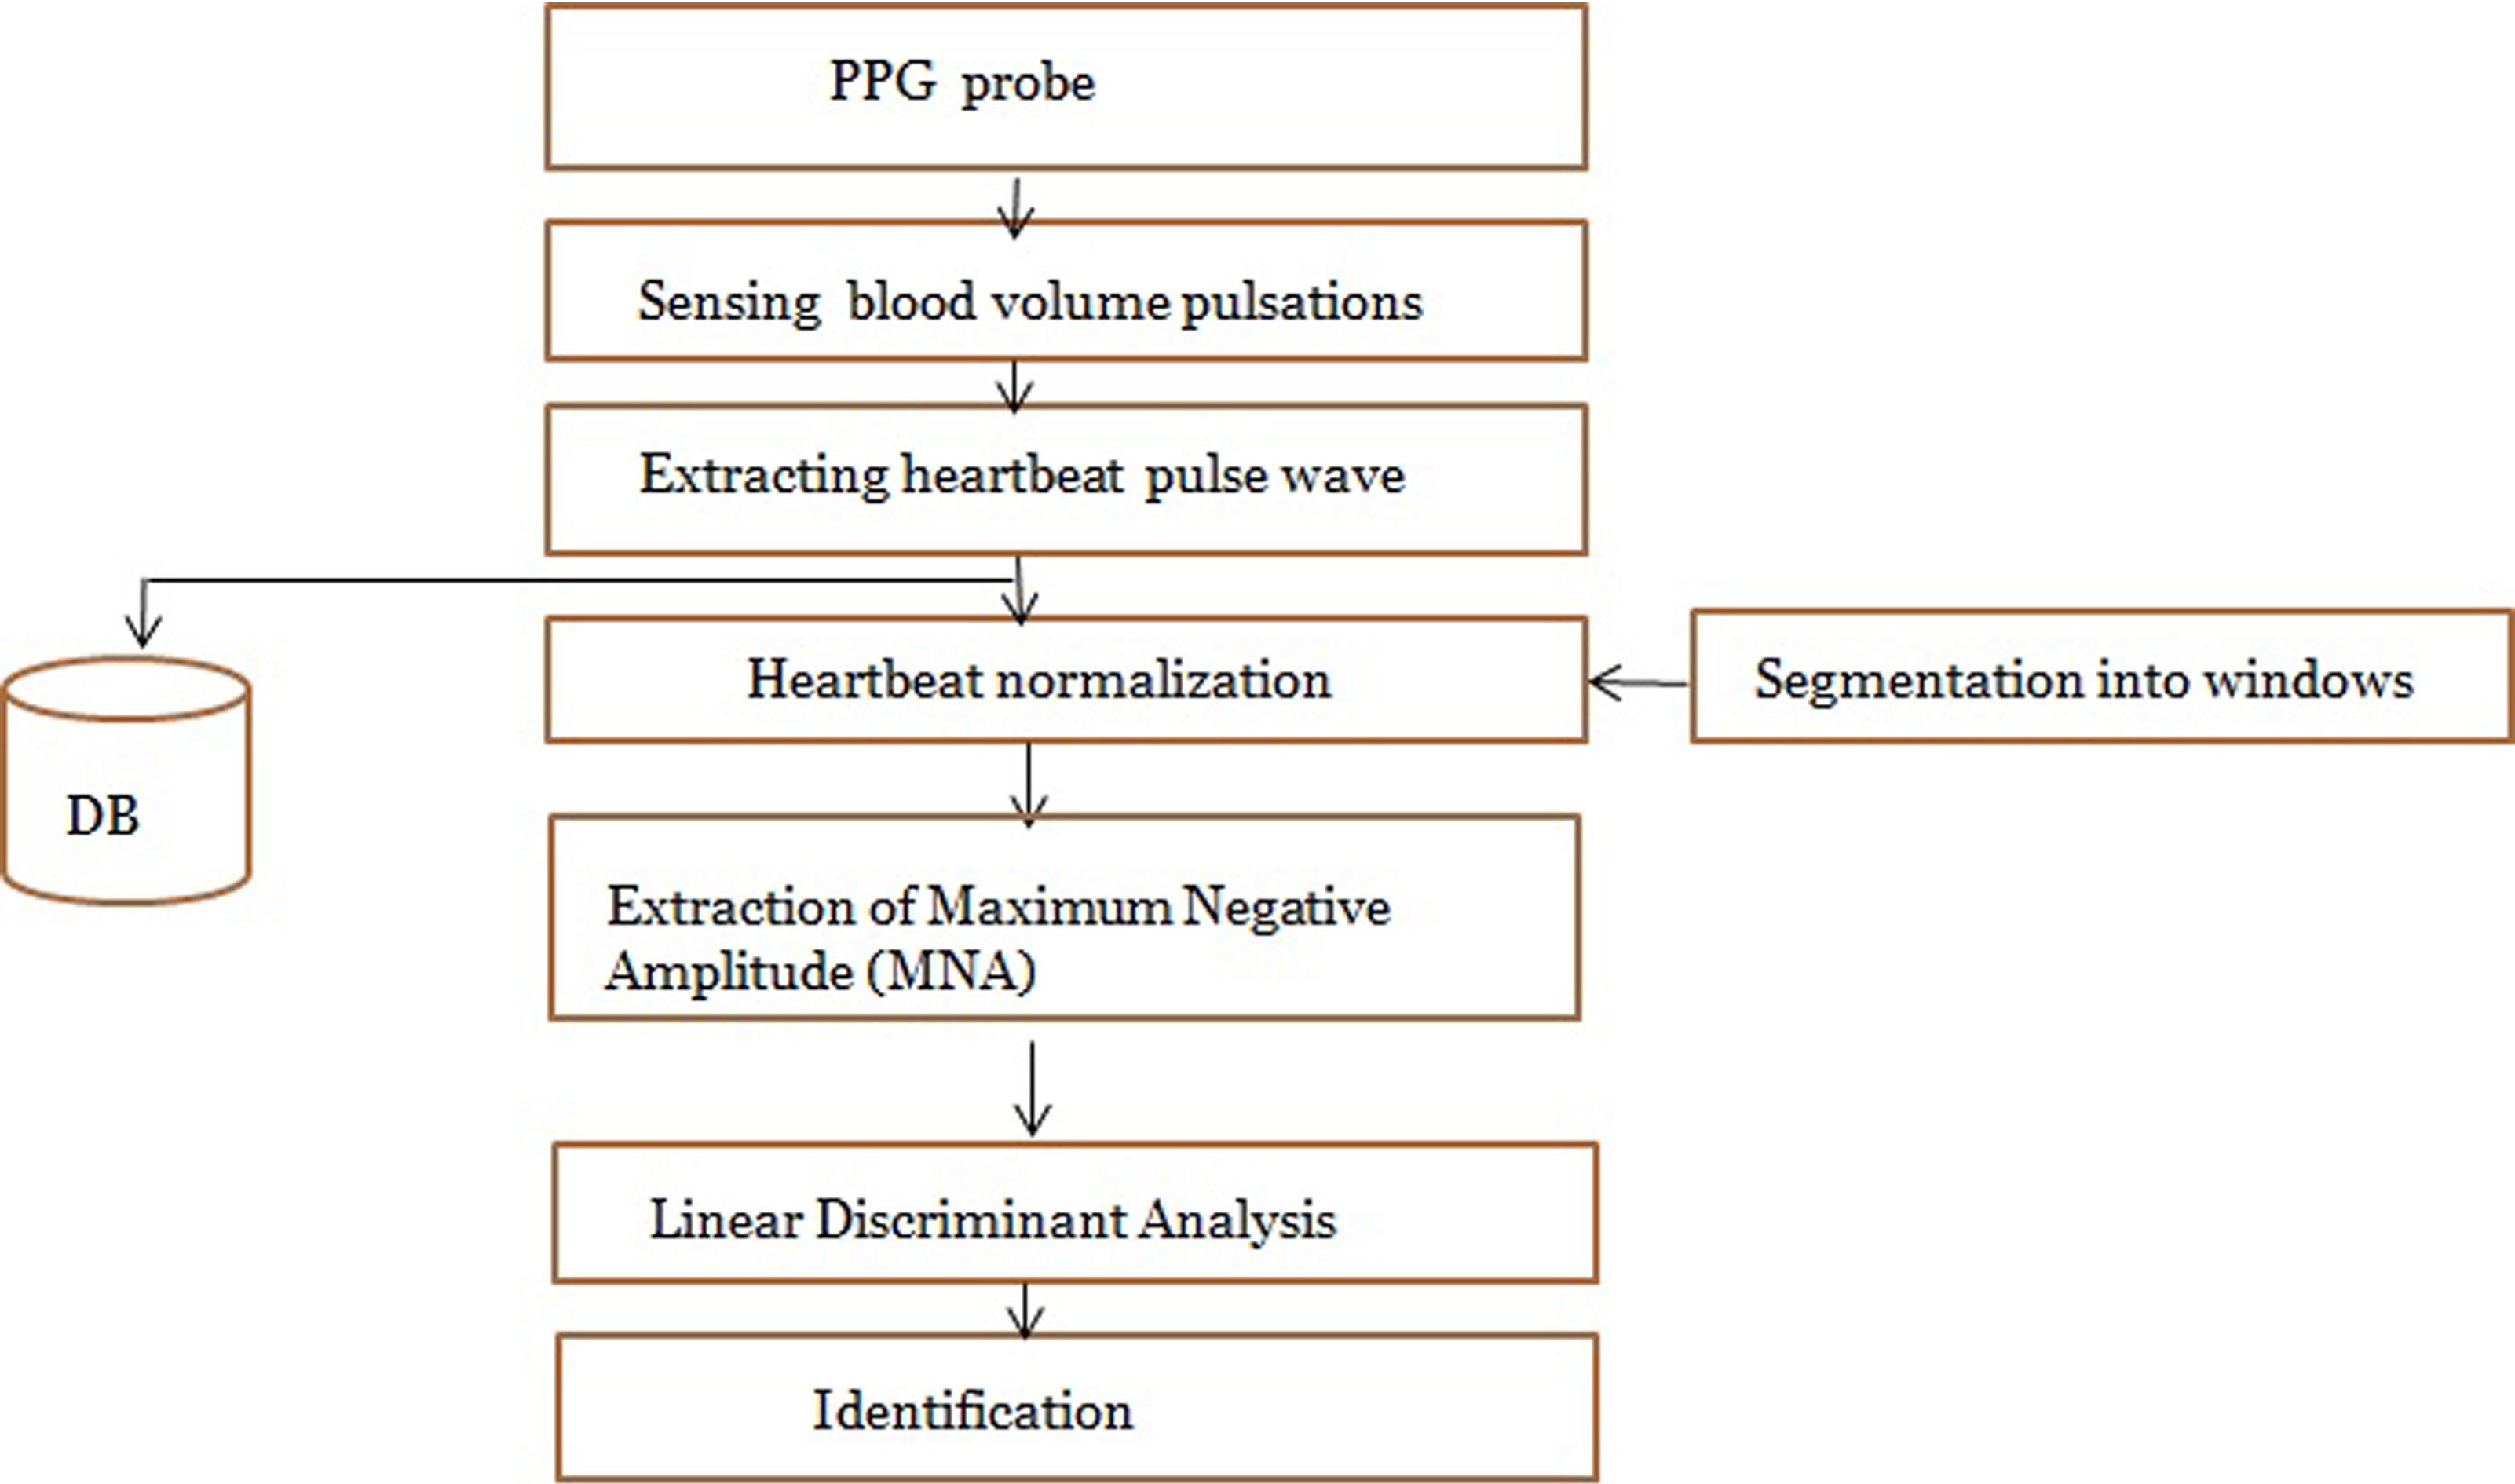
PPG waveform amplitude has been reported to accurately express vascular distensibility, even under situations with large fluctuations in cardiac output, such as under anesthesia [16]. As a method for discriminating BP status that reflects individualized traits in PPG signals, the present study extracted the traits in two stages using PPG waveform amplitude. The first stage comprised data collection and preprocessing. After preprocessing, amplitudes were generated as normalized pulse wave signals that allow comparison of amplitude size between subjects. In the second stage, traits were extracted as amplitudes from the normalized pulse wave signals. The extracted traits were categorized into three BP groups (normotensive, prehypertensive, and hypertensive) using linear discriminant analysis (LDA). Figure 1 shows the flowchart for the technique proposed in the present study.
Figure 1.
Flowchart of the proposed technique.
2.1Data collection
The study population consisted of members of the general population of various ages that have agreed to participate in the study. The present study recruited candidates after receiving approval from the Institutional Review Board of Chosun University. Sitting BP was measured from members of the general population of various ages using oscillometric and PPG methods. Oscillometric BP measurements were used as reference data for the PPG BP measurements. People who had difficulty with the sitting BP measurement were excluded from the study population. A total of 105 people aged 20–79 years participated in the study. BP was categorized into normotensive, prehypertensive, and hypertensive. The hypertension stages 1 and 2 group (14.3%) consisted of those with an SBP 140–179 mmHg/DBP 90–110 mmHg; prehypertension group (29.5%) included those with an SBP 121–139 mmHg/DBP 81–89 mmHg; and the normal group comprised individuals with an SBP
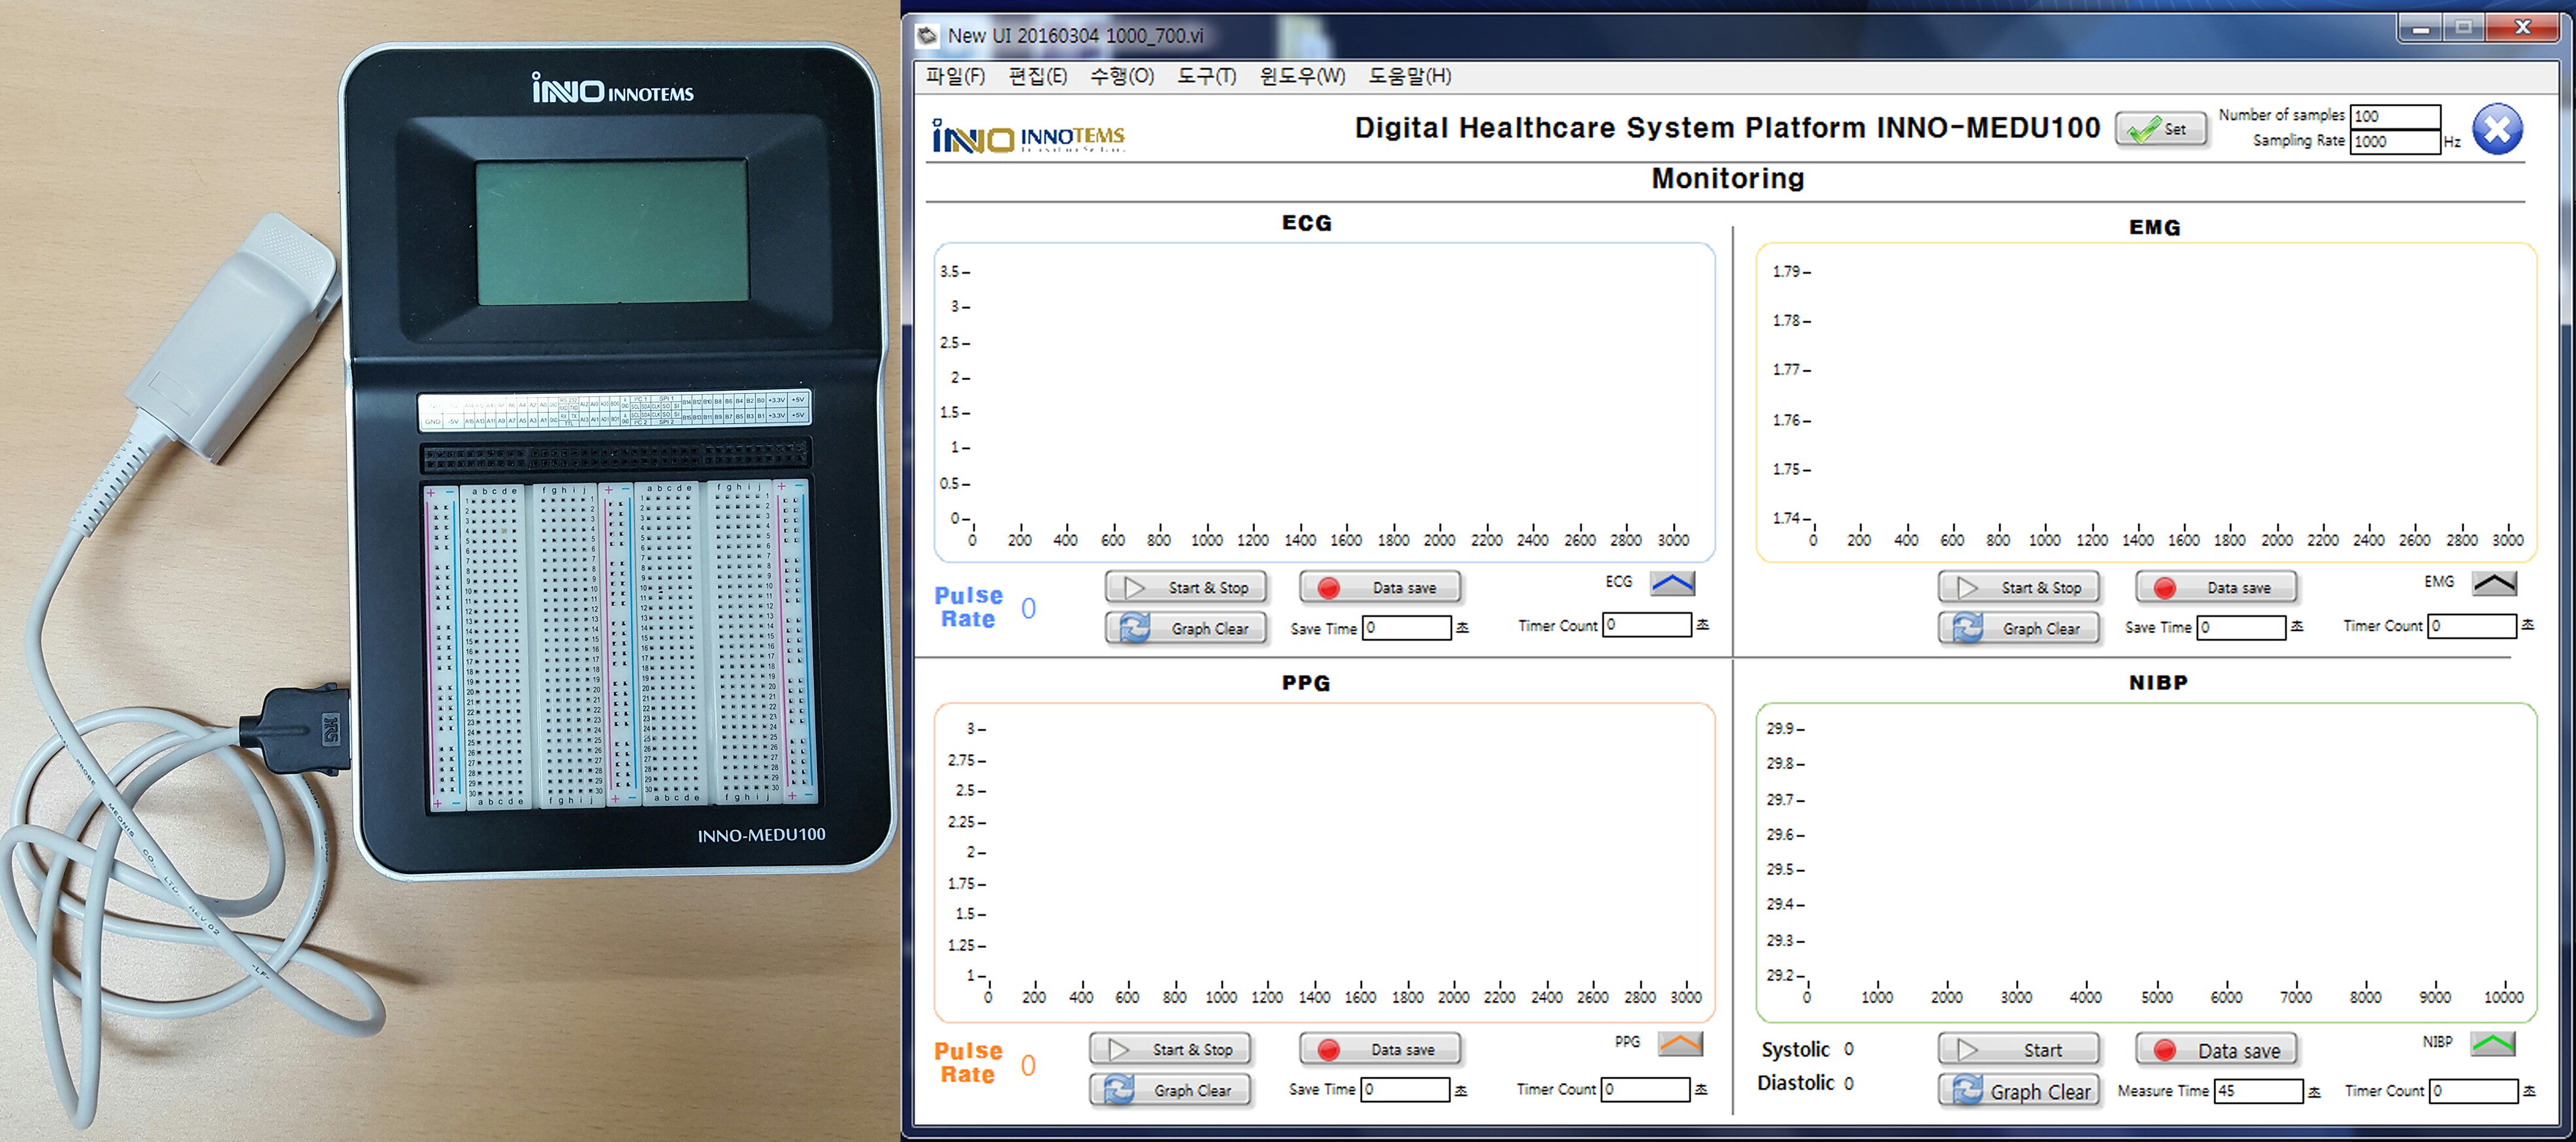
The measuring instrument was INNO-MEDU 100 (INNOTEMS Co., Ltd., Korea), a development kit for a bio-signal measurement system using medical sensors. The measurement method involved connecting the SpO2 measurement sensor and placing the PPG probes on both index fingers with the participant in a sitting pose. Subsequently, PPG signals were measured for 120 s each and the measured signals were sent wirelessly to a PC for later analysis. Figure 2a shows the measurement equipment used in the present study and Fig. 2b shows the screenshot of the PPG measurement software.
Figure 2.
a. PPG signal measuring equipment; b. Screenshot showing PPG measurement results.
2.2Preprocessing
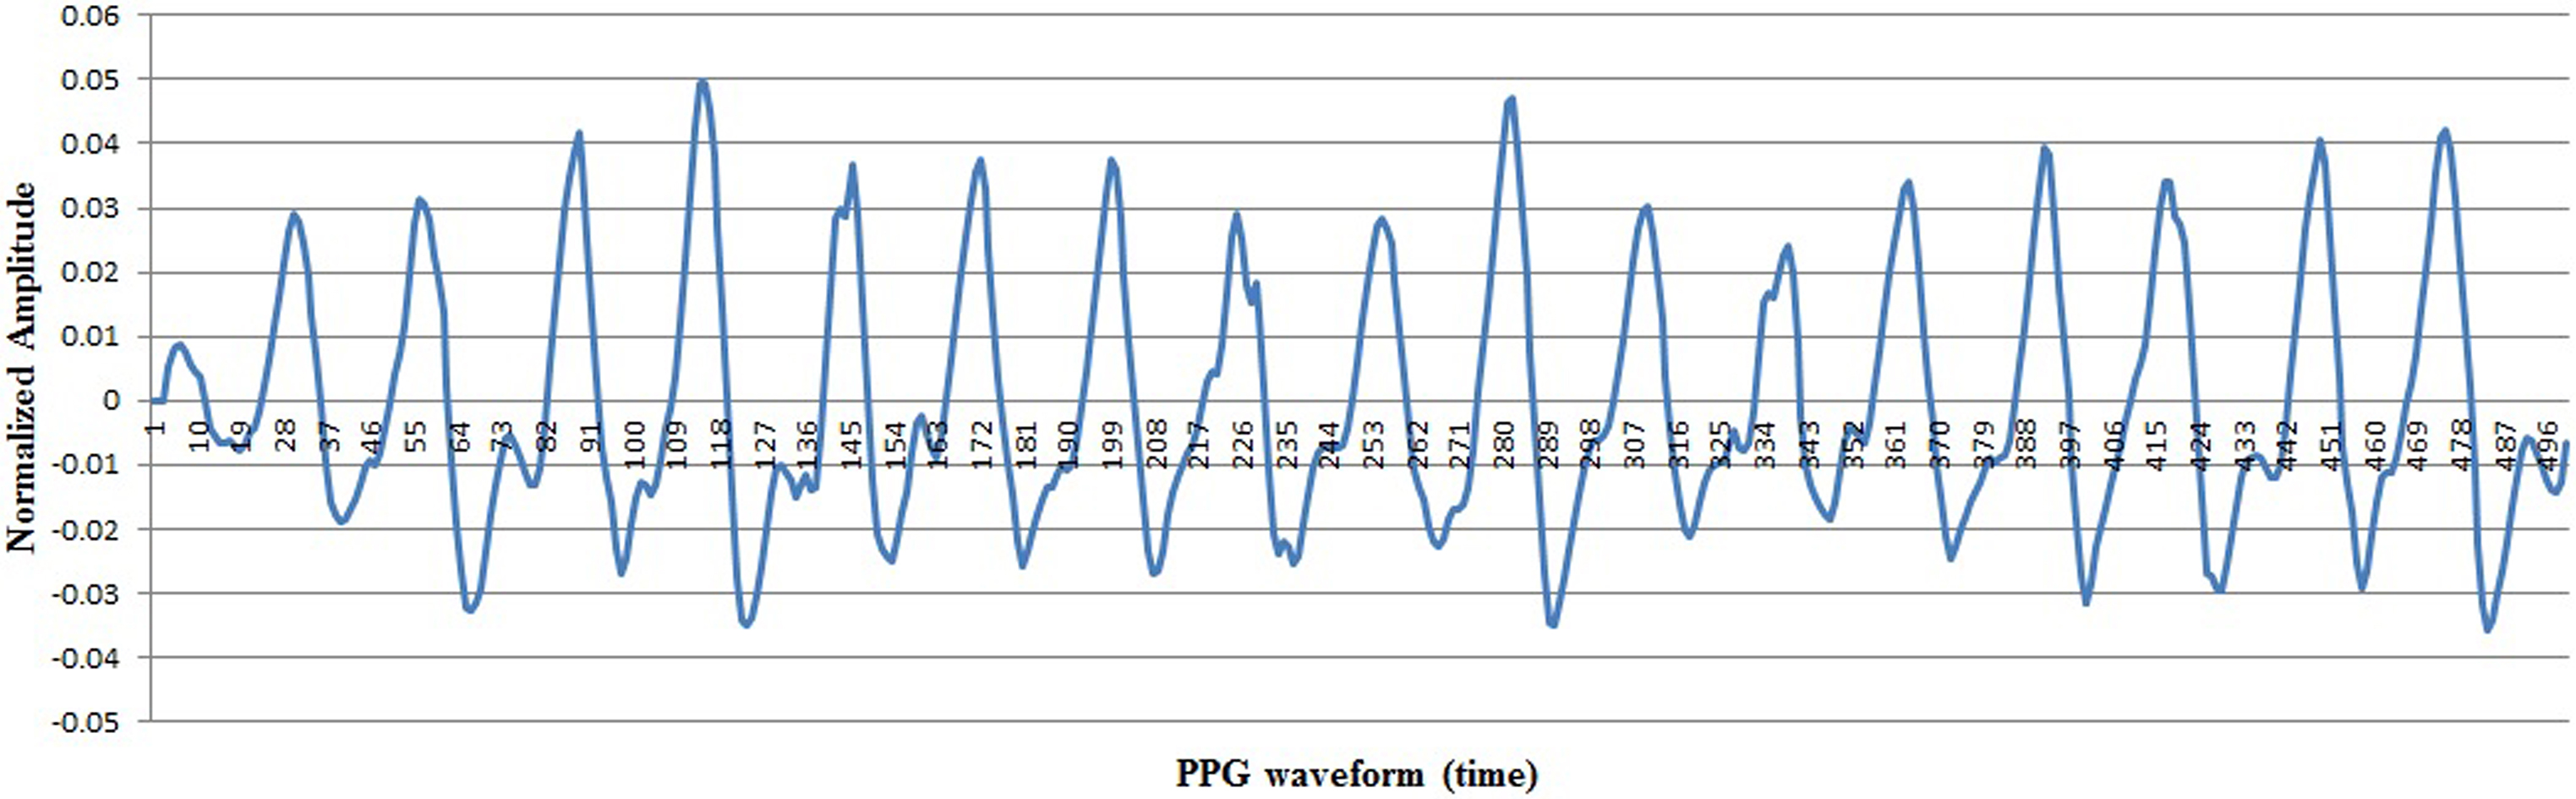
The comparison of waveform amplitude size between the subjects from PPG pulse wave signals measured from each subject required resampling of a certain number of waveform data points within a set period of time. In the present study, two resampling stages were performed. In the first stage, resampling was performed at a sampling rate of 1 kHz to extract 66,000 data points over 60 s from the initially extracted waveform data. The resampled data were designed to make it easier to extract heart rate within the waveforms. In the second stage, resampling was performed to eliminate overlapping waveforms present within a single heart rate among the resampled data. The sampling interval was adjusted so the pulse wave would contain the average heart rate per minute in the overlapping waveforms. The sampling was applied 23 intervals. Figure 3 shows the pulse wave signals after the two-stage resampling process.
Figure 3.
PPG signals after the two-stage resampling process.
2.3Feature extraction
To minimize changes in pulse wave signals that vary in each measurement from the same subject, the study applied normalization to multiple pulse wave signals of each subject that were resampled by the two-stage resampling. Normalization of the pulse wave signals was performed using the equation below (Eq. (1)).
(1)
By expressing total pulse waves measured from one subject as
In order to extract normalized pulse wave signals between subjects, the total pulse wave signals of each subject are divided into windows. Dividing the entire range into windows offers the advantage of enabling extraction of typical amplitude values from each window that are similar pulse wave signals within continuous time periods and eases the comparison of amplitude size between subjects in the same window interval. For each window, the pulse wave amplitude value representative of the pulse wave signal was detected. In the present study, 60 window intervals were applied with the goal of reflecting the features of the entire range relative to the average heart rate. The segmentation into multiple windows was designed based on the number of pulse vibration waveforms included in at least one heartbeat within each window. One feature value was extracted for each window. The maximum low amplitude (MLA) was extracted as the lowest amplitude value in each window. The rationale for selecting the MLA feature value was based on the high recognition rate for BP discrimination. Ultimately, a total of 60 features were extracted per person, one from each of the 60 windows. Feature data were extracted separately from the right and left hands and then combined.
2.4Identification
The present study applied a LDA algorithm [17] to optimally classify the BP distribution into three categories (normotensive, prehypertensive, and hypertensive) based on the MLA features. In short, LDA reduces the dimension of the feature vector for the data in such a way as to maximize the ratio of between-class scatter and within-class scatter.
If the number of subjects who participated in the experiment is
(2)
(3)
(4)
Here,
(5)
Figure 4.
Result of classifying BP into three categories (normotensive, prehypertensive, and hypertensive) using PPG.
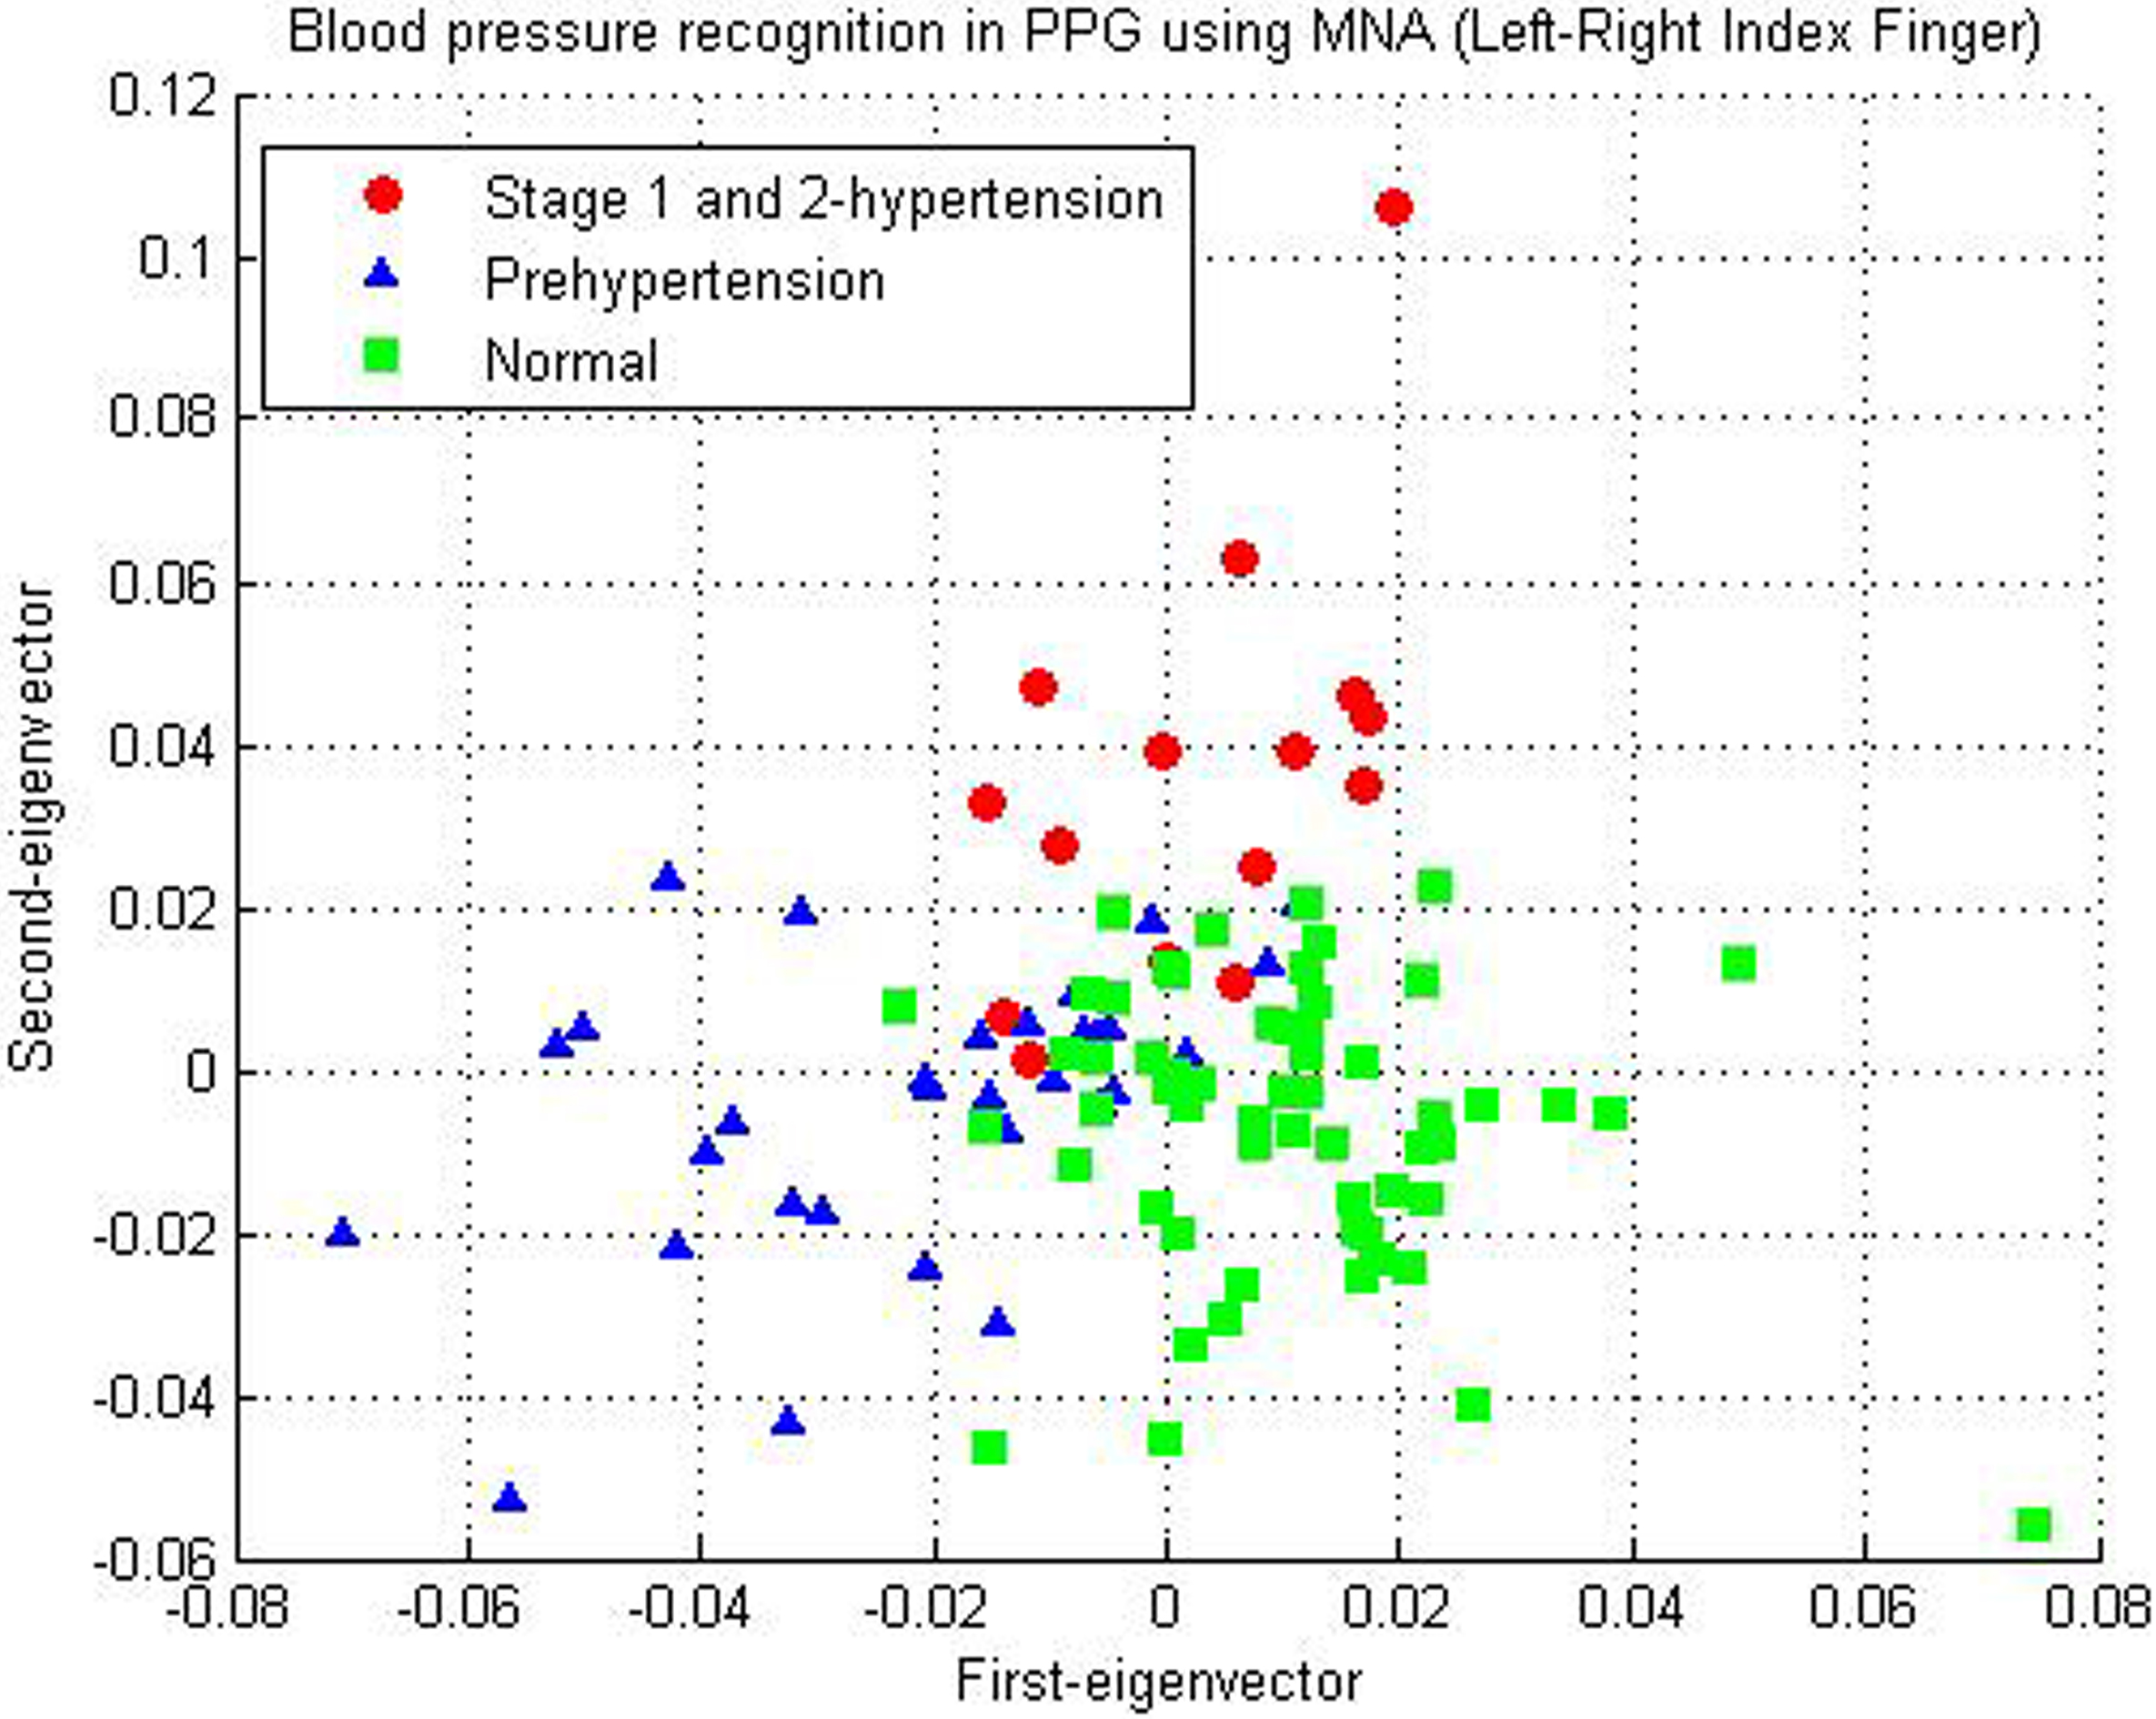
Figure 5.
a. Analysis of first-eigenvector and second-eigenvector of hypertension stages 1 and 2; b. MLA waveform distribution of hypertension stage 2; c. MLA waveform distribution of hypertension stage 1.
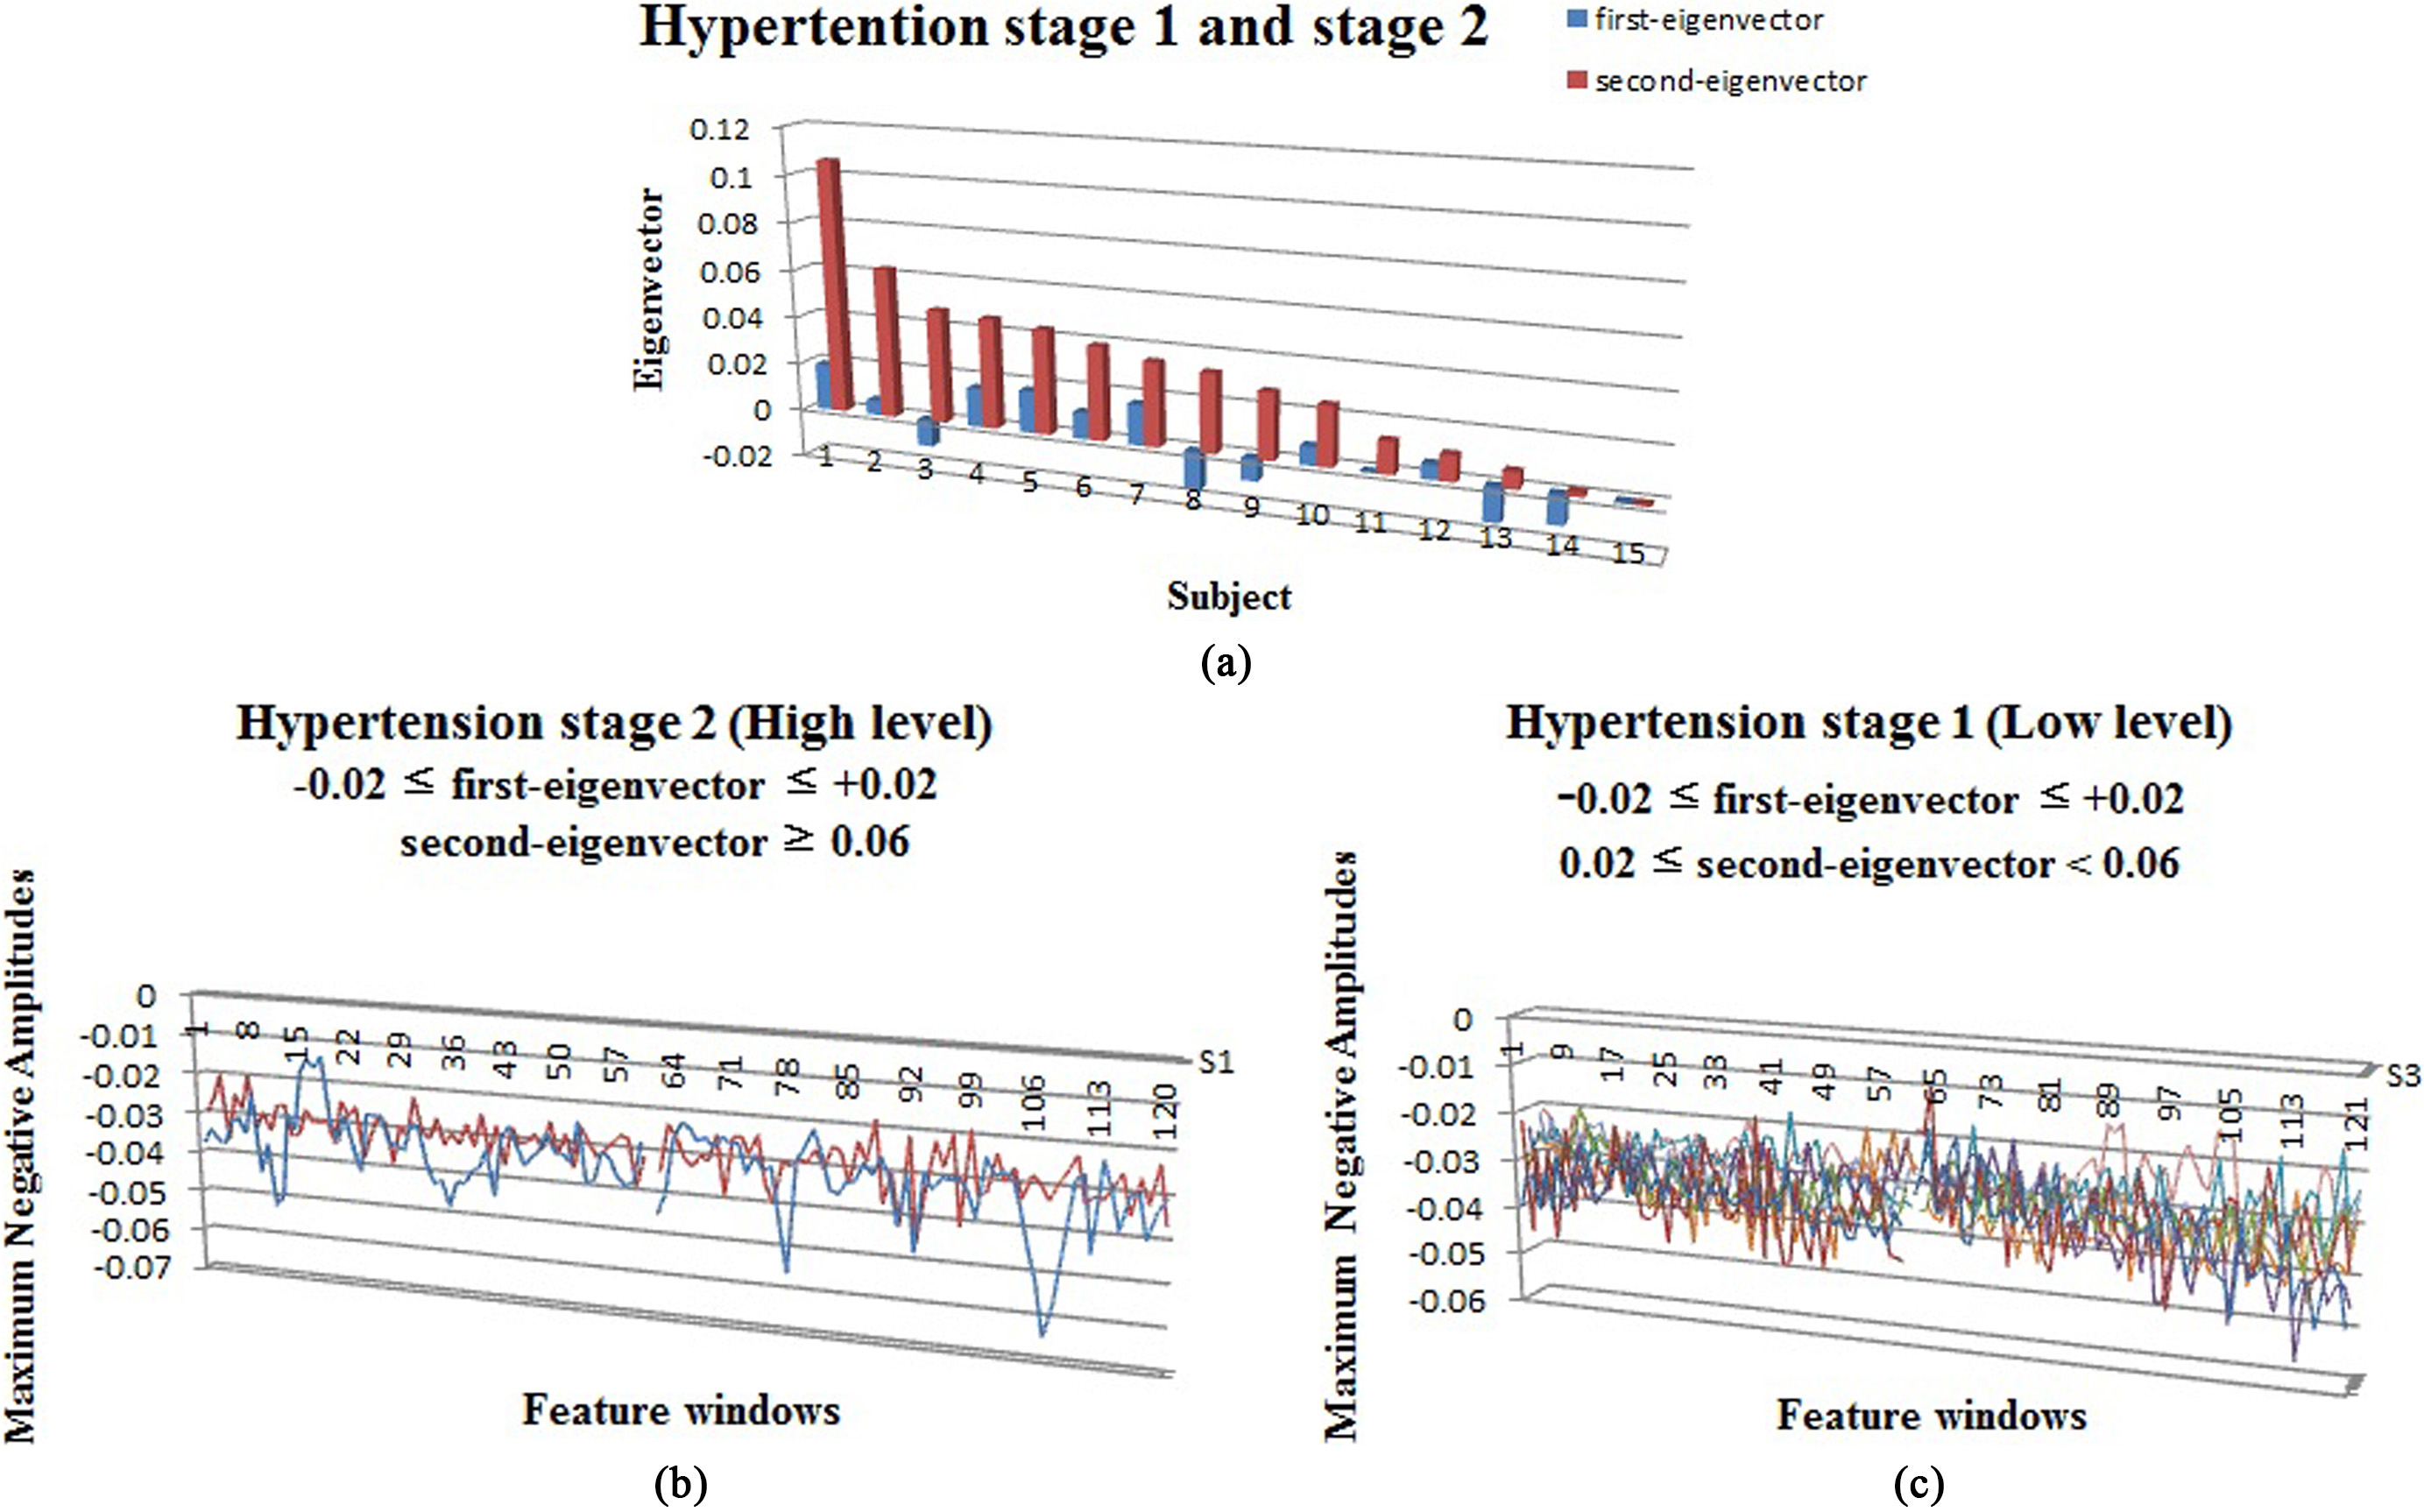
Figure 6.
Distribution of BP in subjects with a DBP
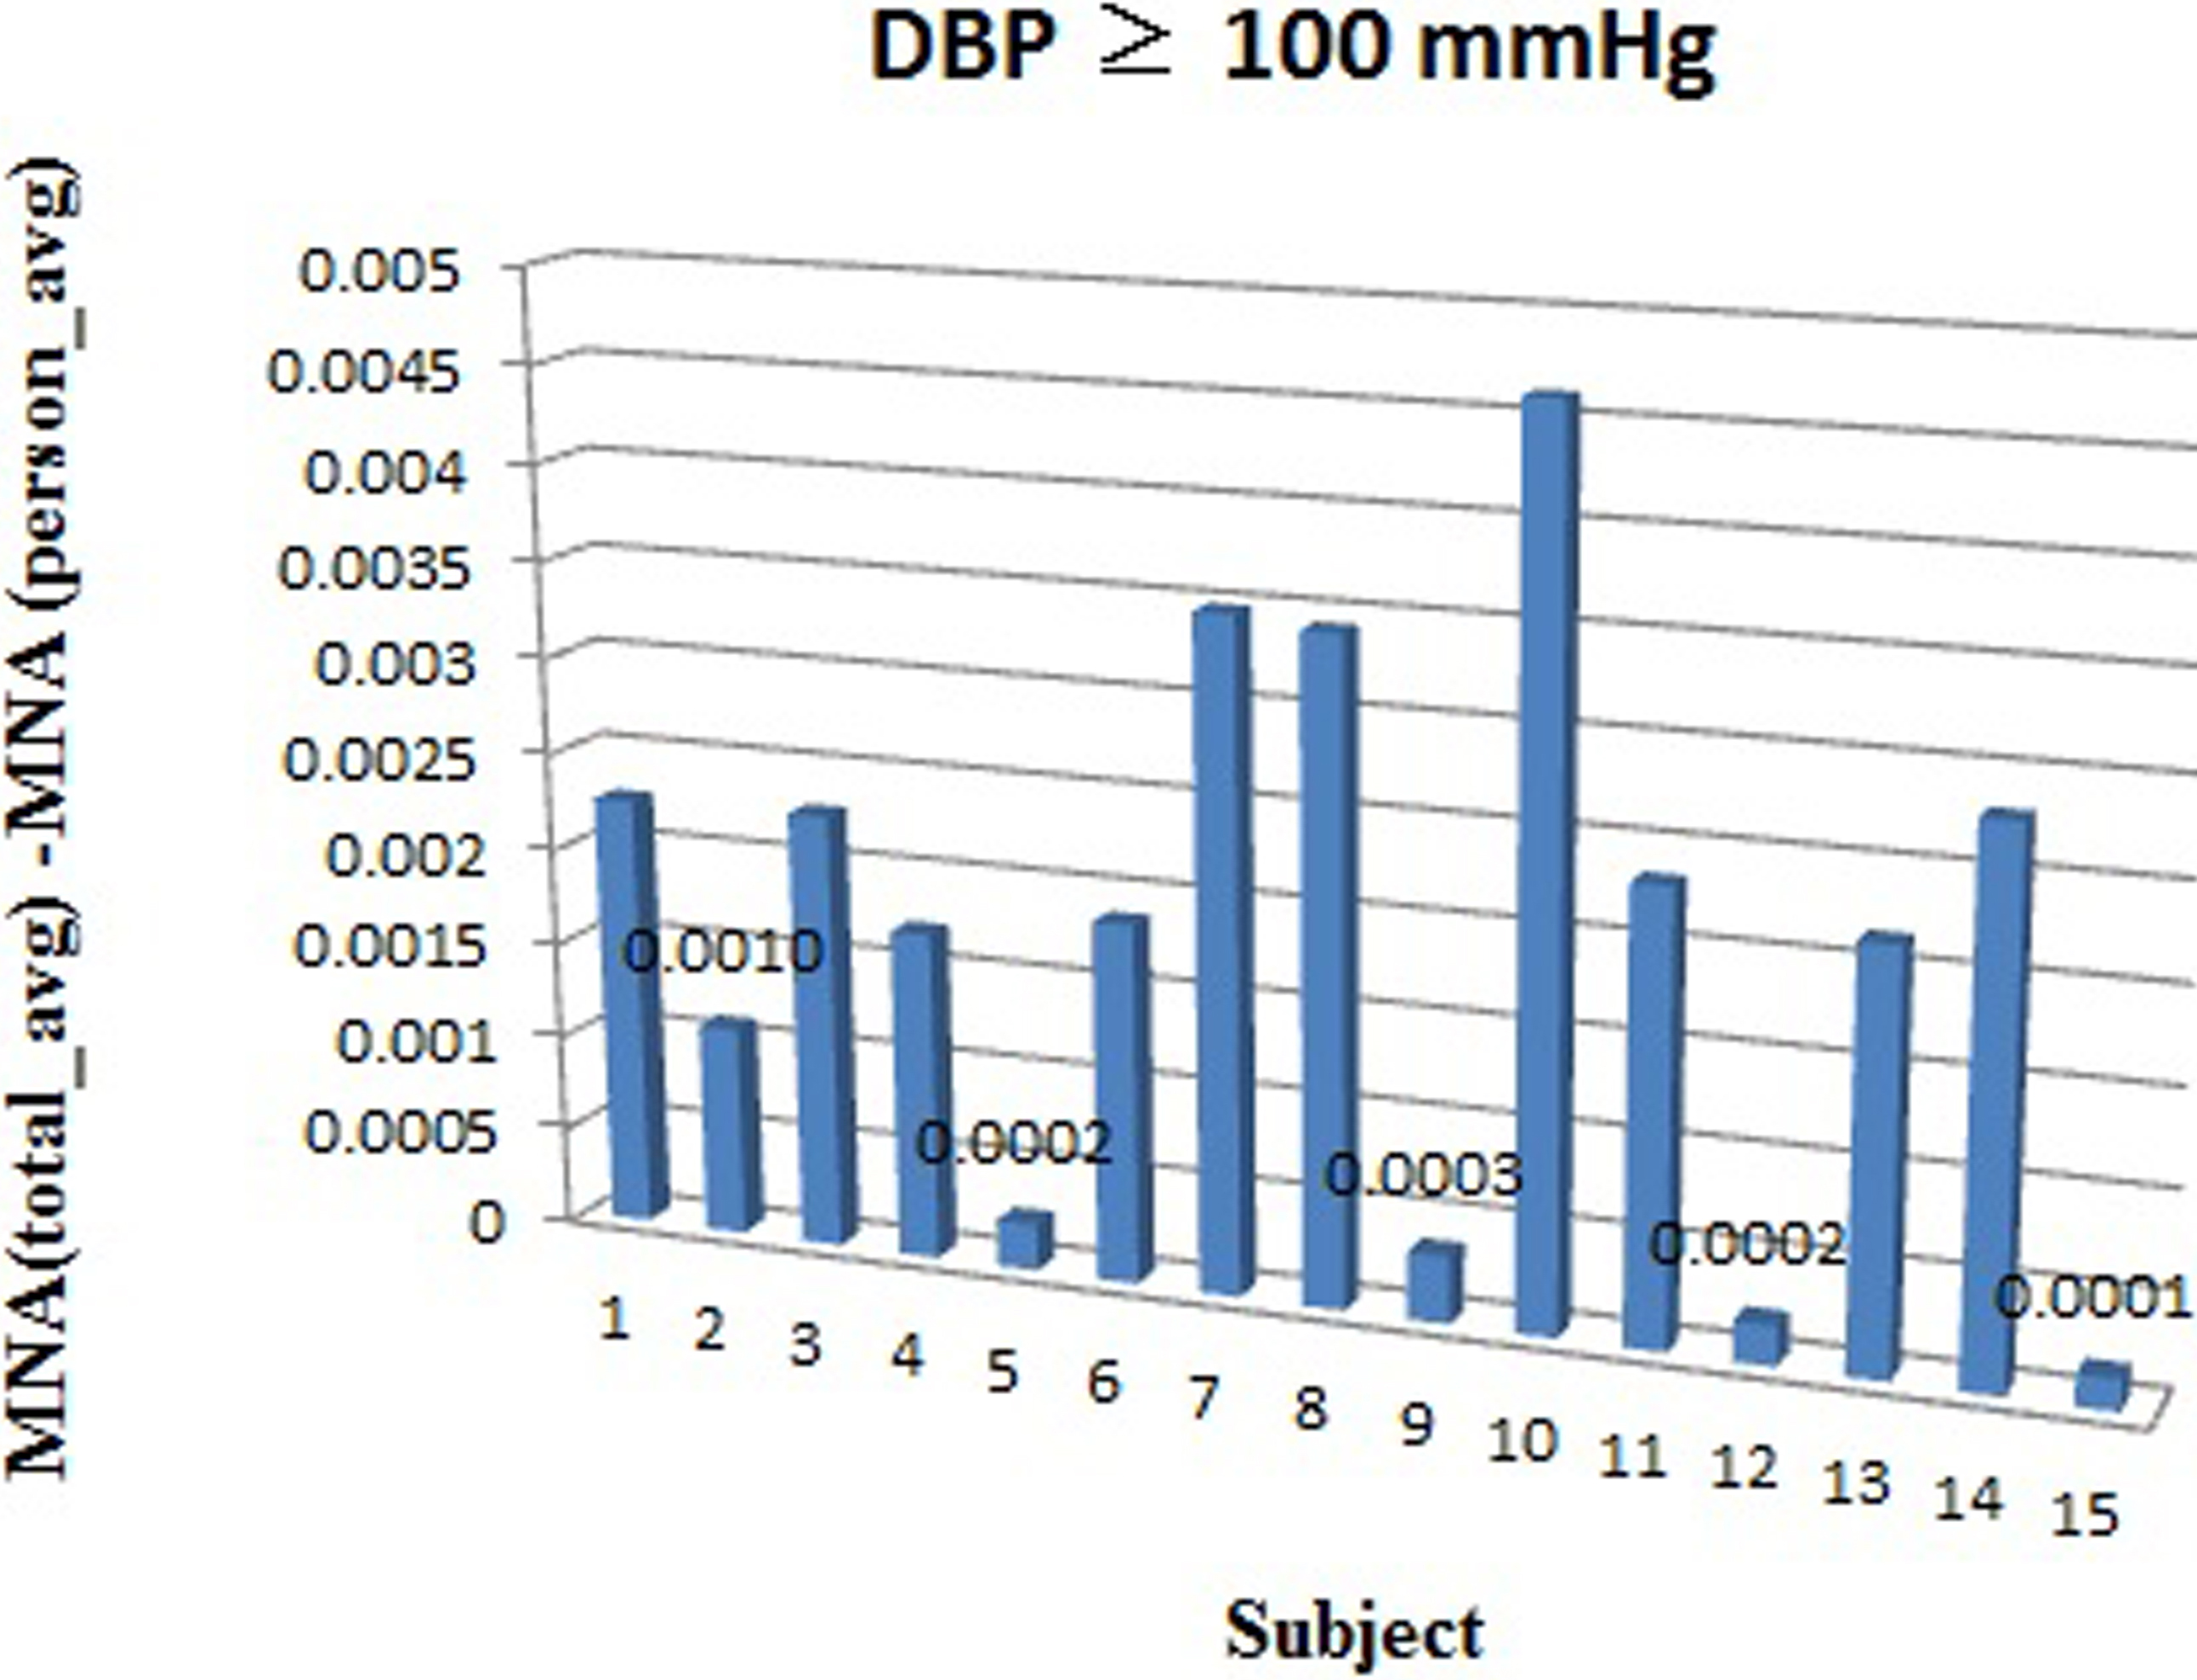
Figure 7.
a. Analysis of first-eigenvector and second-eigenvector of prehypertension; b. MLA waveform distribution of prehypertension 2 (high-level); c. MLA waveform distribution of prehypertension 1 (low-level).
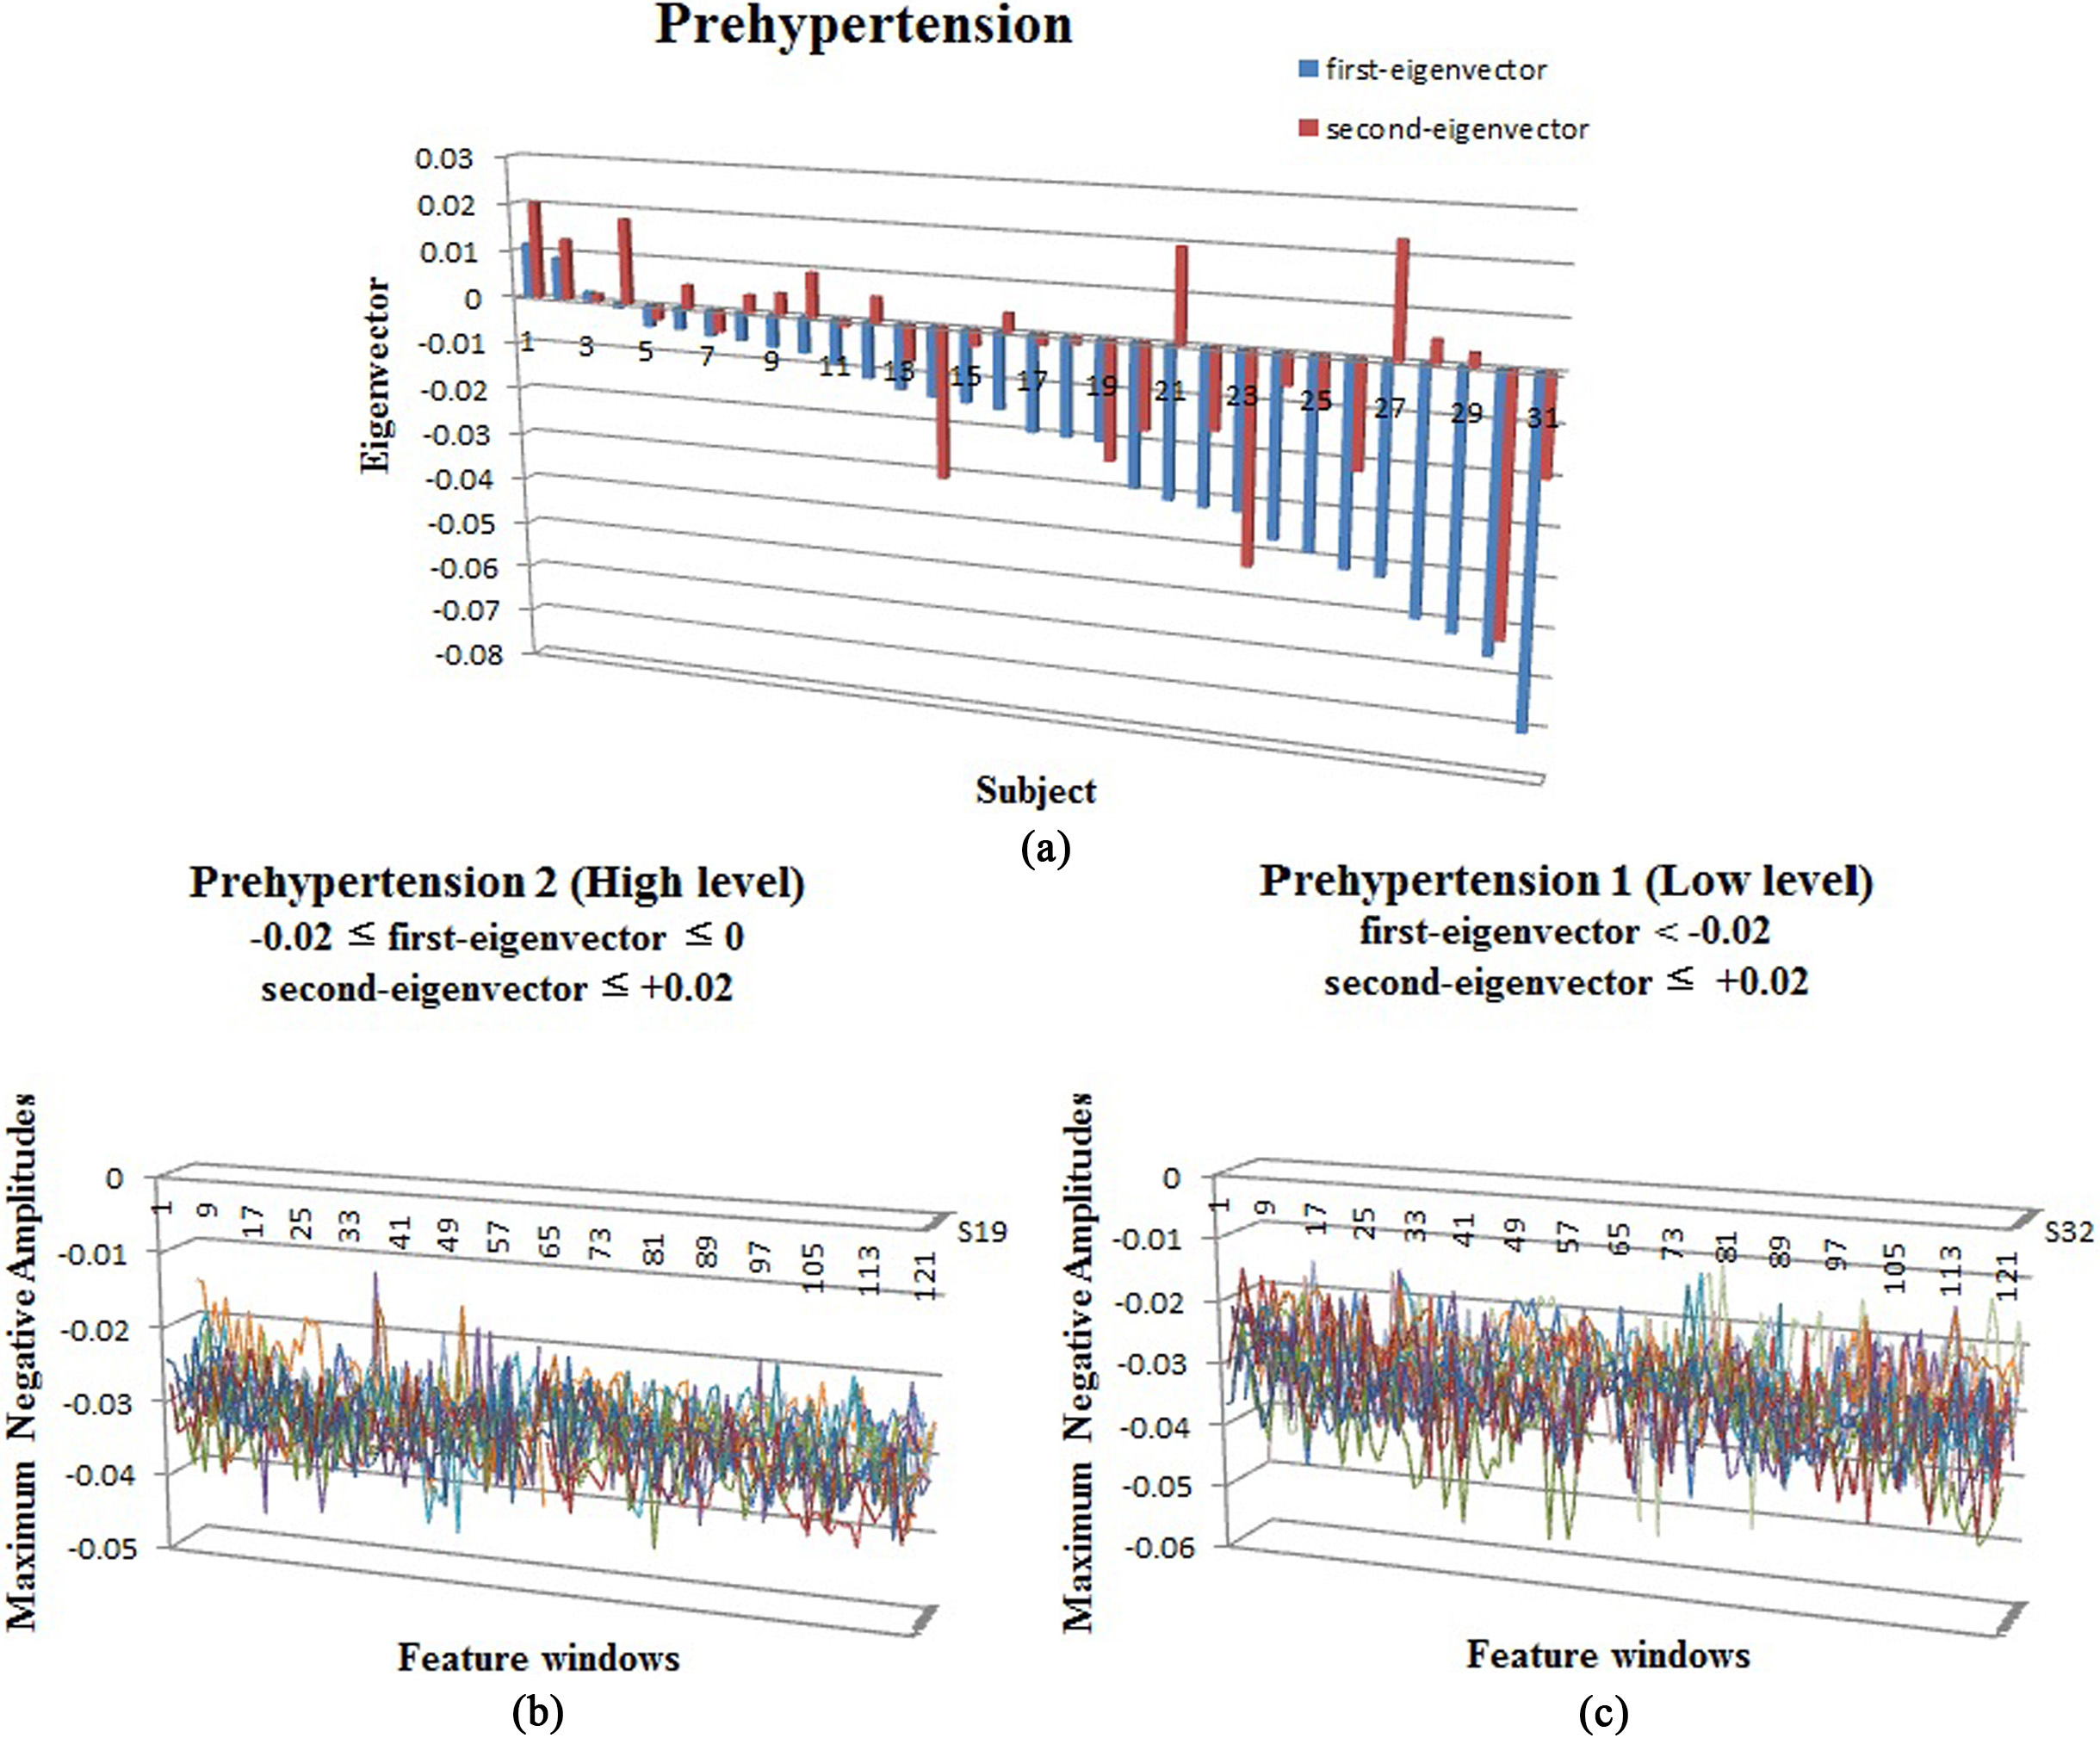
Figure 8.
a. Analysis of first-eigenvector and second-eigenvector of normal BP; b. MLA waveform distribution of normal 3 (high-level); c. MLA waveform distribution of normal 2 (middle-level); d. MLA waveform distribution of normal 1 (low-level).
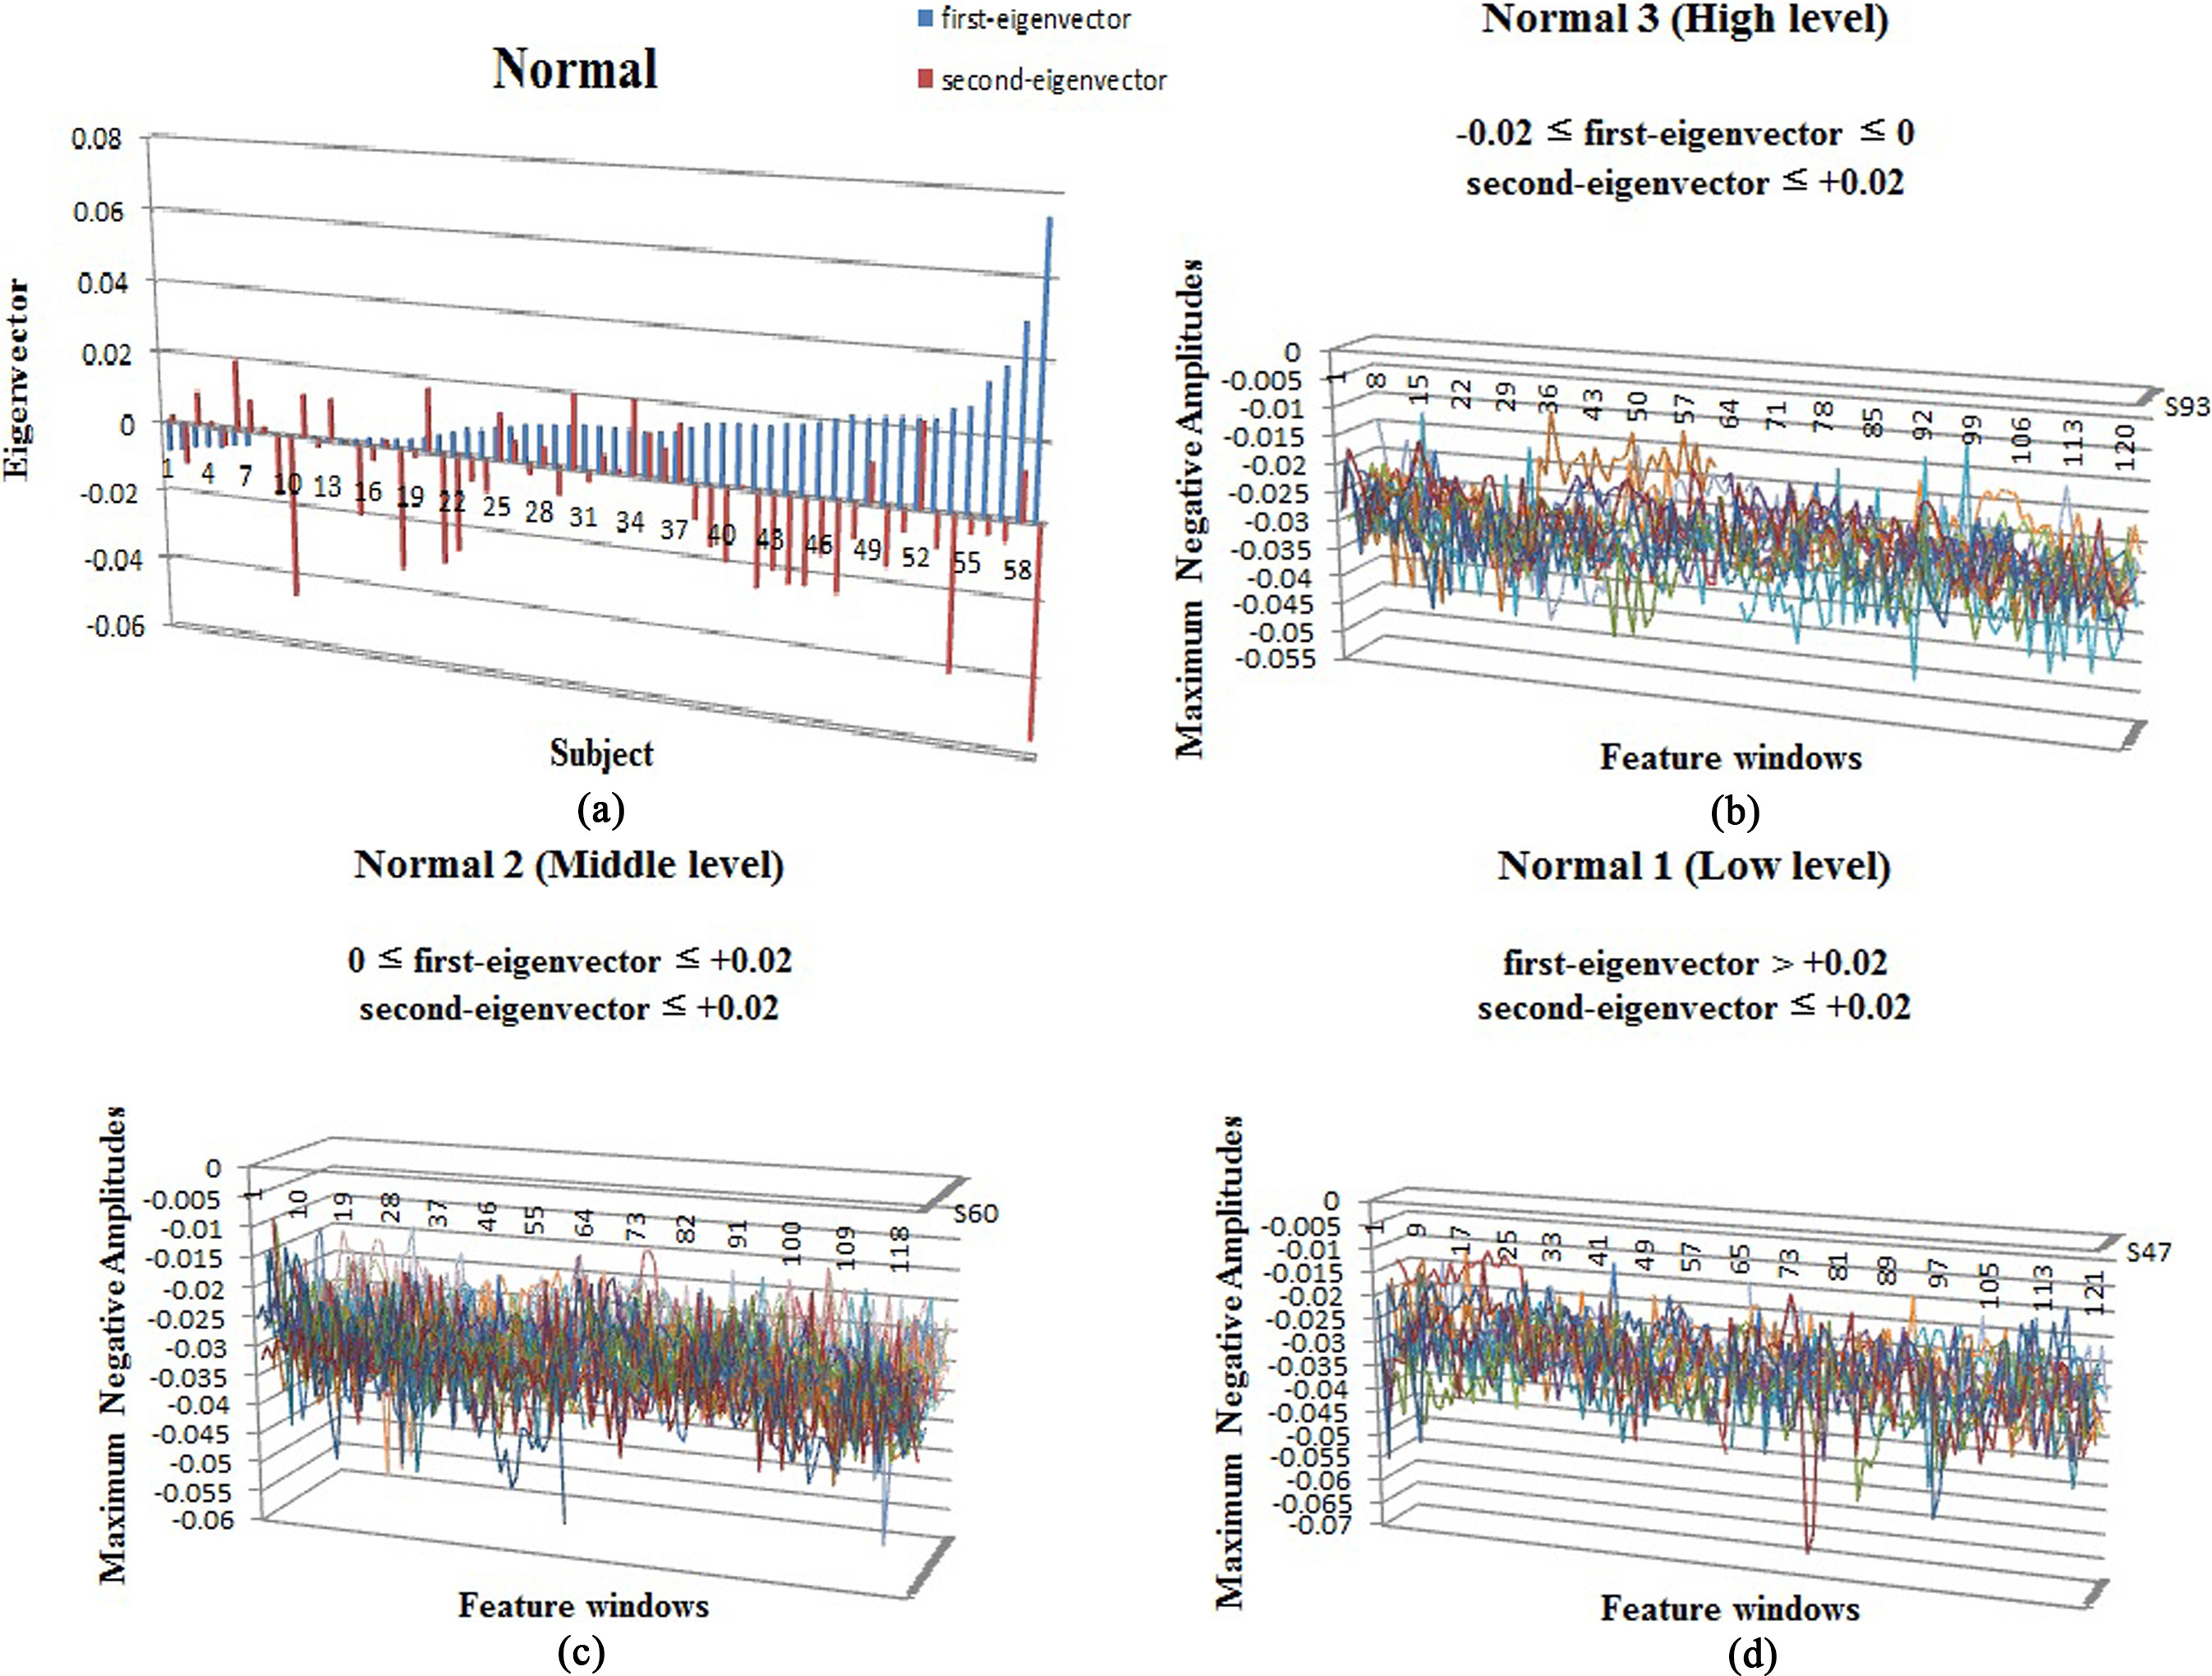
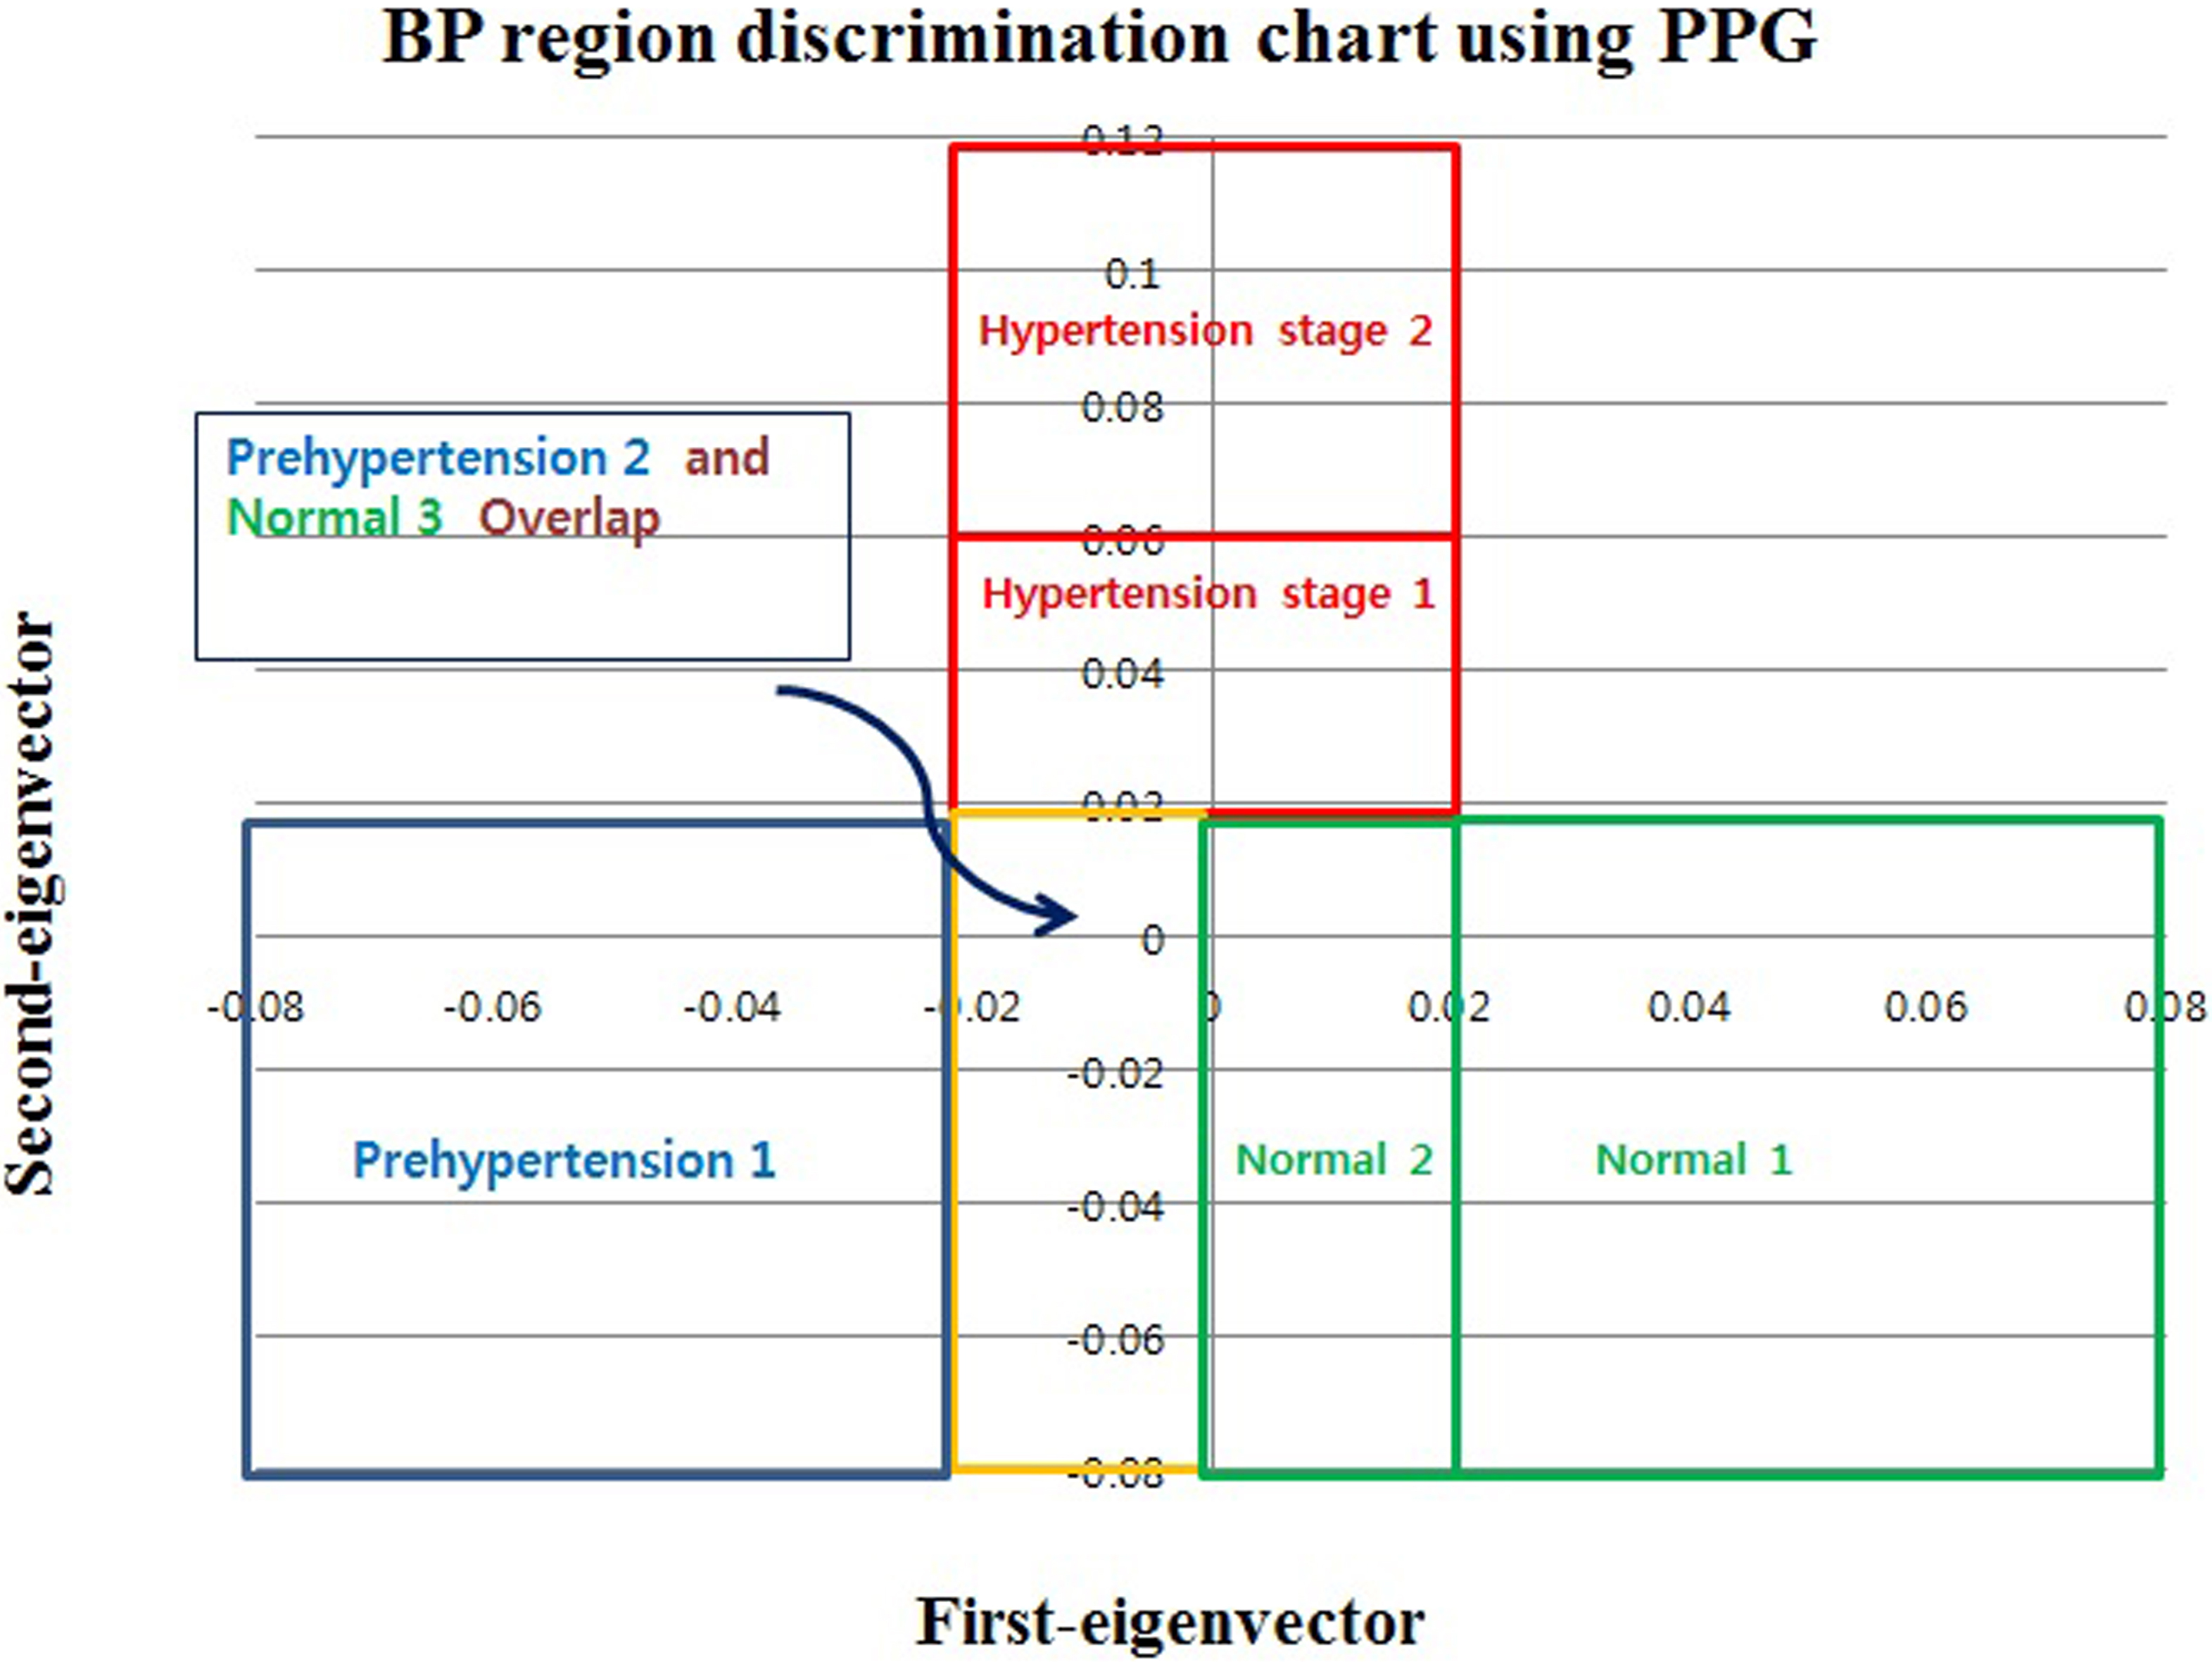
Figure 9.
BP region discrimination chart using PPG.
3.Results
The classification of BP into three categories (normotensive, prehypertensive, and hypertensive) was determined using the first-eigenvector (1-EV) and second-eigenvector (2-EV) of the LDA algorithm using MLA feature values. The experimental data consisted of MLA data obtained from the second finger of each right and left hand of a total of 105 participants aged 20–79 years. MLA feature values consisted of a total of 120 data points, 60 from each hand. Figure 4 shows the results of classifying BP into three categories using 1-EV and 2-EV in the LDA algorithm by applying the proposed feature extraction method.
Hypertension stages 1 and 2 showed a 1-EV value within the range of
Prehypertensive BP was distributed mostly in the region in which 1-EV was negative and 2-EV was
A normal BP was distributed mostly in the region with 1-EV
4.Discussion
PPG-based BP measurement offered a method for overcoming the limitations of existing oscillometric methods, including wearing a cuff and being a non-continuous measurement method. However, despite these advantages, existing SBP/DBP-based assessments have limited ability to reflect individualized traits due to their sensitivity. The findings in the present study showed that the method of BP range recognition using waveform pattern analysis of PPG signals can overcome the sensitivity issue of SBP/DBP-based methods and could reflect individualized traits. The findings in the present study could be summarized as follows.
First, an important feature in the discrimination of BP into three categories (normotensive, prehypertensive, and hypertensive) reflecting individualized traits appeared as MLA features in the PPG signal. The BP discrimination results showed that hypertension stages 1 and 2 showed distribution of 2-EV values
Subjects aged 20–39 years who were diagnosed as prehypertensive by oscillometric BP measurement but appeared in the region overlapping with normal 2, the middle-level region, on the “BP region discrimination chart using PPG” and middle-aged subjects aged 40 years or older diagnosed with normal BP by oscillometric BP measurement but appeared in the region overlapping with prehypertension 2, the high-level region, indicated a tendency of BP pattern served as an example of how well the individualized traits reflected the MLA features. Thus, we believe that MLA features are key parameters that can provide a good explanation for individualized traits in the discrimination of three BP categories.
Second, the “BP region discrimination chart using PPG” was assessed as a meaningful BP assessment method for discriminating among the three BP categories using the MLA features of PPG signals. Middle-aged subjects aged 40 years or older who showed a normal BP on the oscillometric BP measurement showed a tendency of a BP pattern that overlapped partially with the prehypertension region in the BP region discrimination method. We suspect that the BP pattern appeared in the prehypertension region due to reduced elasticity of the capillaries caused by vascular aging and vascular calcification despite their having a normal BP level from taking antihypertensive medication. In other words, this proves that BP level may temporarily appear normal due to medication, but the fundamental treatment of vascular elasticity is difficult. Moreover, subjects aged 20–39 years who belonged to the prehypertension group based on SBP/DBP (122–135 mmHg/74–85 mmHg) in oscillometric BP measurement rarely showed a normal 2, middle-level region in the BP region discrimination method are considered cases of sensitivity of the BP to the external environment, such as the white-coat effect, that could be improved.
Third, in the discrimination of BP into three categories using the LDA classification algorithm by applying PPG signals, successful recognition was possible using the 1-EV and 2-EV components. Hypertension stages 1 and 2 showed distribution when the 2-EV value was
5.Conclusions
The present study described a simple technique for discriminating among three BP categories by reflecting individualized traits using waveform pattern analysis on non-invasive and simple-to-measure PPG signals. The findings of this study showed that MLA of PPG signals measured from both index fingers is an important parameter for discriminating among three BP categories (normotensive, prehypertensive, and hypertensive). Moreover, the two-dimensional region assessment method by 1-EV and 2-EV components for discriminating among three BP categories well reflected individualized traits through the overlapping regions; thus, it is expected to be a new BP assessment technique that can accurately assess BP by improving upon the sensitivity of existing SBP/DBP-based BP assessments. Based on the findings of the present study, it is believed that cuffless PPG could become a technique that can conveniently measure and manage BP anywhere and at any time and be attached to a portable smartphone used as the main device.
Acknowledgments
This study was supported by research funds from Chosun University, 2017.
Conflict of interest
None to report.
References
[1] | Dutton EP. Heartbook: a guide to prevention and treatment of cardiovascular disease. New York: The American Heart Association; (1980) . |
[2] | Kelly R, Hayward C, Avolio A, O’Rourke M. Noninvasive determination of age-related changes in the human arterial pulse. Circulation. (1989) ; 80: : 1652–9. |
[3] | Pickering TG, Miller NH, Ogedegbe G, Krakoff LR, Artinian NT, Goff D. Call to action on use and reimbursement for home blood pressure monitoring. J Cardiovasc Nurs. (2008) ; 23: (4): 299–323. doi: 10.1097/01.JCN.0000317429.98844.04. |
[4] | Buxi D, Redoute JM, Yuce MR. Cuffless blood pressure estimation from the carotid pulse arrival time using continuous wave radar. In Conf Proc IEEE Eng Med Biol Soc. (2015) Aug; pp. 5704–7. doi: 10.1109/EMBC.2015.7319687. |
[5] | Shukla SN, Kakwani K, Patra A, Lahkar BK, Gupta VK, Jayakri A, et al. Noninvasive cuffless blood pressure measurement by vascular transit time. In 28th International Conference on VLSI Design. (2015) Jan; pp. 535–540. doi: 10.1109/vlsid.2015.96. |
[6] | Ding X, Yan BP, Zhang YT, Liu J, Zhao N, Tsang HK. Pulse transit time based continuous cuffless blood pressure estimation: A new extension and a comprehensive evaluation. Sci Reports. (2017) ; 7: : 1–11. |
[7] | Ding Z, Zhang Y, Tsang HK. Impact of heart disease and calibration interval on accuracy of pulse transit time-based blood pressure estimation. Physiolog Meas. (2016) ; 37: : 227–37. doi: 10.1088/0967-3334/37/2/227. |
[8] | Kachuee M, Kiani MM, Mohammadzade H, Shabany M. Cuffless blood pressure estimation algorithms for continuous health-care monitoring. IEEE Transact Bio-Med Eng. (2017) ; 64: : 859–69. doi: 10.1109/TBME.2016.2580904. |
[9] | Wan-Hua L, Hui W, Samuel OW, Guanglin L. Using a new PPG indicator to increase the accuracy of PTT-based continuous cuffless blood pressure estimation. In 39th Annual International Conference of the IEEE Engineering in Medicine and Biology Society (EMBC 2017). (2017) Jul; pp. 738–741. doi: 10.1109/EMBC.2017.8036930. |
[10] | Khalid SG, Zhang J, Chen F, Zheng D. Blood pressure estimation using photoplethysmography only: Comparison between different machine learning approaches. J Healthc Eng. (2018) ; 2018: : 1548647. doi: 10.1155/2018/1548647. |
[11] | Chandrasekhar A, Kim CS, Naji M, Natarajan K, Hahn JO, Mukkamala R. Smartphone-based blood pressure monitoring via the oscillometric finger-pressing method. Sci Transl Med. (2018) ; 10: (431): pii: eaap8674. doi: 10.1126/scitranslmed.aap8674.eaap8674. |
[12] | Allen J. Photoplethysmography and its application in clinical physiological measurement. Physiol Meas. (2007) ; 28: : R1–39. |
[13] | Millasseau SC, Ritter JM, Takazawa K, Chowienczyk PJ. Contour analysis of the photoplethysmographic pulse measured at the finger. J Hypertens. (2006) ; 24: : 1449–56. |
[14] | Lai PH, Kim I. Lightweight wrist photoplethysmography for heavy exercise: Motion robust heart rate monitoring algorithm. IET Healthcare Technol Lett. (2015) ; 2: : 6–11. |
[15] | Asada HH, Shaltis P, Reisner A, Rhees S, Hutchinson RC. Mobile monitoring with wearable photoplethysmographic biosensors. IEEE Eng Med Biol Mag. (2003) ; 22: : 28–40. |
[16] | Dorlas JC, Nijboer JA. Photo-electric plethysmography as a monitoring device in anaesthesia. Application and interpretation. Br J Anaesth. (1985) ; 57: : 524–30. |
[17] | Duda RO, Hart PE, Stork DG. Pattern classification. 2nd ed. Wiley-Interscience Publication JOHN Wiley & Sons, INC. New York NY (2001) . |


