
Pilots’ mental workload prediction based on timeline analysis
Abstract
BACKGROUND:
The aircraft cockpit is a highly intensive human-computer interaction system, and its design directly affects flight safety.
OBJECTIVE:
To optimize the display interface design in complex flight tasks, the present study aimed to propose a dynamic conceptual framework and a timeline task analysis method for the quantization of the dynamic time effect of mental workload and the influencing factors of task types in the mental workload prediction model.
METHODS:
The multi-factor mental workload prediction model based on attention resource allocation was integrated to establish the dynamic prediction model of mental workload. The ergonomics simulation experiment was carried out by recording the data on the performance of embedded subtasks, National Aeronautics and Space Administration-Task Load Index (NASA-TLX) subjective evaluation, and eye tracking.
RESULTS:
The results indicated that the prediction model had a good prediction accuracy and effectiveness under different simulated interfaces and complex tasks, and the real-time monitoring of pilots’ mental workload state was realized.
CONCLUSION:
In conclusion, the prediction model and the experimental method could be applied to avoid the overload of the pilot throughout the flight phase by optimizing the display interface and adjusting the flight task.
1.Introduction
Pilots often need to process large amounts of information in a relatively short time and make quick response decisions to deal with possible urgent airspace situations [1, 2]. Moray et al. proposed that rationally optimizing the operator’s mental workload distribution could effectively reduce human error and improve system reliability and operator comfort [3, 4]. Therefore, the study of pilots’ mental workload prediction can maximally prevent flight accidents by effectively adjusting the flight task and the pilots’ mental state in time [5, 6].
At present, the quantitative modeling research of mental workload is still in its infancy [7, 8]. First, most models are descriptive [9, 10], and the quantitative modeling of mental workload is mostly based on post-mortem measurement of mental workload [11, 12]. Second, still many imperfections exist in the quantitative prediction of mental workload. Bin and Salvendy [13, 14] proposed a dynamic time conceptual model for mental workload prediction, including instantaneous mental workload (IMW), average mental workload (AMW), cumulative mental workload (CMW), maximum mental workload, and total mental workload (TMW), independent of a particular field of mission scenario. Laughery et al. [15, 16] conducted a task analysis method to calculate mental workload by decomposing complex tasks into multiple simple behavioral elements and connecting the elements hierarchically and logically. However, the massive task was difficult to analyze in detail. According to the single-channel theory, Siegel and Wolf [3] introduced the timeline analysis and prediction (TLAP) method in which the time workload equaled time required/time available (TR/TA). However, these models do not consider the influencing factors of mental workload in the aviation field, nor do they take into account the impact of different task types on mental workload. Xiao et al. [17] comprehensively adopted factors such as information amount, time pressure, visual coding, and attention resource allocation to establish a multi-factor mental workload prediction model. However, the model does not consider the conflicts within task types and dynamic time effect.
Considering the aforementioned problems, the present study aimed to optimize the display interface design under different flight tasks. On account of the dynamic concept of mental workload, the timeline task analysis method was used to decompose complex tasks into several task units and simple behaviors that changed dynamically with time and employed the McCracken-Aldrich scale [5] to divide and assign each simple behavior. A dynamic prediction model of mental workload based on timeline analysis was established according to the mental workload prediction based on attentional resource allocation and information processing [17]. The model was verified by carrying out an ergonomic experiment on the civil cockpit simulator. A correlation analysis was promoted between model prediction and experimental results, concerning comprehensive metrics including the performance of embedded subtasks, National Aeronautics and Space Administration-Task Load Index (NASA-TLX) subjective evaluation, eye tracking, and other technical indicators. The significant main effects and correlations indicated that the model has a good validity and availability for different interfaces and complex tasks with dynamic time variation.
2.Model development
2.1Timeline task analysis
In practice, tasks, especially high-mobility military tasks, are complex and usually consist of one or more simple tasks [1]. Meanwhile, the flight information required by the pilot is different under different flight phases. As a result, to accurately determine the mental workload state of the pilot over time, the timeline analysis method is used to decompose the complex tasks and derive the time-variant basic task units and the time attributes of each task unit, including start time
2.2Task type correlation coefficient solution
Since different task types have different effects on mental workload, they need to be quantified according to the internal cognitive mechanism of task types [18]. Each task unit contains one or several specific behaviors [15]. The behavior of task segmentation is executed by different parts and actions of the operator [16]. The McCracken-Aldrich Mental Stress Assessment Scale [5] divides behaviors into four channels: visual, auditory, cognitive, and motor. Each channel is further subdivided into different scales of complexity. According to the multi-resource theory [3], behaviors that are not in the same channel can be executed simultaneously. The task type workload value
(1)
The task type workload value calculated using the McCracken-Aldrich scale is considered to be overly heavy if more than 8 [5]. Therefore, the task type correlation coefficient
(2)
2.3Multi-factor mental workload prediction
The multi-factor mental workload prediction based on attention resource allocation [17] is triggered by two decisive factors: external task demand and internal resource allocation of mental workload, integrating the information amount
The average amount of information
(3)
During the information perception, the attentional allocation factor
(4)
(5)
After the information is captured by the visual system and transmitted to the mental procession by the nervous system, the attention resources allocated to the
(6)
(7)
Related experimental results [2, 5, 17] show that the influence of visual coding on mental workload is less significant than that of information amount and time pressure. Therefore, the square root of visual coding is applied as the coordinated quantitative result in the model.
Considering the dynamic time effect of the mental workload, the present study improved the method of quantifying time pressure [17]. According to the TLAP, the time pressure affecting the mental workload is highly correlated with TR/TA on the timeline process. Therefore, the adapted calculation of the time pressure
(8)
(9)
Altogether, the multi-factor mental workload prediction value
(10)
2.4Dynamic time effect calculation of mental workload
To monitor the pilots’ mental workload state in real time, the IMW, CMW, TMW, and AMW are established under the dynamic conceptual framework of mental workload [13, 14].
IMW is defined as the instantaneous amount of mental workload at a given time. Combined with
(11)
The TMW
(12)
The AMW (in bit) is defined as the average intensity of mental workload throughout the time course.
(13)
3.Experimental method
3.1Participants
The study was performed on 21 participants (19 males and 2 females), with an average age of 24.5 years (N
3.2Study design
The study was based on the actual flight tasks, using the display interface (3)
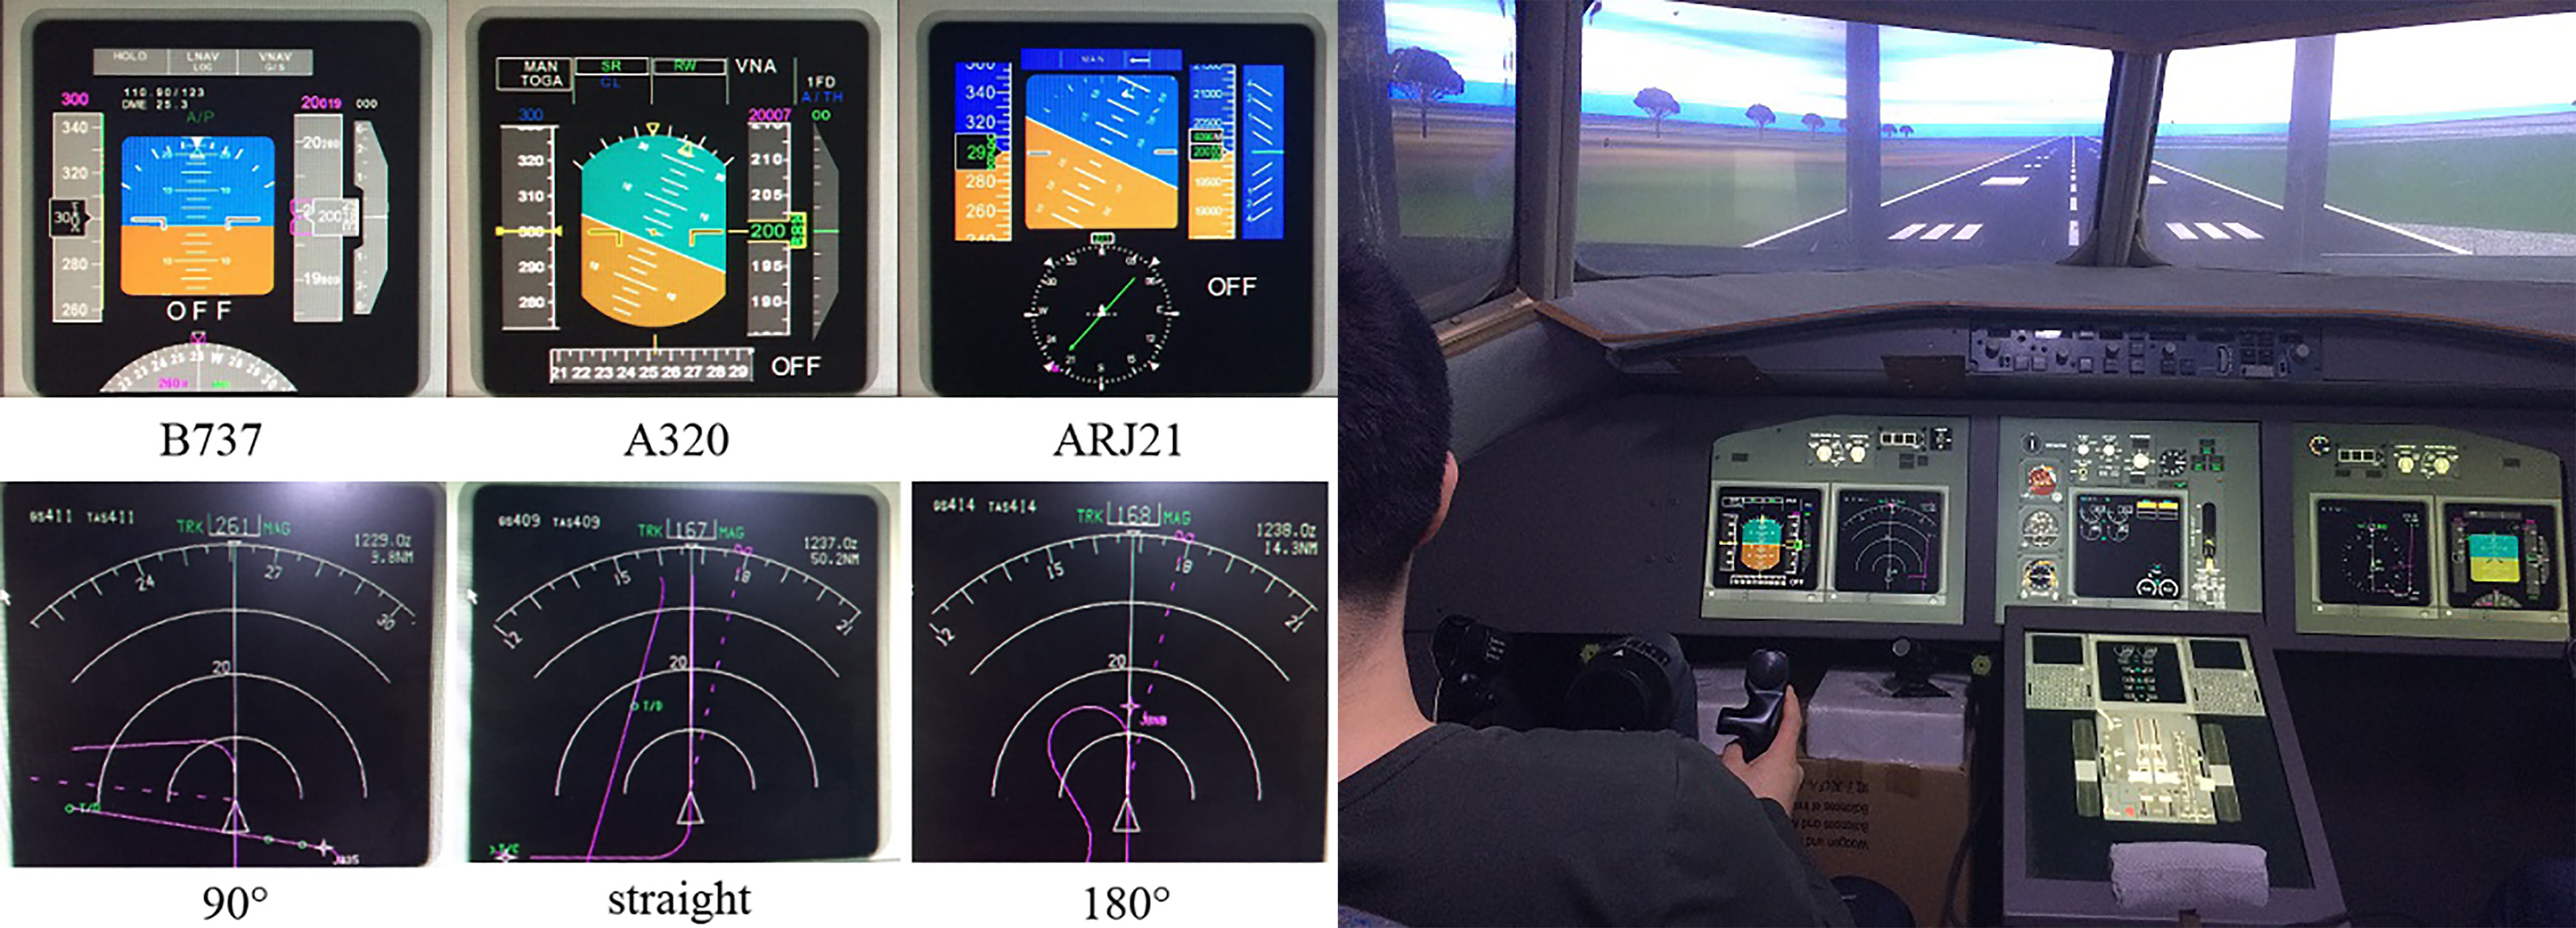
Figure 1.
Simulated interface of B737, A320, and ARJ21, cruising flight phase (left) and simulation (right).
3.3Materials
The experiment was carried out in a Boeing 737–800 flight simulator, with real-time performance and eye movement indicators monitored. Within 15 min after the end of each experiment, the participants were asked to finish the subjective evaluation of different display interfaces and flight phases according to their real feelings.
Since the flight task performance was difficult to measure directly, the reaction time and the accuracy of the embedded subtask were used as performance indicators, which were automatically recorded by MATLAB programming through keyboard operation. The Swedish noncontact infrared eye tracking system Smart Eye Pro 4.5 was used to record the eye movement data, with an accuracy of better than 1
3.4Experiment task
This experiment applied the embedded subtask method proposed by Wickens et al. [3], requiring the participant to monitor and identify the flight information on the PFD and navigation display (ND) using the remaining capabilities while ensuring that the manual control task (main task) was completed, including airspeed, altitude, pitch, and heading. During the experiment, the display interface was frozen and covered at any time, and the subject answered questions about the current value or change characteristics of the flight information within the specified time.
Manual control flight task is a simulated dynamic flight task for takeoff and cruise under a specified interface. The participants need to complete the takeoff operation by controlling the landing gear, throttle, flaps, and so on. The simulated cruise tasks consist of three phases. The participants are asked to control the steering wheel so that the aircraft can fly along the prescribed flight path and keep the airspeed, altitude, and attitude within the normal range.
4.Results
4.1Theoretical predictions
First, the takeoff phase lasts 109 s. The operations using accumulated long-term memory related to operation steps through experience and learning are divided into 11 task units. Second, the cruise phase lasts for 240 s and is decomposed into a single task unit. PFD and ND are divided into five AOIs. Then, the IMW value is calculated, as shown in Fig. 2. The TMW and AMW are shown in Table 1.
Table 1
Mental workload prediction and descriptive statistics (mean
| TMW /bit | AMW /bit | Correct rate /1 | Reaction time /s | Subjective evaluation /point | Blink frequency /Hz | Average gaze time /s | ||
|---|---|---|---|---|---|---|---|---|
| B737 | 1 | 590.92 | 5.42 | 0.40 | 4.98 | 66.47 | 0.22 | 0.20 |
| 2 | 876.91 | 3.65 | 0.60 | 4.44 | 67.91 | 0.15 | 0.17 | |
| 3 | 362.07 | 1.51 | 0.67 | 4.44 | 54.97 | 0.15 | 0.18 | |
| 4 | 1010.02 | 4.21 | 0.61 | 4.47 | 70.72 | 0.11 | 0.15 | |
| A320 | 1 | 552.63 | 5.07 | 0.47 | 5.80 | 67.08 | 0.23 | 0.17 |
| 2 | 876.60 | 3.65 | 0.55 | 4.54 | 67.50 | 0.17 | 0.15 | |
| 3 | 362.86 | 1.51 | 0.67 | 4.74 | 52.75 | 0.16 | 0.20 | |
| 4 | 997.89 | 4.16 | 0.63 | 4.54 | 72.20 | 0.12 | 0.14 | |
| ARJ21 | 1 | 606.10 | 5.56 | 0.44 | 5.19 | 67.25 | 0.22 | 0.24 |
| 2 | 905.02 | 3.77 | 0.52 | 4.69 | 70.18 | 0.14 | 0.17 | |
| 3 | 370.46 | 1.54 | 0.63 | 4.33 | 54.60 | 0.15 | 0.22 | |
| 4 | 1022.92 | 4.26 | 0.57 | 4.26 | 72.46 | 0.13 | 0.18 |
Note: MW conditions are 1 (takeoff), 2 (90
Figure 2.
IMW of the three display interfaces during the takeoff phase.
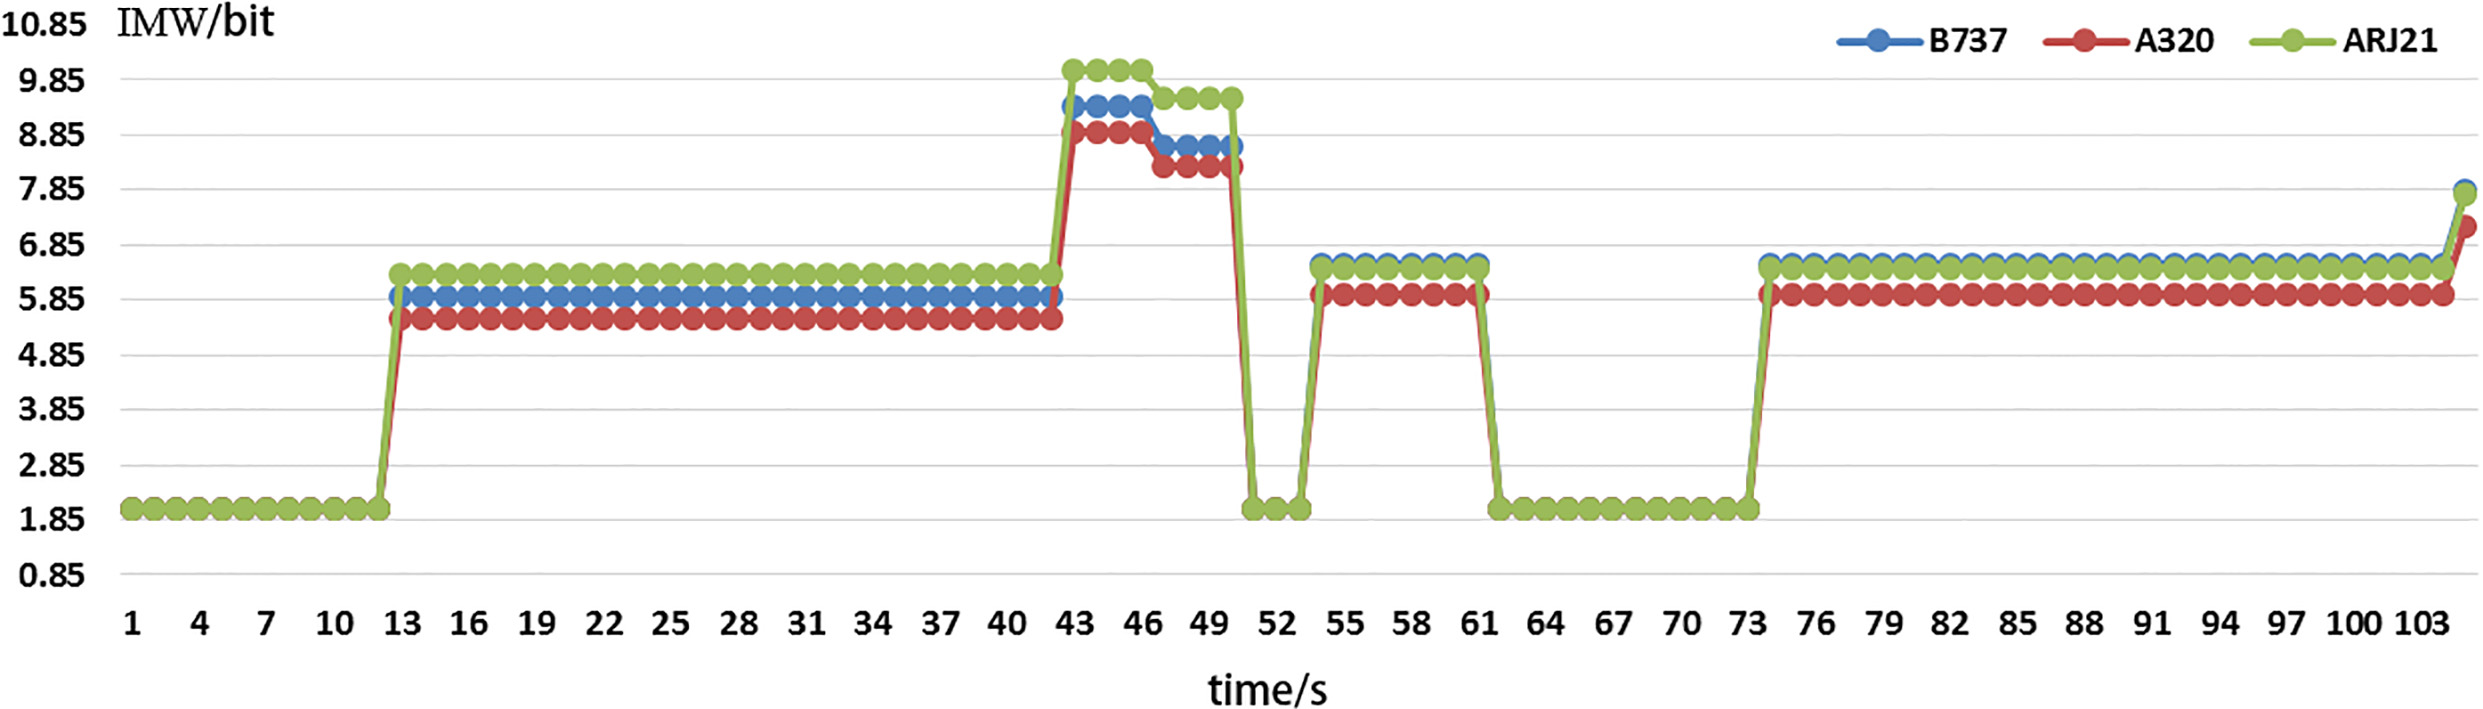
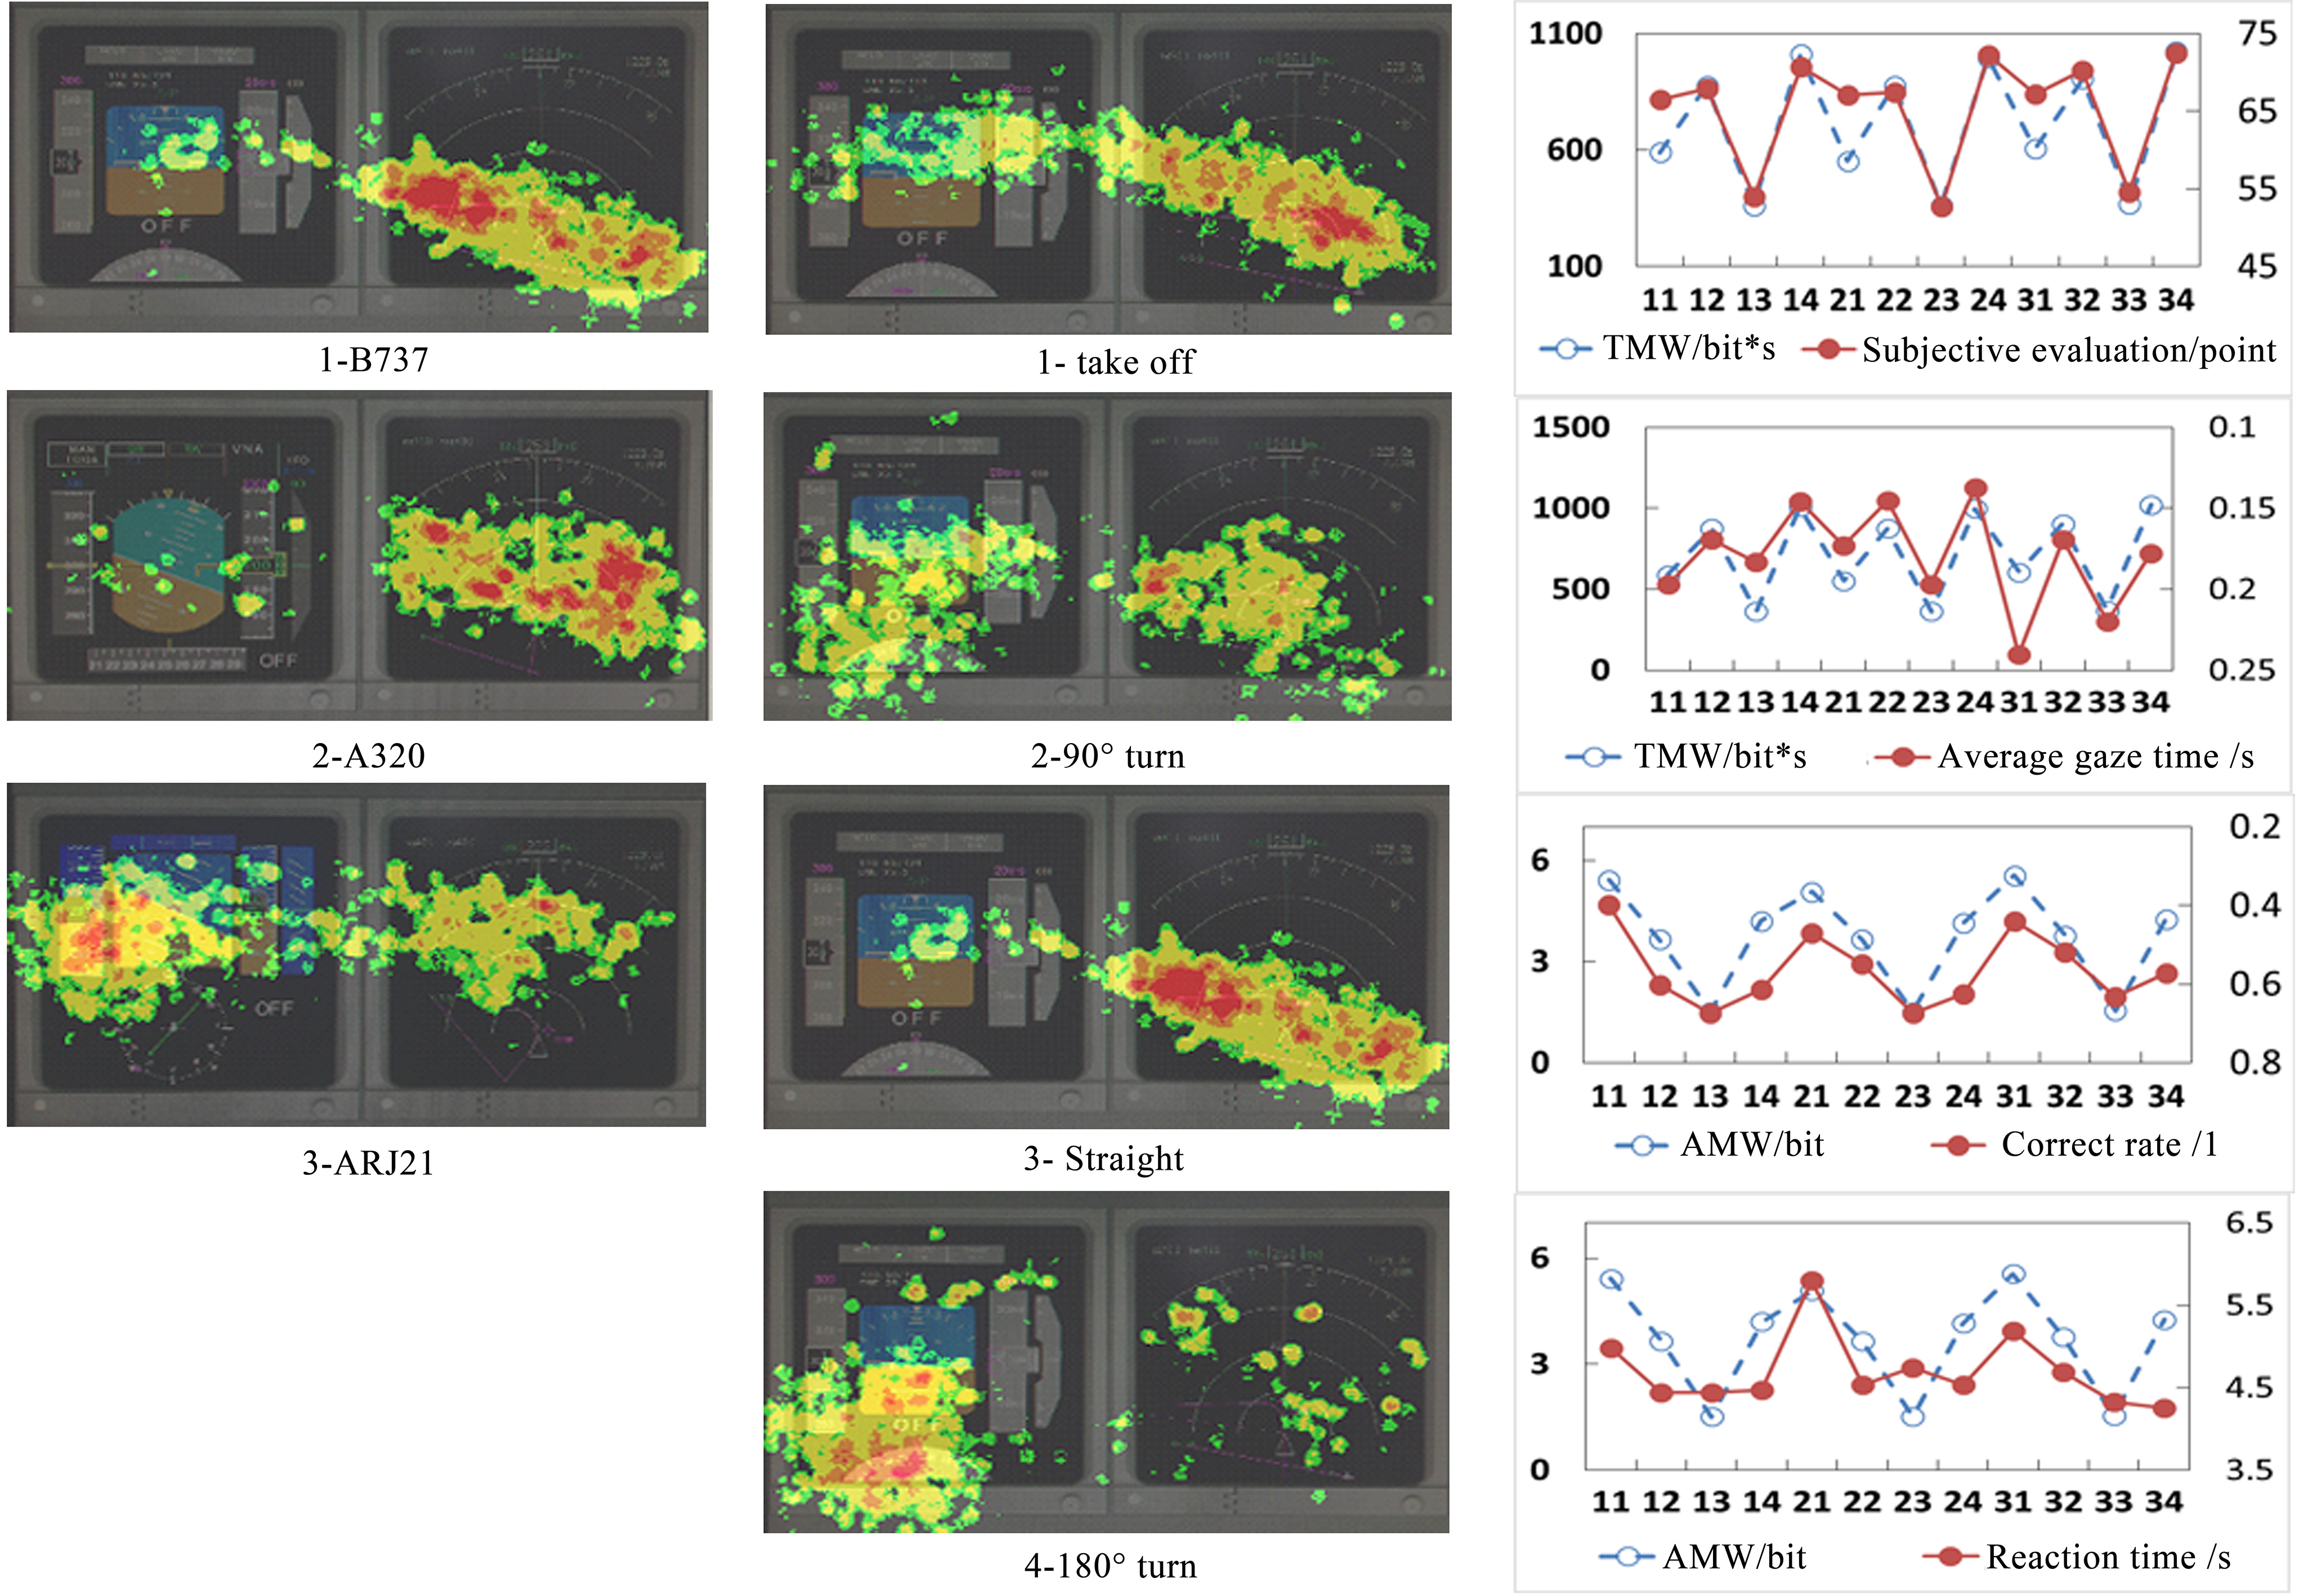
Figure 3.
Distribution of gaze points (left) and correlation between mental workload prediction and some experimental values (right).
4.2Experiment result
The repeated-measures variance analysis (RMANOVA) of the two-factor design showed that the main effect of the display interface was only significant for the average gaze time (
The multiple comparisons after single-factor test showed that the performance, subjective evaluation, and blink frequency were not significant among the three interfaces, and the gaze time was partially significant (
As shown in Fig. 3, the Pearson correlation analysis between the prediction and experimental results indicated a significant positive correlation between TMW and subjective evaluation (
5.Discussion and conclusion
The ergonomics simulation experiment verified the sensitivity of each measure indicator to the mental workload under different display interfaces and flight tasks, so the performance of embedded subtask, National Aeronautics and Space Administration-Task Load Index (NASA-TLX) subjective evaluation, and eye tracking could construct a comprehensive evaluation system of pilots’ mental workload in actual flight environment. The low correct rate, long reaction time, high subjective evaluation, low blink frequency, and short average gaze time could mean the overload of the pilots which should be avoided.
Since the main effect of NASA-TLX is significant in different flight phases, and the correlation between the results of NASA-TLX and the TMW compared with the AMW is better, the TMW can be measured by the subjective evaluation of NASA-TLX, which is consistent with the results of dynamic mental workload framework [13, 14]. The main effects of performance in different flight phases are also significant. AMW negatively correlates with accuracy and positively correlates with reaction time, showing that the performance of embedded subtasks is reliable to AMW. Consequently, the research framework with AMW, TMW. and IMW is more accurate than that with a single workload.
On one hand, studies have proved that gaze time not only is a sensitive indicator of task difficulty but also can be used to judge the readability of display interface [2, 5, 8, 10]. The main effect of the gaze time is significant under the display interface and in the flight phase. Furthermore, a significant positive correlation exists with the theoretical prediction under the display interface, while a significant negative correlation is present in the flight phase. This may be due to the fact that, to achieve better performance, participants allocate more mental resources to complete the embedded subtask under the condition of the lower workload of the main flight task, thus showing the opposite trend of the gaze time. On the other hand, related studies have explained that an increase in the perceived workload can lead to a decrease in the blink frequency, and an increase in cognitive workload can lead to a faster blink frequency [2, 5, 8, 17]. The main effect of the blink frequency in the flight phase is significant: takeoff
The significant main effects and correlations in the flight phase indicate that the prediction model has good validity and availability for complex tasks with dynamic time variation. The display interface is only significant at the gaze time because the three interfaces are from active models that meet airworthiness standards and do not significantly increase pilots’ mental workload. Nevertheless, the trend is basically the same under each metric: the ARJ21 interface has the highest subjective evaluation, the lowest correct rate, the longest gaze time, and the lowest blink frequency. The difference between B737 and A320 is small, which is consistent with the theoretical prediction.
Compared to most of the existing mental workload quantitative models, the present study proposed a dynamic prediction model of mental workload based on timeline analysis. Through the timeline task analysis, complex flight tasks were decomposed into several simple task units. The McCracken-Aldrich scale was used to assign the task units to four channels, and the impact of task type and complexity on mental workload was comprehensively analyzed and quantified. Benefiting from the improved time pressure quantification method and the adjusted proportion of visual coding in the model, the accuracy of multi-factor mental workload prediction improved. Besides, the dynamic time conceptual framework of mental workload was introduced to realize real-time monitoring, analysis, and prediction of pilots’ mental workload status. As a result, the model could be applied to reduce aviation accidents by predicting overload of the pilots and proposing real-time and effective solutions throughout the flight phase. Meanwhile, without considering resource interference between multitasking, the model had limited accuracy in the multi-task environment. Follow-up studies may further improve the mental workload prediction model.
Acknowledgments
This study was co-supported by the joint program of the National Natural Science Foundation of China and Civil Aviation Administration of China (grant no. U1733118), as well as the Aeronautical Science Foundation of China (grant no. 201813300002).
Conflict of interest
None to report.
References
[1] | Grassmann M, Vlemincx E, von Leupoldt A, et al. Individual differences in cardiorespiratory measures of mental workload: An investigation of negative affectivity and cognitive avoidant coping in pilot candidates. Applied Ergonomics, (2017) , 59: : 274–282. |
[2] | Xiaoru W, Damin Z, Shasha L. Effects of perceptual load related to flight task on auditory ERPs. Acta Scientiarum Naturalium Universitatis Pekinensis, (2011) , 47: (6): 995–1002. |
[3] | Wickens CD. Mental workload: assessment, prediction and consequences. In International Symposium on Human Mental Workload: Models and Applications, Springer, Cham, (2017) : pp. 18–29. |
[4] | Reimer B, Mehler B. The impact of cognitive workload on physiological arousal in young adult drivers: A field study and simulation validation. Ergonomics, (2011) , 54: (10): 932–942. |
[5] | Wei Z, Zhuang D, Wanyan X, et al. A model for discrimination and prediction of mental workload of aircraft cockpit display interface. Chinese Journal of Aeronautics, (2014) , 27: (5): 1070–1077. |
[6] | Vidulich MA, Tsang PS. The confluence of situation awareness and mental workload for adaptable human-machine systems. Journal of Cognitive Engineering and Decision Making, (2015) , 9: (1): 95–97. |
[7] | Young MS, Brookhuis KA, Wickens CD, et al. State of science: Mental workload in ergonomics. Ergonomics, (2015) , 58: (1): 1–17. |
[8] | Rusnock CF, Borghetti BJ. Workload profiles: A continuous measure of mental workload. International Journal of Industrial Ergonomics, (2018) , 63: : 49–64. |
[9] | Longo L. A defeasible reasoning framework for human mental workload representation and assessment. Behaviour & Information Technology, (2015) , 34: (8): 758–786. |
[10] | Hsu BW, Wang MJJ, Chen CY, et al. Effective indices for monitoring mental workload while performing multiple tasks. Perceptual and Motor Skills, (2015) , 121: (1): 94–117. |
[11] | Wanyan X, Zhuang D, Lin Y, et al. Influence of mental workload on detecting information varieties revealed by mismatch negativity during flight simulation. International Journal of Industrial Ergonomics, (2018) , 64: : 1–7. |
[12] | Roy RN, Charbonnier S, Campagne A, et al. Efficient mental workload estimation using task-independent EEG features. Journal of Neural Engineering, (2016) , 13: (2): 026019. |
[13] | Bi S, Salvendy G. Analytical modeling and experimental study of human workload in scheduling of advanced manufacturing systems. International Journal of Human Factors in Manufacturing, (1994) , 4: (2): 205–234. |
[14] | Vera J, Jiménez R, García JA, et al. Intraocular pressure is sensitive to cumulative and instantaneous mental workload. Applied Ergonomics, (2017) , 60: : 313–319. |
[15] | Laughery KR, Plott JB, Matessa M, Archer S. Modeling human performance in complex systems. Handbook of Human Factors and Ergonomics, Fourth Edition, (2012) , 931–961. |
[16] | Liang SFM, Rau CL, Tsai PF, et al. Validation of a task demand measure for predicting mental workloads of physical therapists. International Journal of Industrial Ergonomics, (2014) , 44: (5): 747–752. |
[17] | Xiao X, Wanyan X, Zhuang D. Mental workload prediction based on attentional resource allocation and information processing. Bio-medical Materials and Engineering, (2015) , 26: (s1): S871-S879. |
[18] | Marinescu AC, Sharples S, Ritchie AC, et al. Physiological parameter response to variation of mental workload. Human Factors, (2018) , 60: (1): 31–56. |


