
Penalized logistic regression based on L1/2 penalty for high-dimensional DNA methylation data
Abstract
BACKGROUND:
DNA methylation is a molecular modification of DNA that is vital and occurs in gene expression. In cancer tissues, the 5’–C–phosphate–G–3’(CpG) rich regions are abnormally hypermethylated or hypomethylated. Therefore, it is useful to find out the diseased CpG sites by employing specific methods. CpG sites are highly correlated with each other within the same gene or the same CpG island.
OBJECTIVE:
Based on this group effect, we proposed an efficient and accurate method for selecting pathogenic CpG sites.
METHODS:
Our method aimed to combine a
RESULTS:
Extensive simulation studies were used to compare our proposed approach with existing mainstream regularization in respect of classification accuracy and stability. The simulation results show that a greater predictive accuracy was attained in comparison to previous methods. Furthermore, our method was applied to over 20000 CpG sites and verified using the ovarian cancer data generated from Illumina Infinium HumanMethylation 27K Beadchip. In the result of the real dataset, not only the indicators of predictive accuracy are higher than the previous methods, but also more CpG sites containing genes are confirmed pathogenic. Additionally, the total number of CpG sites chosen is less than other methods and the results show higher accuracy rates in comparison to other methods in simulation and DNA methylation data.
CONCLUSION:
The proposed method offers an advanced tool to researchers in DNA methylation and can be a powerful tool for recognizing pathogenic CpG sites.
1.Introduction
DNA methylations occur at cytosine which might affect the modifications of DNA molecules. In this process, the gene expressions can be regulated without changing the DNA sequences. In particular, the related gene silencing of DNA methylations is a well-accepted epigenetic mechanism that often occurs at tumor suppressor genes loci in human cancers [1, 2, 3, 4, 5]. Recently, some high-throughput DNA methylation platforms have generated amounts of DNA methylation data and mostly based on genotyping bisulfite converted DNA. In this paper, one of the popular platforms, Illumina Infinium HumanMethylation 27K array, was used. Additionally, the
To date, researchers have selected methylated sites by statistical classification approaches [7, 8, 9]. Even though most of the CpG sites display various degrees of methylation, only a few gene expressions change. The statistical approaches therefore are difficult to find relevant CpG sites from high-dimensional data, making the statistical approaches not suitable for methylation data. In order to select CpG sites, different parameter models were utilized by researchers to represent diverse status of the samples [10]. Methylation data expresses different features from gene expression data. Firstly, the DNA methylation data has a group effect feature among CpG sites based on gene groups and CpG island groups. Secondly, the DNA methylation data values range between 0 and 1. Based on these features, Sun [11] has proposed a procedure that merged the
With the Illumina HumanMethylation 27K array, each gene has about 1–25 correlated CpG sites and each CpG island has about 2–11 CpG sites. Based on these aspects of DNA methylation data, a
2.Methods
2.1Network-regularization
In this research,
(1)
where
(2)
(3)
where
Lasso (
Some methods have been provided in order to tackle highly correlated variables. Elastic net penalty (
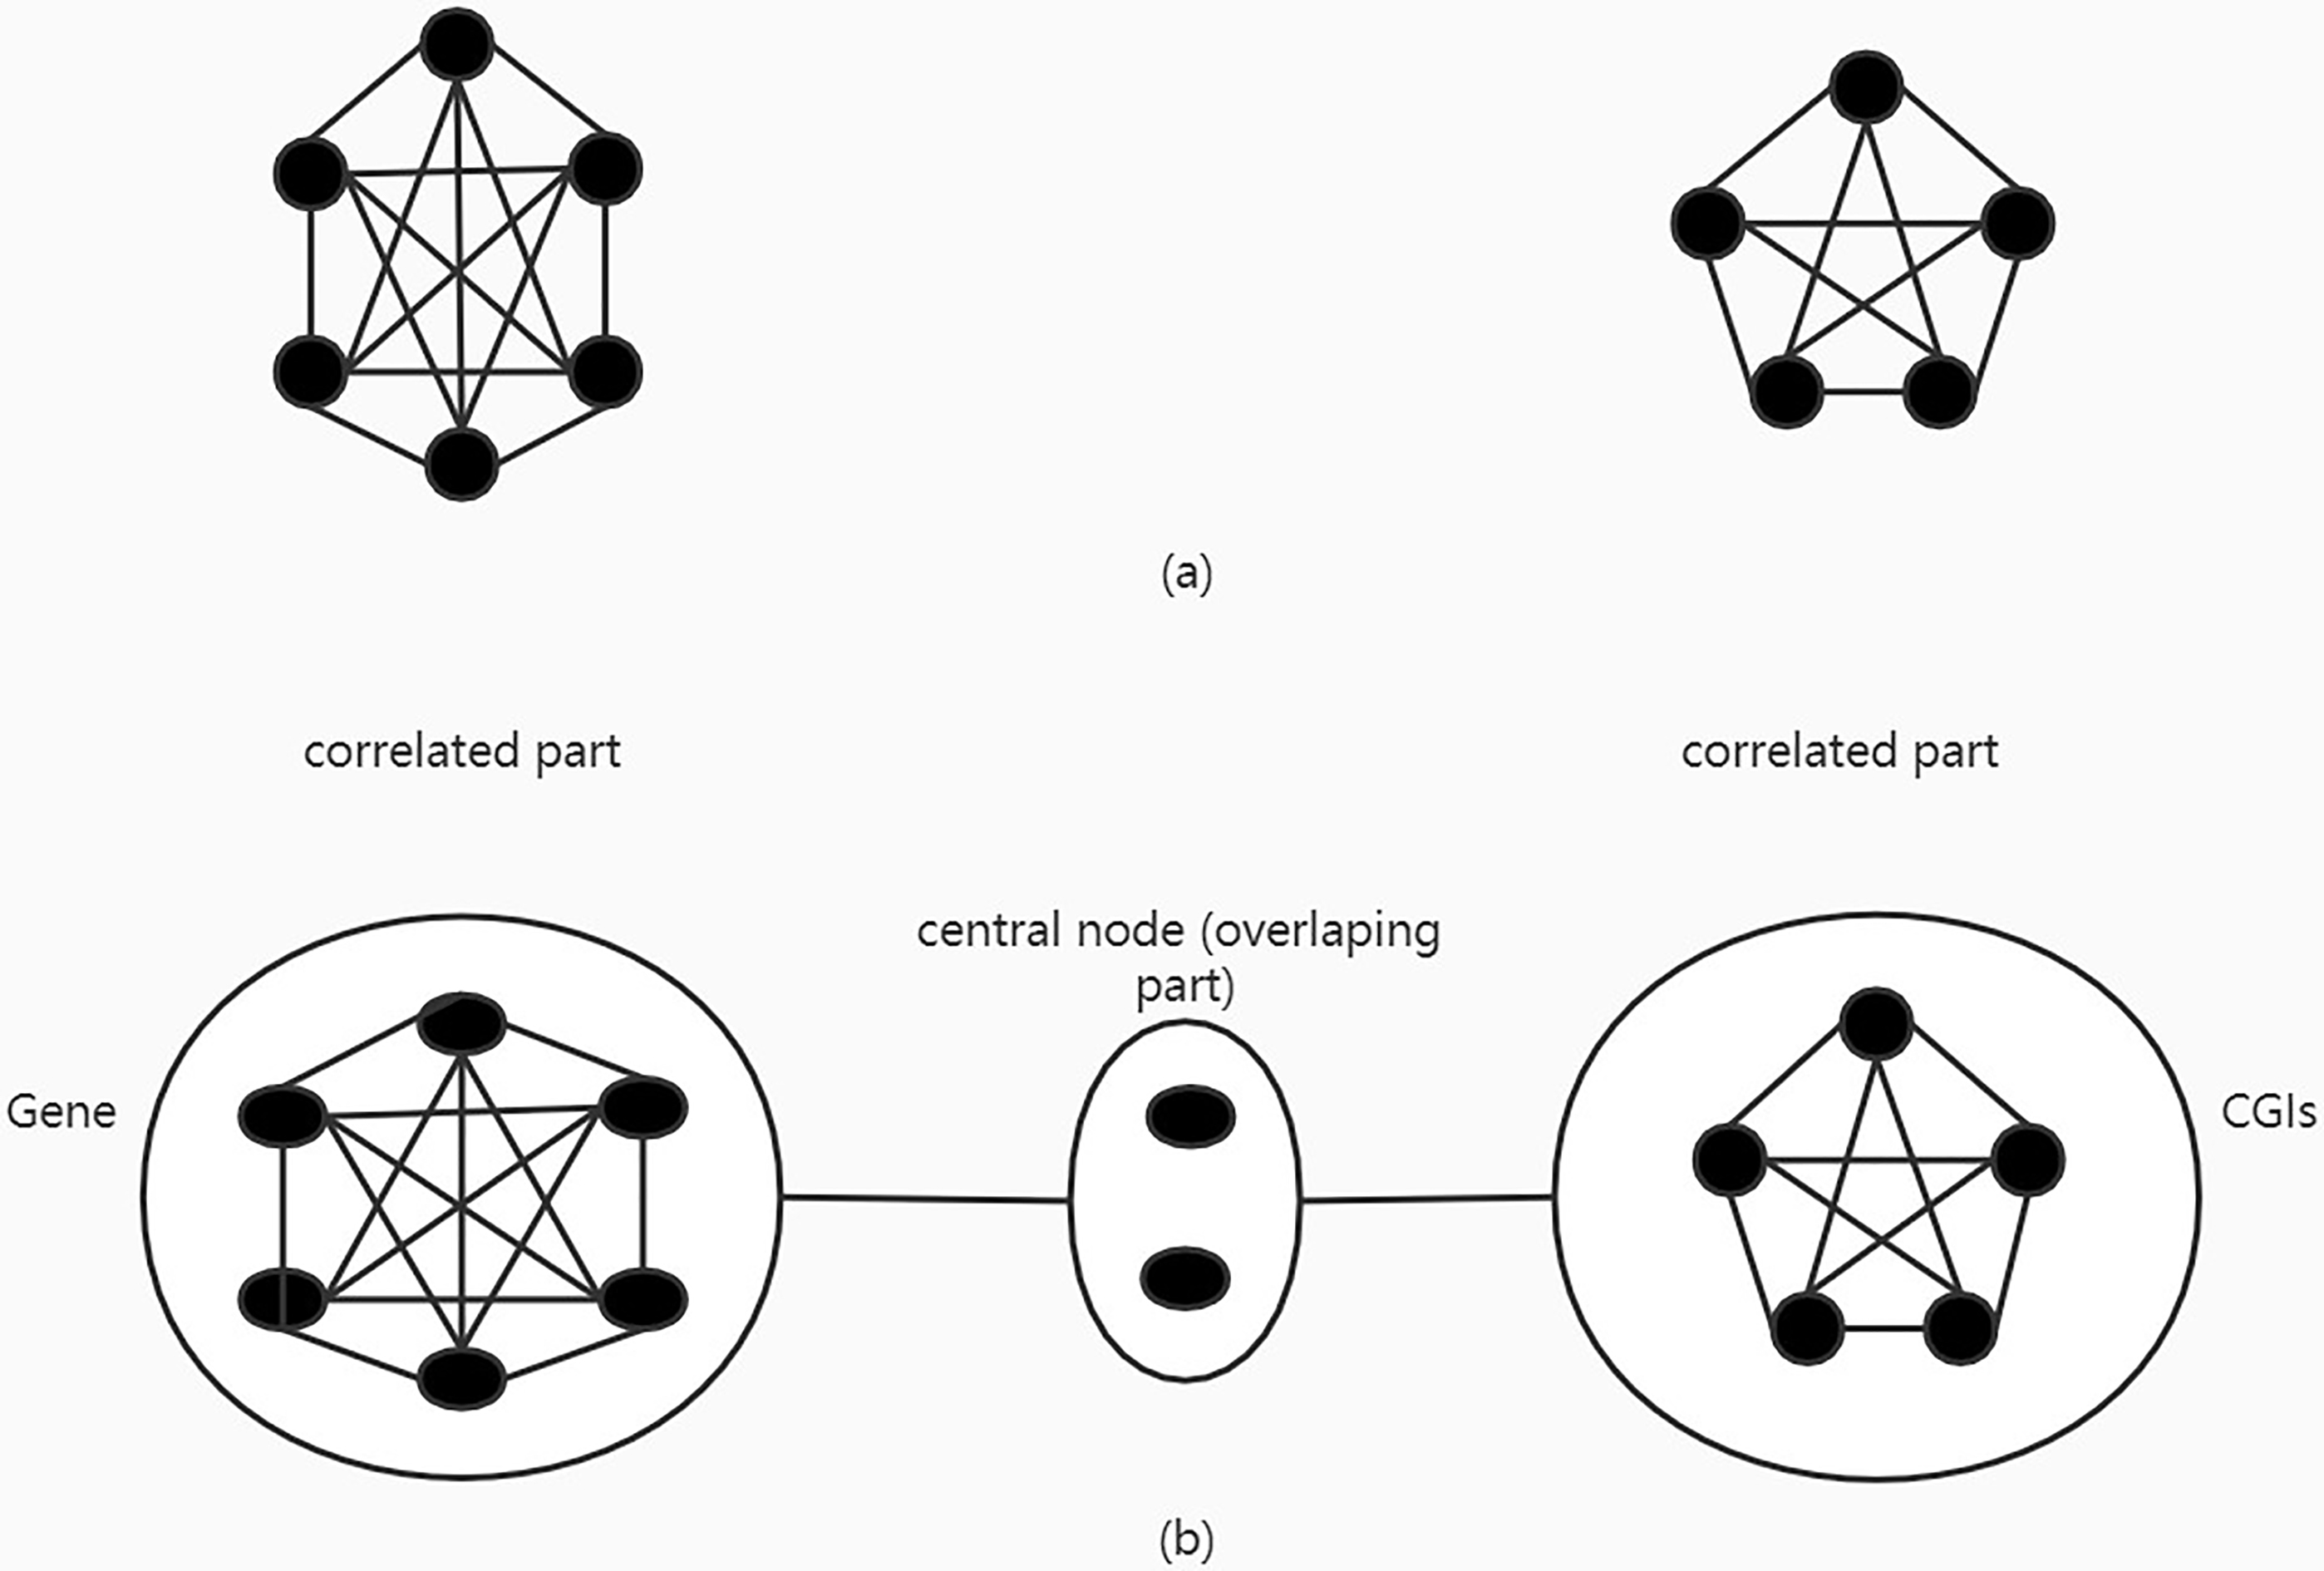
The methylation data displays a strong group effect and thus previous research used a fully connected network (Fc.net) to describe the correlated CpG sites group patterns within a gene. In methylation data, the group effect of CpG sites is not only present within one gene and present within one CpG island. There are overlapping parts between groups and these overlapping parts correlate with both parts respectively. With the different previous network, we set the overlapping part as the central node and connect it with other correlated parts (Fig. 1). The network not only has the genome information or CpG island information, but also the two aspects of information integrated into the network. It can better reflect the relevance of CpG site.
Figure 1.
a. Previous fully connected network. b. Central node fully connected network.
The network information is represented in a graphed structure with p-dimensional Laplacian matrix
where
The penalty function in Eq. (3) is:
(4)
where
The effectiveness of the penalty function reduced significantly when two negatively correlated predictors are interacted; the signs of coefficients are thus predicted and added to the Laplacian matrix to overcome problem:
(5)
The adaptive net function can be written as:
Based on
(6)
2.2The coordinate descent algorithm
To solve regularization models, the coordinate descent algorithm adopted as a competent tool. Regarding the coordinate descent algorithm, we referred to previous research [15, 16, 11] and Eq. (2) can be linearized by Taylor series expansion at current estimates
(7)
where
Next, the estimator:
(8)
where
(9)
where
3.Results and discussion
3.1Analyses of simulated data
The performance of the proposed simulation study quoting the simulation from Teschendorff et al. [17] and Su and Wang [11] was analyzed and evaluated. There were 600 groups, which were divided into 100 groups, 150 groups and 7 sets of 50 groups in accordance to their number of CpG sites. Each group comprised of at least 1 CpG site up to 9 CpG sites reciprocally. In total, there were 2500 CpG sites.
First, we simulated variables with the group effect ranging between 0 and 1. So we performed an inverse logit transformation on a multivariate normal distribution variable to represent the
(10)
where
(1)
(2)
The first condition is autoregressive (AR) model, and the second condition is compound symmetric correlation model. We set three different correlation coefficients
Second, given the regression coefficients
(11)
when
In the simulation models, there were 45 pathogenic CpG sites in a total of 2500 CpG sites. Lastly, the
Table 1
The total area under the averaged ROC curves (AUC) and MSE for all models
|
|
|
| Lasso | Enet |
|
| HLR ( |
| ||||||
|---|---|---|---|---|---|---|---|---|---|---|---|---|---|---|
| AUC | MSE | AUC | MSE | AUC | MSE | AUC | MSE | AUC | MSE | AUC | MSE | |||
| 1 | AR(1) | 0.2 | 0.806 | 0.273 | 0.847 | 0.238 | 0.850 | 0.239 | 0.809 | 0.260 | 0.853 | 0.254 | 0.860 | 0.197 |
| 1 | AR(1) | 0.5 | 0.871 | 0.213 | 0.885 | 0.206 | 0.888 | 0.197 | 0.856 | 0.225 | 0.933 | 0.161 | 0.954 | 0.116 |
| 1 | AR(1) | 0.7 | 0.898 | 0.187 | 0.906 | 0.185 | 0.909 | 0.175 | 0.917 | 0.169 | 0.942 | 0.149 | 0.962 | 0.101 |
| 2 | AR(1) | 0.2 | 0.806 | 0.273 | 0.860 | 0.237 | 0.866 | 0.220 | 0.809 | 0.260 | 0.869 | 0.213 | 0.921 | 0.155 |
| 2 | AR(1) | 0.5 | 0.871 | 0.273 | 0.889 | 0.237 | 0.903 | 0.220 | 0.918 | 0.167 | 0.953 | 0.134 | 0.975 | 0.085 |
| 2 | AR(1) | 0.7 | 0.898 | 0.187 | 0.904 | 0.177 | 0.912 | 0.168 | 0.917 | 0.169 | 0.953 | 0.133 | 0.970 | 0.089 |
| 2 | CS | 0.2 | 0.852 | 0.226 | 0.879 | 0.207 | 0.889 | 0.193 | 0.820 | 0.257 | 0.893 | 0.197 | 0.936 | 0.139 |
| 2 | CS | 0.5 | 0.899 | 0.181 | 0.913 | 0.163 | 0.919 | 0.157 | 0.895 | 0.182 | 0.961 | 0.128 | 0.969 | 0.097 |
| 2 | CS | 0.7 | 0.924 | 0.162 | 0.927 | 0.157 | 0.934 | 0.147 | 0.915 | 0.171 | 0.957 | 0.125 | 0.979 | 0.080 |
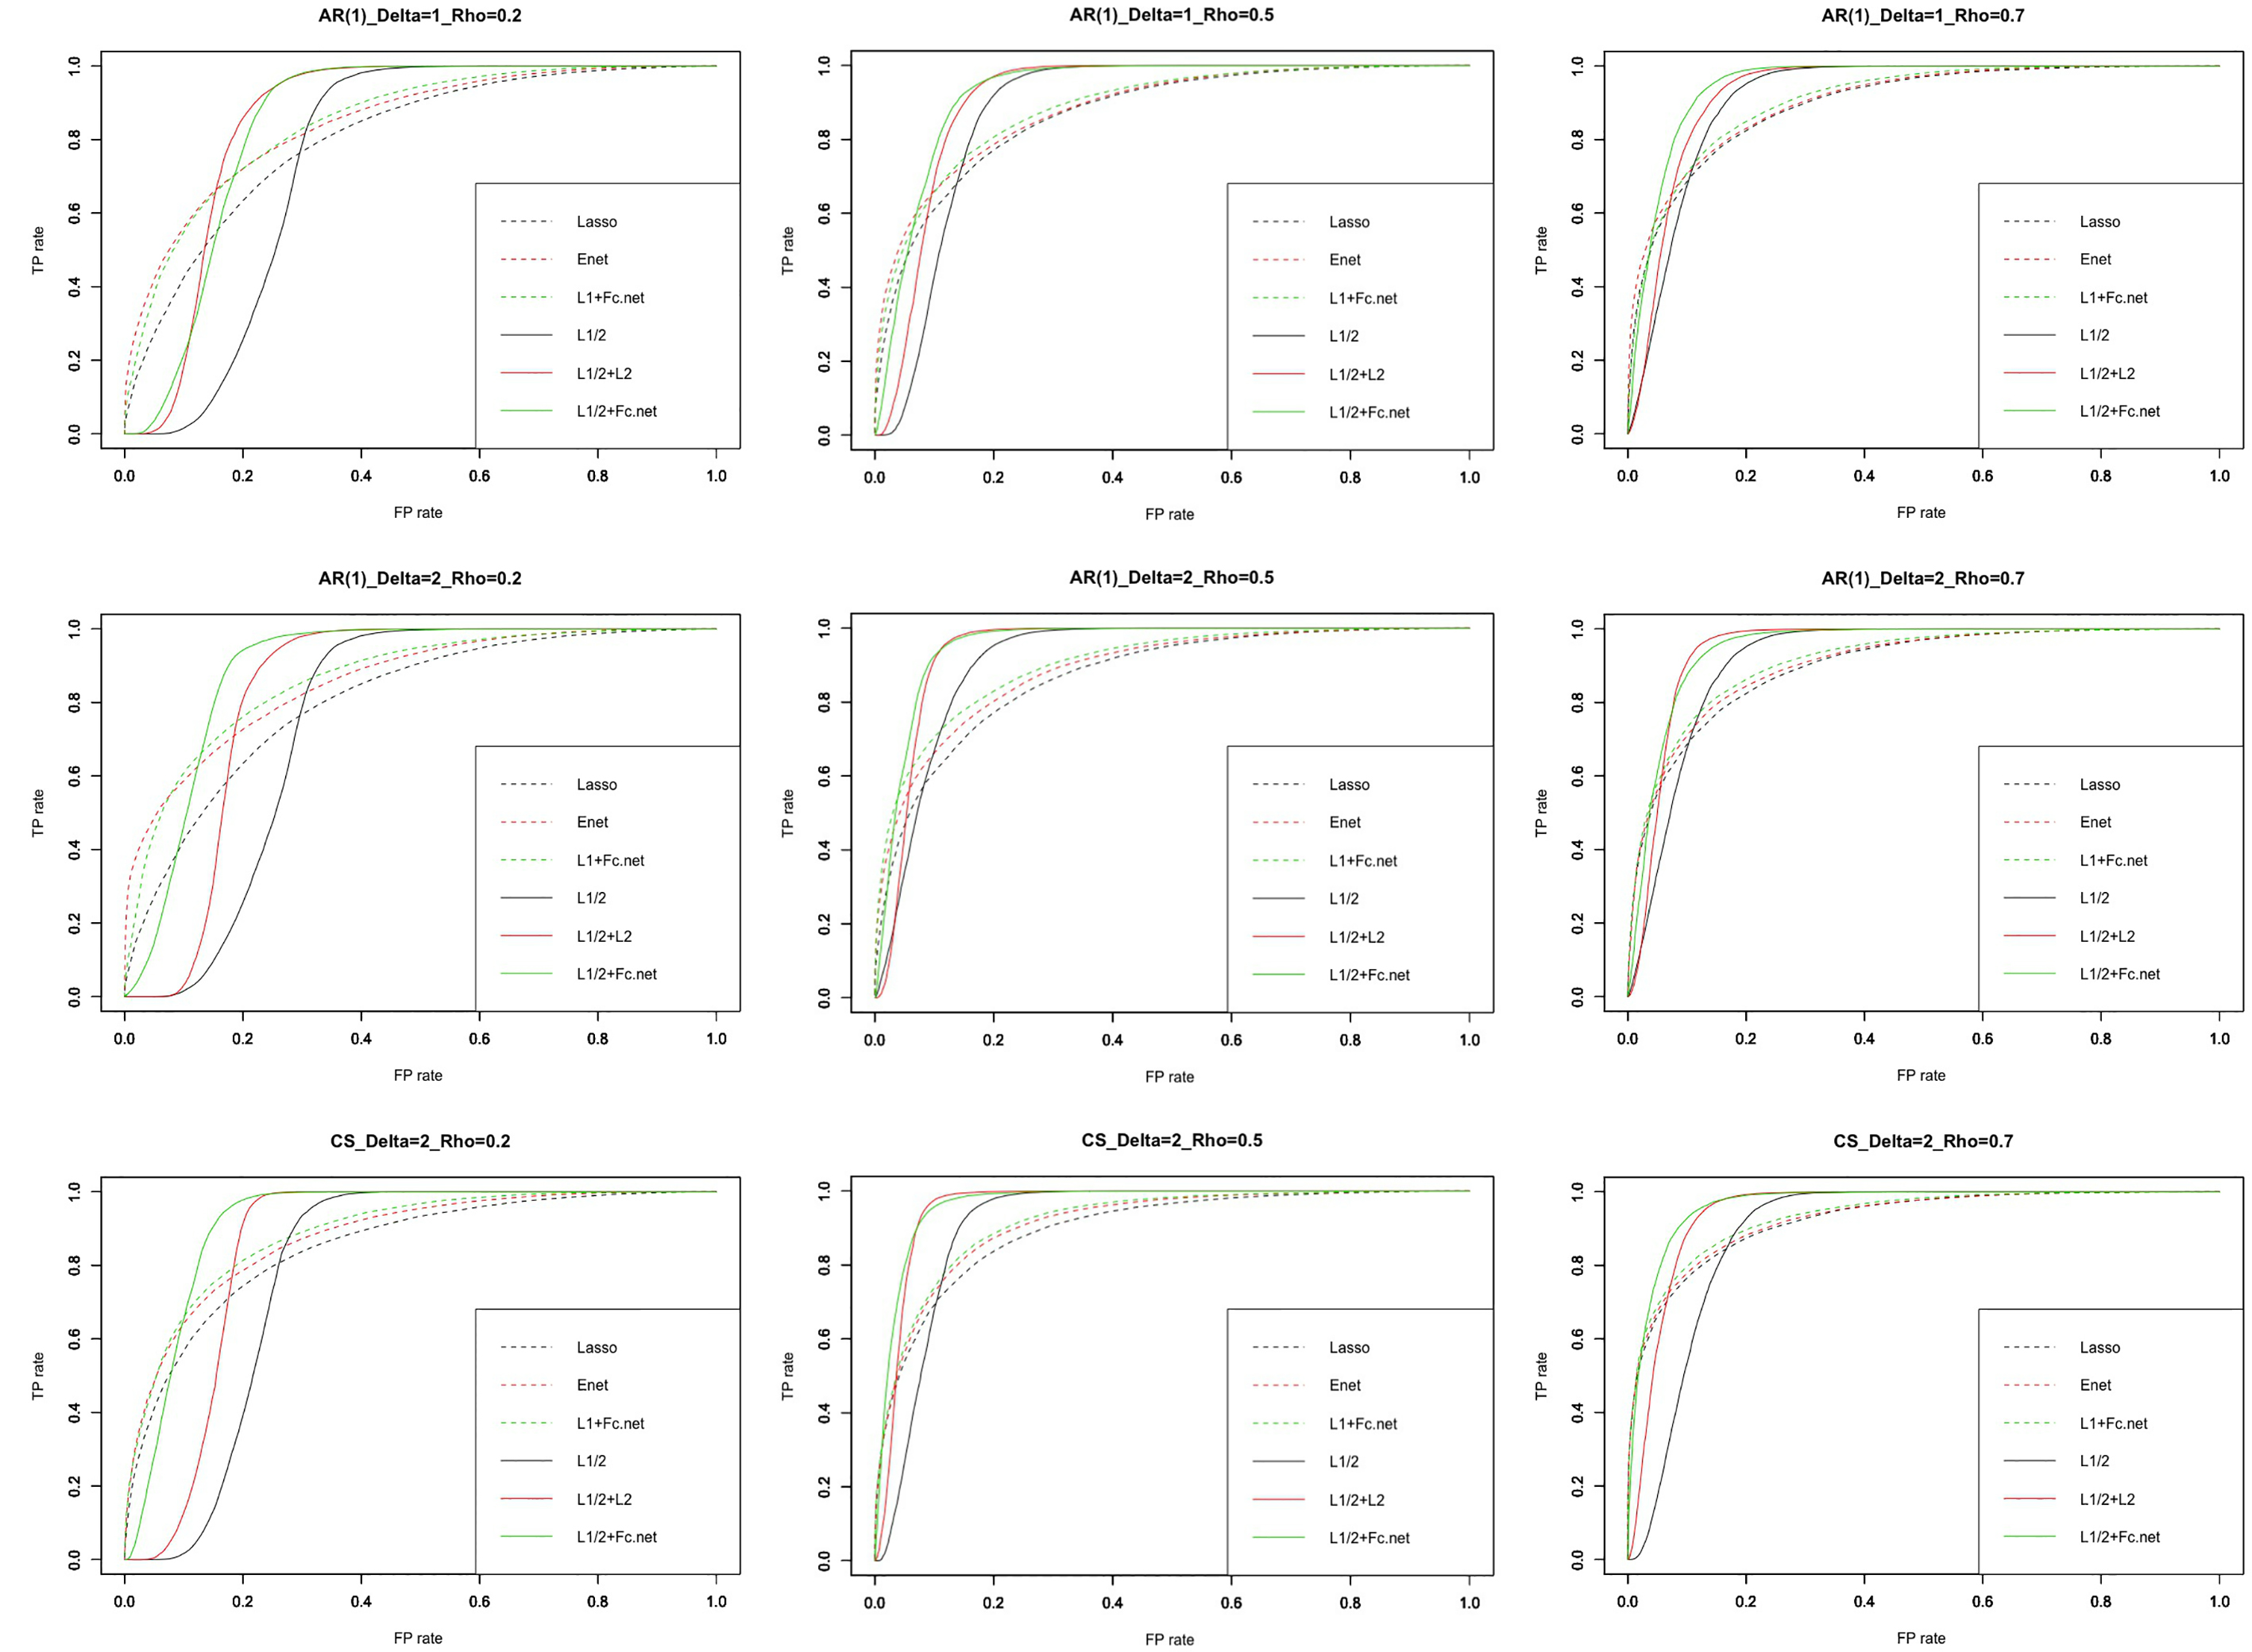
Figure 2.
The ROC curve of every model.
We repeated simulations 100 times for each condition. We then used the 10-fold cross-validation (CV) approach in the training set in order to tune the optimal regularization parameters of the Lasso, Elastic-Net (Enet),
Table 2
The AUC of real data for each method
| Lasso | Enet |
|
| HLR ( |
| |
|---|---|---|---|---|---|---|
| Pre | 0.798 | 0.886 | 0.921 | 0.803 | 0.908 | 0.946 |
| Post | 0.762 | 0.898 | 0.934 | 0.771 | 0.923 | 0.948 |
Figure 3.
The histogram of correlation between CpG sites.
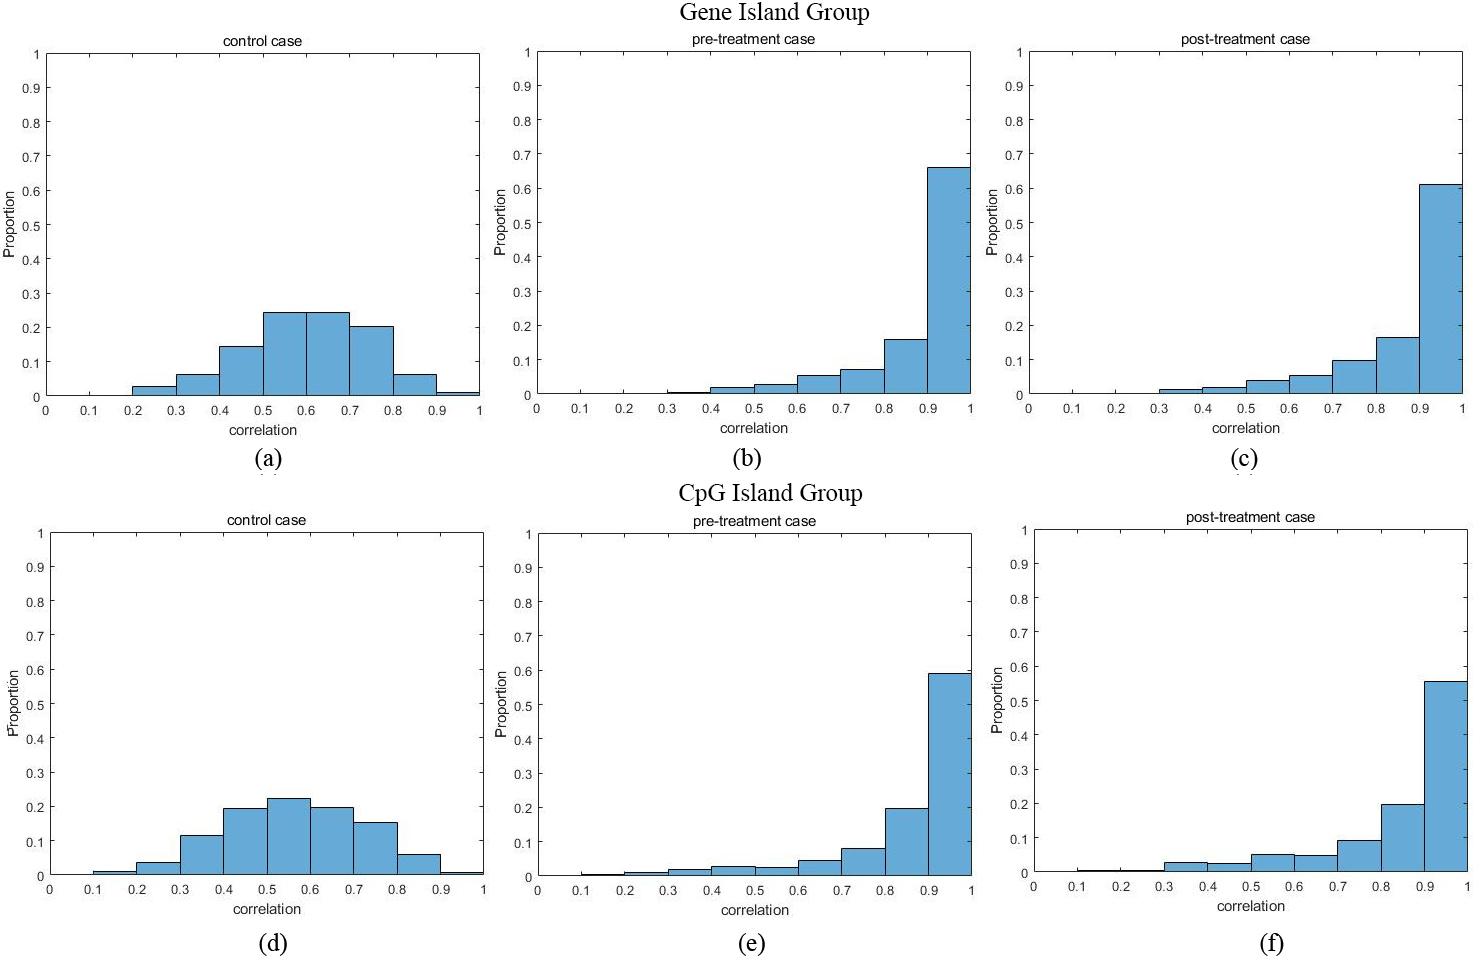
Figure 2 shows the receiver operating characteristic curve (ROC curve) for every model. The green solid line (
Table 3
The top 20 CpG sites and the corresponding genes selected from the comparison between pre-treatment and normal control cases
| Enet |
| HLR ( |
| ||||
|---|---|---|---|---|---|---|---|
| cg1100973 | cg0237448 | cg2079283 | cg15616083 | cg02505409 | cg21493583 | cg11804789 | cg06409153 |
| (MARCO) | (PRF1) | (PTPRCAP) | (PAGE2) | (ANGPTL4) | (CRIPT) | (CST7) | (ABCA5) |
| cg0498897 | cg2007009 | cg04988978 | cg27303882 | cg06521852 | cg00201234 | cg24505527 | cg05923103 |
| (MPO) | (S100A8) | (MPO) | (MYL4) | (HRIHFB2122) | (FBLN2) | (NKIRAS2) | (RNF11) |
| cg2079283 | cg2706761 | cg0996492 | cg05294455 | cg08694544 | cg09638834 | cg15853125 | cg09497789 |
| (PTPRCAP) | (CYP4F3) | (KCNE1) | (ADORA1) | (RTBDN) | (RAET1L) | (TIAM1) | (SPAG17) |
| cg0996492 | cg0435376 | cg11009736 | cg13626881 | cg15853125 | cg14861570 | cg08694544 | cg13626881 |
| (KCNE1) | (MS4A6A) | (MARCO) | (ADORA1) | (TIAM1) | (MMD) | (RTBDN) | (ADORA1) |
| cg0652185 | cg0224062 | cg14360917 | cg11412582 | cg21608192 | cg09964921 | cg07607462 | cg11412582 |
| (HRIHFB2122) | (PLCB2) | (SP2) | (HOXB5) | (XYLT1) | (KCNE1) | (UBR1) | (HOXB5) |
| cg0013453 | cg0619637 | cg03801286 | cg01405107 | cg09497789 | cg04988978 | cg20792833 | cg15736165 |
| (UBASH3A) | (TREM1) | (KCNE1) | (IGLL1) | (SPAG17) | (MPO) | (PTPRCAP) | (BNC1) |
| cg1436091 | cg21126943 | cg06521852 | cg10494770 | cg20792833 | cg14319409 | cg14027234 | cg05105069 |
| (SP2) | (CEACAM6) | (HRIHFB2122) | (SNRPN) | (PTPRCAP) | (GLRA1) | (CD248) | (TCEAL7) |
| cg2193281 | cg0020123 | cg21517055 | cg24993443 | cg06409153 | cg26838900 | cg00201234 | cg07376232 |
| (CSTA) | (FBLN2) | (MGC11271) | (BRDG1) | (ABCA5) | (LRRC15) | (FBLN2) | (AMICA1) |
| cg0097486 | cg2746119 | cg00201234 | cg04398282 | cg13626881 | cg23490074 | cg04988978 | cg21493583 |
| (FCGR3B) | (FXYD1) | (FBLN2) | (ABCA5) | (ADORA1) | (C19orf2) | (MPO) | (CRIPT) |
| cg2151705 | cg0529445 | cg00134539 | cg14027234 | cg2193281 | cg17231524 | cg06183267 | cg03856723 |
| (MGC11271) | (MYL4) | (KCNQ2) | (CD248) | (CSTA) | (MGC39606) | (AFF3) | (PRKACA) |
Figure 4.
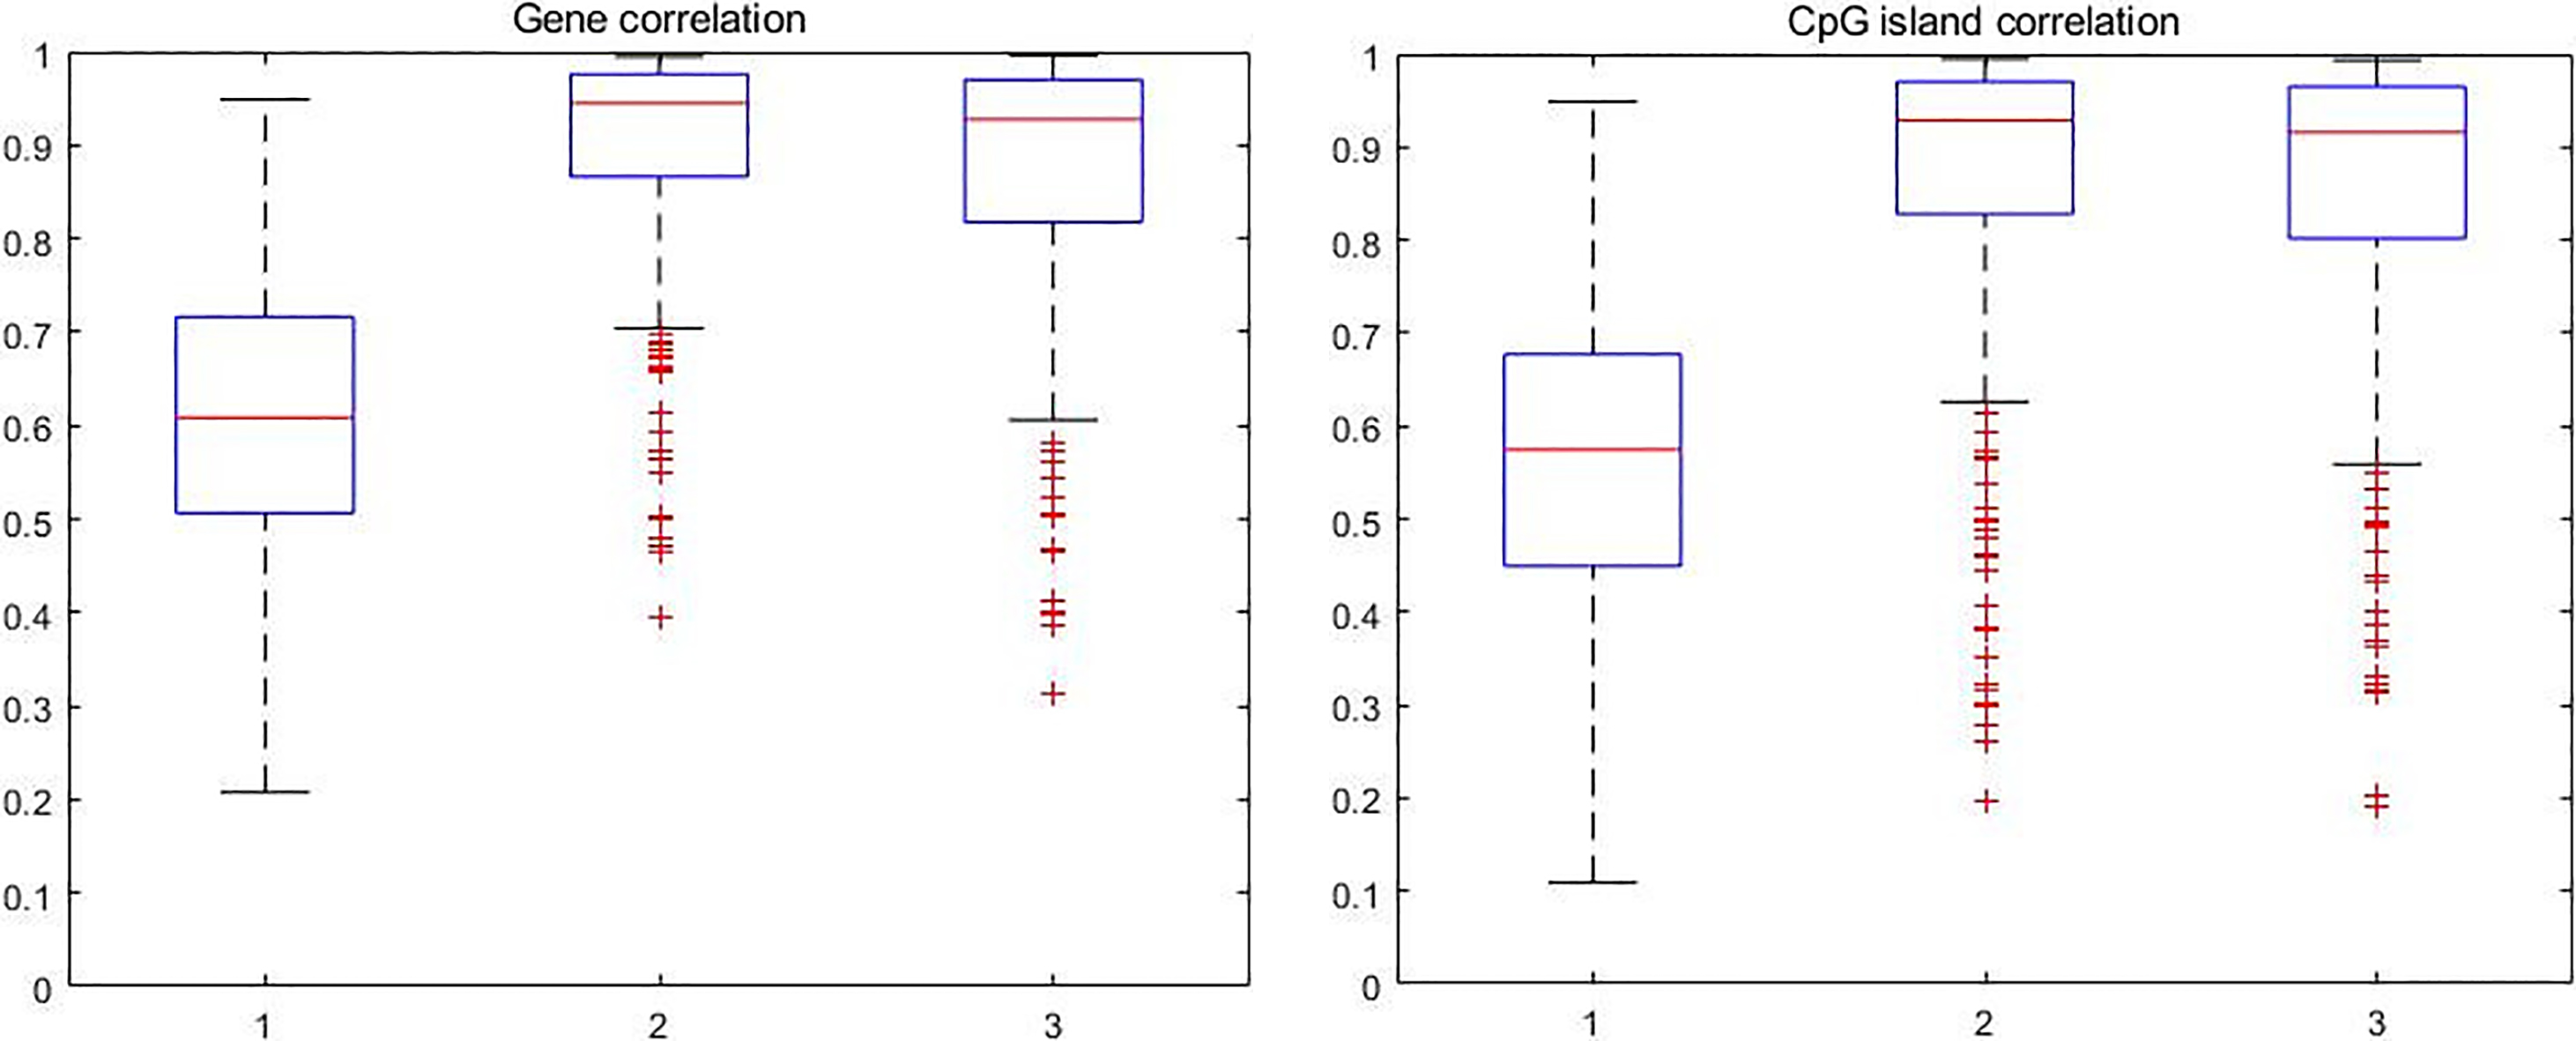
The boxplot of correlation between CpG sites.
3.2Analyses of real data
To further evaluate the effectiveness of our proposed method, in this section, we examined the DNA methylation (ovarian cancer) data generated from Illumina Infiniumm HumanMethylation 27K Beadchip [20]. The data is accessible from NCBI (http://www.ncbi.nlm.nih.gov/).
The data was generated by llumina Infiniumm HumanMethylation 27K Beadchip that contains 22727 CpG sites. We first removed samples which were low in BS conversion efficiency or low in CpG coverage. After that, a total of 207 genes contained more than 3 CpG sites and 295 CpG islands contained more than 3 CpG sites in the data; samples with error were removed. Lastly, there were 156 controls case samples (Healthy sample), 120 pre-treatment case samples and 122 post-treatment case samples. For these three cases, we calculated the maximum correlation of CpG sites in each group (gene and CpG island).
Figure 3a–c shows the histogram of maximum sample correlation between CpG sites within genes in control, pre-treatment and post-treatment case where Fig. 3d–f shows the histogram of maximum sample correlation between CpG sites within CpG islands in control, pre-treatment and post-treatment cases. Figure 4 shows the boxplot of maximum sample correlation between CpG sites in gene or CpG islands. Based on Figs 3 and 4, the results show that most CpG sites within the same group have high correlation in pre-treatment case samples and post-treatment case samples whereas the control case samples only show a significant correlation.
Table 4
The top 20 CpG sites and the corresponding genes selected from the comparison between post-treatment and normal control cases
| Enet |
| HLR ( |
| ||||
|---|---|---|---|---|---|---|---|
| cg23580000 | cg09626634 | cg06653796 | cg12243271 | cg17682828 | cg25554036 | cg11093356 | cg04836428 |
| (ADCY7) | (EBI2) | (LIME1) | (CFI) | (FXYD7) | (WFS1) | (DDX19A) | (DTNA) |
| cg06653796 | cg22988566 | cg10986043 | cg10467098 | cg02713563 | cg23125689 | cg12711814 | cg10777851 |
| (LIME1) | (WFDC10B) | (TCAP) | (Bles03) | (TRAPPC6A) | (CD81) | (ENO1) | (CD200) |
| cg10986043 | cg24335895 | cg23580000 | cg19573166 | cg06653796 | cg04232649 | cg12906740 | cg00636639 |
| (TCAP) | (COX7A1) | (ADCY7) | (SLC22A17) | (LIME1) | (CCNG1) | (NUDT15) | (MRRF) |
| cg13379236 | cg19573166 | cg13379236 | cg15096140 | cg15489301 | cg25410053 | cg14838256 | cg17133388 |
| (EGF) | (SLC22A17) | (EGF) | (MYO1B) | (AKR1B10) | (ZIC3) | (SRD5A2L) | (C3orf28) |
| cg03547797 | cg15096140 | cg03547797 | cg05767404 | cg11093356 | cg24643262 | cg23002907 | cg14275779 |
| (GAS2) | (MYO1B) | (GAS2) | (C1orf150) | (DDX19A) | (BMX) | (RBMS2) | (PLEKHH3) |
| cg05135288 | cg13745870 | cg05135288 | cg05004940 | cg03547797 | cg26200585 | cg02964389 | cg07389922 |
| (RHOT2) | (SPATA12) | (RHOT2) | (C20orf195) | (GAS2) | (PRX) | (PSMD9) | (C17orf81) |
| cg20357806 | cg00134539 | cg12006284 | cg23506842 | cg20630655 | cg14132995 | cg23917399 | cg19514928 |
| (PPBP) | (UBASH3A) | (WT1) | (PTPN7) | (RNUT1) | (SLC35A2) | (TNFAIP8) | (TMEM56) |
| cg12006284 | cg16853982 | cg20357806 | cg23917399 | cg10986043 | cg13056210 | cg09119665 | cg05798972 |
| (WT1) | (ACTN2) | (PPBP) | (SPATA12) | (TCAP) | (MXRA5) | (PNMA1) | (PPARBP) |
| cg21640749 | cg10467098 | cg24335895 | cg09626634 | cg02497758 | cg04499381 | cg17682828 | cg00096922 |
| (CD300LF) | (Bles03) | (COX7A1) | (EBI2) | (MAFB) | (CXorf9) | (FXYD7) | (DLX5) |
| cg12243271 | cg13247990 | cg21640749 | cg23917399 | cg25919221 | cg13435792 | cg09816912 | cg04232649 |
| (CFI) | (MLCK) | (CD300LF) | (TNFAIP8) | (CA6) | (C12orf46) | (MARCKS) | (CCNG1) |
Table 2 shows the AUC for each method from real data analysis. In real data, the enhanced
4. Conclusion
In biological molecular research, the analysis of DNA methylation may be a new practice for cancer research. In this paper, we used the enhanced
Acknowledgments
The Macau Science and Technology Develop Funds (grant no. 0158/2019/A3) of Macau SAR of China supported this work.
Conflict of interest
None to report.
References
[1] | Schöbeler D. Function and information content of DNA methylation. Nature. (2015) ; 517: (7534): 321. |
[2] | Irizarry RA, Ladd-Acosta C, Wen B. et al. The human colon cancer methylome shows similar hypo-and hypermethylation at conserved tissue-specific CpG island shores. Nature Genetics. (2009) ; 41: (2): 178-186. |
[3] | Baubec T, Colombo DF, Wirbelauer C. et al. Genomic profiling ofDNAmethyltransferases reveals a role for DNMT3B in genic methylation. Nature. (2015) ; 520: (7546): 243. |
[4] | Pidsley R, Zotenko E, Peters TJ. et al. Critical evaluation of the Illumina MethylationEPIC BeadChip microarray for whole-genome DNA methylation profiling. Genome Biology. (2016) ; 17: (1): 208. |
[5] | Bibikova M, Lin Z, Zhou L. et al. High-throughput DNA methylation profiling using universal bead arrays. Genome Research. (2006) ; 16: (3): 383-393. |
[6] | Houseman EA, Christensen BC, Yeh RF. et al. Model-based clustering of DNA methylation array data: a recursive-partitioning algorithm for high-dimensional data arising as a mixture of beta distributions. BMC Bioinformatics. (2008) ; 9: (1): 365. |
[7] | Kuan PF, Wang S, Zhou X. et al. A statistical framework for Illumina DNA methylation arrays. Bioinformatics. (2010) ; 26: (22): 2849-2855. |
[8] | Siegmund KD, Laird PW, Laird-Offringa IA. A comparison of cluster analysis methods using DNA methylation data. Bioinformatics. (2004) ; 20: (12): 1896-1904. |
[9] | Wang S. Method to detect differentially methylated loci with case-control designs using Illumina arrays. Genetic Epidemiology. (2011) ; 35: (7): 686-694. |
[10] | Friedman J, Hastie T, Höfling H. et al. Pathwise coordinate optimization. The Annals of Applied Statistics. (2007) ; 1: (2): 302-332. |
[11] | Sun H, Wang S. Penalized logistic regression for high-dimensional DNA methylation data with case-control studies. Bioinformatics. (2012) ; 28: (10): 1368-1375. |
[12] | Xu Z, Zhang H, Wang Y, Chang X, Liang Y. L1/2 regularization. Science China Information Sciences. (2010) ; 53: (6): 1159-1169. |
[13] | Xu Z, Chang X, Xu F. et al. L1/2 regularization: a thresholding representation theory and a fast solver. IEEE Transactions on Neural Networks & Learning Systems. (2012) ; 23: (7): 1013-27. |
[14] | Zeng J, Lin S, Wang Y. et al. L1/2 Regularization: Convergence of Iterative Half Thresholding Algorithm. IEEE Transactions on Signal Processing. (2013) ; 62: (9): 2317-2329. |
[15] | Li F, Zhang NR. Bayesian variable selection in structured high-dimensional covariate spaces with applications in genomics. Journal of the American Statistical Association. (2010) ; 105: (491): 1202-1214. |
[16] | Tibshirani R. The lasso method for variable selection in the Cox model. Statistics in Medicine. (1997) ; 16: (4): 385-395. |
[17] | Teschendorff AE, Menon U, Gentry-Maharaj A. et al. Age-dependent DNA methylation of genes that are suppressed in stem cells is a hallmark of cancer. Genome Research. (2010) ; 20: (4): 440-446. |
[18] | Bibikova M, Lin Z, Zhou L. et al. High-throughput DNA methylation profiling using universal bead arrays. Genome Research. (2006) ; 16: (3): 383-393. |
[19] | Houseman EA, Christensen BC, Yeh RF. et al. Model-based clustering of DNA methylation array data: a recursive-partitioning algorithm for high-dimensional data arising as a mixture of beta distributions. BMC Bioinformatics. (2008) ; 9: (1): 365. |
[20] | Razin A, Cedar H. DNA methylation and gene expression. Microbiological Reviews. (1991) ; 55: (3): 451-458. |
[21] | Liu L, Zhao L, Zhang Y, Zhang Q, Ding Y. Proteomic analysis of Tiam1-mediated metastasis in colorectal cancer. Cell Biology International. (2007) ; 31: (8): 805-814. |
[22] | Liu L, Xu AG, Zhang QL, Zhang YF, Ding YQ. Effect of Tiam1 overexpression on proliferation and metastatic potential of human colorectal cancer. Zhonghua Bing Li Xue Za Zhi = Chinese Journal of Pathology. (2007) ; 36: (6): 390-393. |
[23] | Peedicayil A, Vierkant RA, Shridhar V, Schildkraut JM, Armasu S, Hartmann LC. et al. Polymorphisms in TCEAL7 and risk of epithelial ovarian cancer. Gynecologic Oncology. (2009) ; 114: (2): 260-264. |
[24] | Chien J, Staub J, Avula R, Zhang H, Liu W, Hartmann LC. et al. Epigenetic silencing of TCEAL7 (Bex4) in ovarian cancer. Oncogene. (2005) ; 24: (32): 5089. |
[25] | Werle B, Schanzenbächer U, Lah TT, Ebert E, Jülke B, Ebert W. et al. Cystatins in non-small cell lung cancer: tissue levels, localization and relation to prognosis. Oncology Reports. (2006) ; 16: (4): 647-655. |
[26] | Subramaniam V, Li H, Wong M, Kitching R, Attisano L, Wrana J. et al. The RING-H2 protein RNF11 is overexpressed in breast cancer and is a target of Smurf2 E3 ligase. British Journal of Cancer. (2003) ; 89: (8): 1538. |
[27] | He C, Tamimi RM, Hankinson SE, Hunter DJ, Han J. A prospective study of genetic polymorphism in MPO, antioxidant status, and breast cancer risk. Breast Cancer Research and Treatment. (2009) ; 113: (3): 585-594. |
[28] | Yang J, Ambrosone CB, Hong CC, Ahn J, Rodriguez C, Thun MJ, Calle EE. Relationships between polymorphisms in NOS3 and MPO genes, cigarette smoking and risk of post-menopausal breast cancer. Carcinogenesis. (2007) ; 28: (6): 1247-1253. |
[29] | Ju H, Lim B, Kim M, Kim YS, Kim WH, Ihm C. et al. A regulatory polymorphism at position-309 in PTPRCAP is associated with susceptibility to diffuse-type gastric cancer and gene expression. Neoplasia. (2009) ; 11: (12): 1340-1347. |
[30] | Moreaux J, Veyrune JL, Reme T, De Vos J, Klein B. CD200: a putative therapeutic target in cancer. Biochemical and Biophysical Research Communications. (2008) ; 366: (1): 117-122. |
[31] | Simonavicius N, Robertson D, Bax DA, Jones C, Huijbers IJ, Isacke CM. Endosialin (CD248) is a marker of tumor-associated pericytes in high-grade glioma. Modern Pathology. (2008) ; 21: (3): 308. |
[32] | Lee JY, Hur H, Yun HJ, Kim Y, Yang S, Kim SI, Kim MH. HOXB5 promotes the proliferation and invasion of breast cancer cells. International Journal of Biological Sciences. (2015) ; 11: (6): 701. |
[33] | Qiao H, Wang YF, Yuan WZ, Zhu BD, Jiang L, Guan QL. Silencing of ENO1 by shRNA Inhibits the Proliferation of Gastric Cancer Cells. Technology in Cancer Research & Treatment. (2018) ; 17: : 1533033818784411. |
[34] | Uemura M, Tamura K, Chung S, Honma S, Okuyama A, Nakamura Y, Nakagawa H. Novel 5α-steroid reductase (SRD5A3, type-3) is overexpressed in hormone-refractory prostate cancer. Cancer Science. (2008) ; 99: (1): 81-8. |
[35] | Xing Y, Liu Y, Liu T, Meng Q, Lu H, Liu W. et al. TNFAIP8 promotes the proliferation and cisplatin chemoresistance of non-small cell lung cancer through MDM2/p53 pathway. Cell Communication and Signaling. (2018) ; 16: (1): 43. |


