
Development of a transcranial direct current stimulation device based on current limiter for simultaneous measurement of electroencephalography: A feasibility study
Abstract
BACKGROUND:
Electroencephalography (EEG) measured during transcranial direct current stimulation (tDCS) can help understand the accurate impact of tDCS on the brain, but this has been hindered due to significant inflow of tDCS-induced electrical artifacts.
OBJECTIVE:
In this study, we introduce a novel tDCS device developed based on current limiter, which can prevent the generation of significant electrical artifacts.
METHODS:
To verify the feasibility of our developed tDCS device, we performed simultaneous measurement of EEG during tDCS application with five different current intensities (0, 500, 1,000, 1,500, and 2,000
RESUTLS:
The mean EEG-PSD differences between non-stimulation and tDCS condition were not significant for all stimulation current intensities. Furthermore, EEG-PSDs estimated during non-stimulation and tDCS application showed statistically high correlation for all comparison cases.
CONCLUSION:
Based on the results, we could demonstrate the feasibility of our tDCS device based on current limiter for simultaneous EEG measurement, which could potentially provide a way to investigate the impact of tDCS on the brain more accurately.
1.Introduction
Transcranial direct current stimulation (tDCS) is a non-invasive brain stimulation method, which induces changes in cortical excitability [1]. In recent years, tDCS has received growing attention because it has been reported that tDCS is useful for the treatment of various psychiatric and neurological disorders [2, 3, 4, 5, 6]. For example, one study found significant improvement in mood, attention, and working memory after applying tDCS to depressive patients [5], and another study showed that tDCS can significantly improve motor functions for stroke patients [6].
Even though good clinical outcomes have been continuously reported, the accurate effect of tDCS on the brain has been not well established and still controversial [8], and thus investigation on brain state measured during tDCS is required to clarify the exact impact of tDCS on the brain. There are a variety of neuroimaging modalities to measure brain activity during tDCS, such as electroencephalography (EEG), magnetoencephalography (MEG) [9], near-infrared spectroscopy (NIRS) [10], functional magnetic resonance imaging (fMRI) [11], and so on.
Among these, EEG has been most frequently used for simultaneous monitoring of brain state during tDCS [12, 13, 14, 15, 16] due to its high temporal resolution, good portability, and reasonable price. However, in the case of simultaneous EEG measurement during tDCS, EEG is significantly contaminated by a DC stimulator, and thereby original characteristics of EEG are distorted [12, 13, 14, 15, 16]; EEG amplitude dramatically increases during tDCS, leading to significant broadband increase in EEG spectral power [14, 15, 16]. A few of studies used an artifact rejection algorithm, such as independent component analysis (ICA), to remove tDCS-induced artifacts from simultaneously measured EEG during tDCS [12, 14]. Even though the ICA-based method showed meaningful results in terms of removal of tDCS-induced artifacts, significantly contaminated EEG should be manually removed before using ICA, and ICA itself requires another manual selection procedure [14]. Therefore, it would be a more fundamental solution to minimize the generation of tDCS-induced electrical artifacts in order to see the exact impact of tDCS on the brain.
In this study, we introduce a novel tDCS device based on current limiter to minimize stimulation-derived artifacts, and thereby making it possible to simultaneously measure EEG without significant inflow of electrical artifacts during tDCS. To verify the feasibility of the developed tDCS device, we recorded resting-state EEG while subjects performed opening and closing the eyes, at which time tDCS was simultaneously applied around EEG electrodes. Power spectral densities (PSDs) of resting-state EEG was calculated to see their difference between non-stimulation and tDCS condition, and correlation analysis was also performed to see the similarity between the PSDs of non-stimulation and tDCS condition.
2.Methods
2.1Current limiter-based tDCS system
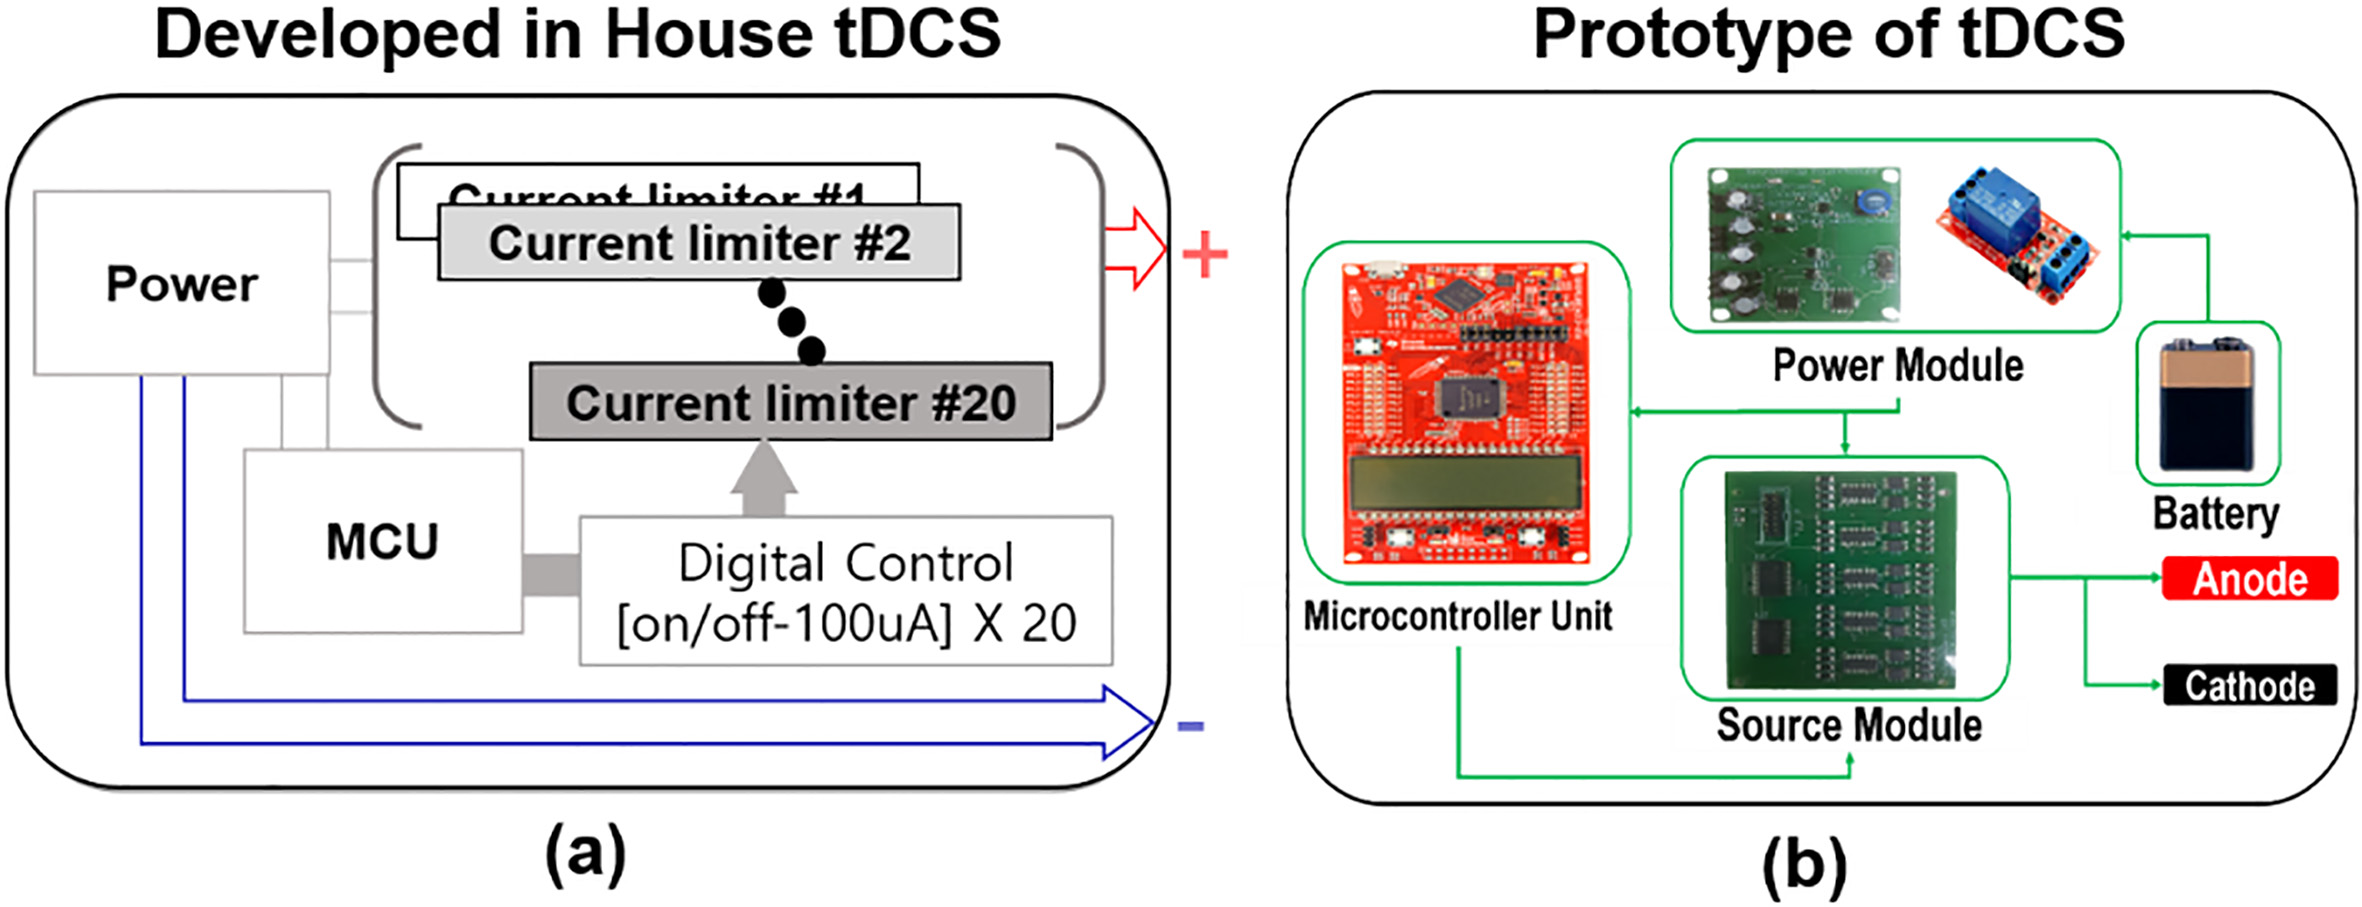
Figure 1a shows the control block diagram of our in-house tDCS device based on current limiter (only forward control). Because current limiter does not generate current/voltage ripples due to rejection of feed-forward control, our in-house tDCS device based on multiple current limiters also does not generate current/voltage ripples. To implement the current limiter, the REF200 (TI, USA) was used for precise current control, and the current limiter was utilized as a current source with an analogue switch (DG412, Maxim Integrated, Taiwan) to control the current flow. Figure 1b shows an actual tDCS device which comprises of a power module (voltage range:
Figure 1.
(a) Block diagram of a developed in-house tDCS system, and (b) picture of a developed in-house tDCS system.
2.2Experimental paradigm
To validate the feasibility of our tDCS system in terms of tDCS-induced artifacts on EEG, we conducted simultaneous tDCS-EEG experiments with five healthy subjects. EEGs were measured with a sampling rate of 1 kHz (Brain Products, GmbH, Gilching, Germany) while each subject performed closing and opening the eyes each for 60 s. During EEG recording, tDCS was independently administered with five different current intensities (0, 500, 1,000, 1,500, and 2,000
Figure 2.
(a) Locations of EEG (green), tDCS anode (red) and cathode (blue) electrodes. (b) Simulated electrical filed map generated by tDCS. The pink and brown circles represent POz and Oz used for data analysis.
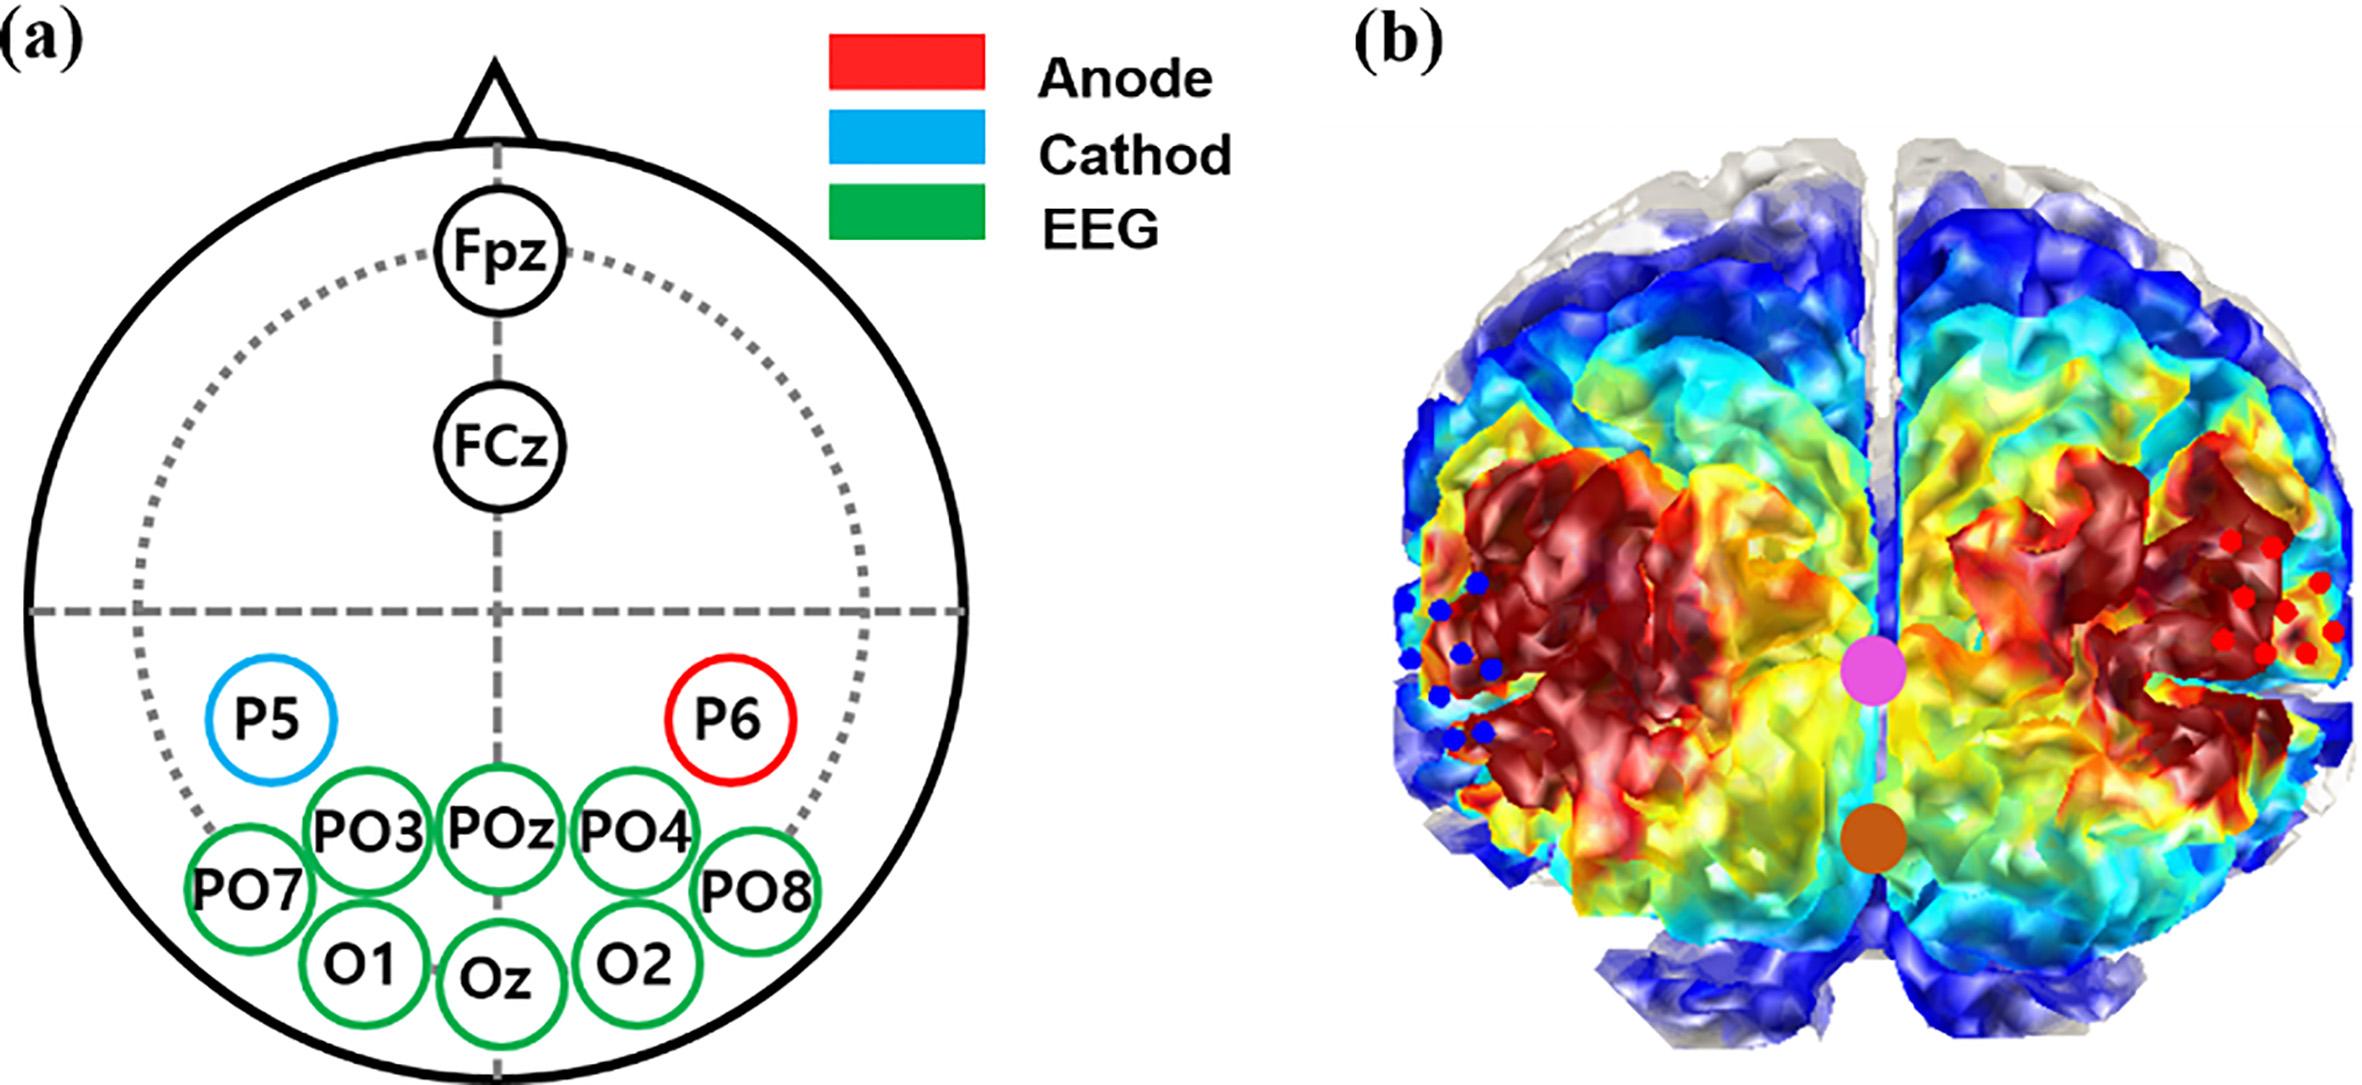
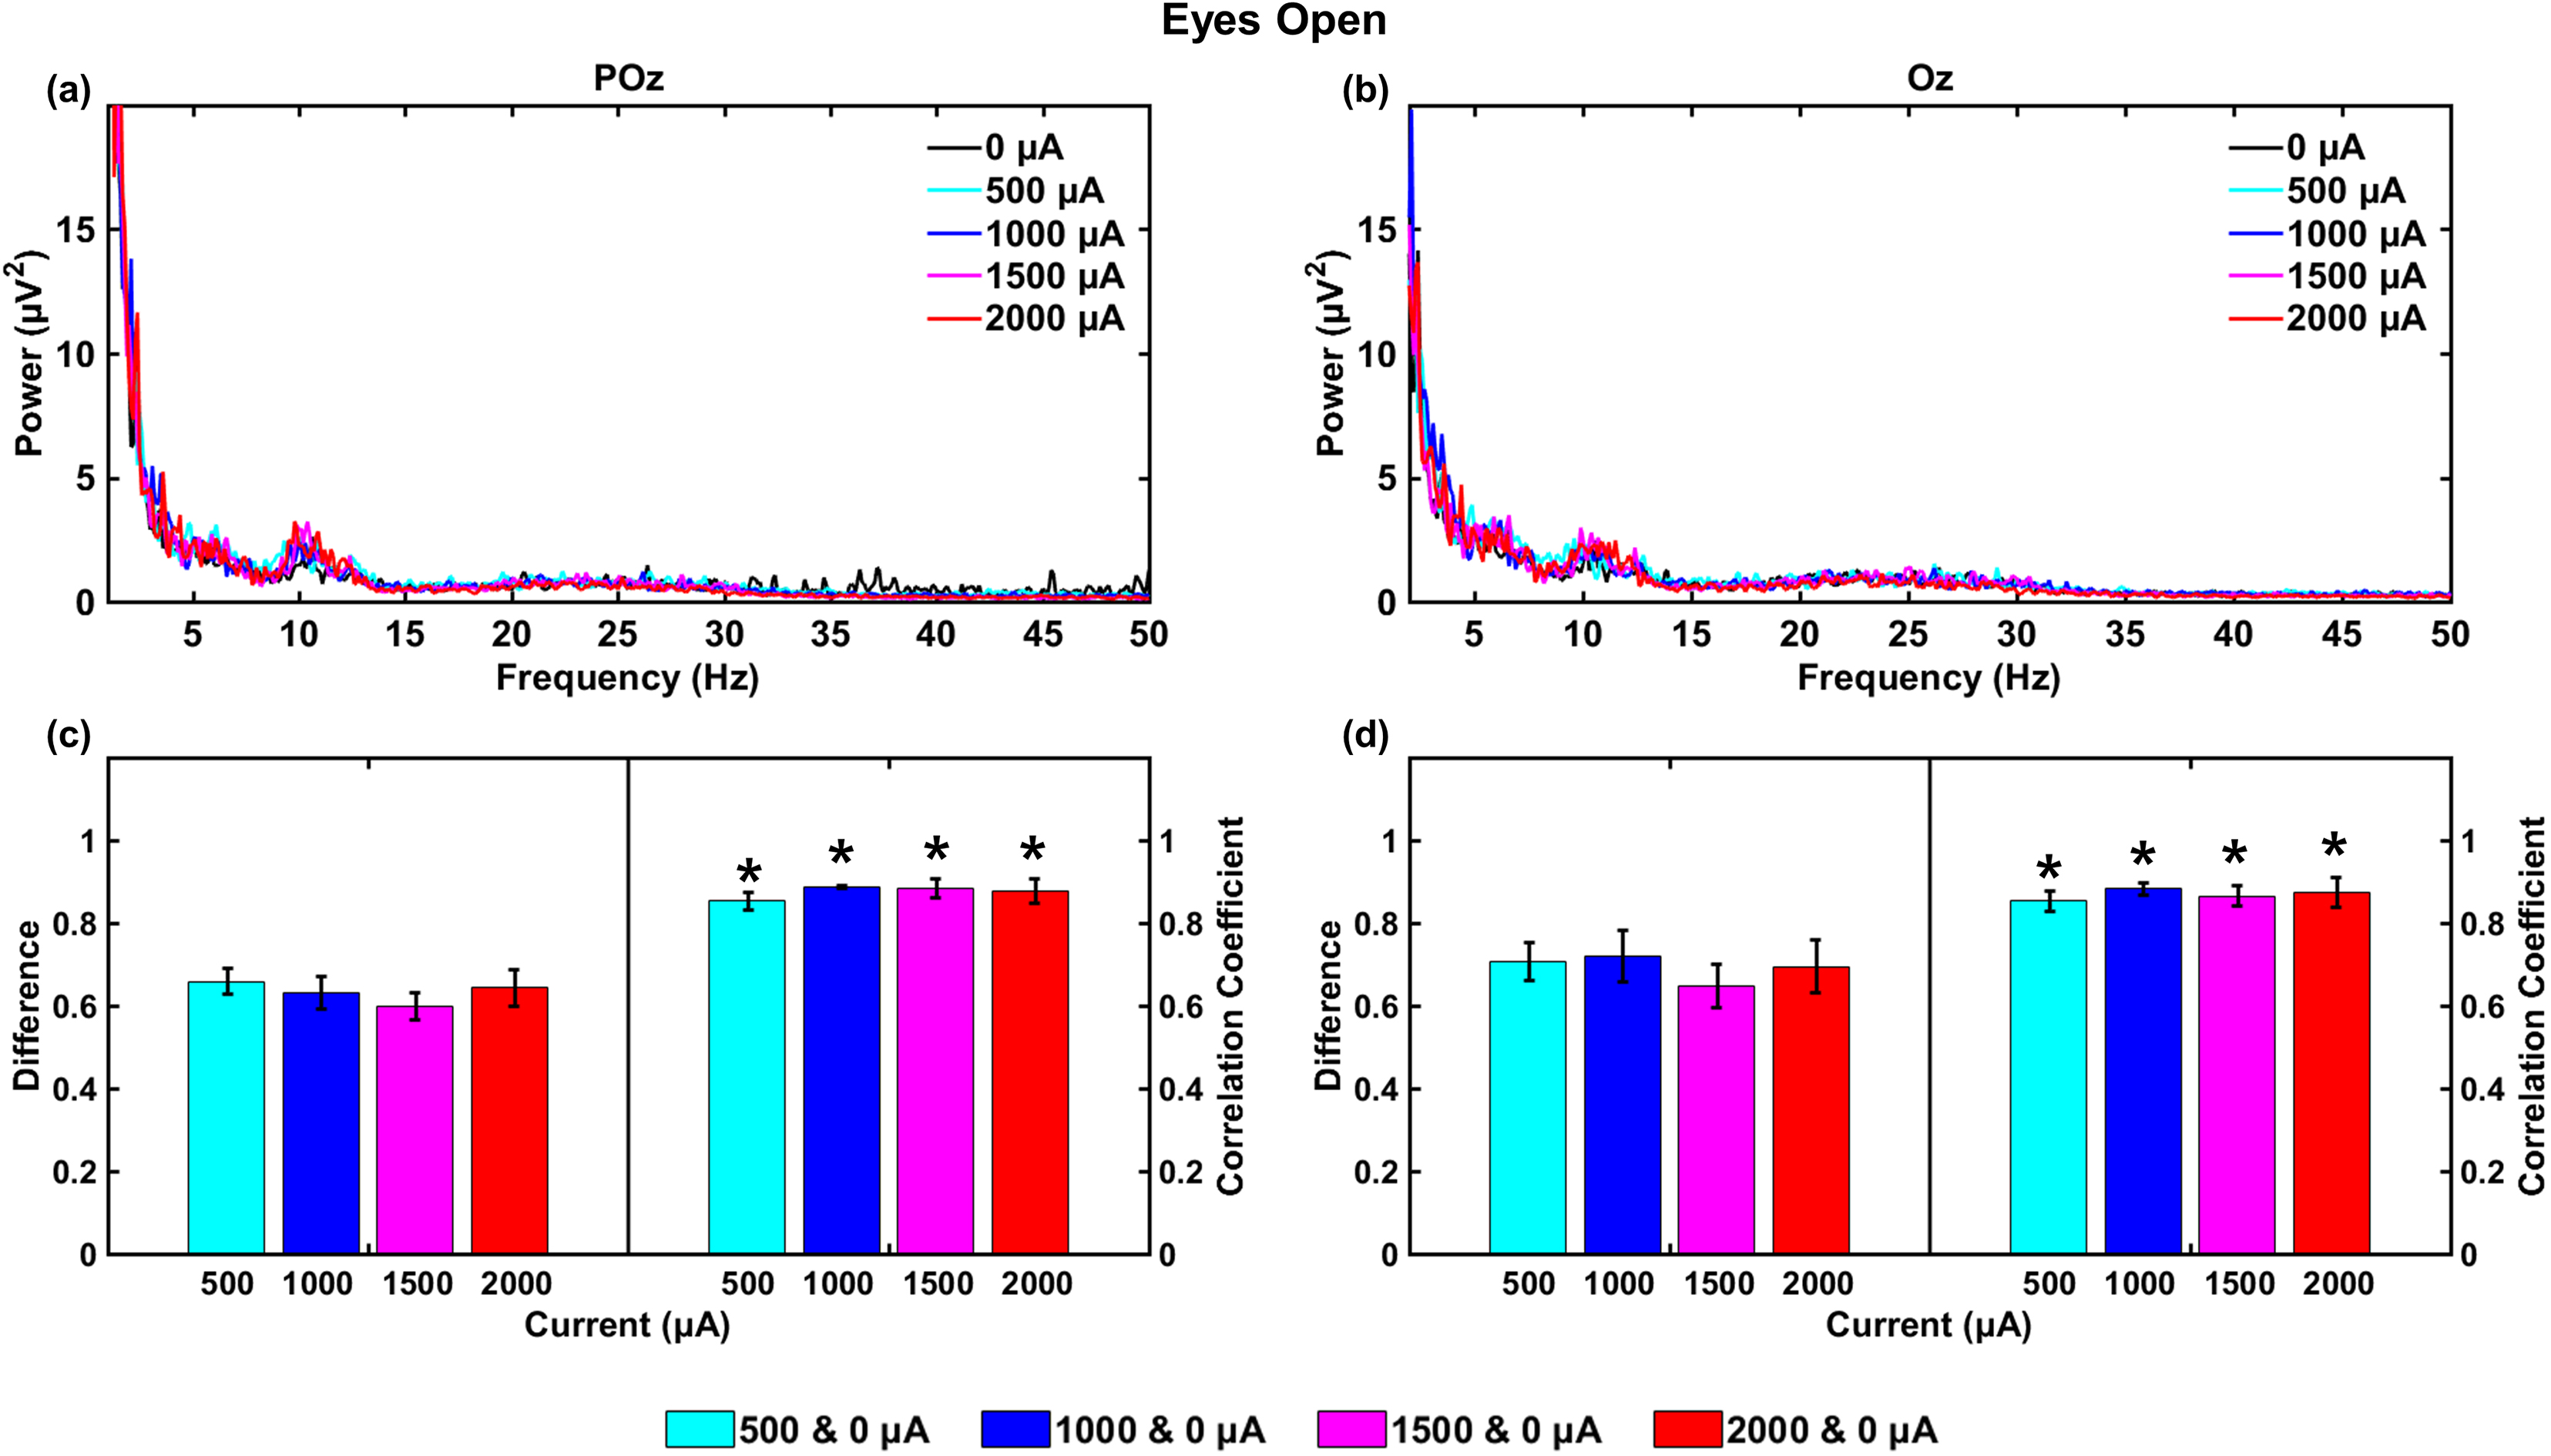
Figure 3.
Mean EEG-PSDs estimated during eyes open condition for (a) POz and (b) Oz in terms of current intensity, and PSD differences and correlation coefficients between non-stimulation (0
2.3EEG data analysis
For data analysis, two electrodes (POz and Oz) attached on the midline of the occipital lobe were only used because other electrodes were sometimes connected with the anode and cathode electrodes via saline solution used for attaching two tDCS electrodes, leading to significant inflow of tDCS-induced electrical artifacts to EEG. Also, because all EEG electrodes were connected with the tDCS electrodes via saline solution for one subject during the experiment, we excluded this subject for further data analysis. Note that brain areas related to the two electrodes selected for data analysis are influenced by tDCS even though they are less influenced as compared to those around the anode and cathode electrodes, as shown in Fig. 2b. Raw EEG data were first bandpass filtered with a Butterworth filter (0.5–50.5 Hz). After that, PSD was calculated using short-time Fourier transform (window size: 10 s with 90% overlap), and PSDs estimated along the time were averaged for each frequency. This analysis was separately applied to the EEG data measured for the five conditions with different current intensities (0, 500, 1000, 1500, and 2000
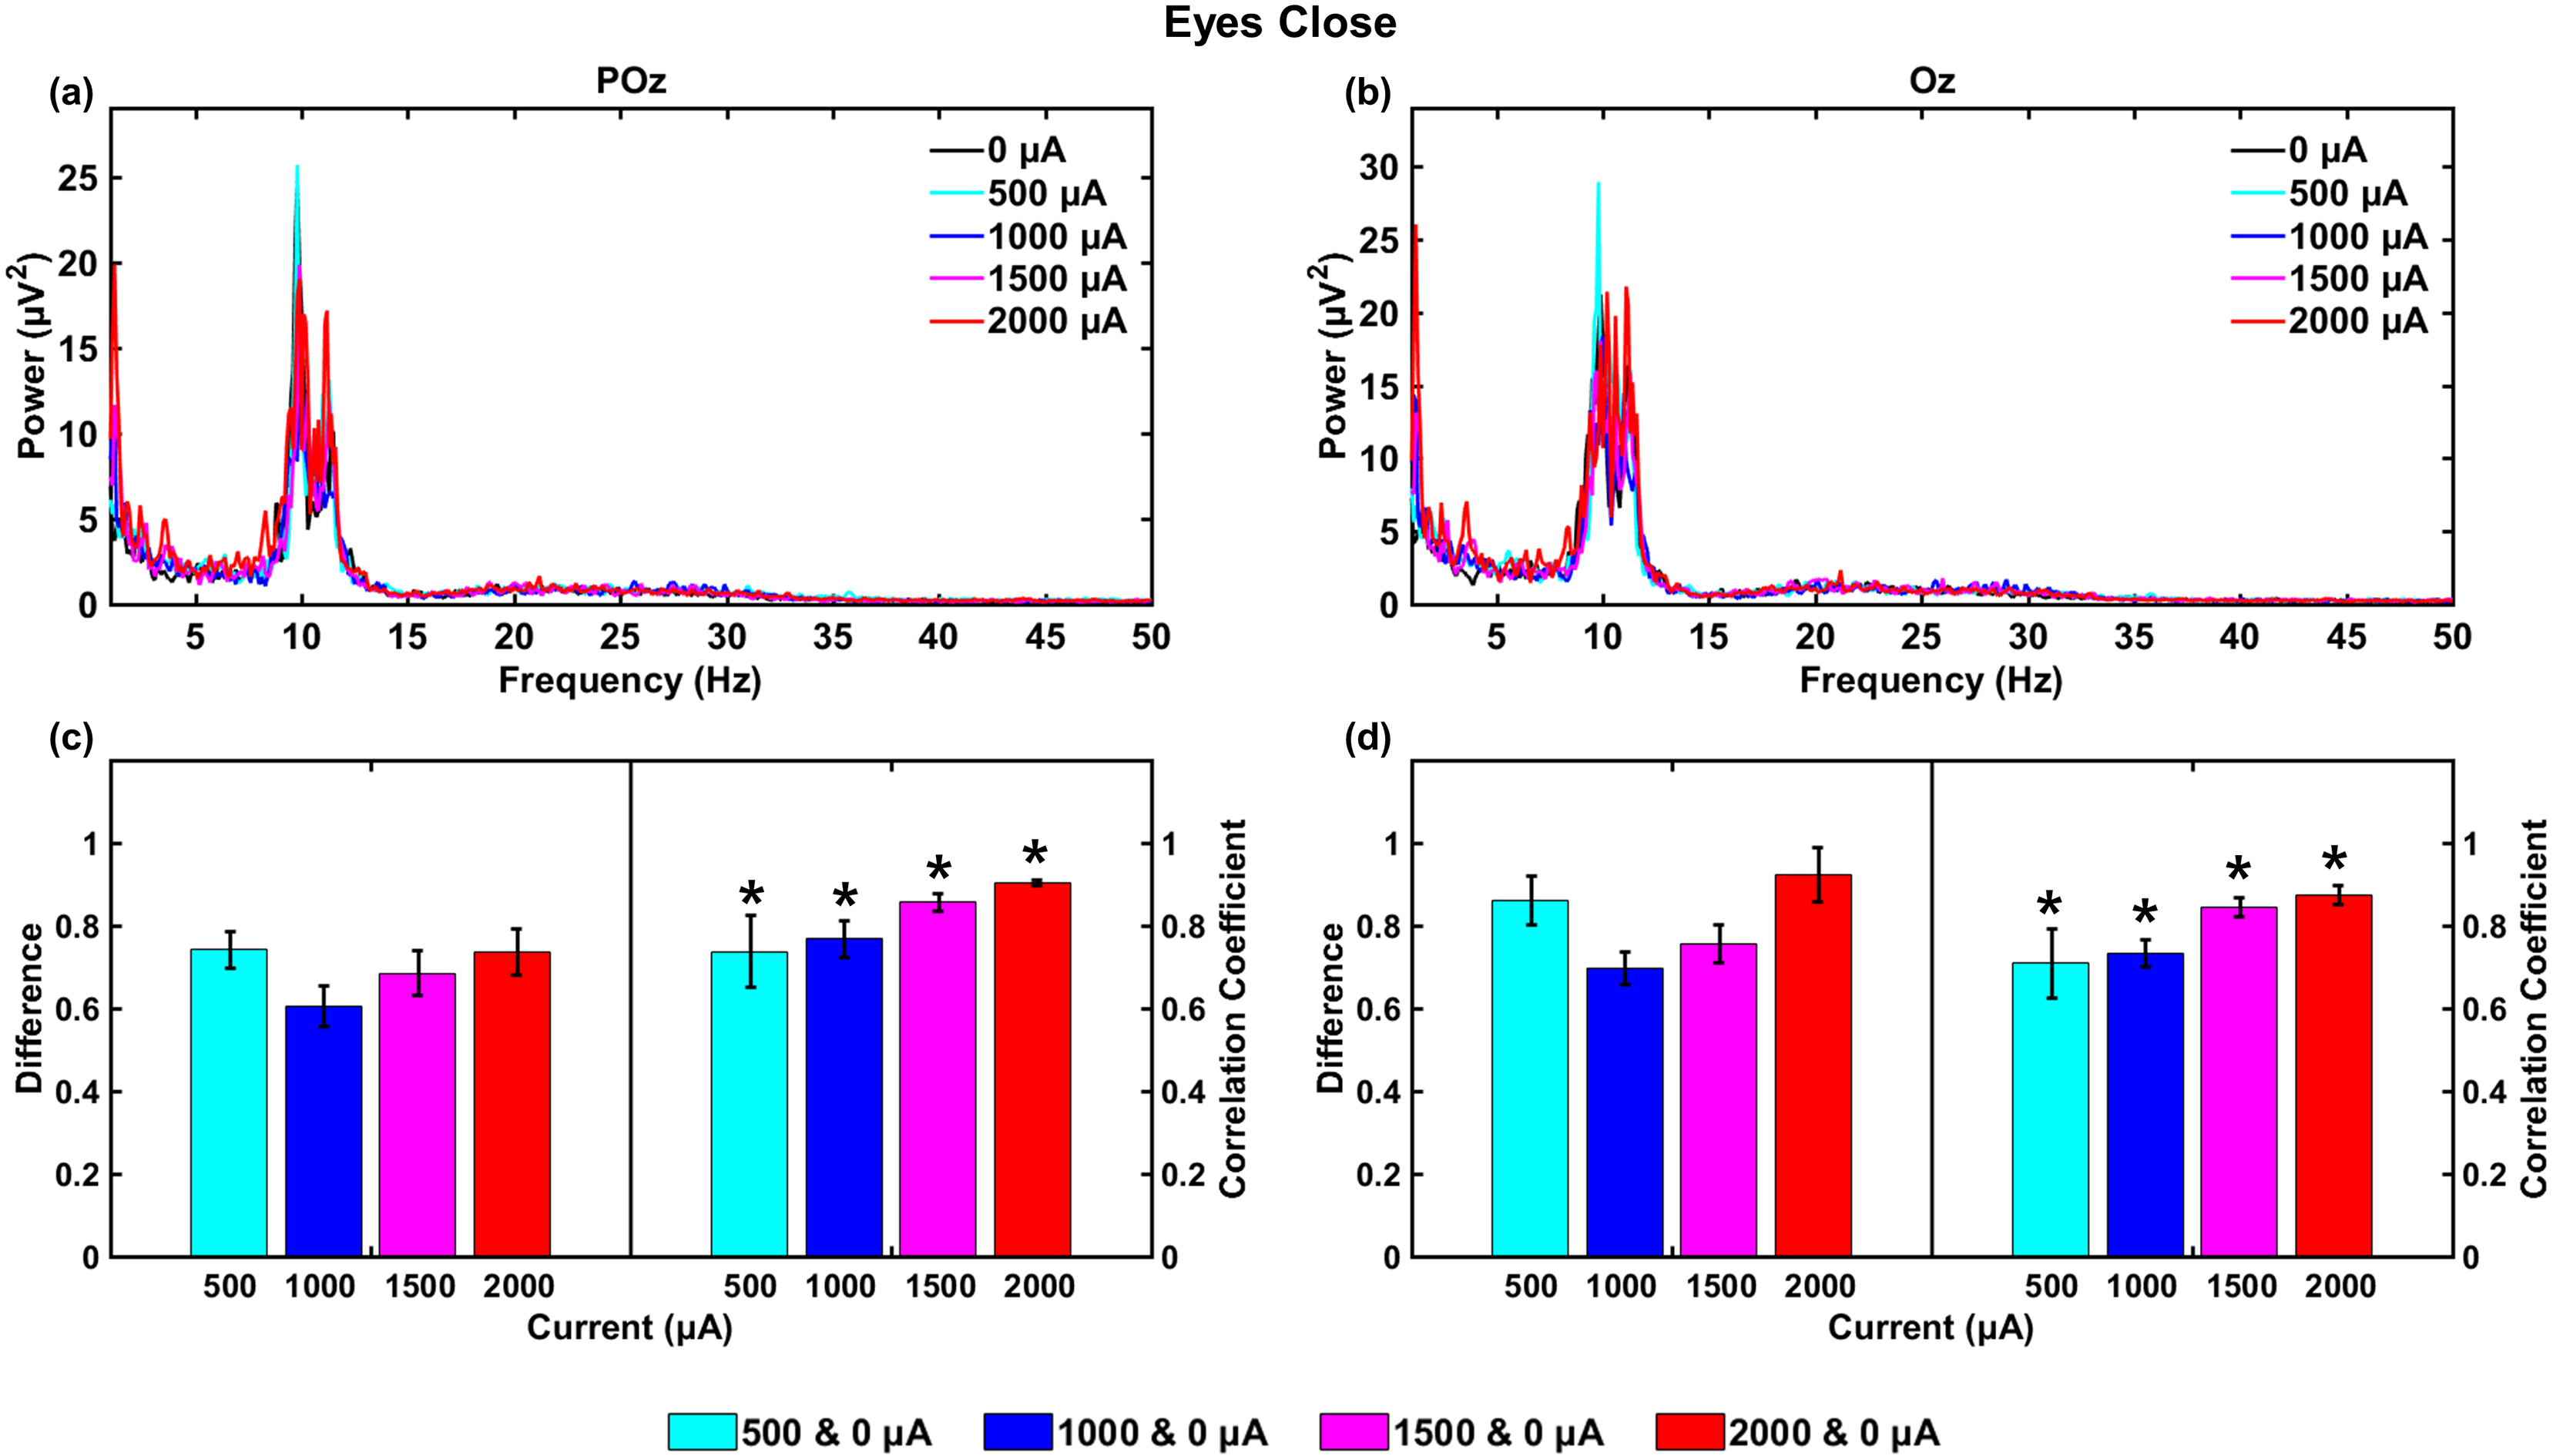
Figure 4.
Mean EEG-PSDs estimated during eyes closed condition for (a) POz and (b) Oz in terms of current intensity, and PSD differences and correlation coefficients between non-stimulation (0
3.Results
Figure 3a and b present the mean PSDs of two EEG electrodes ((a) POz and (b) Oz) of all subjects during EO with respect to current intensity (0, 500, 1000, 1500, and 2000
Figure 4 shows the same results as Fig. 3, but for mean EEG-PSDs during EC. Significant PSD increase is observed in
Table 1
Individual EEG-PSD differences and correlation coefficients between non-stimulation and tDCS conditions for eyes open and eyes closed condition at Oz. The values in parentheses indicate the standard errors
| Subject | Current | Eyes open | Eyes closed | ||
|---|---|---|---|---|---|
| intensity ( | PSD difference | Correlation coefficient | PSD difference | Correlation coefficient | |
| S1 | 500 | 0.62 (0.08) | 0.79 | 0.63 (0.05) | 0.53 |
| 1000 | 0.87 (0.16) | 0.92 | 0.67 (0.06) | 0.69 | |
| 1500 | 0.60 (0.06) | 0.94 | 0.84 (0.09) | 0.80 | |
| 2000 | 0.71 (0.11) | 0.89 | 0.81 (0.09) | 0.84 | |
| S2 | 500 | 0.88 (0.12) | 0.91 | 1.02 (0.17) | 0.92 |
| 1000 | 0.71 (0.11) | 0.89 | 0.78 (0.11) | 0.84 | |
| 1500 | 0.86 (0.16) | 0.80 | 0.77 (0.10) | 0.90 | |
| 2000 | 0.73 (0.14) | 0.76 | 1.07 (0.17) | 0.94 | |
| S3 | 500 | 0.60 (0.10) | 0.88 | 0.76 (0.07) | 0.57 |
| 1000 | 0.47 (0.05) | 0.88 | 0.51 (0.05) | 0.68 | |
| 1500 | 0.53 (0.07) | 0.87 | 0.46 (0.05) | 0.81 | |
| 2000 | 0.60 (0.11) | 0.90 | 0.60 (0.06) | 0.84 | |
| S4 | 500 | 0.71 (0.09) | 0.84 | 1.04 (0.16) | 0.81 |
| 1000 | 0.83 (0.15) | 0.84 | 0.83 (0.10) | 0.72 | |
| 1500 | 0.50 (0.11) | 0.85 | 0.97 (0.13) | 0.87 | |
| 2000 | 1.74 (0.16) | 0.95 | 1.21 (0.18) | 0.88 | |
| Mean | 500 | 0.71 (0.05) | 0.85 | 0.86 (0.06) | 0.71 |
| 1000 | 0.72 (0.06) | 0.88 | 0.70 (0.04) | 0.73 | |
| 1500 | 0.65 (0.05) | 0.86 | 0.76 (0.05) | 0.84 | |
| 2000 | 0.79 (0.06) | 0.87 | 0.92 (0.07) | 0.90 | |
Table 2
Individual EEG-PSD differences and correlation coefficients between non-stimulation and tDCS conditions for eyes open and eyes closed condition at POz. The values in parentheses indicate the standard errors
| Subject | Current | Eyes open | Eyes closed | ||
|---|---|---|---|---|---|
| intensity ( | PSD difference | Correlation coefficient | PSD difference | Correlation coefficient | |
| S1 | 500 | 0.52 (0.07) | 0.79 | 0.50 (0.04) | 0.51 |
| 1000 | 0.69 (0.12) | 0.89 | 0.58 (0.05) | 0.71 | |
| 1500 | 0.53 (0.06) | 0.91 | 0.67 (0.07) | 0.81 | |
| 2000 | 0.89 (0.10) | 0.88 | 0.71 (0.09) | 0.89 | |
| S2 | 500 | 0.69 (0.07) | 0.90 | 0.66 (0.09) | 0.91 |
| 1000 | 0.44 (0.07) | 0.89 | 0.45 (0.05) | 0.88 | |
| 1500 | 0.53 (0.08) | 0.82 | 0.57 (0.07) | 0.89 | |
| 2000 | 0.54 (0.09) | 0.79 | 0.76 (0.13) | 0.90 | |
| S3 | 500 | 0.53 (0.08) | 0.88 | 0.64 (0.04) | 0.64 |
| 1000 | 0.43 (0.04) | 0.87 | 0.27 (0.03) | 0.66 | |
| 1500 | 0.34 (0.06) | 0.88 | 0.29 (0.03) | 0.82 | |
| 2000 | 0.41 (0.09) | 0.89 | 0.39 (0.04) | 0.91 | |
| S4 | 500 | 0.89 (0.06) | 0.84 | 1.16 (0.14) | 0.89 |
| 1000 | 0.96 (0.09) | 0.90 | 1.11 (0.19) | 0.82 | |
| 1500 | 1.00 (0.08) | 0.92 | 1.21 (0.19) | 0.90 | |
| 2000 | 1.02 (0.08) | 0.95 | 1.08 (0.16) | 0.92 | |
| Mean | 500 | 0.66 (0.03) | 0.85 | 0.74 (0.04) | 0.74 |
| 1000 | 0.63 (0.04) | 0.89 | 0.61 (0.05) | 0.77 | |
| 1500 | 0.60 (0.03) | 0.88 | 0.68 (0.05) | 0.86 | |
| 2000 | 0.64 (0.04) | 0.88 | 0.73 (0.06) | 0.90 | |
Tables 1 and 2 summarize all individual results presented in Fig. 3c and d and Fig. 4c and d for POz and Oz, respectively. The mean PSD differences of EO and EC condition mostly ranges from about 0.6 to 0.7, and mean correlation coefficients are more than 0.7 for all comparison cases.
4.Discussion
Simultaneous measurement of brain activity is necessary during tDCS in order to investigate the accurate impact of tDCS on the brain, but which has been generally hindered when using EEG as a neuroimaging modality due to the inflow of significant tDCS-induced electrical artifacts. Most previous studies conducted based on a simultaneous EEG-tDCS paradigm reported that significant PSD increase is observed for all frequency bands during tDCS as compared to non-stimulation condition [12, 13, 14, 15, 16]. In this study, we introduced a current-limiter-based tDCS device to mitigate the impact of tDCS-induced artifacts on EEG. To demonstrate the feasibility of the developed current-limiter-based tDCS device, we performed simultaneous EEG-tDCS experiments, where resting-state EEG was measured during tDCS with different current intensities (0, 500, 1000, 1500, and 2000
Eight electrodes were attached to measure EEGs during tDCS, but as aforementioned only two electrodes, POz and Oz, were used for data analysis due to the connection issue between tDCS and EEG electrodes via saline solution. It would be better to use all EEG electrodes for data analysis to more strongly demonstrate the feasibility of our tDCS device based on current limiters in terms of tDCS-induced electrical artifacts. Thus, using only two electrodes is one limitation of this study. However, because the brain areas related to the selected two electrodes were also affected by tDCS, as shown in Fig. 2b, our results derived from the selected two electrodes would be still valid. On the other hand, we did not introduce a specific ramped-up time, but about 5–7 s was automatically introduced for ramped-up due to the nature of scalp conduction. To provide more stable current for tDCS, we will revise our tDCS device by introducing a particular ramped-up time in the near future.
The mean PSD differences between non-stimulation and tDCS condition were between 0.6 and 0.7 for most cases, regardless of current intensity. Considering that PSD values were observed with up to more than 25 (Fig. 4a and b), it can be thought that the PSD differences between 0.6 and 0.7 is not significantly high. In particular, even though a current intensity increases, no significant changes in PSD were observed (Figs 3a and b and 4a and b), meaning that our developed tDCS device can provide stable current for different intensities due to current limiters. Also, all correlation tests presented statistically high relationship between the PSDs of non-stimulation and tDCS conditions (
In most previous tDCS studies that investigated the impact of tDCS on EEG, after-effects of tDCS were generally investigated by comparing EEG measured before and after tDCS [12, 13, 14, 15, 16]. Because considerable tDCS-induced electrical artifacts are generally introduced to ongoing EEG during tDCS, tDCS impact could not be accurately explored during tDCS. As demonstrated in this study, because our tDCS device based on current limiter does not introduce significant artifact inflow, the impact of tDCS on EEGs can be investigated more accurately than previous studies that only investigated after-effects of tDCS [12, 13, 14, 15, 16]. For example, resting-state EEGs can be measured before, during, and after tDCS, and thereby the impact of tDCS can be more precisely investigated using our developed tDCS device.
Acknowledgments
This research was supported by the Original Technology Research for Brain Science through the National Research Foundation of Korea (NRF) funded by the Ministry of Education, Science & Technology (2015M3C7A1031969 and 2019M3C7A1031278), by a grant from the Korea Health Technology R&D Project through the Korea Health Industry Development Institute (KHIDI) funded by the Ministry of Health & Welfare (HI17C1501), and by the BB21
Conflict of interest
None to report.
References
[1] | Nitsche MA, Paulus W. Excitability changes induced in the human motor cortex by weak transcranial direct current stimulation. J Physiol. (2000) ; 527: (3): 633-9. |
[2] | Schlaug G, Vijay R, Dinesh N. Transcranial direct current stimulation in stroke recovery. Arch Neurol. (2008) ; 65: (12): 1571-6. |
[3] | Donde C, Nicholas HN, Pierre AG. The Impact of Transcranial Direct Current Stimulation (tDCS) on Bipolar Depression, Mania, and Euthymia: a Systematic Review of Preliminary Data. Psychiatr Q. (2018) ; 89: (4): 855-67. |
[4] | Benninger DH, Lomarev M, Lopez, G, Wassermann EM, Li X, Considine E, Hallett M. Transcranial direct current stimulation for the treatment of Parkinson’s disease. J Neurol Neurosurg Psychiatry. (2010) ; 81: (10): 1105-11. |
[5] | Loo CK, Alonzo A, Martin D, Mitchell PB, Galvez V, Sachdev P. Transcranial direct current stimulation for depression: 3-week, randomized, sham-controlled trial. Br J Psychiatry. (2012) ; 200: (1): 52-9. |
[6] | Fregni F, Boggio PS, Mansur CG, Wagner T, Ferreira MJL, Lima MC. Transcranial direct current stimulation of the unaffected hemisphere in stroke patients. Neuroreport. (2005) ; 16: (14): 1551-5. |
[7] | San-juan D, Morales-Quezada L, Garduño AJO, Alonso-Vanegas M, González-Aragón MF, Espinoza López DAE. Transcranial direct current stimulation in epilepsy. Brain Stimul. (2015) ; 8: (3): 455-64. |
[8] | Woods AJ, Antal A, Bikson M, Boggio PS, Brunoni AR, Celnik P. A technical guide to tDCS, and related non-invasive brain stimulation tools. Clin Neurophysiol. (2016) ; 127: (2): 1031-48. |
[9] | Esterer S, Abbott L, Magazzini L, McGonigle D. Concurrent tDCS-NIRS-MEG: Insights from a technical pilot. Brain Stimul. (2019) ; 12: (2): 497. |
[10] | Han CH, Song H, Kang YG, Kim BM, Im CH. Hemodynamic responses in rat brain during transcranial direct current stimulation: a functional near-infrared spectroscopy study. Biomed Opt Express. (2014) ; 5: (6): 1812-21. |
[11] | Meinzer M, Lindenberg R, Darkow R, Ulm L, Copland D, Flöel A. Transcranial direct current stimulation and simultaneous functional magnetic resonance imaging. J Vis Exp. (2014) ; 86: : e51730. |
[12] | Faria P, Fregni F, Sebastião F, Dias AI, Leal A. Feasibility of focal transcranial DC polarization with simultaneous EEG recording: preliminary assessment in healthy subjects and human epilepsy. Epilepsy Behav. (2012) ; 25: (3): 417-25. |
[13] | Schestatsky P, Morales-Quezada L, Fregni F. Simultaneous EEG monitoring during transcranial direct current stimulation. J Vis Exp. (2013) ; 76: : 50426. |
[14] | Roy A, Baxter B, He B. High-definition transcranial direct current stimulation induces both acute and persistent changes in broadband cortical synchronization: a simultaneous tDCS-EEG Study. IEEE Trans Biomed Eng. (2014) ; 61: (7): 1967-78. |
[15] | Soekadar SR, Witkowski M, Cossio EG, Birbaumer N, Cohen L. Learned EEG-based brain self-regulation of motor-related oscillations during application of transcranial electric brain stimulation: feasibility and limitations. Front. Behav. Neurosci. (2014) ; 8: : 93. |
[16] | Boonstra TW, Nikolin S, Meisener AC, Martin DM, Loo CK. Change in mean frequency of resting-state electroencephalography after transcranial direct current stimulation. Front Hum Neurosci. (2016) ; 10: : 270. |
[17] | Barry RJ, Clarke AR, Johnstone SJ, Magee CA, Rushby JA. EEG differences between eyes-closed and eyes-open resting conditions. Clin Neurophysiol. (2007) ; 118: (12): 2765-73. |


