
A portable plantar pressure system: Specifications, design, and preliminary results
Abstract
BACKGROUND:
In recent years, there has been an increasing interest in developing in-shoe foot plantar pressure systems. Although such devices are not novel, devising insole devices for gait analysis is still an important issue.
OBJECTIVE:
The goal of this study is to develop a new portable system for plantar pressure distribution measurement based on a three-axis accelerometer.
METHODS:
The portable system includes: PJRC Teensy 3.6 microcontroller with 32-bit ARM Cortex-M4 microprocessor with a clock speed of 180 MHz; HC-11 radio modules (transmitter and receiver); a battery; a fixing band; pressure sensors; MPU-9150 inertial navigation module; and FFC tape. The pressure insole is leather-based and consists of seven layers. It is divided into 16 areas and the outcome of the system is data concerning plantar pressure distribution under foot during gait. The system was tested on 22 healthy volunteer subjects, and the data was compared with a commercially available system: Medilogic.
RESULT:
The SNR value for the proposed sensor is 28.27 dB. For a range of pressure of 30–100 N, the sensitivity is 0.0066 V/N while the linearity error is 0.05. The difference in plantar pressure from both the portable plantar pressure system and Medilogic is not statistically significant.
CONCLUSION:
The proposed system could be recommended for research applications both inside and outside of a typical gait laboratory.
1.Introduction
Human movement is a result of a complex interaction between various peripheral and central inputs. Quantitative variables such as joint angles, joint moments and powers, pressure distribution, or spatiotemporal gait parameters are crucial to identify a person’s disability [1, 2, 3, 4]. Among the gait parameters, plantar pressure distribution is a significant clinical parameter in the diagnosis of lower limbs deformities [5, 6, 7]. Several types of measurement systems exist, i.e. dynamometric platforms, portable pressure-sensitive mats, and in-shoe systems [8, 9, 10, 11]. The platforms have different designs and functionalities and differ primarily in the following parameters: sensitivity, range, frequency, and size. Despite their numerous advantages, they are limited to indoor measurement. In turn, plantar pressure mats consist of a large number of sensors, which ensures a high accuracy of measurement. However, the disadvantage is the impossibility of data collection in various conditions, e.g. during climbing or descending stairs. On the contrary, in-shoe sensors are more flexible and embedded in the shoe. There are several commercial portable systems available on the market, namely F-scan (Tekscan, USA), Pedar-X (Novel Inc., USA), LogR (Orpyx Inc., Canada), and Medilogic (T&T Medilogic Medizintechnik GmbH, Germany). The main disadvantage of such systems is their fragility, caused by the demand for minimal thickness and a heavy work environment.
Over the past five years, there has been an increasing interest in developing in-shoe foot plantar pressure systems using both wired and wireless systems [12, 13]. Bae et al. [14] presented a mobile gait monitoring system for the diagnosis of abnormal gait and rehabilitation. Ostaszewski et al. [15] proposed a wireless wearable sensor system for successive non-laboratory measurement of ground reaction force, joint angles, joint forces, and joint moments. CoP and triaxial GRF in several walking trials were measured by Liu et al. [16]. Healy et al. [17] proposed an in-shoe system with better repeatability compared to other commercially available systems. An advanced system with three orthogonal accelerometers, three orthogonal gyroscopes, four force sensors, two bidirectional bend sensors, two dynamic pressure sensors, and electric field height sensors were developed by Bamberg et al. [18]. The device enabled estimation of foot orientation, position, and toe-off. Most of the devices are educational prototypes, where data is transmitted via Bluetooth wireless and wire modules with sampling frequencies ranging from 20 Hz to 400 Hz. All of the devices mentioned above were validated by comparing them with systems available on the market, i.e. video recording and wearable devices [19, 20]. Although such devices are not novel and have been developed in recent years, insole devices for gait analysis are still of importance. Therefore, the aim of this paper is to develop a portable system with an insole to collect plantar pressure distribution under the foot. The system uses 16 pressure sensors and a three-axis accelerometer on insoles placed inside shoes on both feet to detect heel-strike and estimate foot orientation.
2.Methods
2.1Hardware and software architecture
The proposed system enables the measurement of plantar pressure distribution during gait. It consists of a three-axis accelerometer placed on insoles to detect heel-strike and estimate foot orientation. The portable system is presented in Fig. 1 and consists of: 1 – PJRC Teensy 3.6 microcontroller with 32-bit ARM Cortex-M4 microprocessor with a clock speed of 180 MHz; 2 – HC-11 radio modules (transmitter and receiver); 3 – battery; 4 – fixing band; 5 – pressure sensors; 6 – MPU-9150 inertial navigation module; 7 – FFC tape.
Figure 1.
The portable system. 1) Microcontroller, 2) radio modules, 3) battery, 4) fixing band, 5) pressure sensors, 6) inertial navigation module, 7) FFC tape.
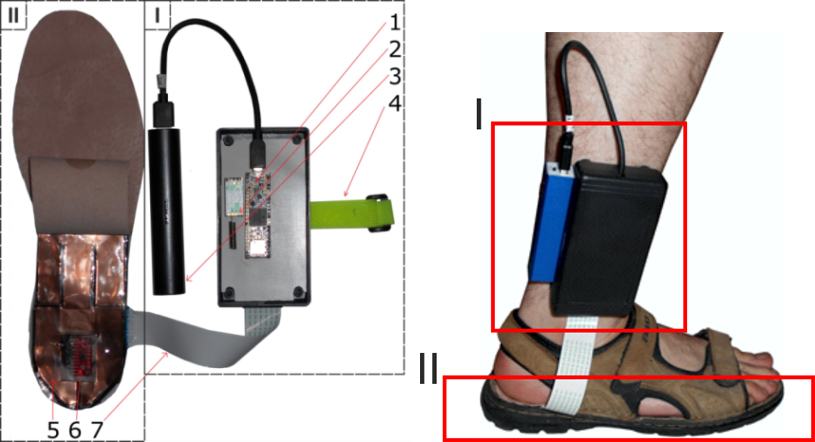
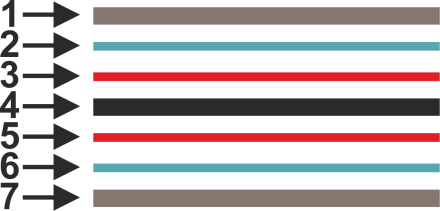
The pressure insole is leather-based and consists of seven layers (Fig. 2), namely a leather insert, a wire leather insert, a protective film, a 0.5 mm copper sheet, an insulating protective film, a polymeric film, and a 0.5 mm copper sheet. The component of the sensor that directly responds to pressure is a thin polymer film (4) covered with: conductive layers (3) and (5), insulating layers (2) and (6), and protective layers (1) and (7).
Figure 2.
Design of the resistive sensor.
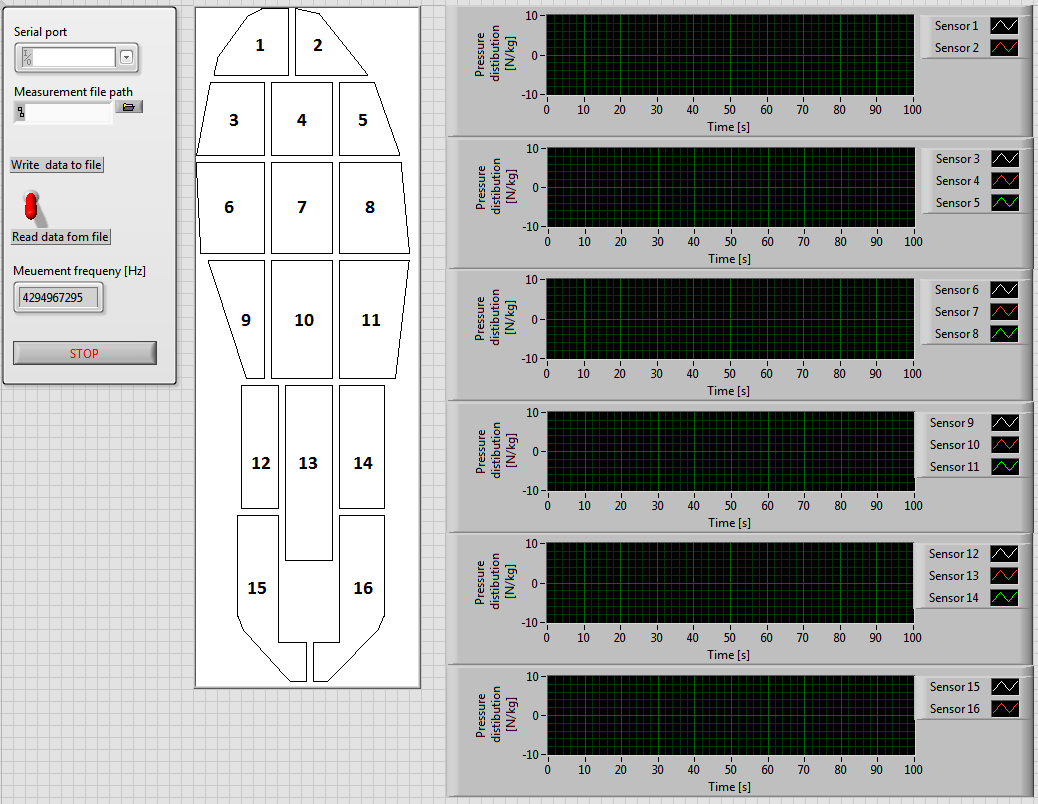
Due to the number of layers, the maximum thickness of the insole is approximately 6 mm. The gait monitoring system was developed in LabVIEW software (National Instruments, USA) (Fig. 3). The insole is divided into 16 areas: heel (areas 1–2), mid-foot (areas 3–8), metatarsal (areas 9–14), and toe (areas 15–16). These areas are sufficient to support most of the body weight. The insoles proposed by the authors are European size 38 to 45. Shu et al. [20] proved that the number of sensors necessary to cover most of the body weight changes is 15.
Figure 3.
Gait monitoring system.
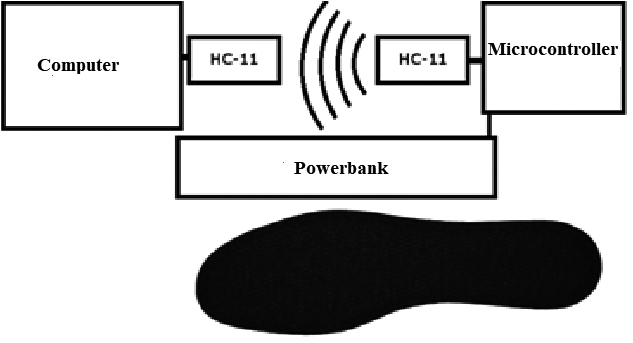
The software process uses a low-pass Kalman filter. Communication between the measuring system and the computer is based on two HC-11 radio modules in a frequency range of 433.4–473 MHz, depending on the selected work channel. One HC-11 module is connected to the microcontroller and acts as a transmitter; the other is connected to the converter and acts as a receiver. The HC-11 radio module (receiver) uses the PL2303 system and communicates with the computer via a USB-UART converter. The device exhibits such a low power consumption that the energy from a small battery is sufficient for collecting and recording the required data. Figure 4 presents a block diagram of the portable measurement system.
Figure 4.
Block diagram of the portable measurement system.
2.2Gait data measurement
The participants were healthy volunteers without neurological conditions or a reduced ability to perform daily routines and were recruited among the personnel at Bialystok University of Technology, Poland. The study was conducted in accordance with the Declaration of Helsinki. Written informed consent was obtained from each participant. The subject’s body mass was measured using a scale with a resolution of 100 g. The subject’s height was measured with the use of a stadiometer. For measuring plantar pressure distribution, the healthy volunteers were instructed to walk a distance of approximately 60 meters at their habitual speed outside of a standard laboratory. Each measurement was repeated three times per foot. The plantar pressure under 16 anatomical masks was measured per each step and normalized to the subject’s body mass. All the subjects were provided with an identical kind of footwear to control for differences in personal footwear. The precision of measurement and the accuracy of the system were validated against a system available on the market (T&T Medilogic Medizintechnik GmbH, Germany) during walking in the same healthy volunteers. The data was sampled at 60 Hz.
2.3Statistical analysis
Repeated measures ANOVA was applied to evaluate the differences in plantar pressure parameters. The mean value of plantar pressure was calculated in all masks for a single step. The results were expressed as means
3.Results
3.1Testing of the sensor
The proposed sensor (size 10 mm
Table 1
Parameters of the sensor
| The range of pressure [N] | Sensitivity [V/N] | Linearity error |
|---|---|---|
| 0–7 | 0.22 | 0.10 |
| 7–30 | 0.04 | 0.06 |
| 30–100 | 0.0066 | 0.05 |
Figure 5.
Sensor calibration. a) Calibration setup, b) hysteresis of the sensor.
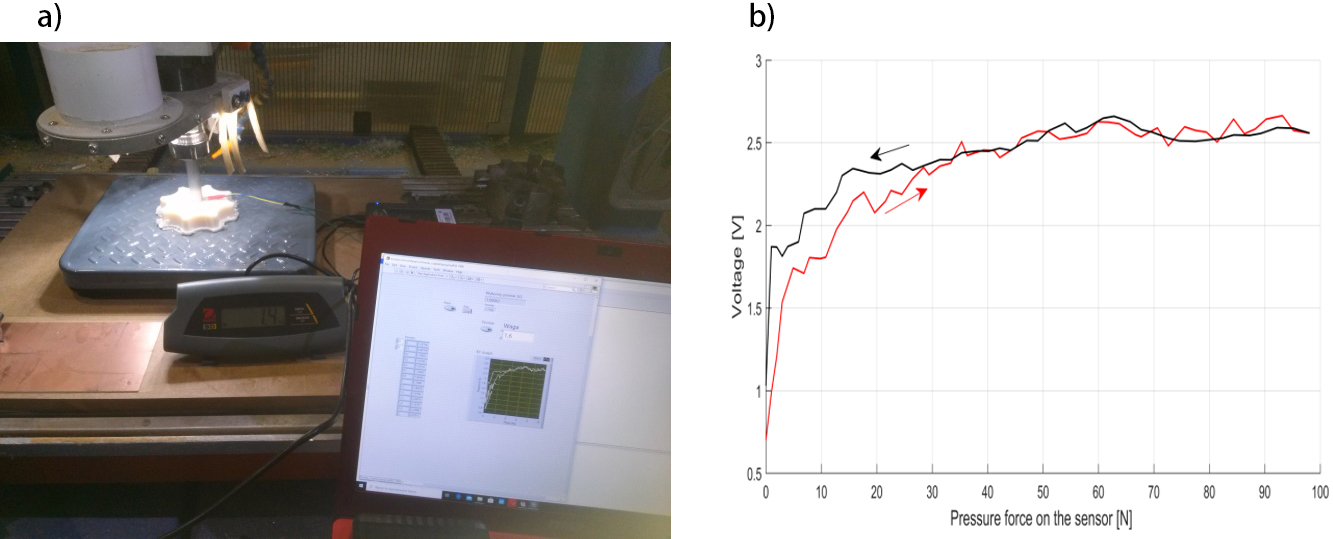
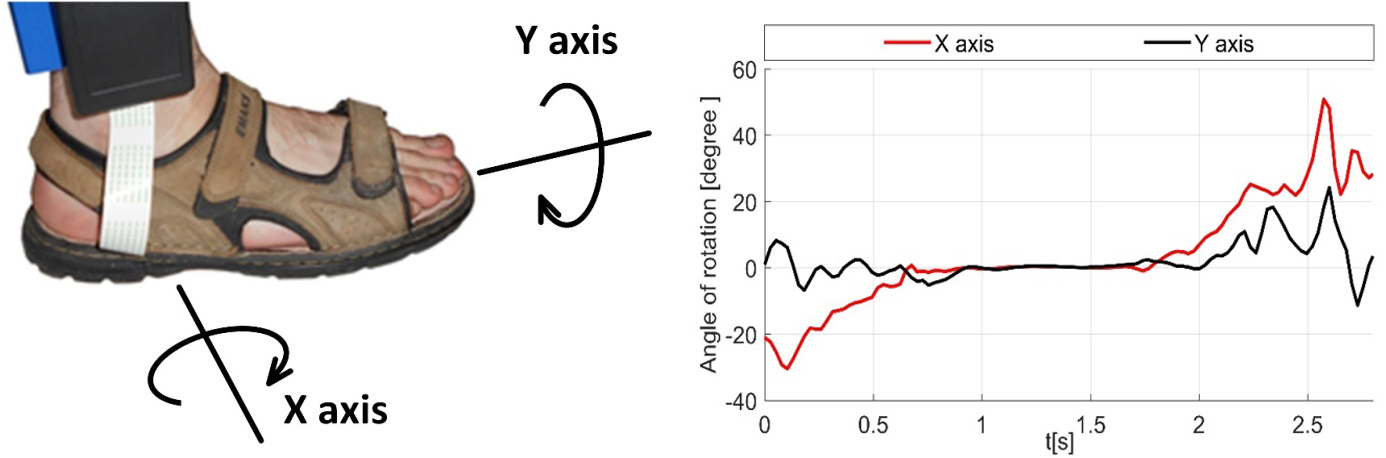
Figure 6.
Estimation of foot orientation. a) Axis definition, b) gait event detection.
3.2Testing of the portable system
Twenty two healthy male volunteers (24.0
Table 2
Mean (SD) plantar pressure distribution from the portable system vs. Medilogic system
| Sensor number | Portable system [N /kg] | Medilogic system [N/kg] |
|---|---|---|
| 1 | 5.83 (0.12) | 6.34 (0.17) |
| 2 | 4.87 (0.15) | 4.88 (0.15) |
| 3 | 4.45 (0.11) | 4.75 (0.08) |
| 4 | 4.34 (0.09) | 4.36 (0.11) |
| 5 | 4.52 (0.12) | 4.54 (0.15) |
| 6 | 4.03 (0.08) | 4.07 (0.11) |
| 7 | 4.85 (0.14) | 4.84 (0.16) |
| 8 | 3.77 (0.14) | 3.71 (0.10) |
| 9 | 3.41 (0.14) | 3.72 (0.09) |
| 10 | 3.76 (0.15) | 3.95 (0.17) |
| 11 | 4.47 (0.16) | 4.42 (0.15) |
| 12 | 3.21 (0.15) | 3.21 (0.08) |
| 13 | 6.96 (0.16) | 6.95 (0.17) |
| 14 | 4.40 (0.18) | 4.41 (0.15) |
| 15 | 6.97 (0.19) | 6.42 (0.17) |
| 16 | 6.65 (0.16) | 6.33 (0.17) |
Figure 7.
The experimental setup with images of plantar pressure during gait. a) The experiment, b) plantar pressure distribution for a typical man during walking.
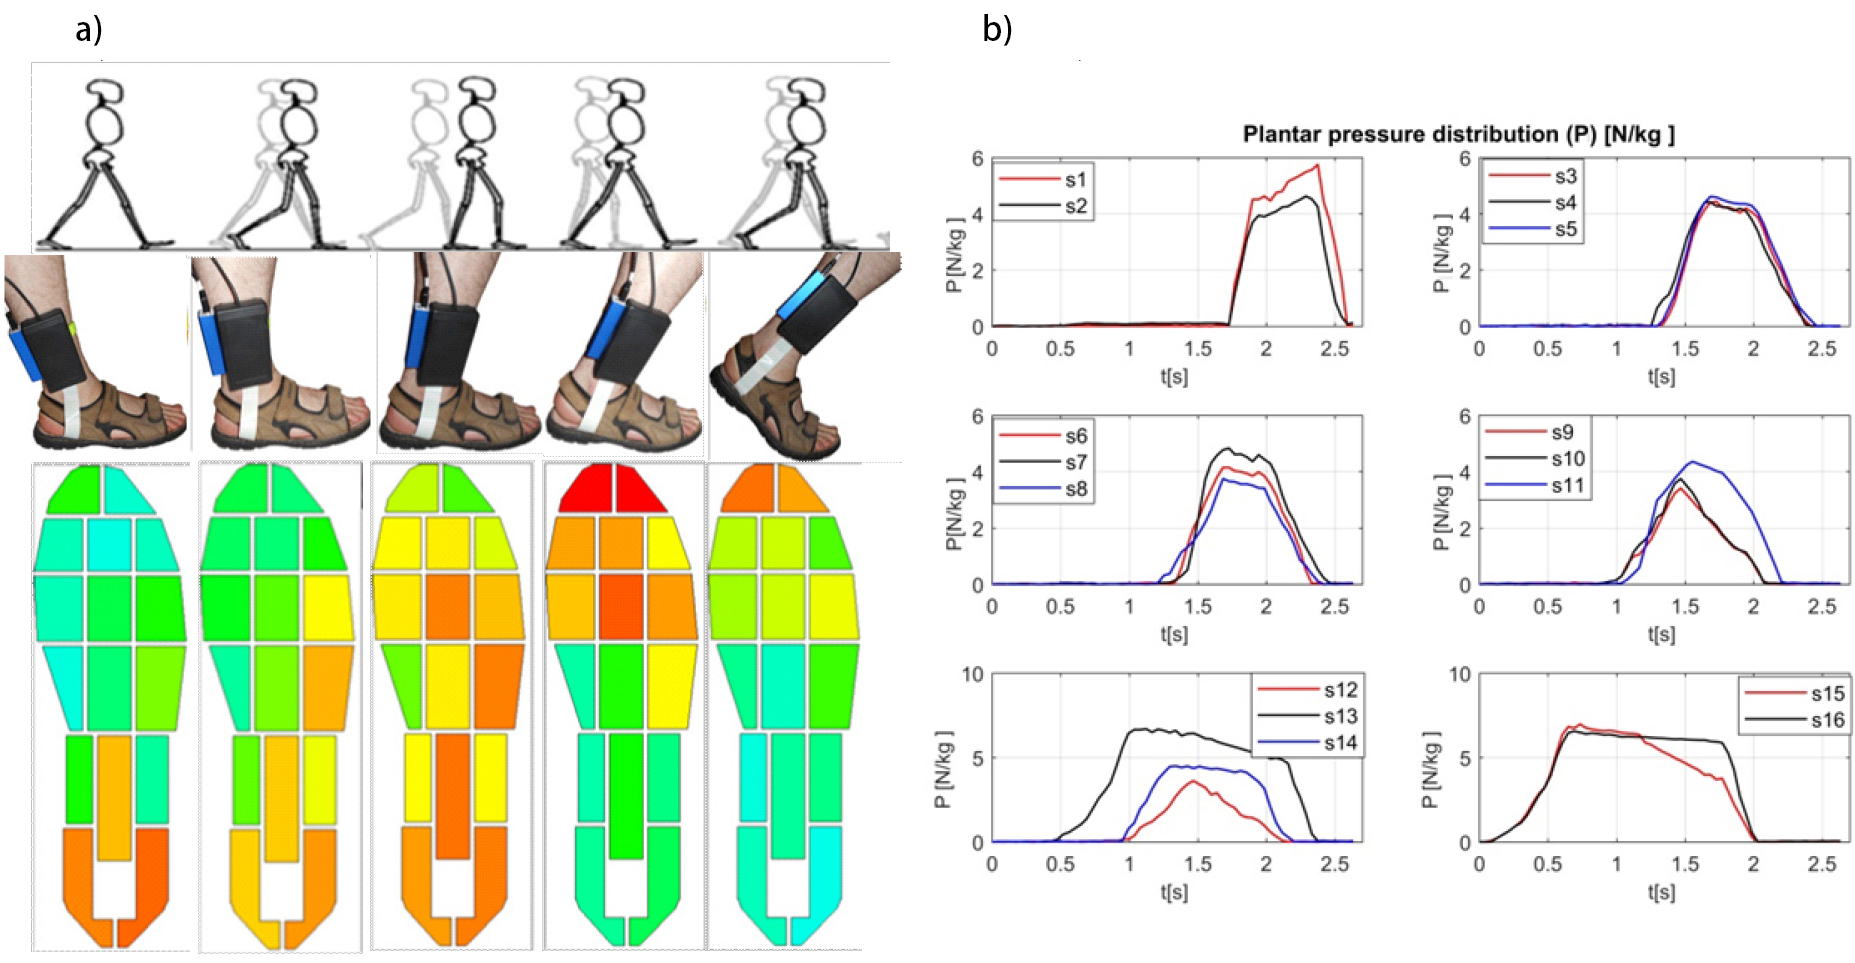
Heel strike was collected by sensors 15–16, and the orientation of the foot relative to the position was recorded as shown in Fig. 6b. The value of 0 means that the foot is on the ground. Gait data was collected simultaneously by the new portable system and the system available on the market (T&T
The values of plantar pressure distribution compared to the commercial Medilogic system are presented in Table 2. There are no significant differences between the results obtained from both systems, i.e. the portable system and Medilogic (
4.Conclusion
A new portable system for uninterrupted measurement of plantar pressure, which is an important issue in gait measurement and understanding the stability during walking, was developed in this study. The strengths of the study are as follows: data collected outside laboratory settings, real time monitoring, and low weight of the setup (250 g). Although the portable system has been tested for high accuracy, further research should focus on developing a Kalman filter based on a dynamic model that would improve the correctness of the mapping of the foot orientation and enables the performance of statistical tests for gait detection.
Acknowledgments
This work was co-financed by the Ministry of Science and Higher Education of Poland within the framework of projects no. WZ/WM-IIB/12/2019 and W/WE-IA/4/2020.
Conflict of interest
None to report.
References
[1] | Banach M, Wasilewska A, Długosz R, Pauk J. Novel techniques for wireless motion capture system for monitoring rehabilitation of disabled persons in smart biuldings. Technology and Healt Care. (2018) ; 26: (S2): 671-677. |
[2] | Pauk J, Minta-Bielecka K. Gait patterns classification based on cluster and bicluster analysis. Biocybernetics and Biomedical Engineering. (2016) ; 36: (2): 391-396. |
[3] | Capozzo A. Measurement of human locomotion. Journal of Biomechanics. (2002) ; 36: (1): 147-148. |
[4] | Pauk J, Ihnatouski M, Daunoraviciene K, Laskhousky U, Griskevicius J. Research of the spatial-temporal gait parameters and pressure characteristic in spastic diplegia children. Acta of Bioengineering and Biomechanics. (2016) ; 18: (2): 121-129. |
[5] | Pedotti A, Frigo C. Quanitative analysis of locomotion of basic research and clinical applications. Functional Neurology. (1992) ; 7: (4): 47-56. |
[6] | Woltring HJ. Smoothing and differentiation techniques applied to 3-D data. In P. Allard, I.A.F. Stokes & J.P. Blanchi (Eds.). Three-dimensional analysis of human movement. Champaigne, IL: Human Kinetics. (1995) ; 79-99. |
[7] | Imaizumi K, Iwakami Y, Yamashita K. Effect of foot load changes on foot arch evaluation using foot pressure distribution data. Journal of Foot & Ankle Research. (2014) ; 7: (S1): A114. |
[8] | Hegde N, Bries M, Sazonov EA. Ccomparative review of footwear-based wearable systems. Electronics. (2016) ; 5: : 48. |
[9] | Zhang K, Sun M, Lester DK, Pi-Sunyer FX, Boozer CN, Longman RW. Assessment of human locomotion by using an insole measurement system and artificial neural networks. Journal of Biomechanics. (2005) ; 38: : 2276-2287. |
[10] | Hegde N, Bries M, Melanson E, Sazonov E. One size fits all electronics for insole-based activity monitoring. In Proceedings of the 39th Annual International Conference of the IEEE Engineering in Medicine and Biology Society, Jeju Island, Korea, 11–15 July (2017) : pp. 3564-3567. |
[11] | el Achkar CM, Lenoble-Hoskovec C, Paraschiv-Ionescu A, Major K, Büla C, Aminian K. Instrumented shoes for activity classification in the elderly. Gait & Posture (2016) ; 44: : 12-17. |
[12] | Bamberg S, Benbasat AY, Scarborough DM, Krebs DE, Paradiso JA. Gait analysis using a shoe-integrated wireless sensor system. IEEE Trans Inf Technol Biomed. (2008) ; 12: : 413-423. |
[13] | Anlauff J, Fung J, Cooperstock JR. VibeWalk: Foot-based tactons during walking and quiet stance. In Proceedings of the 2017 IEEE World Haptics Conference (WHC), Munich, Germany, 6–9 June (2017) ; 454: : 647-652. |
[14] | Bae J, Kong K, Był N, Tomizuka M. A mobile gait monitoring system for abnormal gait diagnosis and rehabilitation: a pilot study for Parkinson disease patients. J Biomech Eng. (2011) ; 133: (4): 041005. doi: 10.1115/1.4003525. |
[15] | Ostaszewski M, Pauk J. Estimation of ground reaction forces and joint moments on the basis on plantar pressure insoles and wearable sensors for joint angle measurement. Technology and Health Care: Official Journal of the European Society for Engineering and Medicine. (2018) ; 26: (2): 1-8. |
[16] | Liu T, Inoue Y, Shibata KA. Wearable ground reaction force sensor system and its application to the measurement of extrinsic gait variability. Sensors. (2010) ; 10: (11): 10240-10255. |
[17] | Healy A, Burgess-Walker P, Naemi R, Chockalingam N. Repeatability of WalkinSense® in shoe pressure measurement system: A preliminary study. Foot. (2012) ; 22: : 35-39. |
[18] | Bamberg S, Benbasat AY, Scarborough DM, Krebs DE, Paradiso JA. Gait analysis using a shoe-integrated wireless sensor system. IEEE Trans Inf Technol Biomed. (2008) ; 12: : 413-423. |
[19] | Ngueleu AM, Blanchette AK, Maltais M, Moffet H, McFadyen BJ, Bouyer L, Batcho CS. Validity of instrumented insoles for step counting, posture and activity. Sensors. (2019) ; 19: (11). doi: 10.3390/s19112438. |
[20] | Shu L, Hua T, Wang Y, Li Q, Feng D, Tao X. In-shoe plantar pressure measurement and analysis system based on fabric pressure sensing array. IEEE Trans Inf Technol Biomed. (2009) ; 14: : 767-775. |


