
Effects of an intra-ventricular assist device on the stroke volume of failing ventricle: Analysis of a mock circulatory system
Abstract
BACKGROUND:
A novel intra-ventricular assist device (iVAD) was established as a new pulsatile assist device to address various disadvantages, such as bulky configuration and reduced arterial pulsatility, observed in conventional ventricular assist devices.
OBJECTIVE:
Analyzed the native left ventricular stroke volume (SV) after iVAD support in vitro.
METHODS:
The SV of iVAD was examined in a home-designed mock circulatory system (MCS) at different heart rates and drive pressures and the SV of a failure ventricle was examined with iVAD at 75, 90, 120 bpm and 120–180 mmHg drive pressure after iVAD support. Data pertaining to native left ventricular SV before and after iVAD support were compared.
RESULTS:
The native ventricular SV was improved by iVAD when its drive pressure (DP) was slightly greater than that of the mock system. Conversely, the native ventricular SV was decreased when DP was much greater than that (150 mmHg) of MCS. A high DP had a significant effect on SV.
CONCLUSIONS:
The proposed device improved the dysfunctional native left ventricular SV when DP of iVAD was slightly greater than that of MCS. However, iVAD reduced the SV when the drive pressure was greater than that of MCS.
1.Introduction
Left ventricular assist devices (LVADs) are increasingly accepted for patients with failing hearts. These devices can be divided into two main categories: pulsatile flow (PF) LVAD and continuous flow (CF) LVAD. The advantage of PF LVADs is their ability to maintain physiological PF, but these devices have high rates of complications, such as infections and mechanical failure, because of their large size and attachments. Inlet and outlet valves are required to ensure their correct unidirectional flow [1]. Although CF LVADs work by either an axial or a centrifugal mechanism are smaller. However, they usually provide continuous blood flow that differs from the physiological flow in terms of its recued pulsatility. The lack of pulsatility results in a sustained non-physiological pressure at the aortic root, thereby leading to aortic root dilatation and valve fusion; thus, insufficiency, platelet dysfunction, endothelial dysfunction, and gastro-intestinal bleeding occur [2, 3, 4]. Implantation with CF LVADs may contribute to the onset of right heart failure because of the rapid unloading of the left ventricle and hence causes septal shift and right ventricular dilatation. The ability of PF LVADs to unload the left ventricle is higher than that of CF LVADs [3]. Although the effect of non-physiological pulseless blood flow on the circulation and organ perfusion remains debatable, researchers suggested that PF should be preserved [5, 6, 7, 8].
Although traditional pumps have many disadvantages, they can produce physiological flow. Several new pulsatile devices, such as C-Pulse [9, 10], LibraHeart pulsatile LVAD system [11], and rotary piston blood pumps [12, 13], have been designed. Therefore, pulsatile pumps should be further investigated.
In this study, a new pulsatile assist device was developed to overcome the challenges associated with traditional pulsatile pumps and was examined in a mock circulatory system (MCS) in vitro. The special intraventricular co-pulsatile mode of the proposed assist device might affect the SV of the native ventricle. This study aimed to assess the changes in the stroke volume (SV) of the left failure ventricle with the new device support.
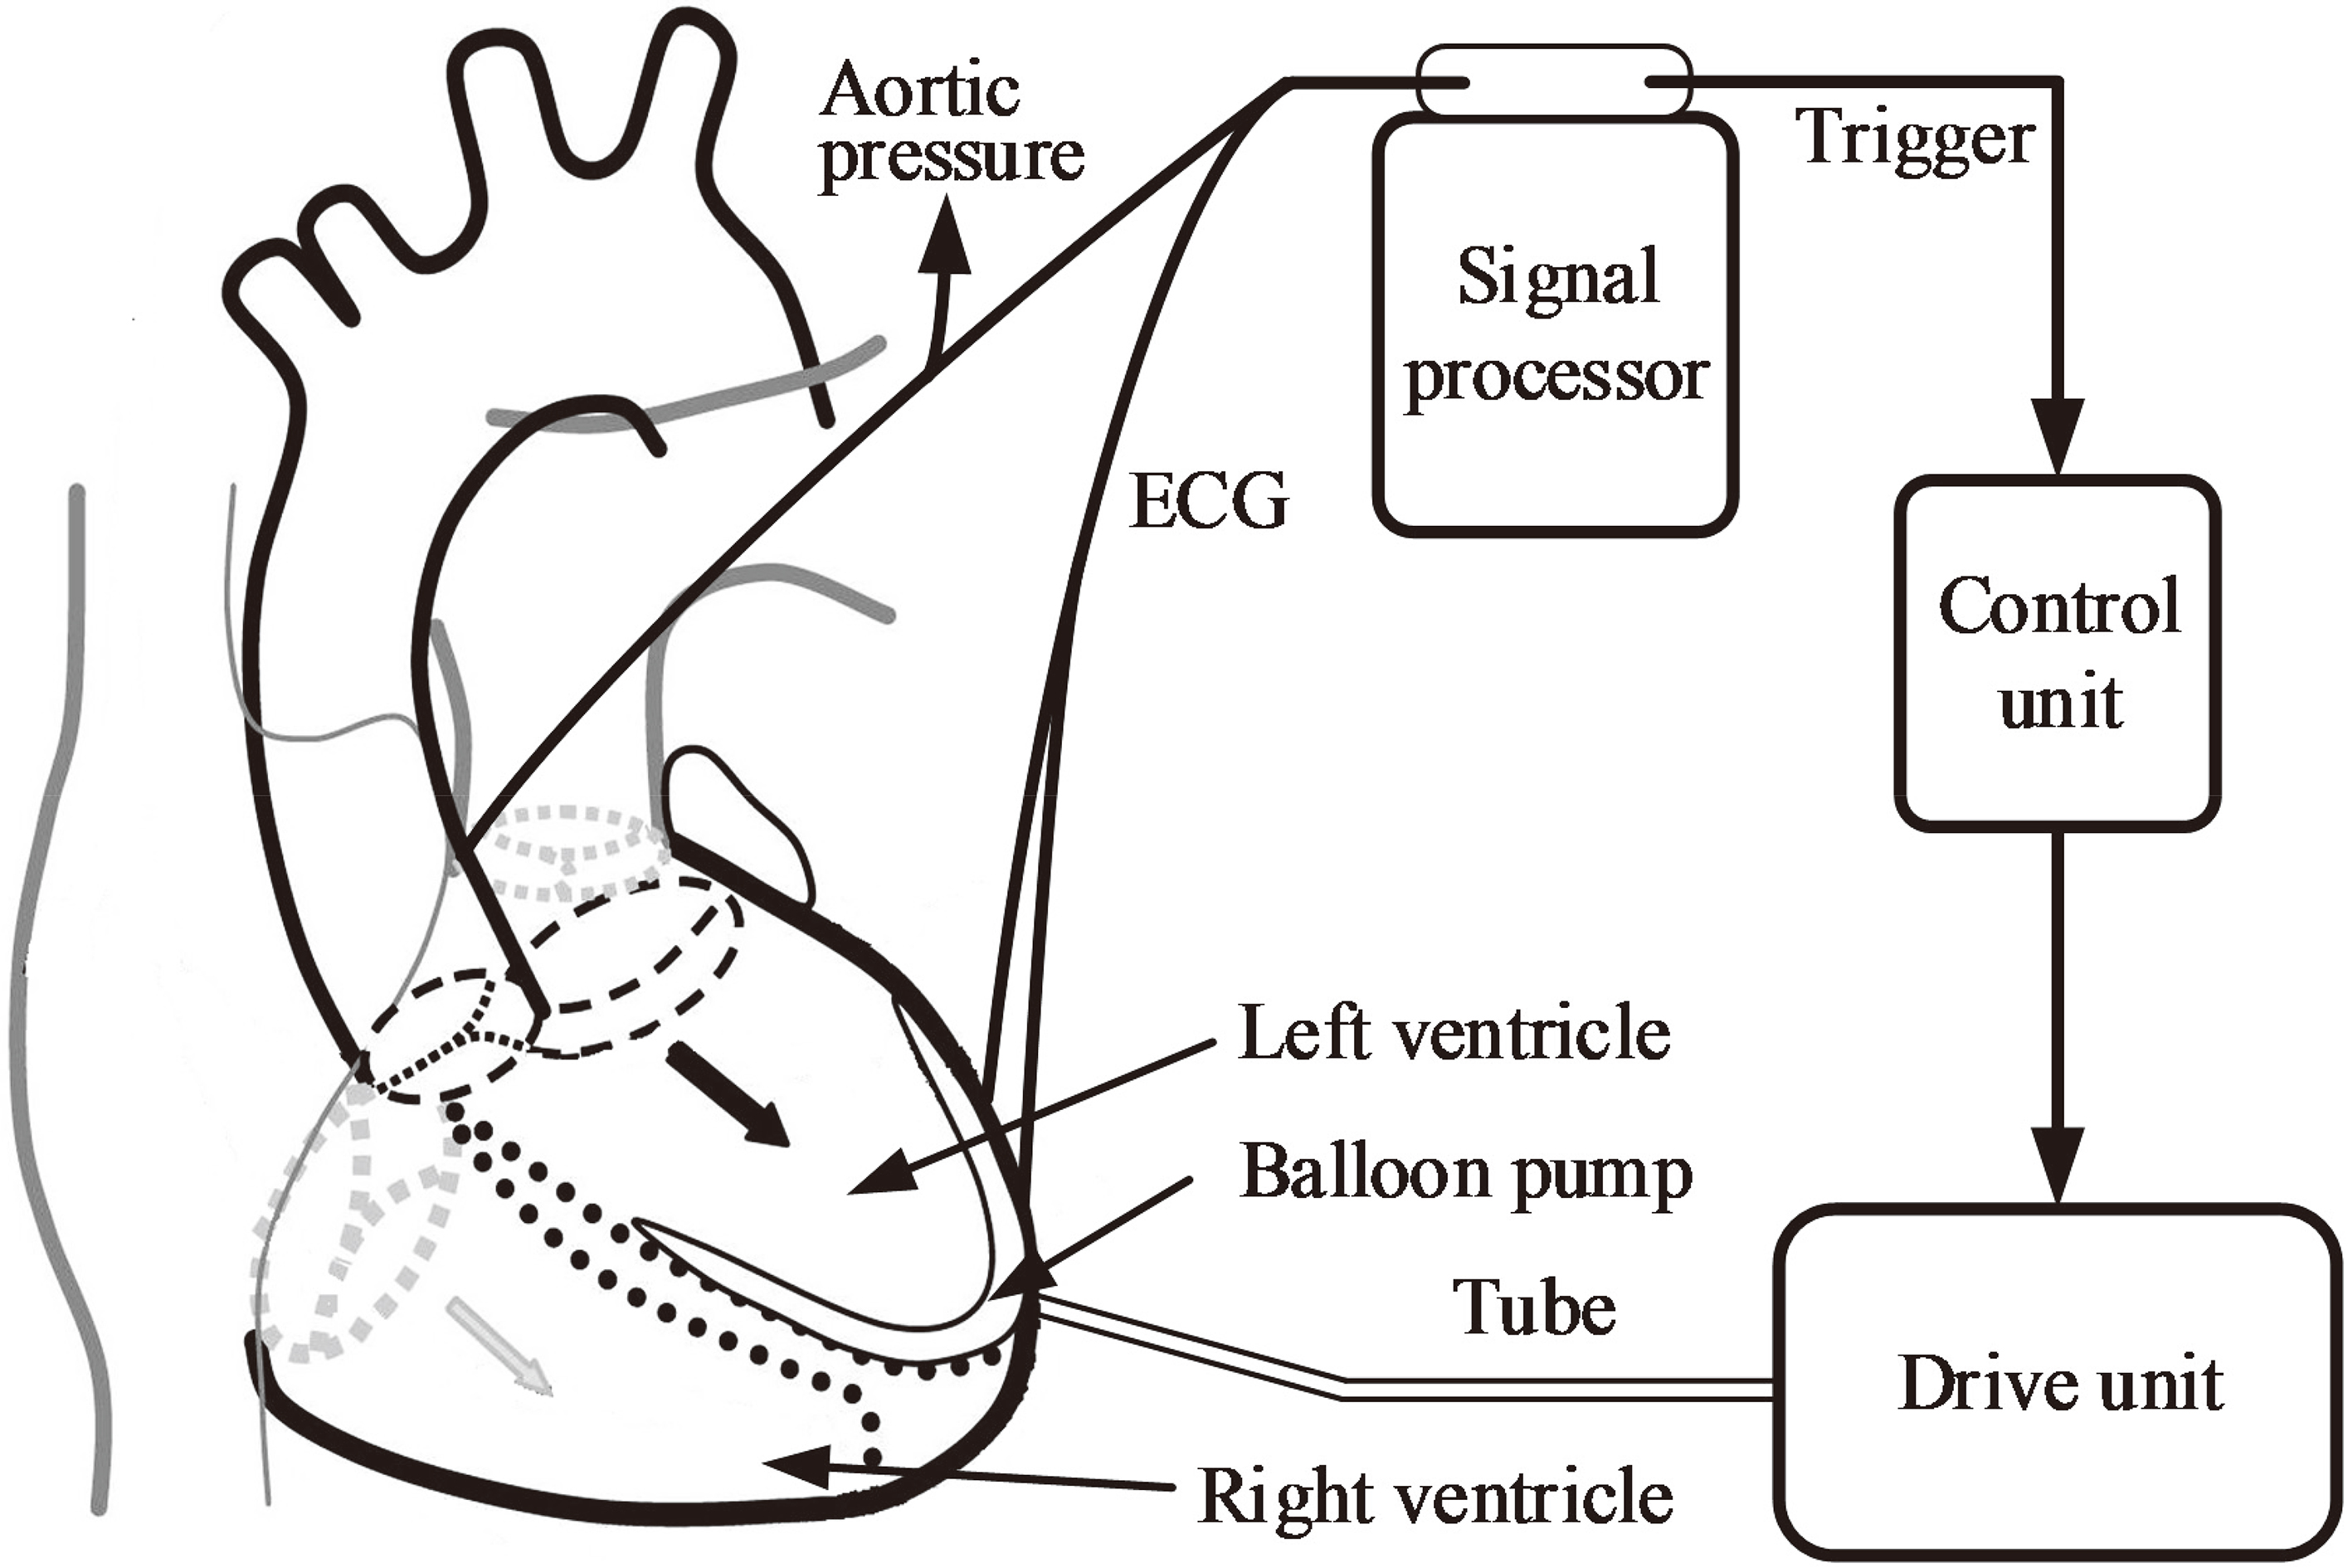
Figure 1.
Schematic of a typical intra-ventricular assist device.
2.Materials and methods
2.1A novel intra-ventricular assist device
An intra-ventricular assist device (iVAD) is a new pulsatile balloon pump driven by a pneumatic drive unit or an electric drive unit and is implanted in the ventricle without the use of mechanical heart valves. Figure 1 shows the principal components of the pump and their functions. The iVAD mainly consists of a balloon pump, a signal processor, a control unit, and a drive unit. The balloon pump is implanted into the left ventricle starting from the apex. In this study, the minimum volume of iVAD is 6.3 cm
Figure 2.
Illustration of the pulsatile rhythm of the left ventricle and the intra-ventricular assist device.
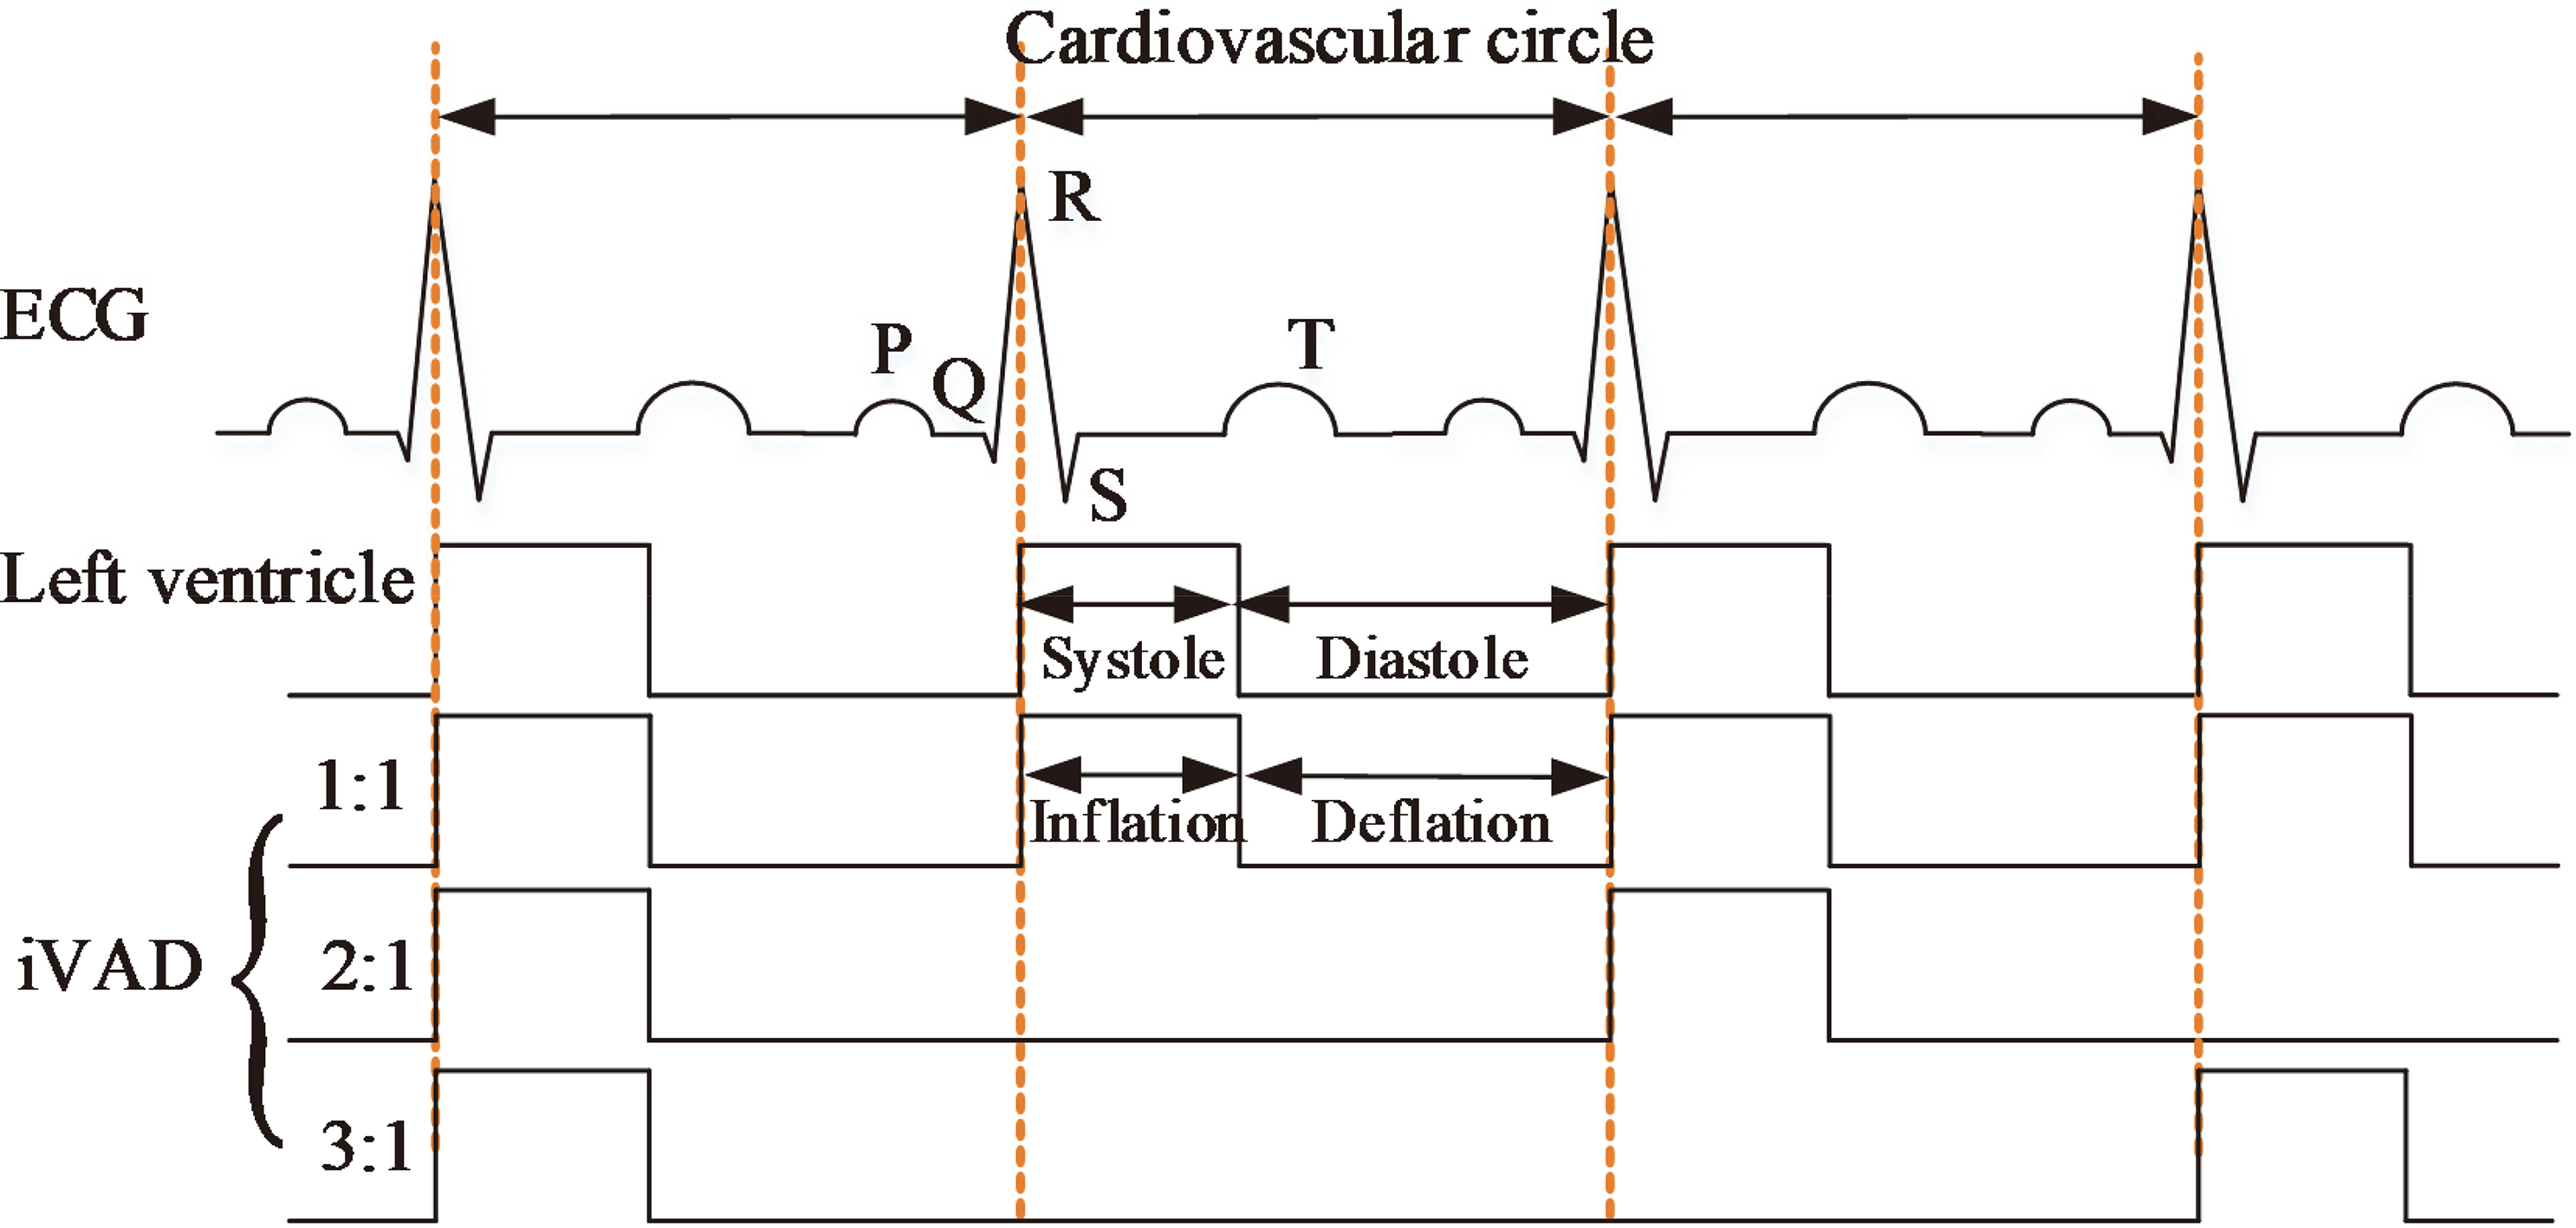
The working approach of an iVAD is relatively similar to that of an IABP [14, 15] and a C-Pulse [16]. Inflated and deflated phases are in their opposite direction. The co-pulsation of iVAD synchronizes with an electrocardiogram (ECG) and a dicrotic notch or phonocardiographs. ECG signals are collected directly from two electrodes which are placed on the surface of the myocardium. The micro-ECG is amplified and filtered by a signal processor. The R wave peaks detected from ECG by a peak detection algorithm are used to trigger pulses, which drives pump inflation via a control unit. Whereas the dicrotic notch peaks collected from the aortic arch trigger iVAD deflation. In this study, the inflation and deflation of the balloon pump were controlled by the electropneumatic regulators (ITV2030-312BL, SMC Pneumatics, Tokyo, Japan) and the vacuum proportional valves (ITV2090-31N2BN5, SMC Pneumatics, Tokyo, Japan), respectively. A selector valve (MHE4-MS1H-3/2G-QS-8-K, Festo, Esslingen, Germany) was employed to switch to inflated phase or deflated phase. The positive and negative drive pressure of the iVAD are adjustable by the voltage of proportional valve in the range of 40–500 mmHg and vacuum pressure 20–100 mmHg. In some patients, the incisure points are not well defined, therefore the phonocardiograph is used to trigger deflation that considers the second heart sound as the time of the aortic valve closure. Figure 2 presents the pulsatile time relation between the left ventricle and iVAD. The drive modes mainly include 1:1, 2:1, and 3:1 (ventricular beats: iVAD beats). The assist mode is adjusted according to the heart rate (HR). For example, the assist mode is set to 3:1 when HR is 120 beats per minute (bpm) under a sufficient blood supply. In this study, ECG was provided by a generator (SKX-2000SUP+, Mingsheng, China). To facilitate the experiment, we defined the systolic period as 0.35 times of the cardiac cycle.
Figure 3.
(a) Schematic of an experimental mock cardiovascular system, (b) Picture of the experimental setup.
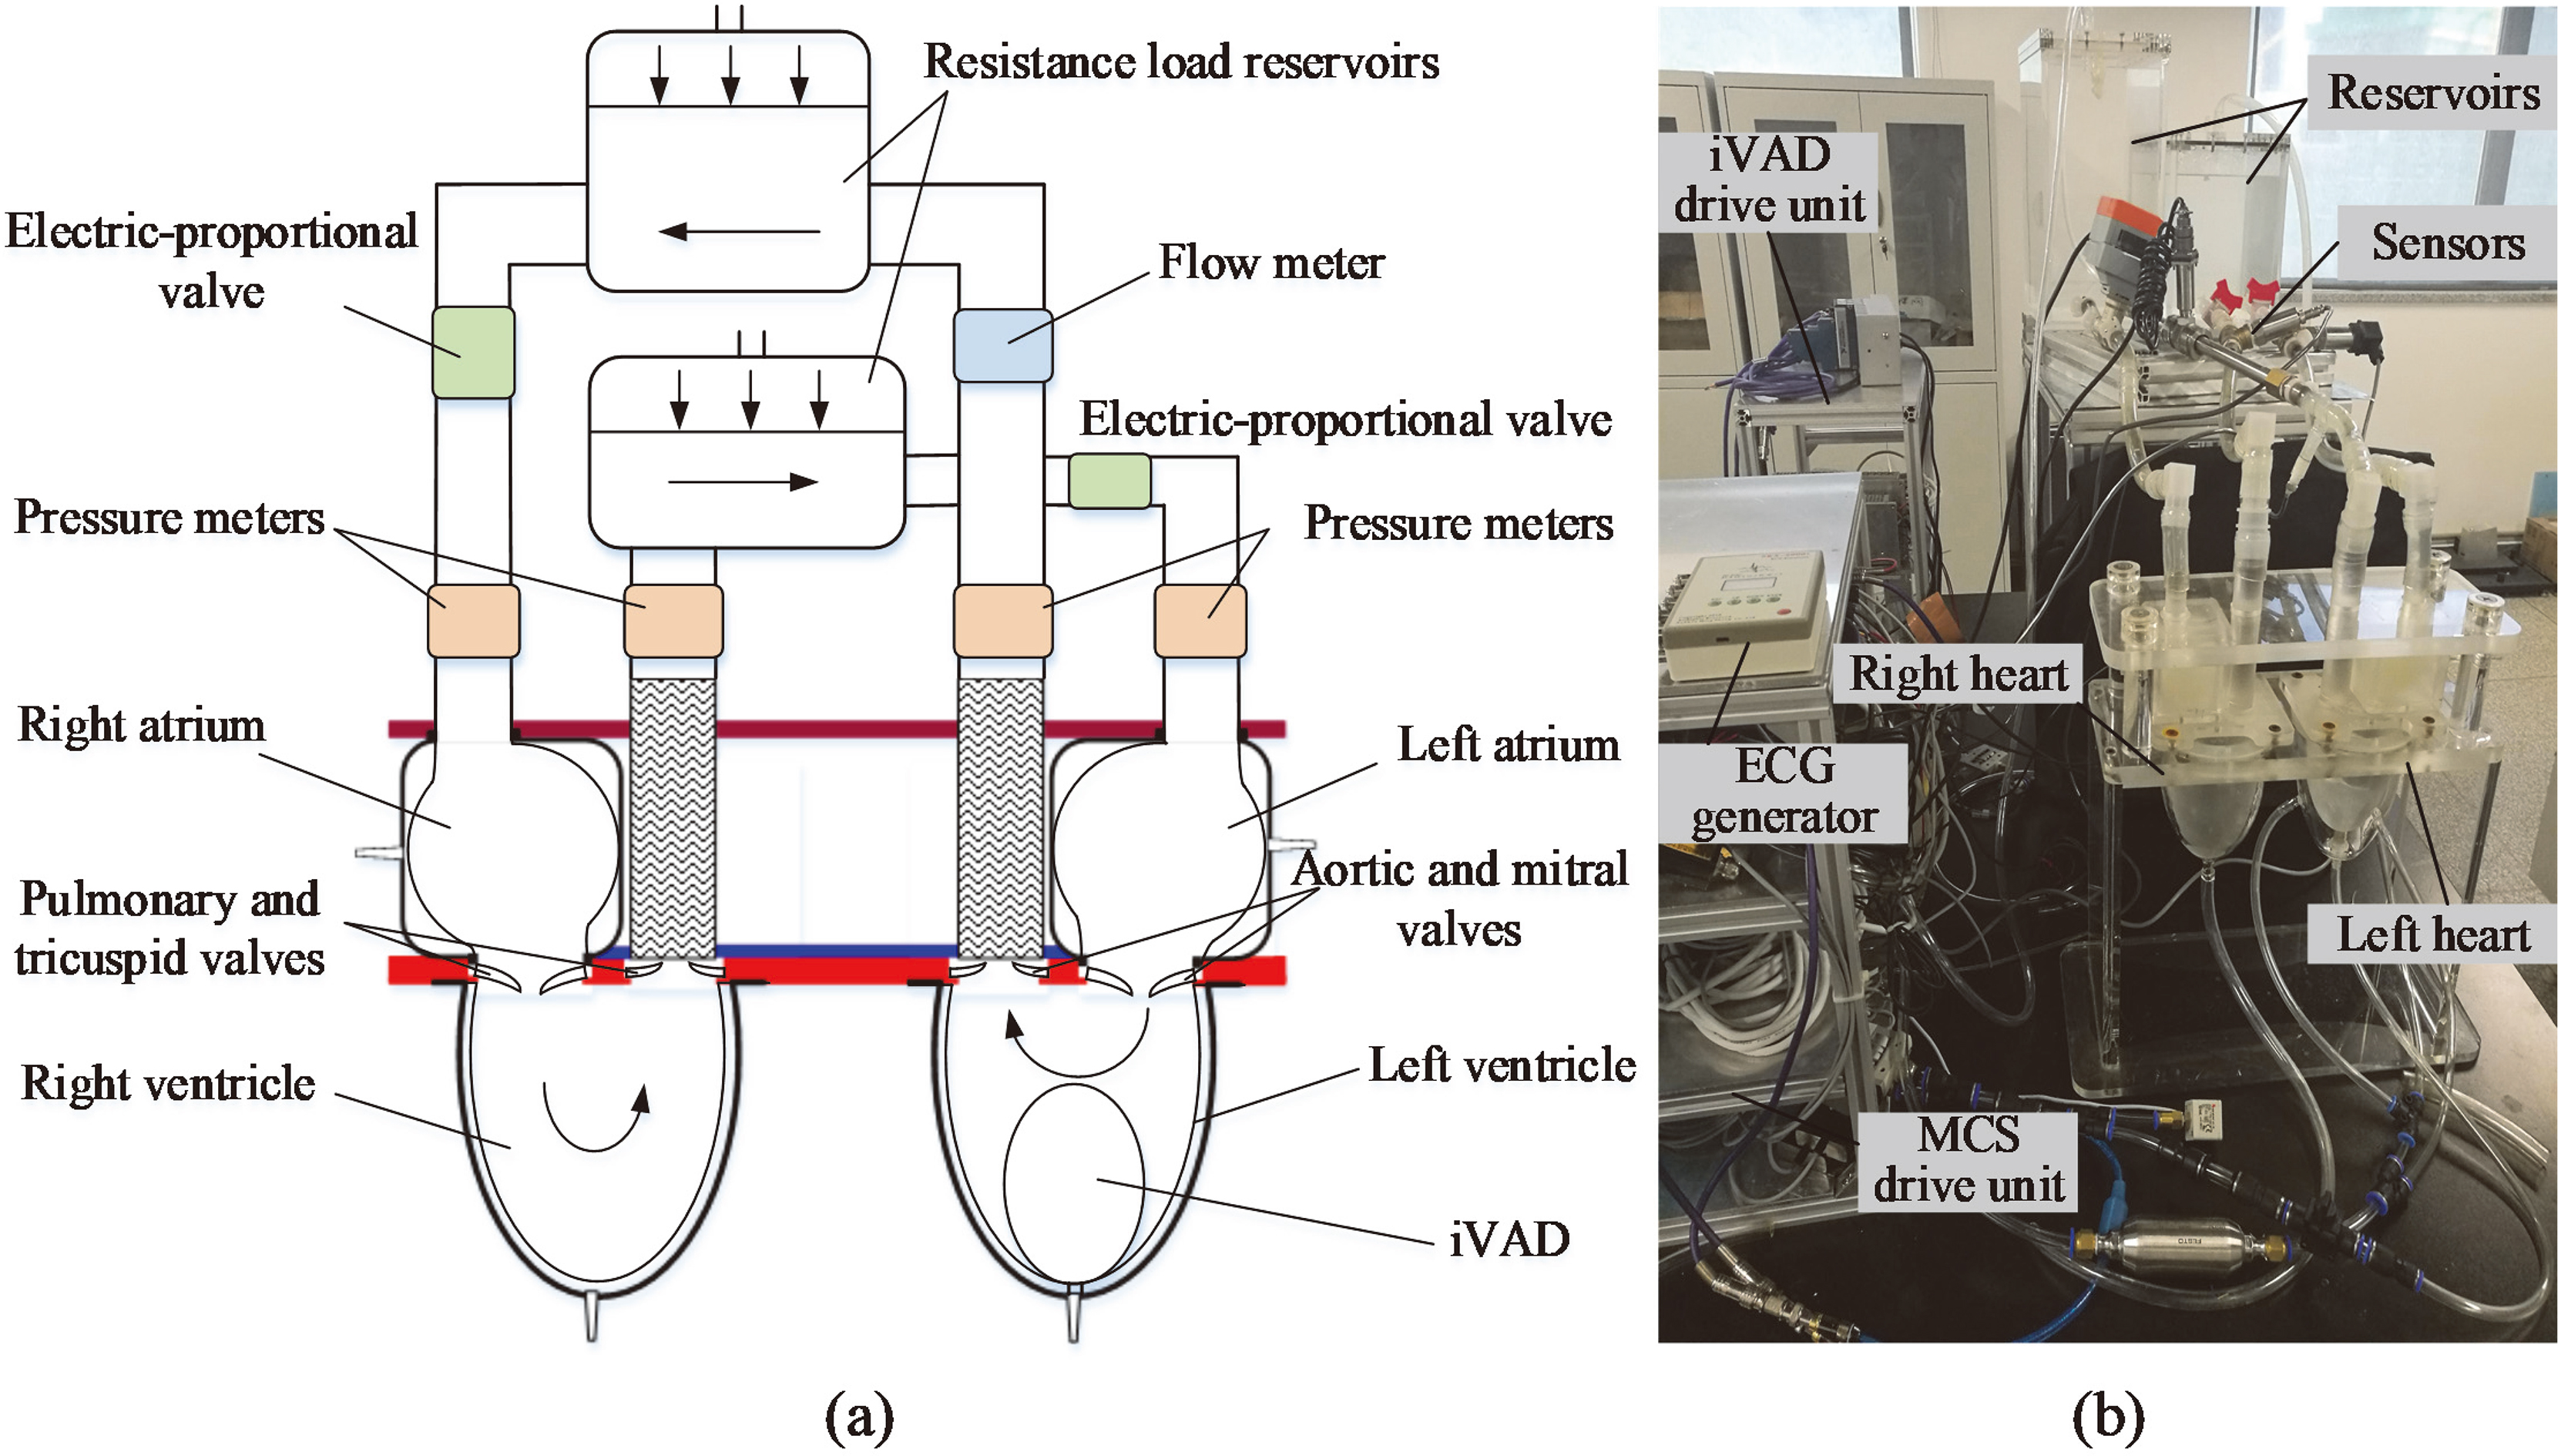
2.2MCS
MCS comprises systemic and pulmonary circulation is designed to examine the performance of iVAD. Figure 3 shows the schematic of MCS. Four flexible PU sacs were employed as left ventricle, right ventricle, left atrium, and right atrium. In the MCS, the volume of ventricular sacs is 180 cm
(1)
Where
The electric-proportional valve was placed next to the resistance chambers to adjust the preload in pulmonary and systemic circulation components. All of the connections between chambers and reservoirs were fabricated with tygon tubing. The flow rate was examined with FD-SS20A (KENYENCE, Japan), whereas pressure was determined by high-frequency dynamic response micro-electro-mechanical system sensors CYY8 (Xian HangDong, China). The whole system was filled with water, which mimicked blood. The control and acquisition of the flowmeter and pressure meter data signals were achieved at 1 kHz with a custom system (National Instruments, Austin, TX, USA). All of the signals were filtered through a second-order Butterworth low-pass filters with 20 Hz cutoff frequency.
2.3Testing
The balloon pump was implanted in the MCS (Fig. 3) without the left ventricular membrane to examine the input and output dynamics of iVAD. The circulatory loop parameters were as follows: the preload and afterload of systemic circulation in the MCS of 15 and 80 mmHg, respectively; HR of 60 bpm; and drive pressure of 120 mmHg. The total volume of the experimental balloon of iVAD was 40 cm
MCS was used to simulate a healthy heart status. HR was set to 75 bpm, the drive pressure of MCS (
3.Results and discussion
The mean SV of iVAD under different conditions is shown in Fig. 4. The mean SV was determined as an average of 20 cardiac cycles in each case. In Fig. 4, SV decreased as HR increased but increased as the of the drive pressure increased (the legend in Fig. 4 represents the drive pressure). SV reached the maximum when HR is 60 bpm, such as 53 ml and 45 ml at 180 and 200 mmHg drive pressure. SV is greater than the volume of the balloon pump (40 cm
Figure 4.
Relation of iVAD stroke volume and heart rate at a drive pressure of 120–200 mmHg and an afterload of 80 mmHg.
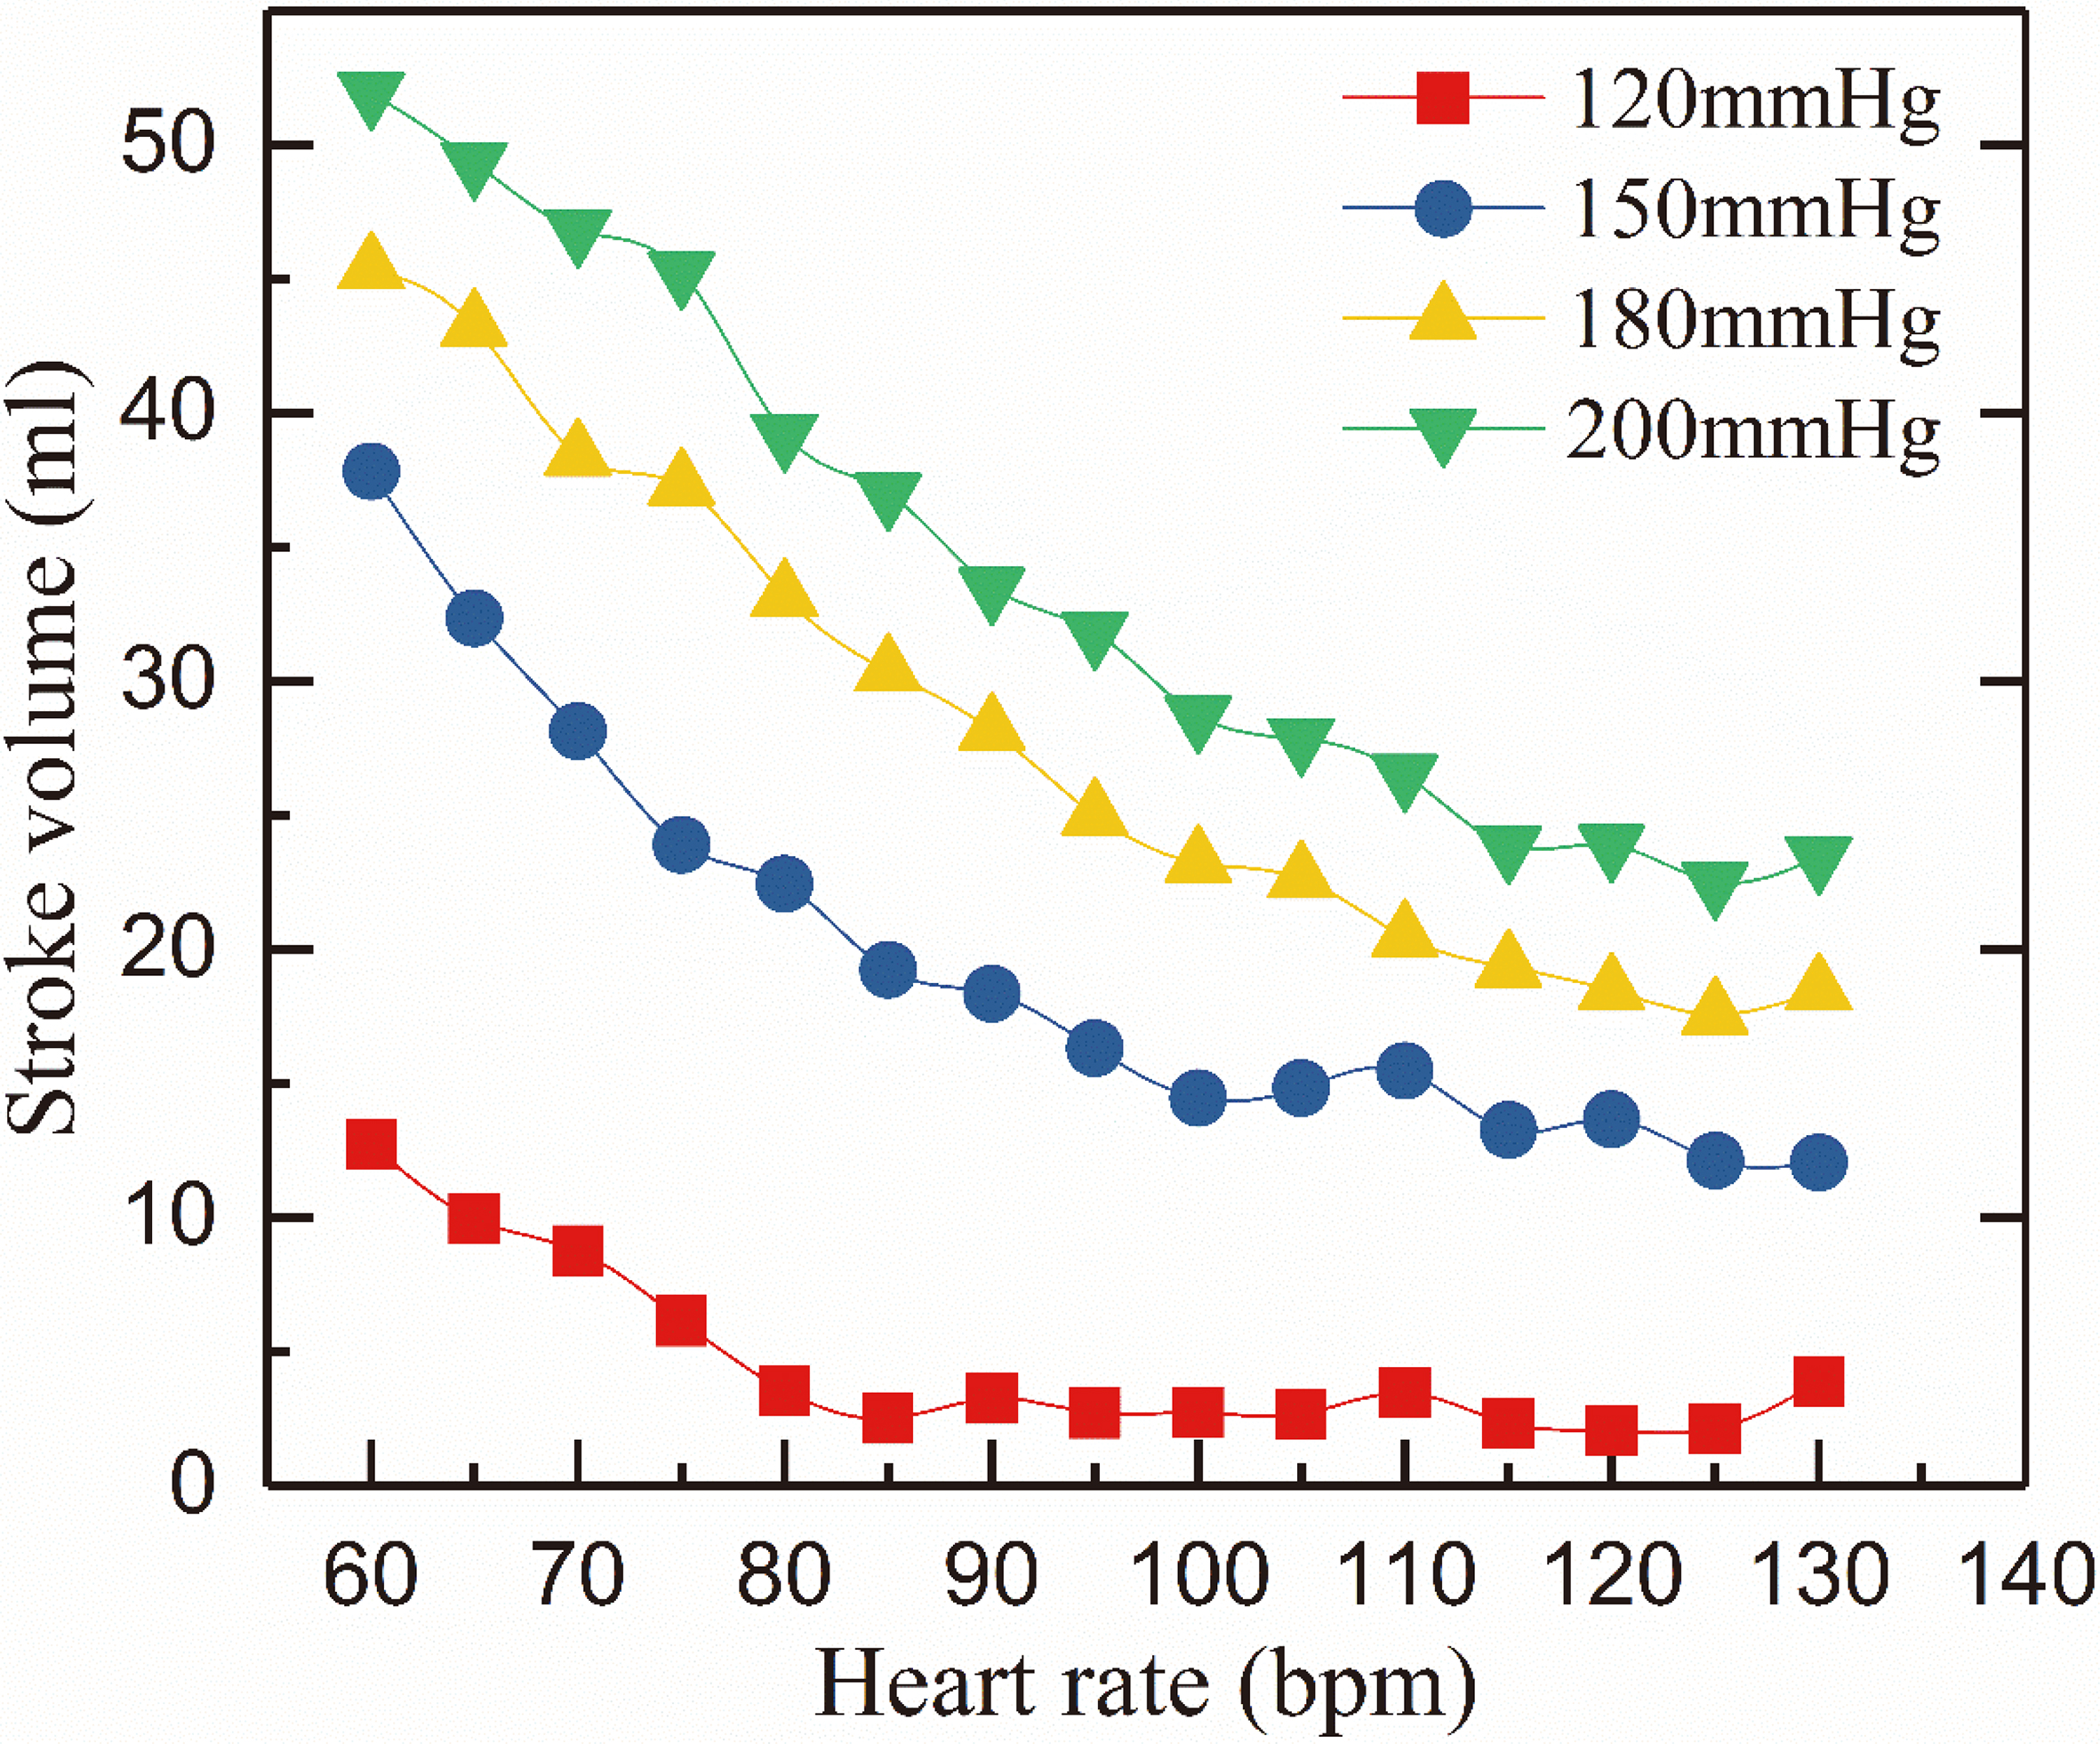
Figure 5.
Comparison of the hemodynamics of failure heart and an iVAD support (ECG: V; Pulse: V; LVP: mmHg; AoP: mmHg; AoF: L/min; PiVAD: mmHg; Pmock: mmHg).
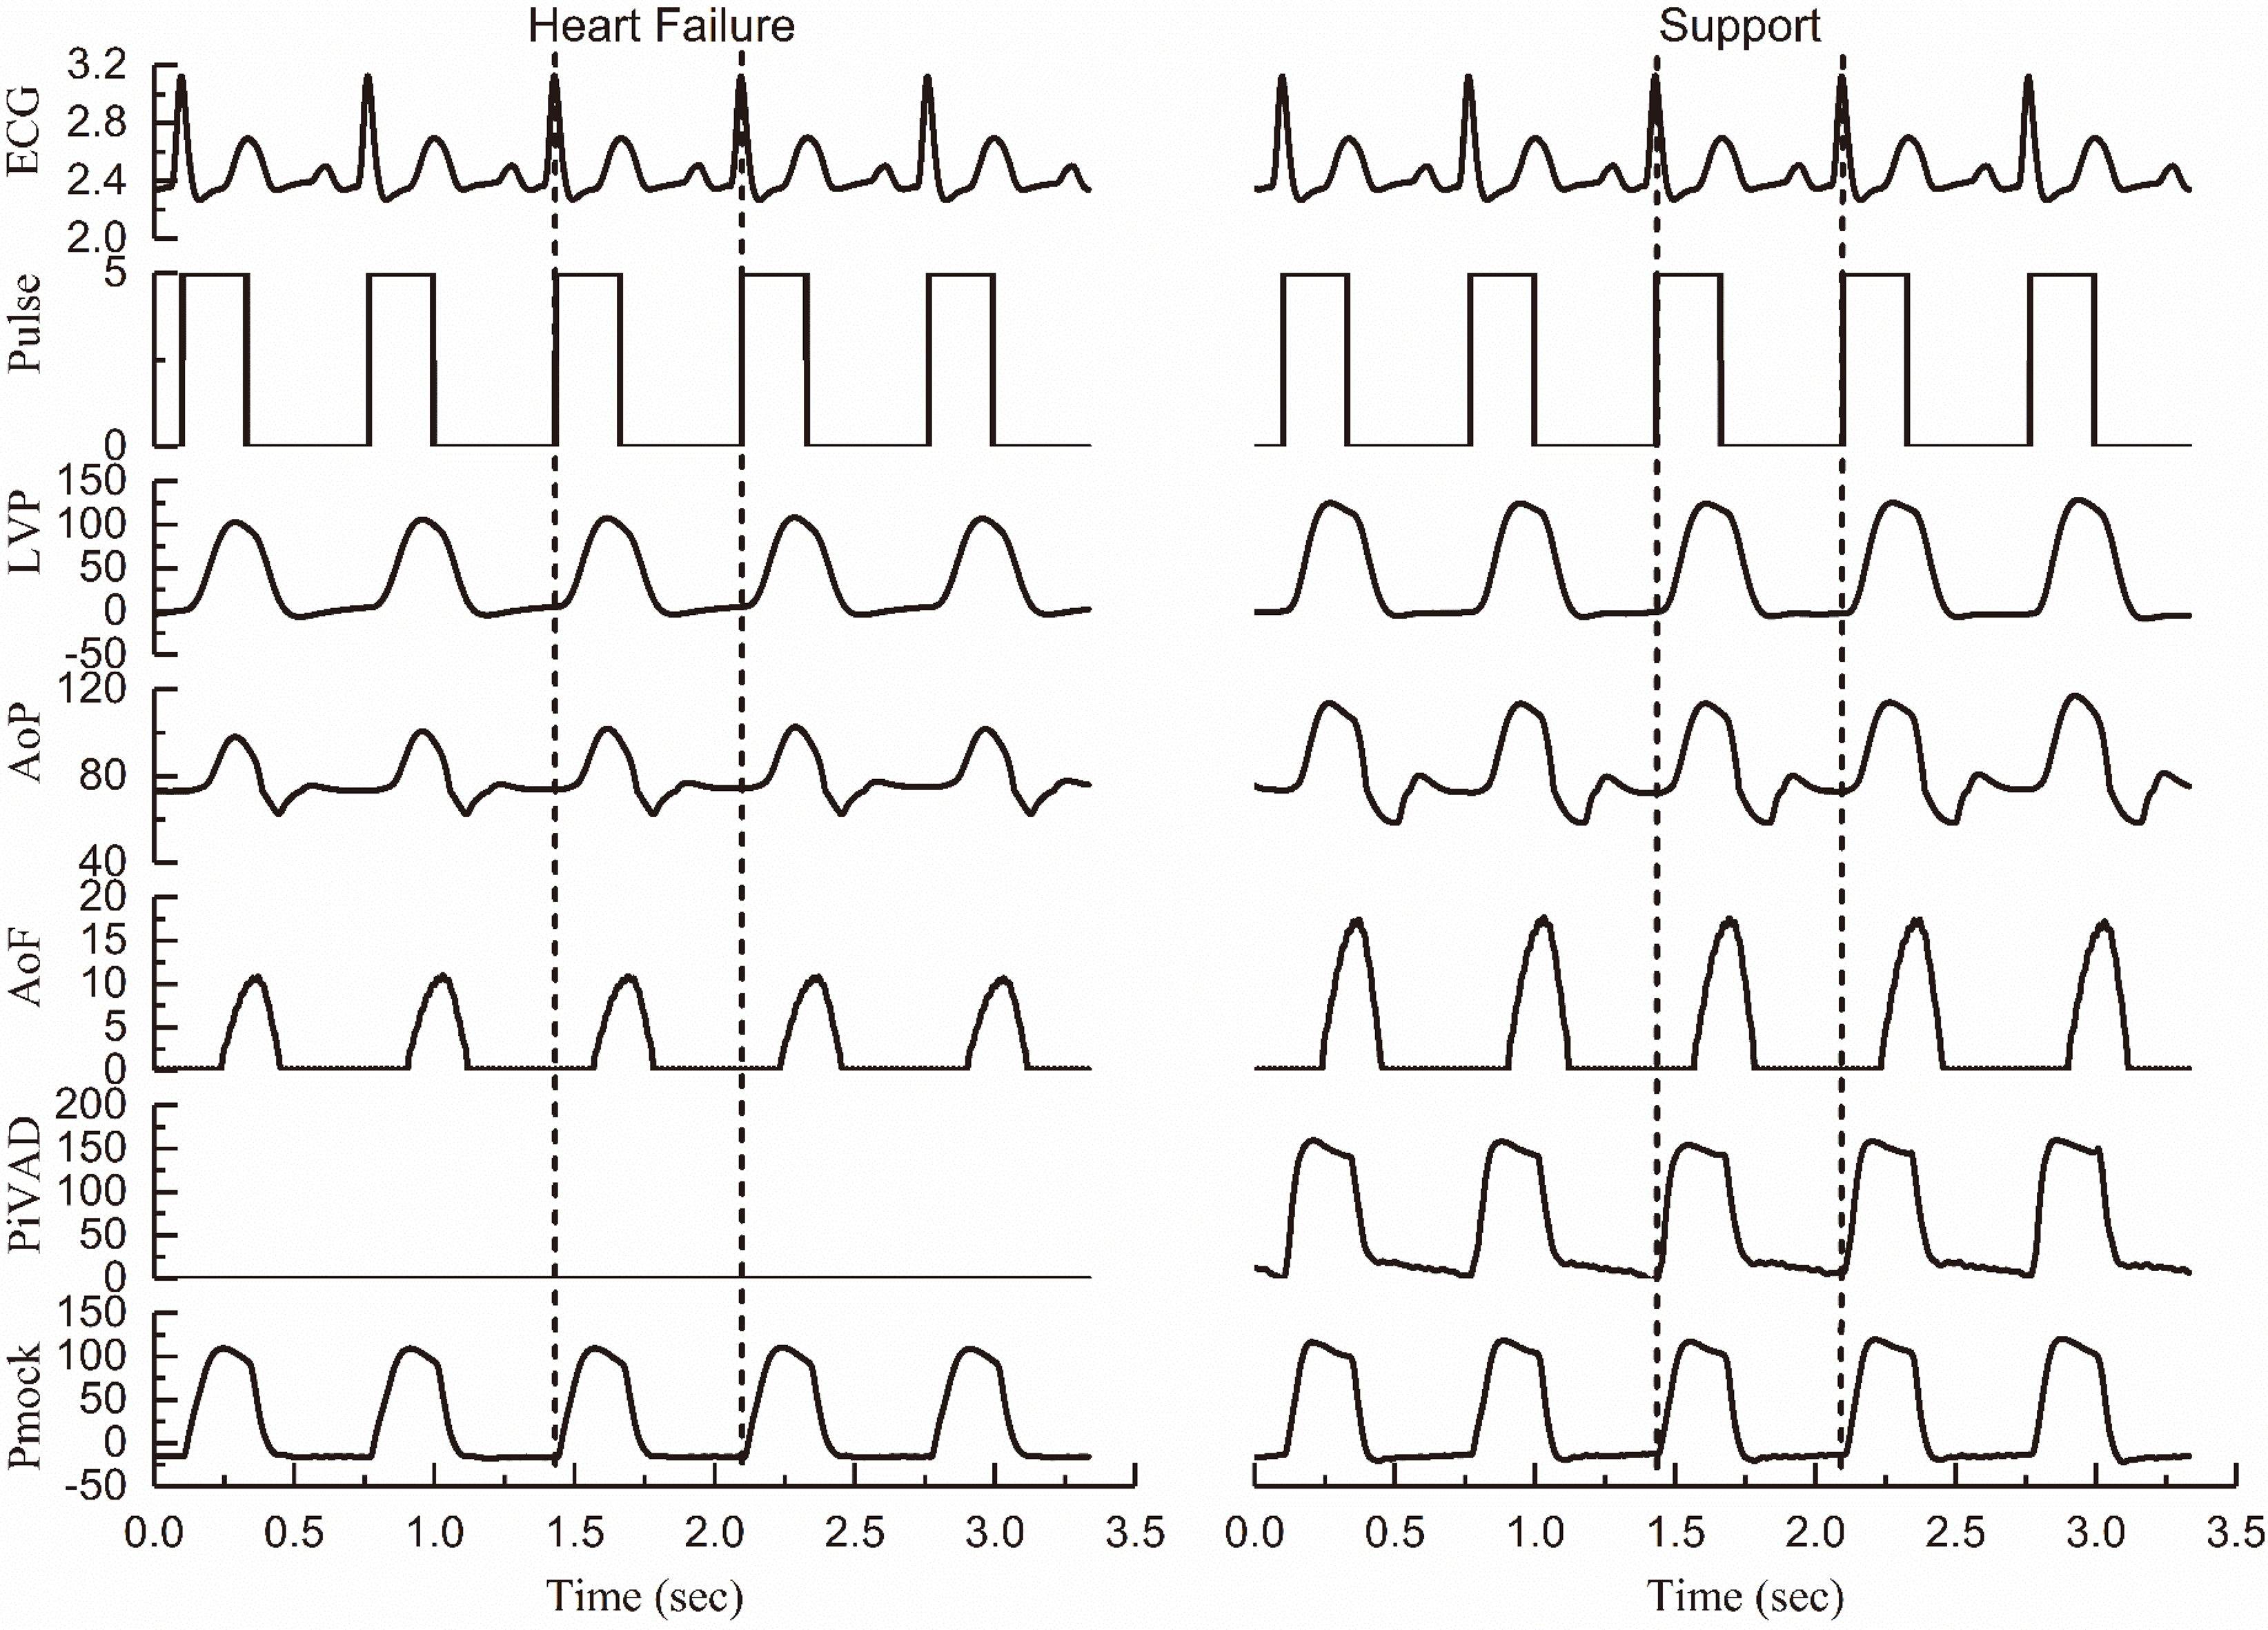
Figure 5 illustrates the hemodynamics of heart failure and iVAD support in MCS including ECG, left ventricular pressure (LVP), aortic pressure (AoP), iVAD drive pressure synchronous drive pulse, aortic flow (AoF), and MCS drive pressure (
Table 1
Hemodynamics of failure heart with iVAD in a mock cardiovascular system
| Parameter | H | HF | Support | ||||||||||
|---|---|---|---|---|---|---|---|---|---|---|---|---|---|
| HR (bpm) | 75 | 75 | 90 | 120 | 75 | 90 | 120 | ||||||
| – | – | – | – | 120 | 150 | 180 | 120 | 150 | 180 | 120 | 150 | 180 | |
| LVSP (mmHg) | 128 | 107 | 106 | 106 | 118 | 139 | 155 | 117 | 142 | 158 | 116 | 140 | 156 |
| SAP (mmHg) | 121 | 103 | 102 | 100 | 114 | 139 | 143 | 112 | 133 | 146 | 111 | 129 | 145 |
| DAP (mmHg) | 84 | 74 | 77 | 74 | 77 | 84 | 87 | 76 | 89 | 92 | 81 | 90 | 93 |
| – | – | – | – | 6.18 | 23.9 | 37.3 | 3.27 | 18.4 | 28.2 | 2.09 | 13.7 | 22.5 | |
| – | – | – | – | 35.1 | 49.4 | 56.1 | 32.2 | 43.9 | 47 | 30.9 | 39.2 | 41.3 | |
| 41.6 | 28.9 | 25.5 | 18.8 | 38.6 | 46.2 | 54.4 | 31.9 | 37.1 | 44 | 23.3 | 27.3 | 34.2 | |
| SV (ml) | – | – | – | – | 32.4 | 22.3 | 17.1 | 28.6 | 18.7 | 15.8 | 21.2 | 13.6 | 11.7 |
| – | – | – | – | 12.2 | 22.8 | 40.8 | 12.3 | 26.7 | 38.0 | 12.8 | 27.7 | 37.8 | |
| Rise or fall | – | – | – | – |
|
|
|
|
|
|
|
|
|
H: healthy heart;
In iVAD support conditions, iVAD improved LVSP, SAP, DAP, and SV. In Table 1,
(2)
(3)
Where
(4)
Where the positive and negative symbols of Eq. (4) represent an increase or a decrease in value. “
In MCS, the left ventricular sac was deflating controlled by a vacuum proportion valve. The vacuum pressure was set to 30 mmHg at different conditions and the preload was constant. Therefore, we assume that the left ventricular volume is the same at the end-diastole. SV is greater than
4.Conclusions
An iVAD implanted in the left ventricle can improve LVSP, SAP, and SV. With this support, hemodynamics reached a healthy level in the MCS. The proposed device improved the dysfunctional native left ventricular SV when the drive pressure of iVAD was slightly greater than that of MCS. However, iVAD reduced the SV of the native ventricle when the drive pressure was greater than the pressure of MCS. A high drive pressure of iVAD corresponds to a remarkable decrease in SV of the native dysfunctional heart.
Conflict of interest
None to report.
References
[1] | Ferrari M, Kruzliak P, Spiliopoulos K. An insight into short- and long-term mechanical circulatory support systems. Clin Res Cardiol. (2015) ; 104: : 95-111. |
[2] | Hiraoka A, Cohen JE, Shudo Y, MacArthur JW, Howard JL, Fairman AS, et al. Evaluation of late aortic insufficiency with continuous flow left ventricular assist device. Eur J Cardio-Thorac. (2015) ; 48: : 400-6. |
[3] | Schumer EM, Ising MS, Slaughter MS. The current state of left ventricular assist devices: challenges facing further development. Expert Rev Cardiovasc Ther. (2015) ; 13: : 1185-93. |
[4] | Wong K, Samaroo G, Ling I, Dembitsky W, Adamson R, del Alamo JC, et al. Intraventricular flow patterns and stasis in the LVAD-assisted heart. J Biomech. (2014) ; 47: : 1485-94. |
[5] | Bozkurt S, van Tuijl S, Schampaert S, van de Vosse FN, Rutten MC. Arterial pulsatility improvement in a feedback-controlled continuous flow left ventricular assist device: an ex-vivo experimental study. Med Eng Phys. (2014) ; 36: : 1288-95. |
[6] | O’Neil MP, Fleming JC, Badhwar A, Guo LRR. Pulsatile Versus Nonpulsatile Flow During Cardiopulmonary Bypass: Microcirculatory and Systemic Effects. Ann Thorac Surg. (2012) ; 94: : 2046-53. |
[7] | Wang S, Izer JM, Clark JB, Patel S, Pauliks L, Kunselman AR, et al. In Vivo Hemodynamic Performance Evaluation of Novel Electrocardiogram-Synchronized Pulsatile and Nonpulsatile Extracorporeal Life Support Systems in an Adult Swine Model. Artif Organs. (2015) ; 39: : E90-E101. |
[8] | Alkan T, Akcevin A, Undar A, Turkoglu H, Paker T, Aytac A. Effects of pulsatile and nonpulsatile perfusion on vital organ recovery in pediatric heart surgery: a pilot clinical study. Asaio J. (2006) ; 52: : 530-5. |
[9] | Rame JE, Georgakopoulos D, Pomfret D, Atluri P, Wiegn P, Segers P, et al. Arterial and Cardiac Hemodynamics in Advanced HF Patients Implanted With the C-Pulse Counterpulsation Device: Implications for Myocardial Recovery. Circulation. (2015) ; 132. |
[10] | Zeriouh M, Sabashnikov A, Bowles CT, Weymann A, Ghodsizad A, Mohite PN, et al. Full-Support LVAD Implantation in a C-Pulse Heart Assist System Recipient with Deteriorating Chronic Heart Failure: Is It Feasible and Safe? Asaio J. (2016) ; 62: : E55-E7. |
[11] | Choi SW, Nam KW, Lim KM, Shim EB, Yong SW, Woo HM, et al. Effect of counter-pulsation control of a pulsatile left ventricular assist device on working load variations of the native heart. Biomedical Engineering Online. (2014) ; 13: : 1-11. |
[12] | Wappenschmidt J, Autschbach R, Steinseifer U, Schmitz-Rode T, Margreiter R, Klima G, et al. Rotary piston blood pumps: past developments and future potential of a unique pump type. Expert Rev Med Devic. (2016) ; 13: : 759-71. |
[13] | Wappenschmidt J, Sonntag SJ, Buesen M, Gross-Hardt S, Kaufmann T, Schmitz-Rode T, et al. Fluid Dynamics in Rotary Piston Blood Pumps. Ann Biomed Eng. (2017) ; 45: : 554-66. |
[14] | Ferrari G, Khir AW, Fresiello L, Di Molfetta A, Kozarski M. Hybrid Model Analysis of Intra-Aortic Balloon Pump Performance as a Function of Ventricular and Circulatory Parameters. Artif Organs. (2011) ; 35: : 902-11. |
[15] | Khir AW, Bruti G. Intra-aortic balloon shape change: effects on volume displacement during inflation and deflation. Artif Organs. (2013) ; 37: : E88-95. |
[16] | Slaughter MS, Cecere R, Sun B, Huprikar S, Hotz H. C-Pulse (R) System Extra-Aortic Counterpulsation for Heart Failure: Driveline Infections and Management. J Heart Lung Transpl. (2015) ; 34: : S224-S. |
[17] | Westerhof N, Lankhaar JW, Westerhof BE. The arterial Windkessel. Med Biol Eng Comput. (2009) ; 47: : 131-41. |
[18] | Bowles CT, Nishimura K, Shah SS, Cumming DVE, Pepper JR, Yacoub MH, et al. Development of Mock Circulation Models for the Assessment of Counterpulsation Systems. Cardiovasc Res. (1991) ; 25: : 901-8. |


