
The impact on human visual performance when viewing 2-D and 3-D movies
Abstract
BACKGROUND AND OBJECTIVE:
To examine the human visual performance (wavefront aberration) and subjective questionnaire (SQ) of visual fatigue when viewing 2-D and 3-D movies.
METHODS:
Thirty healthy adults observed 2-D and 3-D movies on the same television from a 3m distances during 2D, 3D-A (with better 3D glasses), and 3D-B (with poorer 3D glasses) viewing conditions. Visual quality index, including modulation transfer function index (MTFI), higher order aberration root mean square (RMS), vertical coma (VC), horizontal coma (HC) and spherical aberration (SA), were assessed before and after each viewing condition. One-way repeated measures ANOVA was performed to assess the changes of each test variable before and after movie viewing.
RESULTS:
Participants watching movies with 3D-B conditions experienced higher change of MTFI, RMS, VC and HC but smaller SQ, compared with 2D and 3D-A (
CONCLUSIONS:
While prolonged viewing 2-D and 3-D movies would lead to poorer visual performance, 3-D glasses with better quality can play the major role in reducing visual ability for users. The change of human eye wavefront aberration might be useful for the evaluation of visual fatigue in the future.
1.Introduction
Television (TV) is one of the most influential media for popular entertainment. As rapid development of high quality of TV content, people, particularly for children, spend more and more time on TV [1]. Recent research suggested that viewing of three-dimensional (3-D) movies is rapidly increasing for better quality of life and would be of higher prevalence, compared with the traditional two-dimensional (2-D) TV and movies [2]. However, it has been concerned that prolonged viewing 3-D TV would be the risk factor of damaging the human visual performance [3]. The authors argued that visual information provided by a 3-D stereoscopic TV introduced the disparity between the overlapped images that allow objects to be located perceptually in front of or behind screen (3-D visual effect) [3]. This may affect the regular visual processing when using in the real world. Therefore, it is important to evaluate the associated effect between 2-D and 3-D displays.
Previous studies suggested that the visual fatigue would alter the regulation of the human eye accommodation response (AC) [4]. Another study developed a questionnaire which can effectively classify the 3D motion images in accordance to subjective visual fatigue using five perception variables: (1) Eye strain, (2) general discomfort, (3) nausea, (4) Focusing difficulty and (5) headache, which were effective for classifying 3D motion images [5]. Ntuen et al. [6] examined the effect of viewing field and illumination on visual performance between 2-D and 3-D autostereoscopic displays. They found higher visual fatigue was complained when viewing 3-D compared with the 2-D counterpart. Additionally, Mun et al. [7] identified 3-D images would be of higher cognitive fatigue, as evident by higher steady-state visually evoked potential (SSVEP) and event-related potential (ERP). Furthermore, prolonged viewing 3-D TV has been suggested to be associated with dizzy, nausea, and visual fatigue [8, 9, 10]. However, most Electroencephalogram (EEG) studies on visual health have required sophisticated laboratory equipment, long data acquisition time, high signal artifact and induced discomfort. Therefore, it is important to develop reliable and accurate visual health and fatigue assessment protocols for 3D displays and related content.
Waveform aberration is the optical imperfections of the eye that prevent light from focus perfectly on the retina, resulting in defects in the visual image. Measuring the orthogonal Zernike polynomial expansion (wavefront technology), which describe eye pupil area optical aberration [11, 12]. In addition, high-order aberration changes are vital for eye visual quality [13]. Furthermore, modulation transfer function (MTF) that is determined by the wavefront aberration can effectively reflect the overall response of space image of human eye [14]. Therefore, the purpose of this study was to evaluate the change of wavefront aberration and subjective perception before and after viewing 2-D and 3-D movies. Additionally, this study was to find the influence of visual performance by wearing different 3D glasses. This information would provide insights of the changes of human visual performance associated with 3-D movies.
2.Materials and methods
2.1Participants
Thirty healthy adults (15 males and 15 females, mean age: 31.4
Table 1
Manufacturing performance of the tested 3-D glasses
| 3D-A | 3D-B | National standard range | |||
|---|---|---|---|---|---|
| Measured value | Evaluation | Measured value | Evaluation | ||
| Polarizing efficiency | 99.9% | Passed | 98.8% | Failed | |
| Phase difference (nm) | 125–127 | Passed | 109–112 | Failed |
|
| Joint angle | 45.6 | Passed | 46.1 | Qualified | |
Note: The national standard of 3D-A pasted standard requirement was adopted from QB/T 4735-2014 Polarized 3D glasses (in Chinese) [16].
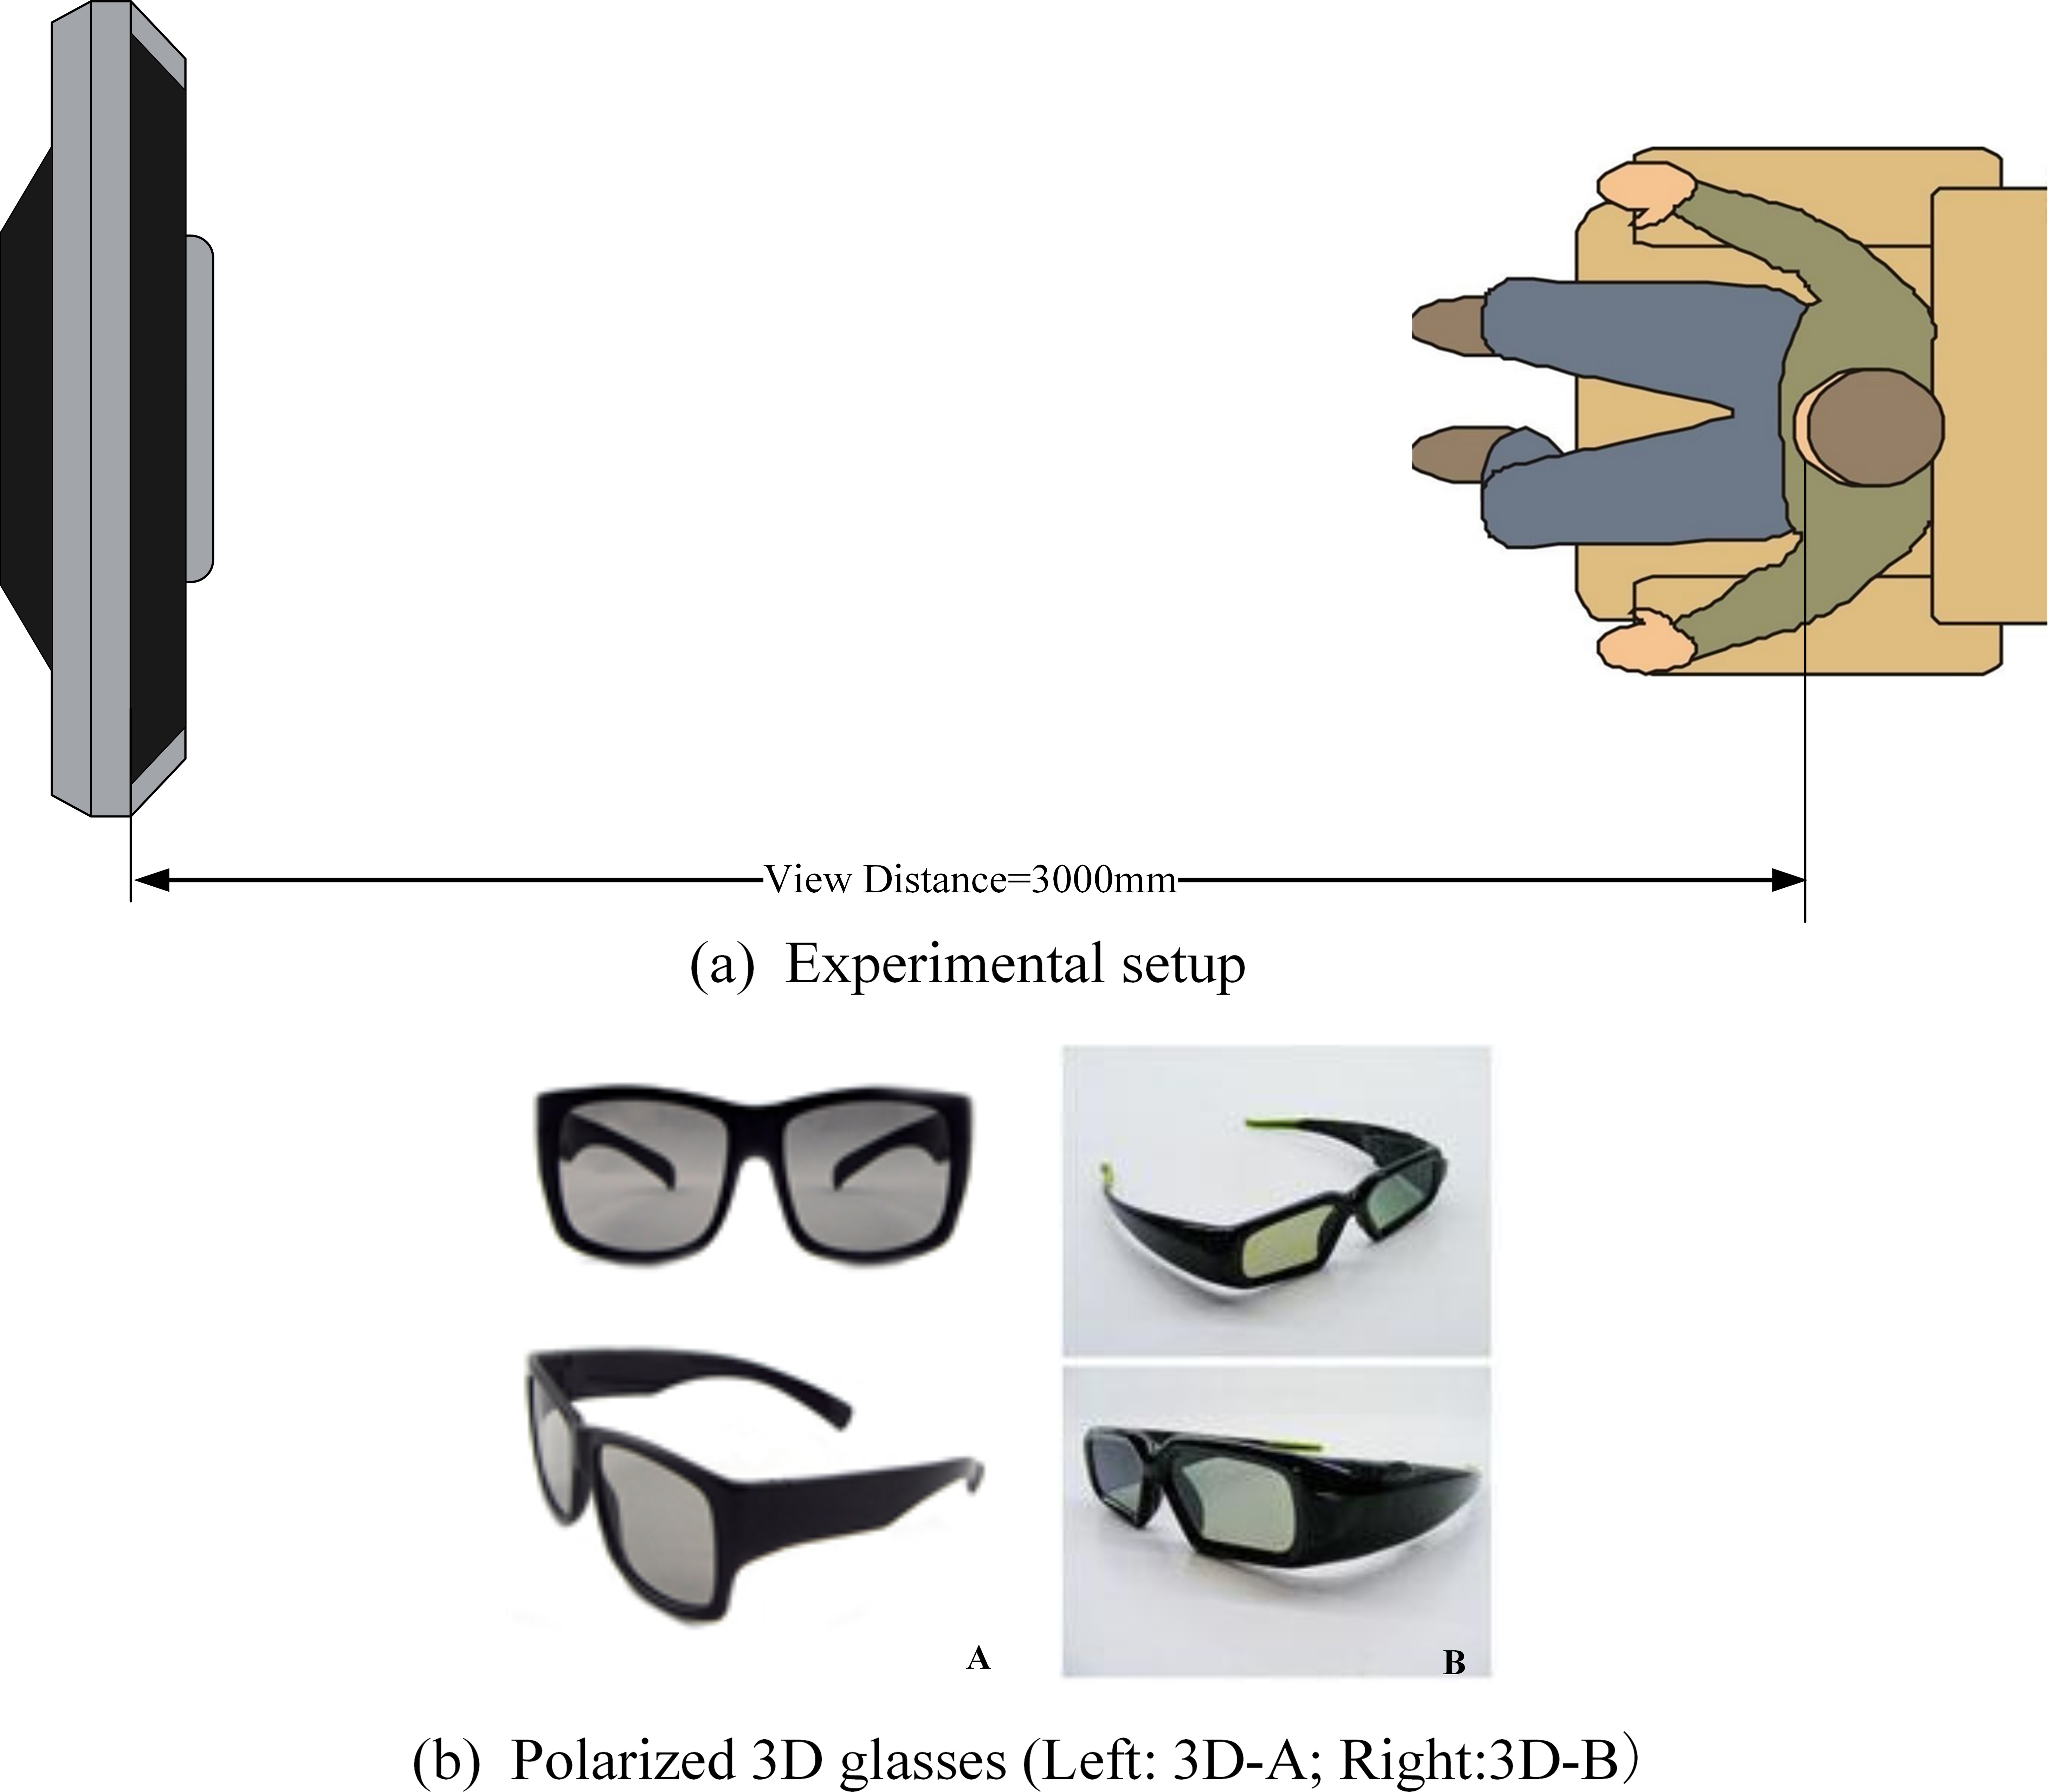
Figure 1.
a) Experimental setup and b) Polarized 3D glasses (left: 3D-A; right: 3D-B).
2.2Experimental procedure
The participants observed the identical movies at the constant distance of 3 meter in one 2-D and two 3-D viewing sessions over the three consecutive weekends (Fig. 1a). During the 2-D viewing session (2D), participants watched the movies without glasses. During the 3-D viewing sessions (3D-A and 3D-B), participants watched the movies when wearing two different types of 3-D polarized glasses (Fig. 1b). The manufacturing performance of 3D-A (P3D-1, PROSUN, China) and 3D-B (P3D-2, PROSUN, China) are provided in Table 1. The same movie “As The Light Goes Out” (Emperor Entertainment Group Limited, Mandarin, 2014) was presented in all viewing conditions (2D, 3D-A and 3D-B). The participants were informed to focus on the movie only during each viewing session. The 2-D/3-D movies were displayed on a 42 inch LED full HD television (LG 3D TV type 42LW5500-CA, LG Electronics Inc., Korea), with a resolution ratio of 1920
Wavefront aberrations of participants were measured with Nidek OPD-Scan (Nidek, Gamagori, Japan) aberrometer before and after each of the viewing conditions (2D, 3D-A, and 3D-B). Additionally, the participants provided their perception of eye fatigue level at the end of each viewing condition (Table 2).
Table 2
Eye fatigue scales (subjective questionnaire, SQ)
| Level | Fatigue level | Symptom |
|---|---|---|
| 0 | No fatigue | Without obvious characteristics |
| 1 | Mild fatigue | Mild eyestain and gritty |
| 2 | Less moderate fatigue | Less moderate eyestrain and dizziness |
| 3 | Moderate fatigue | Moderate eyestrain, stinging, dizzy and headache |
| 4 | Less severe fatigue | Less severe eyestrain, gritty, dizziness and nausea |
| 5 | Severe fatigue | Severe eyestrain, headache, nausea and vomiting |
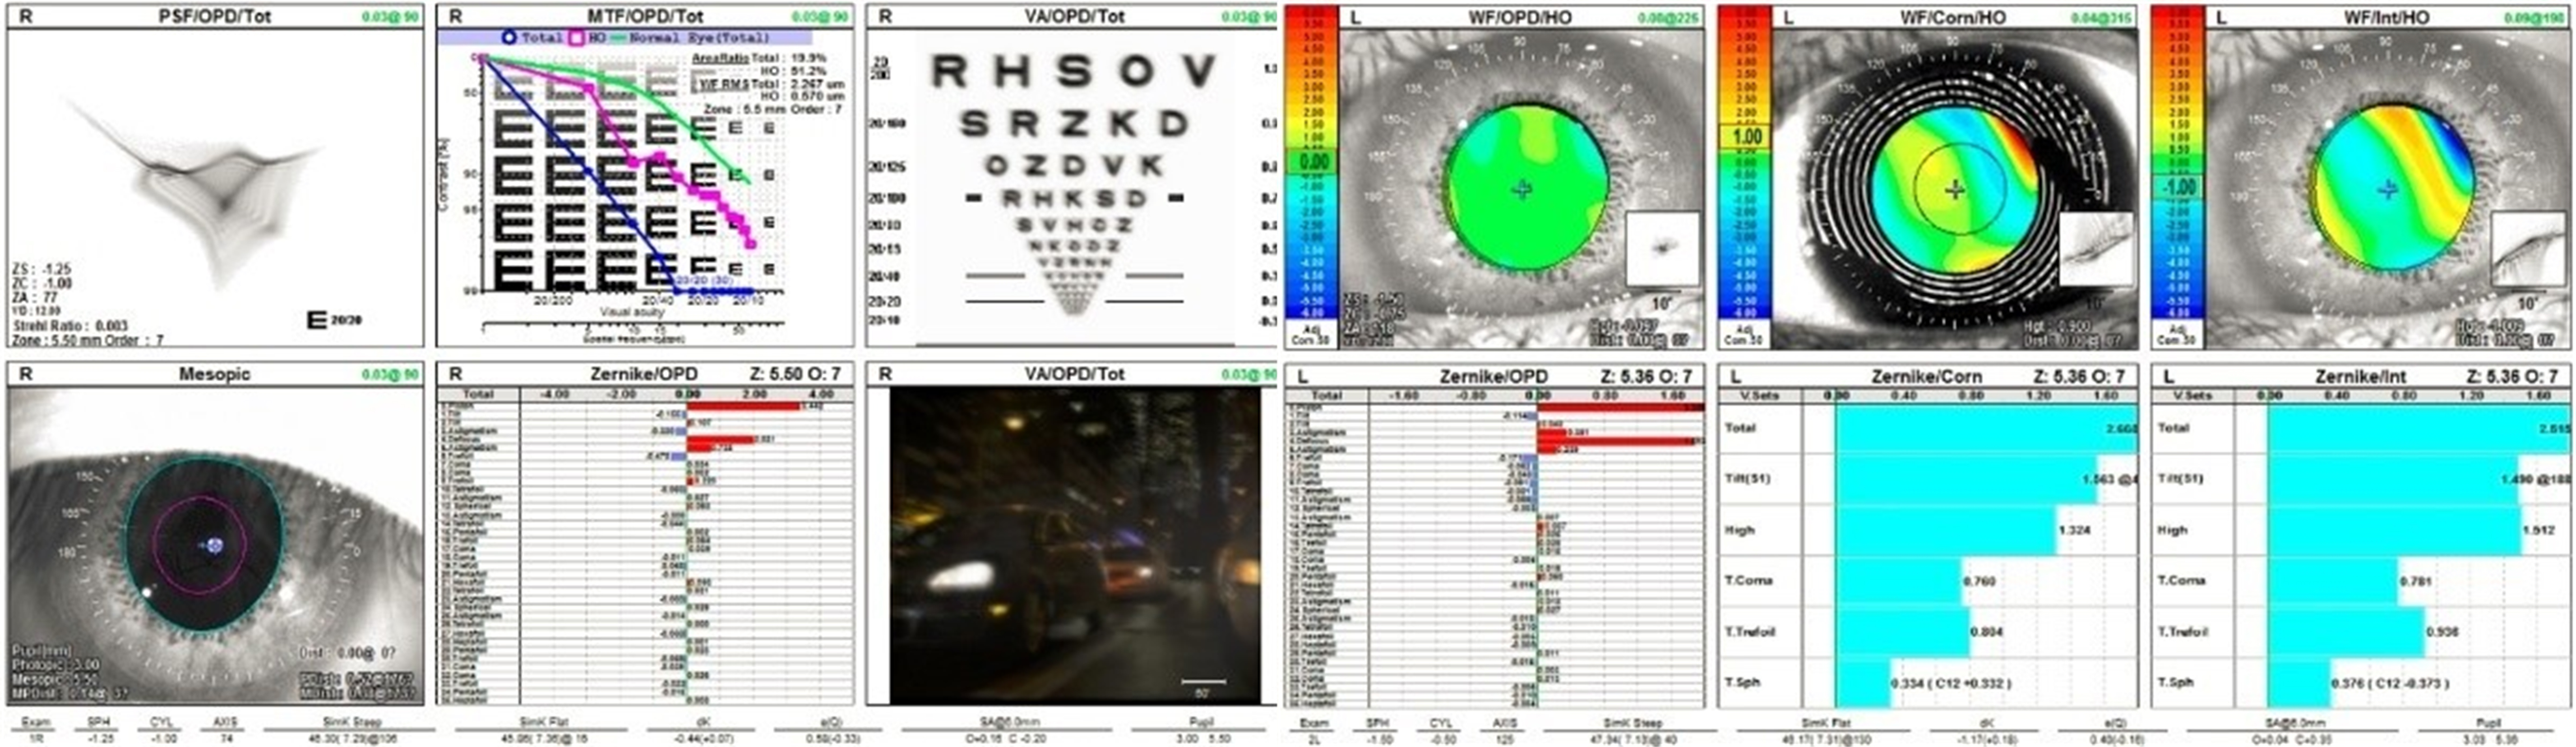
Figure 2.
The screenshots of visual quality performance.
2.3Data processing
The screenshots of visual performance are shown in Fig. 2. Modulation Transfer Function (MTF), higher order Root-Mean-Square (RMS), Vertical Coma (VC), Horizontal Coma (HC), and Spherical Aberration (SA) were determined and before and after viewing movies.
2.3.1Modulation transfer function (MTF)
MTF was the most important and fundamental evaluation method in visual performance. MTF denoted the transmission of different spatial frequencies (i.e. Optical transfer function, (OTF)). OTF was the Fourier transform of the Point Spread Function (PSF):
where
In this study, MTF index (MTFI) was calculated by the integral of all the MTF values within cutoff frequency (spatial frequency when MTF
2.3.2Higher order root-mean-square (RMS)
RMS accurately reflected the dimension of each order wavefront aberration [14]. RMS of higher-order aberration (
In this study, the absolute change of RMS 3
2.3.3Vertical coma (VC), horizontal coma (HC) and spherical aberration (SA)
Three Zerniker coefficient of Wavefront aberrations were selected for vision correction [18], as follows:
2.3.4Statistical analysis
All statistical analyses were performed using SPSS 18 (IBM Corp., Armonk, NY, USA). Descriptive statistics (means and standard deviation) of wavefront aberrations and perception variables were computed across viewing conditions. A one-way repeated measures ANOVA was performed to examine if there were any significant differences on all variables. LSD post-hoc 2-tailed comparisons were computed using a criterion alpha at 0.05.
Table 3
RMS variables by three viewing conditions (
| RMS 3 | RMS 4 | RMS 5 | RMS 6 | RMS 7 | |
|---|---|---|---|---|---|
| 2D | |||||
| 3D-A | |||||
| 3D-B | |||||
|
| 2.930 | 4.043 | 0.517 | 2.683 | 1.186 |
|
|
Note: “a” and “b” denoted significant differences from 2D and 3D-A, respectively (
Table 4
Vertical Coma (VC), Horizontal Coma (HC) and Spherical Aberration (SA) by three viewing conditions (
| VC | HC | SA | |
|---|---|---|---|
| 2D | |||
| 3D-A | |||
| 3D-B | |||
|
| 5.205 | 3.541 | 0.176 |
|
|
Note: “a” and “b” denoted significant differences from 2D and 3D-A, respectively (
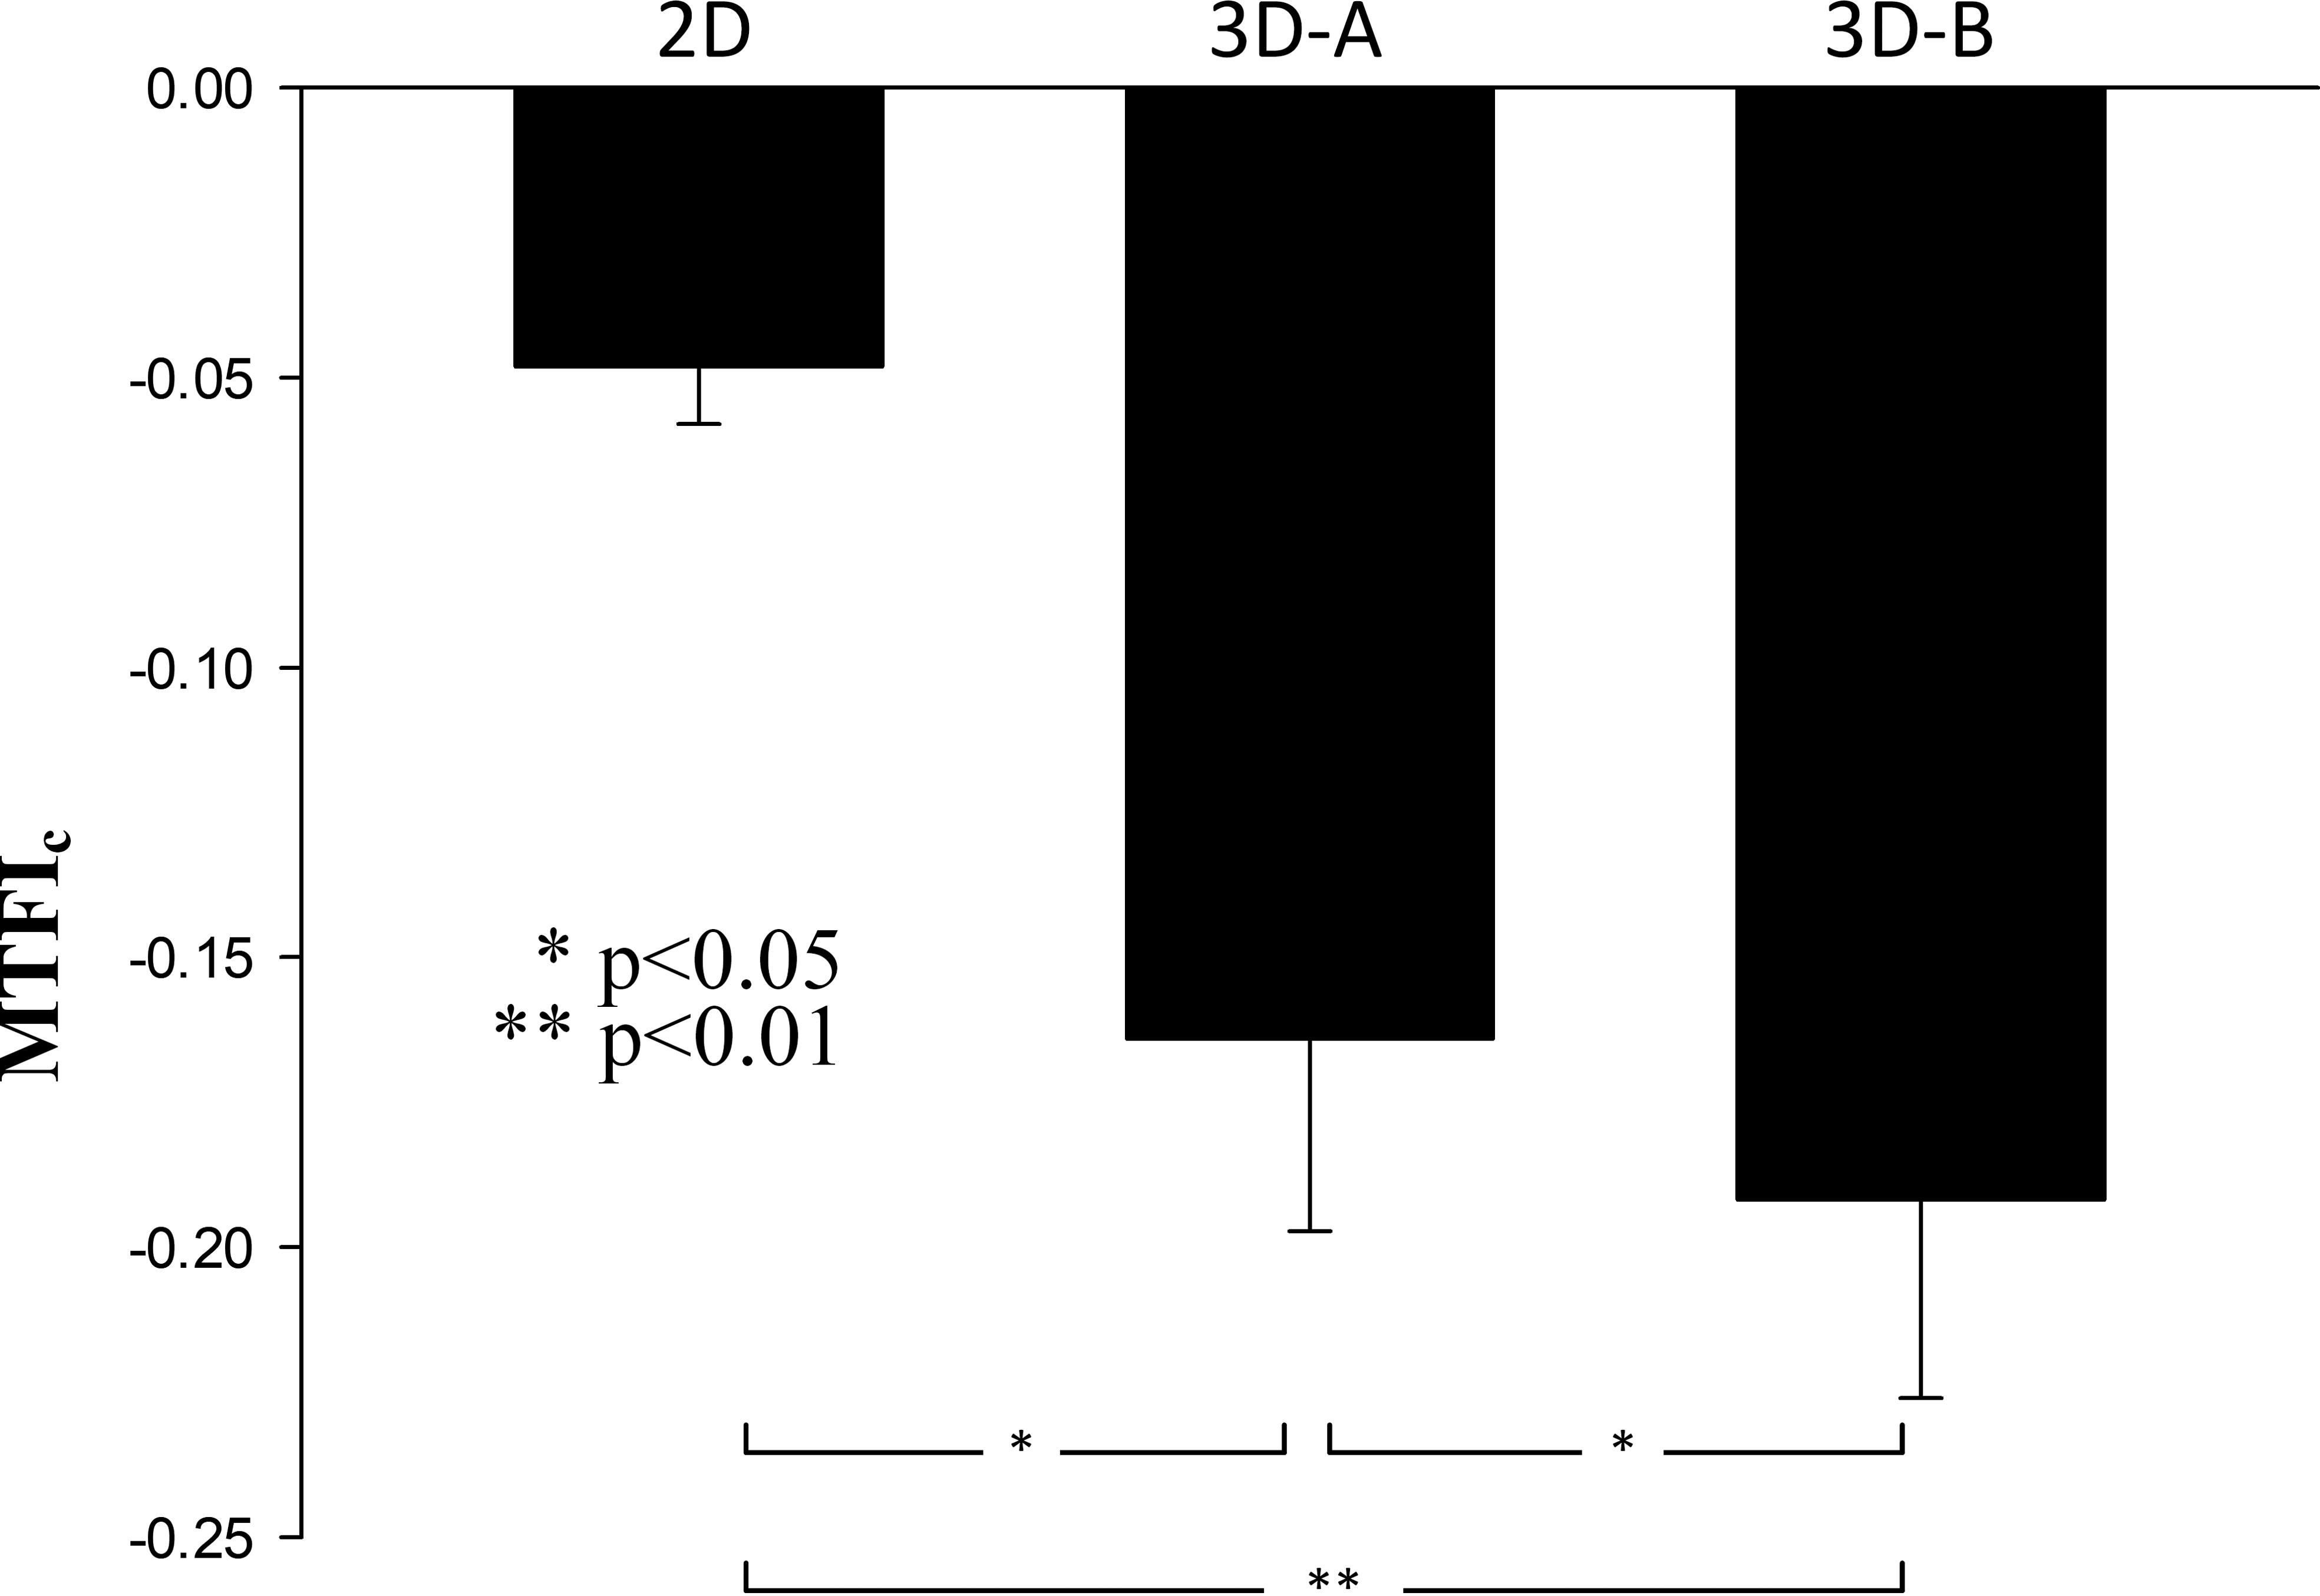
Figure 3.
Mean MTFI
3.Result
3.1Modulation transfer function index (MTFI)
The one-way ANOVA analysis indicated a significant difference of MTFI
3.2Higher order aberration – root mean square (RMS)
The ANOVA analysis indicated significant main effects for RMS 3
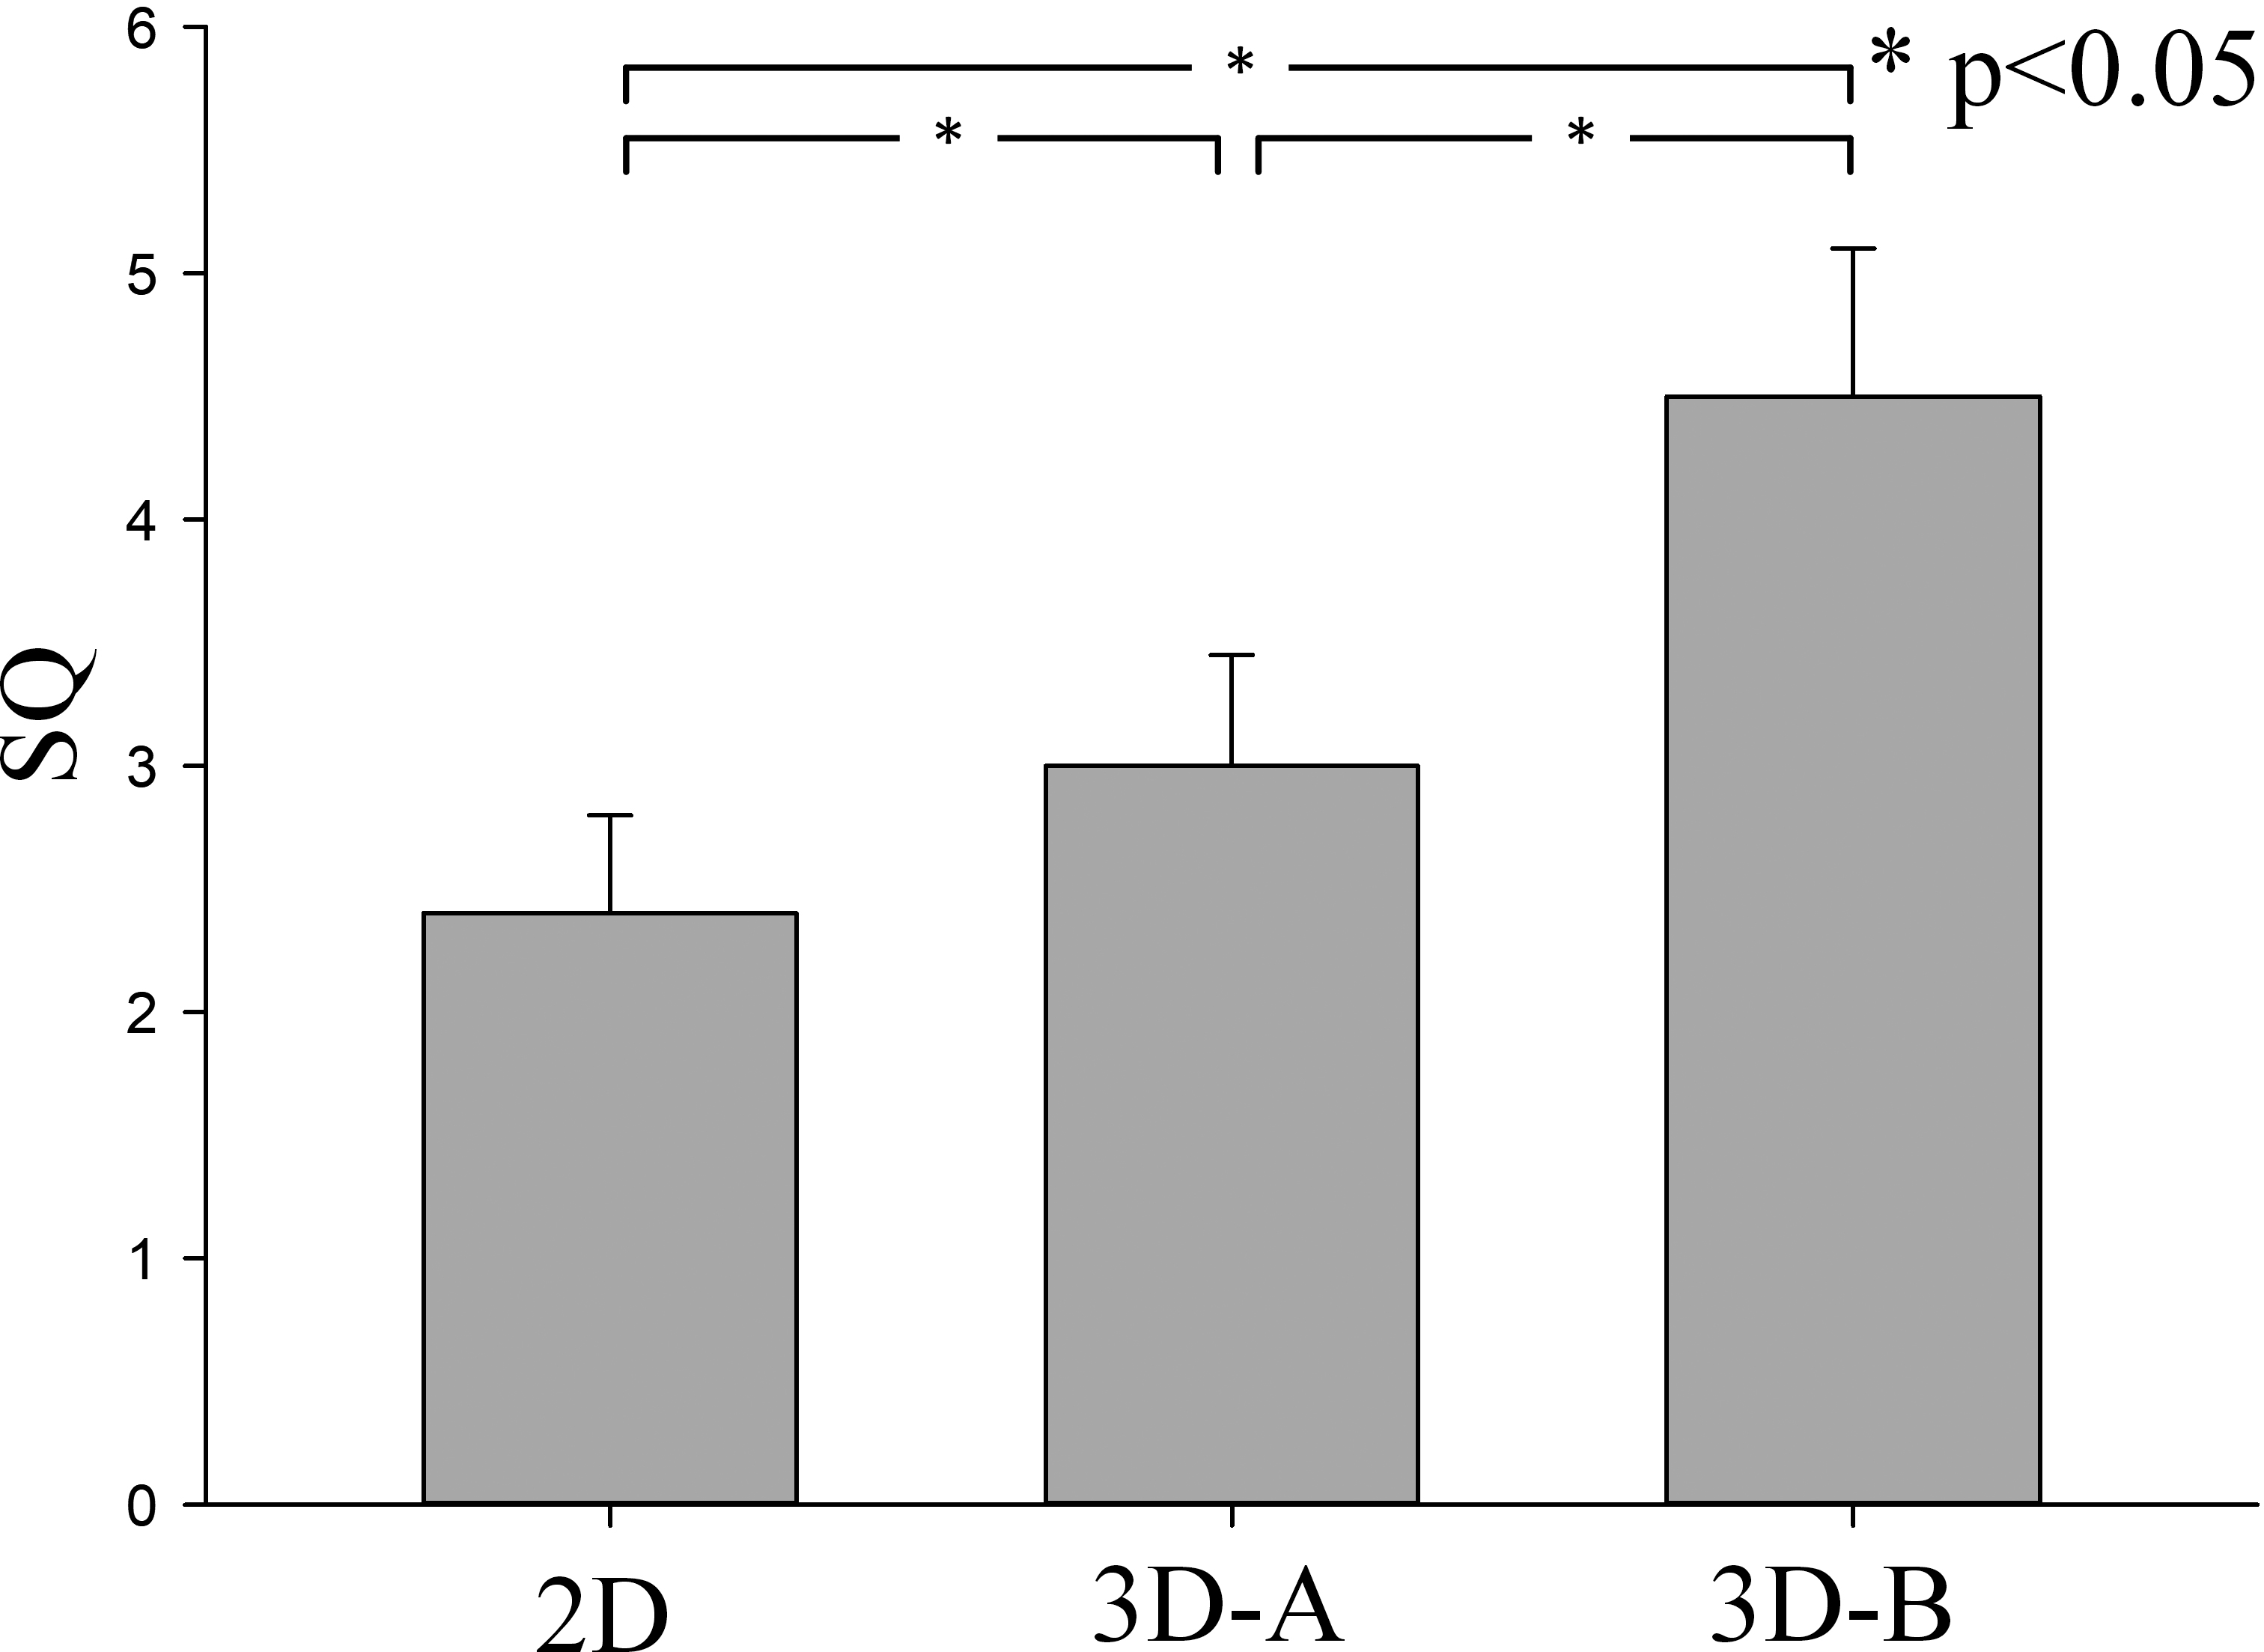
Figure 4.
Mean SQ by three viewing conditions.
3.3Vertical coma (VC), horizontal coma (HC) and spherical aberration (SA)
The ANOVA analysis indicated significant main effects for VC (
3.4Eye fatigue score (SQ)
The one-way ANOVA analysis indicated a significant difference of SQ among 2D, 3D-A, and 3D-B conditions (
4.Conclusions
The present study examined the human eye visual index (wavefront aberration) and subjective score after watching the same movie in three viewing conditions (2D, 3D-A and 3D-B). Overall, our findings indicated that prolonged viewing 3-D movies caused to larger change of MTFI, RMS, VC, and HC of wavefront aberration and poorer fatigue score, compared to the 2-D viewing condition. This supports the hypothesis that prolonged viewing 3-D movies would be of higher risk of damaging the human visual ability [19]. Recent studies on 3-D movies/images [20, 21] has suggested prolonged viewing 3-D television could also cause visual fatigue, brain fatigue, change of pulse and increased of heart rate. Therefore, the applications of 3-D imaging technology could be of concerns to the health issue in the future.
It is suggested that high quality 3D glasses could be high importance to protect the human eyes when watching television in 3-D as their daily entertainment. In our study, the glasses used in 3D-A had better optical qualities (qualified polarizing efficiency and phase difference) than the glasses used in 3D-B viewing session and the present results showed that better qualified 3-D glasses can relief subjective visual fatigue (i.e. lower SQ score) and remain better visual performance (i.e. MTFI, VC, RMS 3
Several wavefront aberration derived variables were selected in this study, as they were considered as reliable indicators of vision performance and fatigue. Modulation transfer function (MTF) and Zernike polynomials (VC, HC and SA, Table 4) index can effectively evaluate the effectiveness of the vision performance rehabilitation/training after refractive surgery [23, 24]. The present study found that a decreased change in MTFI was found after prolonged movies viewing. Moreover, watching 3-D movies would have greater impact on visual performance compared (MTFI, VC and HC) with 2-D movies. RMS of higher order aberrations is another commonly used index of visual ability [25]. The current study found significant difference only exist in two higher order aberration variables (RMS3
In summary, the visual stimulation of 2-D and 3-D movies can influence human visual function after prolonged viewing. Compared to 2-D movies, 3-D movies would be more susceptible to visual fatigue. Better quality of 3-D glasses can play the major role in reducing visual fatigue for users. MTFI and coma aberration in human wavefront aberration variables might provide additional insights to assess the level of human visual fatigue in the future.
Acknowledgments
This research was funded by Electronic Information Equipment System Research of Key Laboratory of Basic Research Projects of National Defense Technology (DXZT-JC-ZZ-2015-016) and reform and development funds of Beijing Municipal Institute of Labor Protection.
Conflict of interest
None to report.
References
[1] | Tudor-Locke C, Ainsworth BE, Adair LS, et al. Physical activity and inactivity in Chinese school-aged youth: The China Health and Nutrition Survey. International Journal of Obesity (2003) ; 27: (9): 1093-1099. DOI: 10.1038/sj.ijo.0802377 |
[2] | Kunic S, Sego Z. 3D television ELMAR. Proceedings IEEE (2011) ; 127-131. |
[3] | Maydeo AP, Bhandari S, Bapat M, et al. Potential hazards of viewing 3-D stereoscopic television, cinema and computer games: A review. Ophthalmic Physiol Opt (2011) ; 31: (2): 111-122. DOI: 10.1111/j.1475-1313.2011.00822.x |
[4] | Yano S, Ide S, Mitsuhashi T, et al. A study of visual fatigue and visual comfort for 3D HDTV/HDTV images. Displays (2002) ; 23: (4): 191-201. DOI: 10.1016/S0141-9382(02)00038-0 |
[5] | Kuze J, Ukai K. Subjective evaluation of visual fatigue caused by motion images. Displays (2008) ; 29: (2): 159-166. DOI: 10.1016/j.displa.2007.09.007 |
[6] | Ntuen CA, Goings M, Reddin M, et al. Comparison between 2-D & 3-D using an autostereoscopic display: The effects of viewing field and illumination on performance and visual fatigue. International Journal of Industrial Ergonomics (2009) ; 39: (2): 388-395. DOI: 10.1016/j.ergon.2008.07.001 |
[7] | Mun S, Park MC, Park S, et al. SSVEP and ERP measurement of cognitive fatigue caused by stereoscopic 3D. Neuroscience Letters (2012) ; 525: (2): 89. DOI: 10.1016/j.neulet.2012.07.049 |
[8] | Ukai K, Howarth PA. Visual fatigue caused by viewing stereoscopic motion images: Background, theories, and observations. Displays (2008) ; 29: (2): 106-116. DOI: 10.1016/j.displa.2007.09.004 |
[9] | Lambooij M, Fortuin M, Ijsselsteijn W, et al. Measuring visual discomfort associated with 3D displays. International Society for Optics and Photonics (2009) ; 931-943. |
[10] | Lambooij M, Ijsselsteijn WA, Heynderickx I. Visual discomfort of 3D TV: Assessment methods and modeling. Displays (2011) ; 32: (4): 209-218. DOI: 10.1016/j.displa.2011.05.012 |
[11] | Maeda N. Wavefront technology in ophthalmology. Current Opinion in Ophthalmology (2001) ; 12: (4): 294. DOI: 10.1097/00055735-200108000-00009 |
[12] | Thibos LN, Applegate RA, Schwiegerling JT, et al. Standards for reporting the optical aberrations of eyes. Journal of Refractive Surgery (2002) ; 18: (5): S652. |
[13] | Howland HC. High order wave aberration of eyes. Ophthalmic & Physiological Optics the Journal of the British College of Ophthalmic Opticians (2002) ; 22: (5): 434-439. DOI: 10.1046/j.1475-1313.2002.00072.x |
[14] | Cheng X, Thibos LN, Bradley A. Estimating visual quality from wavefront aberration measurements. Journal of Refractive Surgery (2003) ; 19: (5): S579-S584. |
[15] | Craig A, Hancock K, Craig M. The lifestyle appraisal questionnaire: A comprehensive assessment of health and stress. Psychology & Health (1996) ; 11: (3): 331-343. DOI: 10.1080/08870449608400262 |
[16] | QB/T 4735-2014, Polarized 3D galsses (in Chinese) . |
[17] | Cheng AC, Rao SK, Lam DS. Ocular higher-order aberrations in eyes with supernormal vision. American Journal of Ophthalmology (2005) ; 140: (5): 225-228. DOI: 10.1016/j.ajo.2004.08.035 |
[18] | JimÉnez JÉR, Castro JÉJ, JimÉnez R, et al. Interocular differences in higher-order aberrations on binocular visual performance. Optometry & Vision Science (2008) ; 85: (3): 174-179. DOI: 10.1097/OPX.0b013e31816445a7 |
[19] | Lee SI, Yong JJ, Sohn H, et al. Effect of stimulus width on the perceived visual discomfort in viewing stereoscopic 3-D-TV. IEEE Transactions on Broadcasting (2013) ; 59: (4): 580-590. |
[20] | Zhu M, Collins MJ, Robert ID. Microfluctuations of wavefront aberrations of the eye. Ophthalmic & Physiological Optics the Journal of the British College of Ophthalmic Opticians (2004) ; 24: (6): 562-71. |
[21] | Park S, Won MJ, Lee EC, et al. Evaluation of 3D cognitive fatigue using heart-brain synchronization. International Journal of Psychophysiology Official Journal of the International Organization of Psychophysiology (2015) ; 97: (2): 120-130. DOI: 10.1016/j.ijpsycho.2015.04.006 |
[22] | Wenzel MA, Schultzekraft R, Meinecke FC, et al. EEG-based usability assessment of 3D shutter glasses. Journal of Neural Engineering (2015) ; 13: (1): 016003. DOI: 10.1088/1741-2560/13/1/016003 |
[23] | Hong X, Himebaugh N, Thibos LN. On-eye evaluation of optical performance of rigid and soft contact lenses. Optometry & Vision Science Official Publication of the American Academy of Optometry (2001) ; 78: (12): 872-80. |
[24] | Kim DS, Krassin J, Narváez J, et al. Comparison of the VISX wavescan and NIDEK OPD-scan aberrometers. Journal of Refractive Surgery (2009) ; 25: (5): 429-434. DOI: 10.3928/1081597X-20090422-05 |
[25] | Yong L. Ocular higher-order aberrations and visual performance. Durham University 2011; (in Chinese). |


