
Potential for false positive results from multi-voxel pattern analysis on functional imaging data
Abstract
BACKGROUND:
Multi-voxel pattern analysis (MVPA) provides a powerful tool to investigate neural mechanisms for various cognitive processes under functional brain imaging. However, the high sensitivity of the MVPA method could bring about false positive results, which has been overlooked by previous research.
OBJECTIVE:
We investigated the potential for obtaining false positives from the MVPA method.
METHODS:
We conducted MVPA on a public functional MRI dataset on the neural encoding of various object categories. Different scenarios for pattern classification were involved by varying the number of voxels for each region of interest (ROI) and the number of object categories.
RESULTS:
The classification accuracy became higher with more voxels involved, and false positive results emerged for the primary auditory cortex and even a white matter ROI, where object-related neural processing was not supposed to occur.
CONCLUSIONS:
Our results imply that the classification accuracy obtained from MVPA may be inflated due to the high sensitivity of the method. Therefore, we suggest involving control ROIs in future MVPA studies and comparing the classification accuracy for a target ROI with that for a control ROI, instead of comparing the obtained accuracy with the chance-level accuracy.
1.Introduction
Multi-voxel pattern analysis (MVPA) for functional MRI (fMRI) signals has been enjoying rapid growth in the cognitive neuroscience research. Unlike the univariate analysis that makes use of information from individual voxels or the mean activation for a region of interest (ROI), the MVPA method exploits voxel-wise information in multivariate activation patterns. While the univariate analysis concerns to what degree a neural area is engaged in a cognitive processing, the MVPA method takes a further step in investigating neural encoding of cognitive representations and mental contents [1]. The MVPA method assumes spatially distributed neural encoding in fMRI activity patterns, which is supported by the theory of neural population coding [2]. The MVPA method has been employed to uncover various neural processes and representations within a brain region [3, 4, 5, 6], measuring “distances” between different neural representations [7] and decoding dynamic mental states from brain activities [8, 9, 10].
Despite the advantages of the MVPA method, it is a complex procedure involving data preparation, normalization, classifier training and testing, and statistical testing on the classification performance. Some tutorial articles have provided general guidelines for implementing each step [11, 12, 13], but there has been no unanimous opinion on how to specify some variables for the analysis, e.g., the size of a ROI, the choice of classifiers, whether to use feature selection and data averaging approaches.
1.1Factors that affect MVPA performance
A few studies have provided systematic analysis on how the combination of these variables affects the classification performance. It has been shown that preprocessing approaches including data averaging and feature selection can substantially improve classification accuracies [14]. The classification accuracy increases for more voxels involved in a ROI and saturates for large ROI sizes [14, 15]. Linear classifiers perform better than nonlinear ones [14, 15].
Nevertheless, previous studies have overlooked the potential for obtaining false positives from the MVPA method and have not provided systematic analysis on this issue. The high sensitivity of the MVPA method could be a “double-edged sword” that causes above-chance classification results for neural activity patterns that are actually irrelevant to the cognitive processing in question. False positive results will mislead researchers into concluding that an irrelevant neural area is involved in a certain cognitive processing, which becomes a prominent issue considering the increasing popularity of the MVPA method.
1.2Present work
In this study, we investigated the potential for obtaining false positives from MVPA by analyzing a public fMRI dataset under different classification scenarios. Given that many variables could affect the classification performance, we focused on two variables – (a) the voxel count in a ROI, (b) the number of categories – that concerned the dataset itself rather than the analysis procedure. Considering that there were two dimensions for a dataset – a feature (i.e. voxel) dimension and a pattern dimension, variable (a) concerned the number of features for a pattern, while variable (b) concerned the number of activity patterns.
2.Methods
2.1fMRI data
A public fMRI dataset was employed in this study. The dataset was from Haxby et al.’s work [6] on the neural representation of faces and objects in the inferior temporal cortex, and was downloadable from http://www.pymvpa.org/datadb/haxby2001.html. This dataset consisted of 6 subjects and 12 runs from each subject. Subjects passively viewed grey-scale images of eight categories (scissors, bottle, shoe, chair, house, cat, face and scramble pixels). These images were presented in 24s blocks separated by rest periods.
2.2fMRI data preprocessing
Imaging data were preprocessed by using SPM8 (Wellcome Trust Centre for Neuroimaging, University College London, UK). For each subject, the functional images were realigned and then coregistered with the T1-weighted anatomical image. The anatomical image was segmented and the transformation parameters to the MNI space were obtained, based on which the functional images were normalized to the MNI space, and resliced to 3
2.3ROI definition
Three ROIs were involved in this study: the left occipital-temporal cortex (OTC), the left primary auditory cortex and a white matter region centered at (0, 0, 0) of the MNI space (Fig. 2). ROI centers for the OTC and the auditory cortex were based on the Harvard-Oxford Atlases (http://fsl.fmrib.ox.ac.uk/fsl/fslwiki/Atlases). We employed the temporal-occipital part of the inferior temporal gyrus and Heschl’s gyrus from the Harvard-Oxford Atlases and extracted the center for each anatomical cluster by using the Marsbar toolbox [16]. The center for the OTC was located at (
Figure 1.
Regions of interest (ROI). ROIs are 12 mm-spheres centered at (
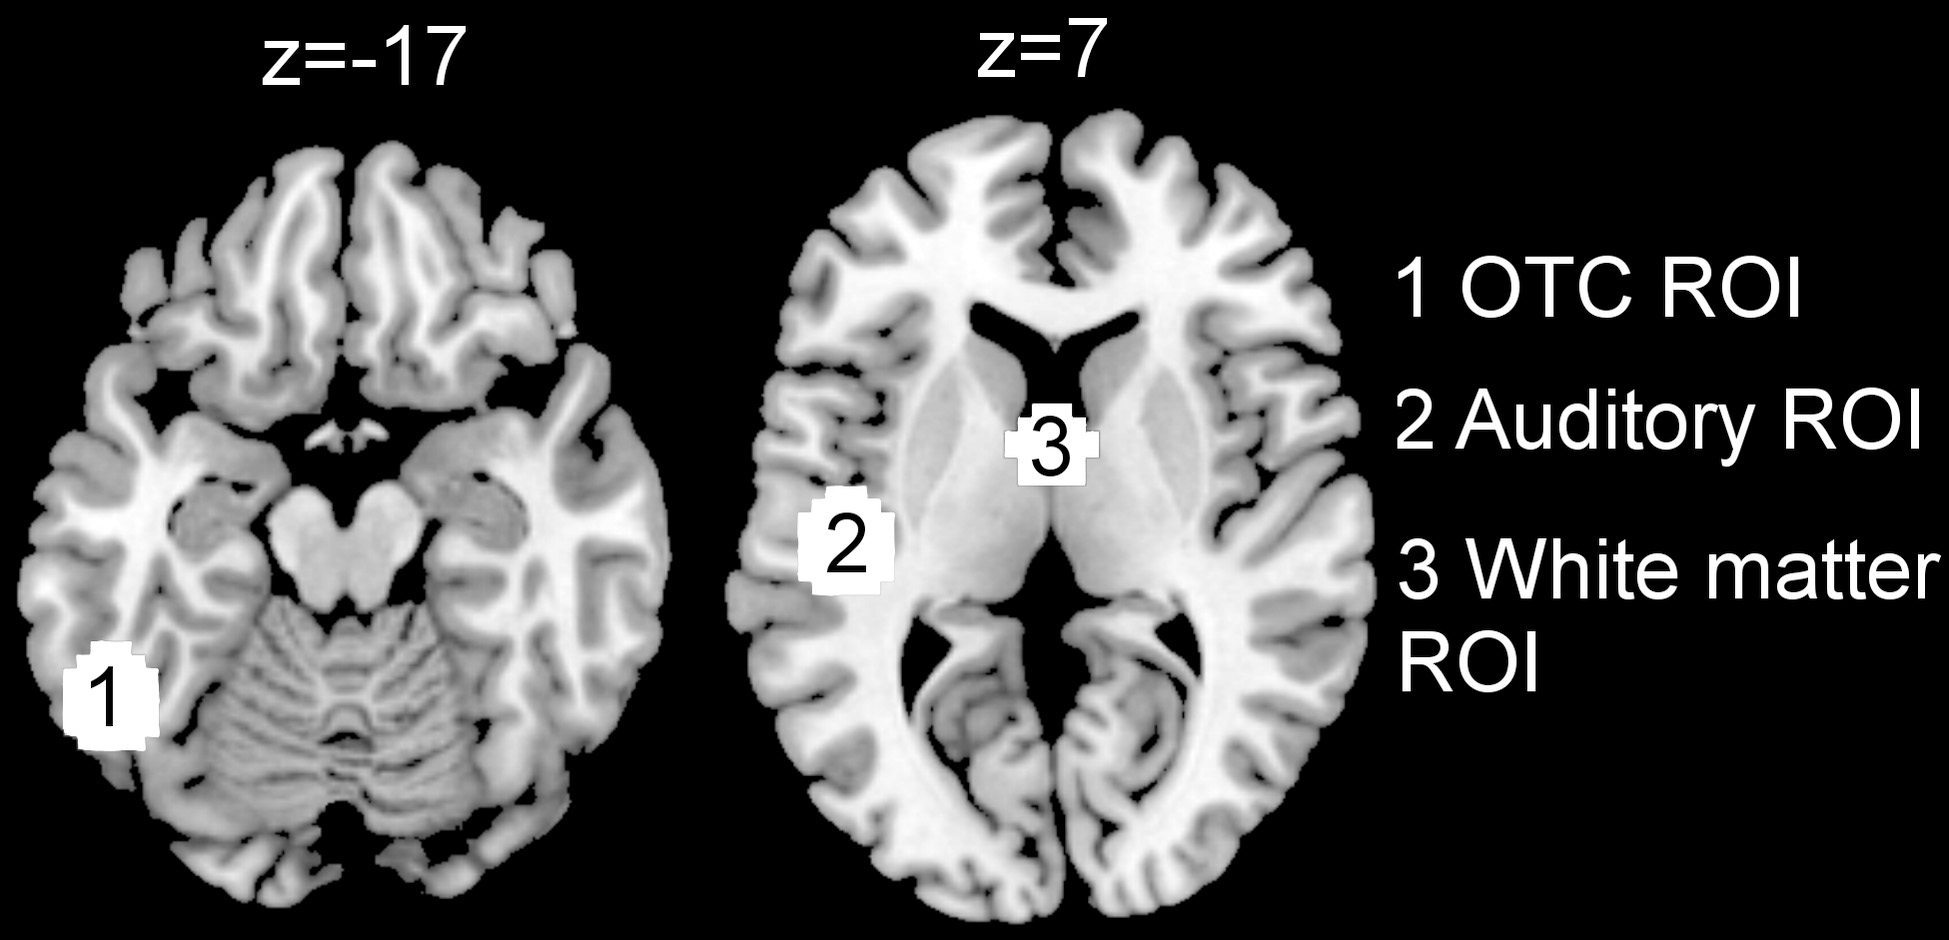
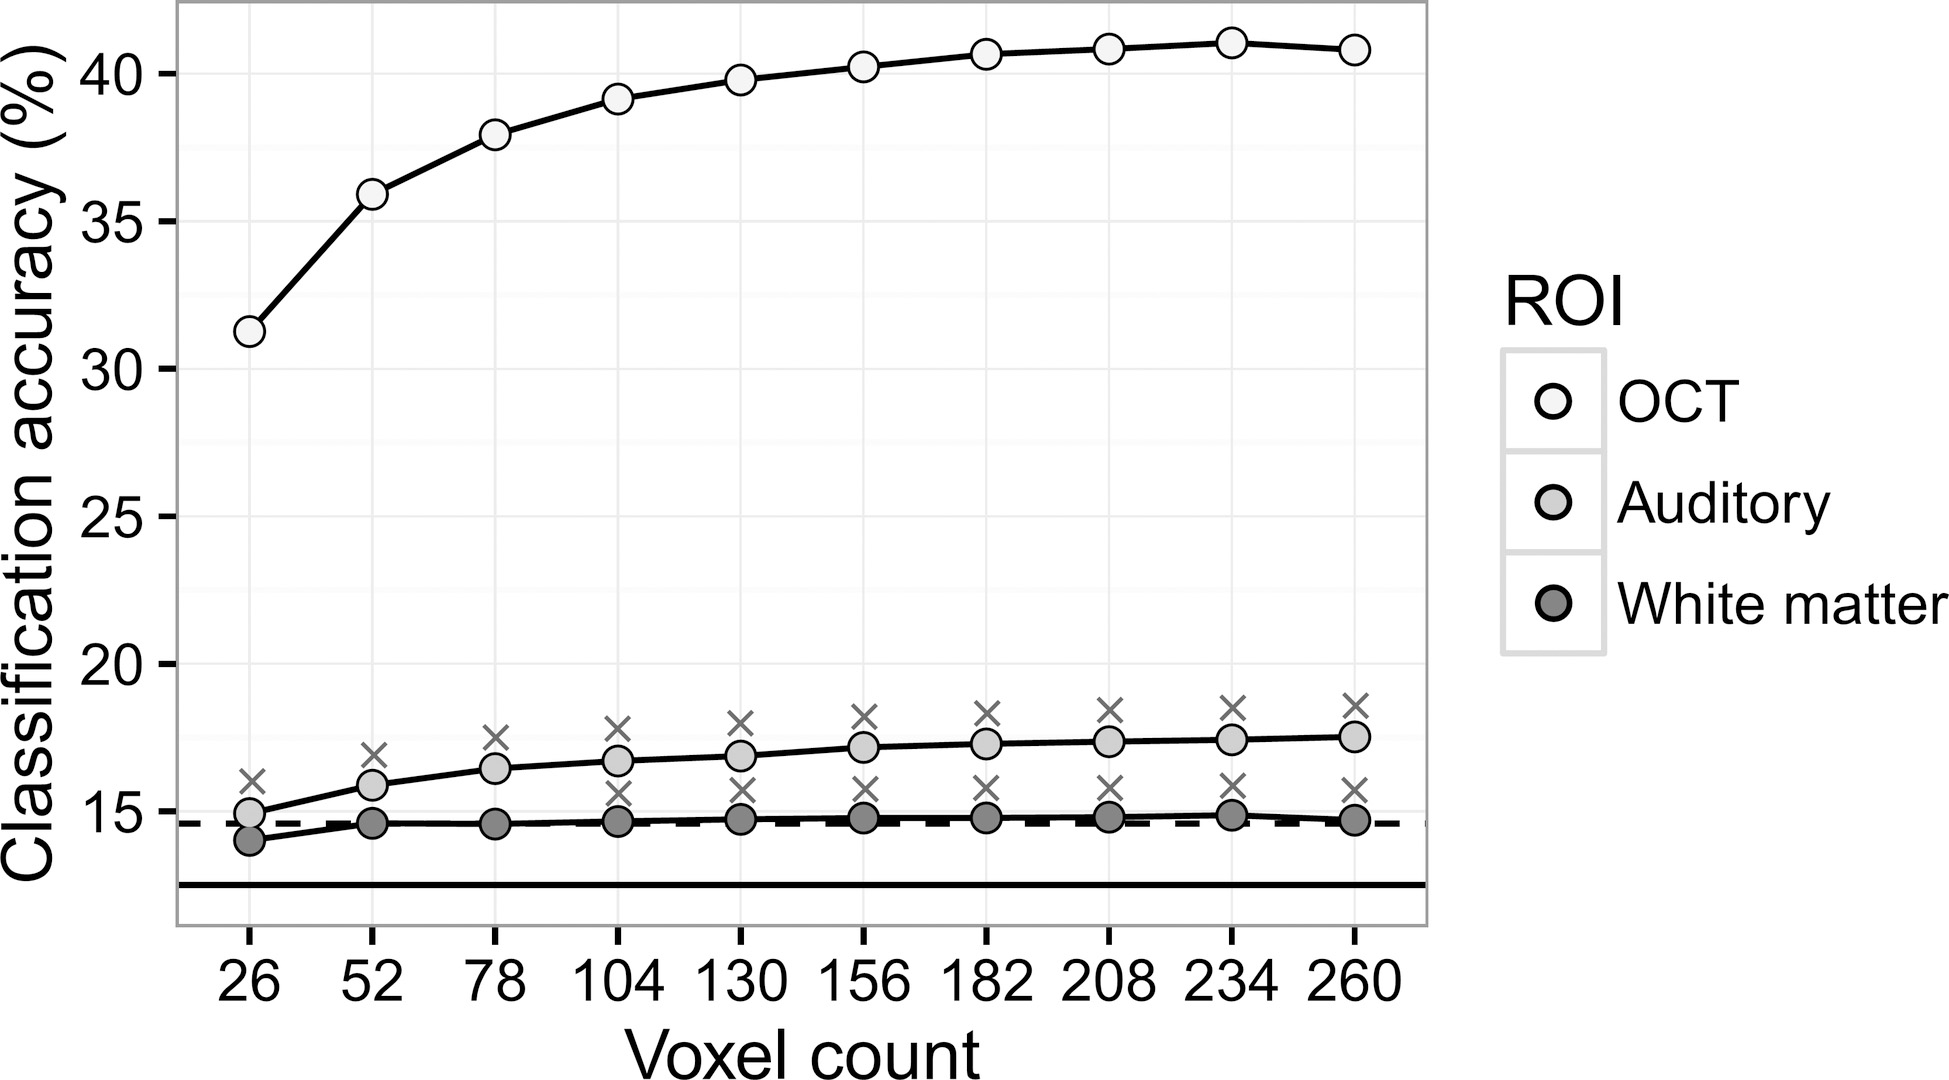
Figure 2.
Accuracies for classification across eight categories. The results are averaged across 6 subjects. The solid horizontal line indicates the chance-level accuracy (12.5%). The dashed line indicates the critical value (14.58%) for better-than-chance decoding based on the binomial test (
2.4MVPA procedure
Pattern classification analysis was performed by using the PyMVPA toolbox [17]. Linear trends were removed for each run of the functional imaging data. Data from the rest blocks were excluded from analysis. The first two volumes for each block were removed to account for the hemodynamic delay [18], leaving 672 image volumes in total (84 per category). Activation for each voxel was normalized to a mean of zero and standard deviation of one for each run. Data from each image volume corresponded to a multivariate activity pattern. The normalized patterns were subjected to a linear SVM classifier in a leave-one-run out cross-validation scheme.
2.5Classification scenarios
In this study, we varied the following two variables for the MVPA method: (a) the voxel count for a ROI, (b) the number of categories. Classification was performed on subsets of the voxels from each ROI. Each subset included from 10% (26 voxels) to 100% (260 voxels) of the voxels for each ROI. We randomly selected voxels within a ROI for each subset and this random selection was performed 100 times, from which average classification accuracies were obtained for each subset. For each subject, linear regression was performed to obtain the slope between the classification accuracy and the number of voxels involved in classification. One-sample
The number of object categories was varied by using all the eight object categories, four categories (face vs. house vs. cat vs. chair) or two categories (face vs. house). There were 672 patterns for the 8-way classification, 336 for the 4-way classification and 168 for the binary classification from each subject.
Binomial tests were used to assess whether classification accuracies were significantly above chance. The critical value for the binomial test at a significance level
Precision and recall [19] were reported as statistical measures for the 8-way, 4-way and binary classification scenarios, respectively. Precision measures the proportion of true positives among all the positive classification outcomes, and perfect precision reflects the absence of false positives. Recall (also known as sensitivity) measures the proportion of true positives among all the positives. Perfect recall reflects the absence of false negatives.
3.Results
3.1Classification between eight categories
Precision for the 8-way classification was 37.04% (10/27) and recall was 100% (10/10). The classification accuracy for the OTC ROI was well above the critical value (14.58%) irrespective of the number of voxels involved (Fig. 2), which was reflected in the perfect recall. For the Auditory ROI, however, all the classification accuracies were also above the critical value, which were false positive results (10 false positives). Classification accuracies for the white matter ROI also revealed false positive results when the voxel count was equal to or above 104 (7 false positives).
The slope between the classification accuracy and the ROI size was significantly above zero for both the OTC ROI (
3.2Classification between four categories
Precision for the 4-way classification was 52.63% (10/19) and recall was 100% (10/10). For the OTC ROI, all the classification accuracies were well above the critical value of 29.05% (Fig. 4), demonstrating perfect recall. Classification accuracies for the Auditory ROI were false positive if 52 or more voxels were involved (9 false positives). Classification accuracies for the white matter ROI were all below the critical value, showing no false positives.
Figure 3.
Accuracies for classification across four categories. The results are averaged across 6 subjects. The solid horizontal line indicates the chance-level accuracy (25%). The dashed line indicates the critical value (29.05%) for better-than-chance decoding based on the binomial test (
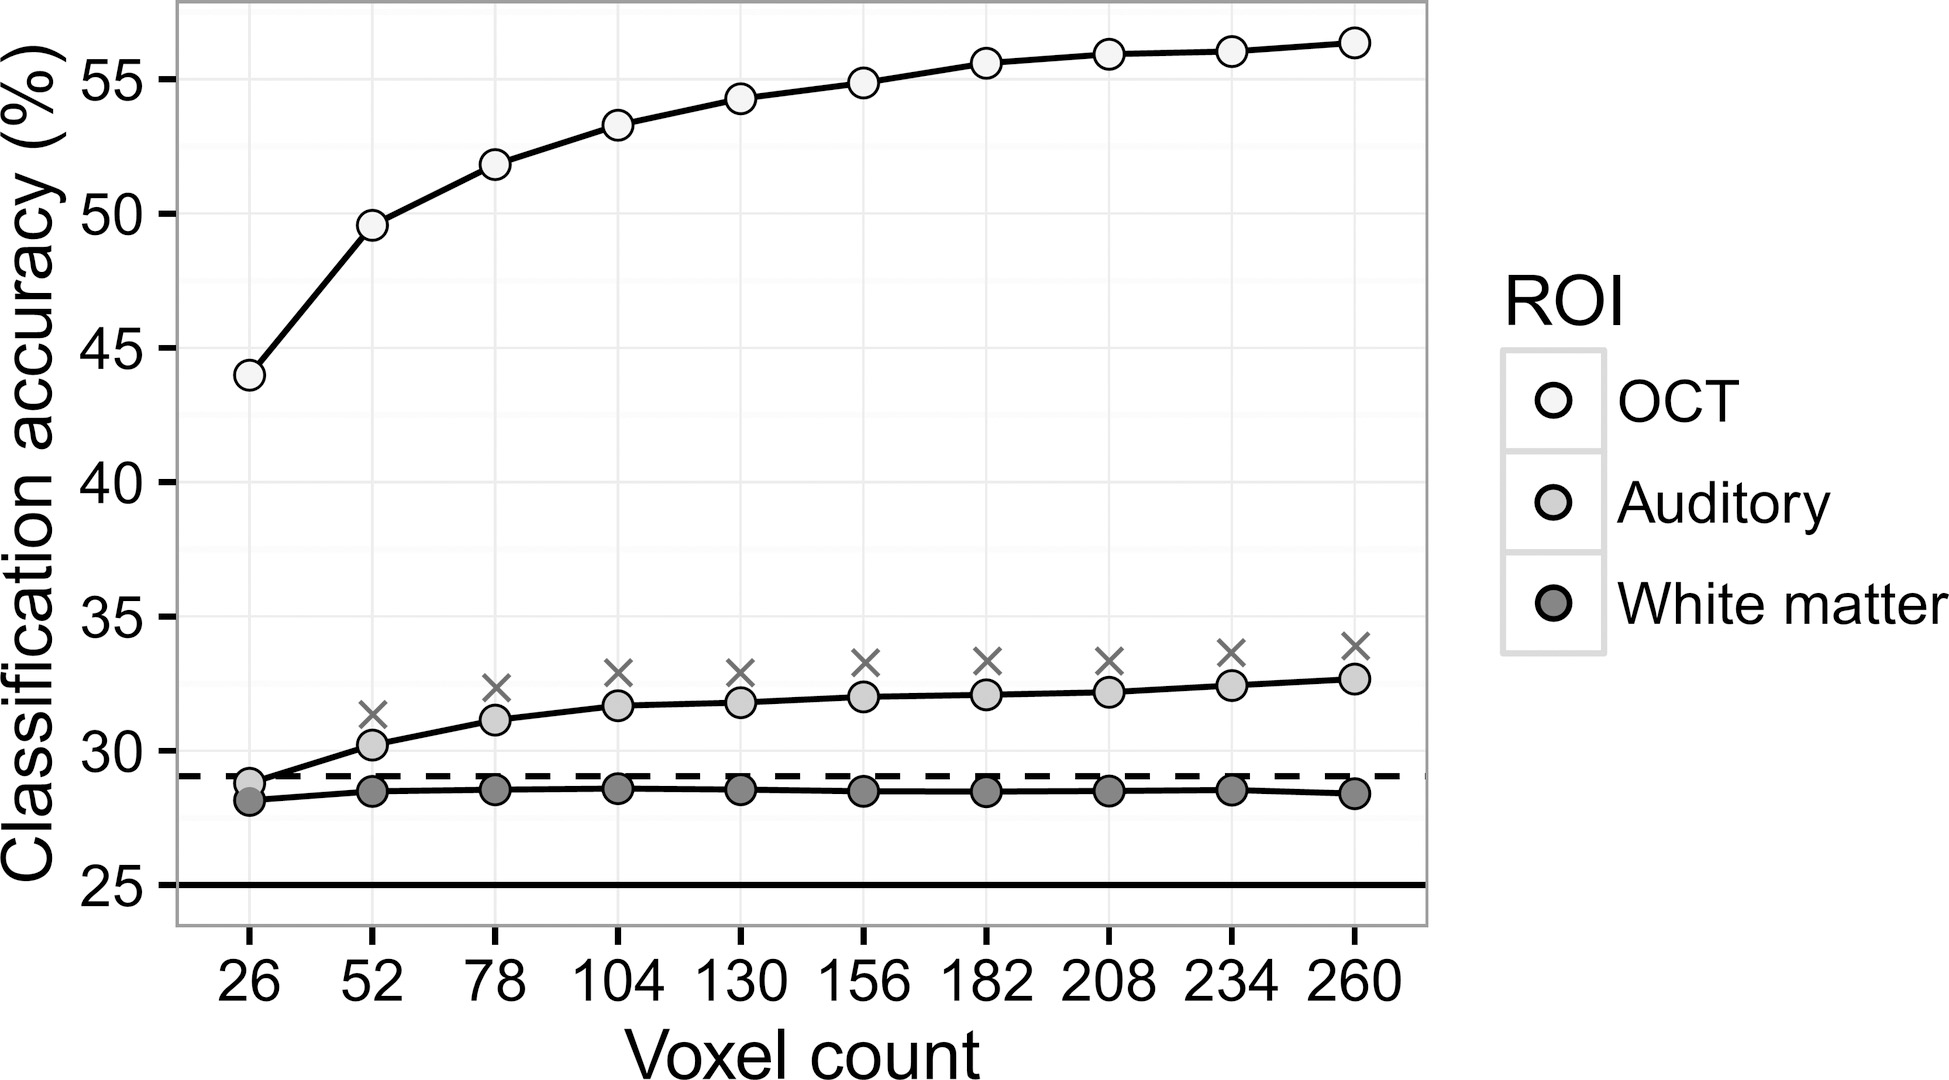
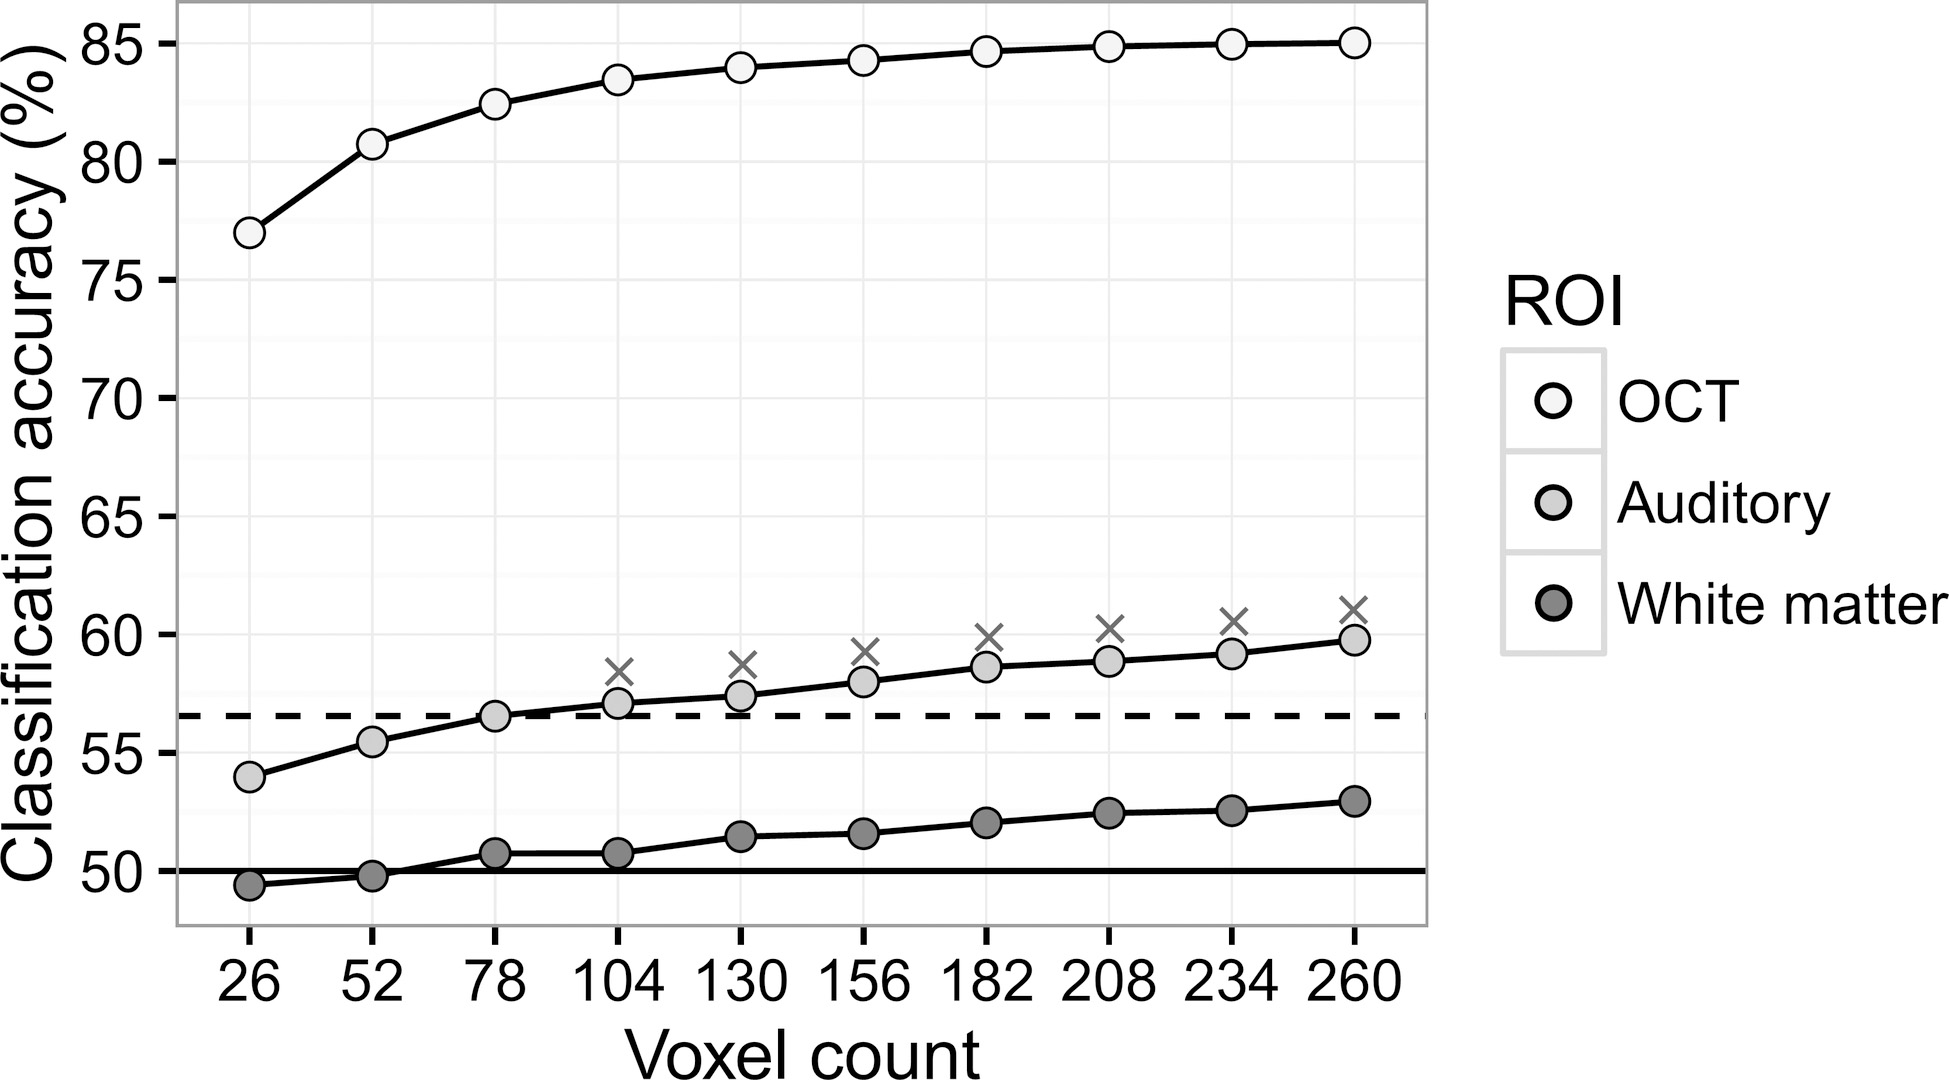
Figure 4.
Accuracies for binary classification (face vs. house). The results are averaged across 6 subjects. The solid horizontal line indicates the chance-level accuracy (50%). The dashed line indicates the critical value (56.55%) for better-than-chance decoding based on the binomial test (
The slope between the classification accuracy and the ROI size was significantly above zero for both the OTC ROI (
3.3Classification between two categories
Precision for the binary classification was 58.82% (10/17) and recall was 100% (10/10). The critical value for the binary classification was 56.55% according to the binomial test. Classification accuracies were above this value for the OTC ROI regardless of the ROI size, and those for the white matter ROI were all below the critical value (Fig. 4). Classification accuracies for the Auditory ROI, however, exceeded the critical value if the ROI involved 104 or more voxels (7 false positives).
The slope between the classification accuracy and the ROI size was significantly above zero for both the OTC ROI (
3.4Correction for multiple comparisons
It should be noted that statistical testing on the classification accuracies was not corrected for multiple comparisons on the three ROIs, in order to reveal the false positives for investigating each ROI individually. Corrections for multiple comparisons can indeed control false positives and have been employed by most if not all MVPA studies. In this section, we presented results with the Bonferroni correction. The critical value became 15.33% for the 8-way classification, 30.65% for the 4-way classification and 58.33% for the binary classification, based on the binomial test (
For the 8-way classification, the false positive results for the White matter ROI were all controlled. However, false positive results for the Auditory ROI still occurred if the voxel count was equal or above 52 (only one false positive eliminated). Precision for the 8-way classification was 52.63% (10/19). For the 4-way classification, only one false positive result was removed for the Auditory ROI (voxel count
4.Discussion
In this study, we explored in detail how the ROI size and number of categories influenced the MVPA performance for analyzing the functional imaging data. Especially we focused on the potential for obtaining false positive results from the control ROIs.
Our results showed that false negative results, i.e., classification accuracies were low where they were expected to be high, were less of a concern compared with false positive results. All the classification accuracies for the OTC ROI were well above the critical value even under the scenario where only 26 voxels were involved. The perfect recall for the 8-way, 4-way and binary classification scenarios demonstrated high sensitivity of the MVPA method. However, this high sensitivity brought about false positive results for the Auditory ROI and even the white matter ROI, where neural encoding for object categories was not supposed to exist. The low precision implied that in this study a substantial proportion of the significant classification results were false positives and did not reflect the underlying neural representation correctly. We also demonstrated that corrections for multiple comparisons had limited power to eliminate false positives from the MVPA results. We recommend that control ROIs, preferably within the grey matter, should be involved in future MVPA studies. Only a few previous MVPA studies have involved control ROIs in the analysis [3, 20]. In order to account for the “inflated” classification accuracy, we suggest that comparing the classification accuracy for a targeted ROI with that for a control ROI was preferable to comparing with the chance-level accuracy.
Our results also demonstrated that classification accuracies increased when more voxels were involved in the analysis. It suggested that the information brought by the extra voxels were exploited by the classifier and thus contributed to the classification performance, which was consistent with previous research [14]. For the Auditory ROI, false positive results emerged if more than 156 voxels were involved in the analysis for all of the 8-way, 4-way and binary classification scenarios, even with the Bonferroni correction for multiple comparisons. Many previous MVPA studies involved more than 150 voxels in the analysis [6, 10, 18], which raised concerns for potential false positive results.
We also acknowledged several limitations of the current study. We investigated how the variables concerning the dataset itself (the voxel count in a ROI and the number of categories) affected the occurrence of false positives but kept the variables concerning the MVPA procedure fixed. The current work did not involve data averaging or feature selection in the MVPA procedure, and employed a linear SVM for pattern classification. Indeed different MVPA procedures have been shown to affect classification performance [14, 15] and thus may also affect the occurrence of false positives, which should be addressed in future research. Furthermore, the number of patterns per category was also fixed in our investigation due to the limited space of this paper. Future studies should address how these variables affect the potential for obtaining false positive results.
5.Conclusion
We demonstrated that the MVPA results were prone to false positives due to the high sensitivity of the method. We therefore suggest that, instead of comparing the classification accuracy with the chance level, future MVPA studies should compare the classification accuracy between a targeted ROI and a corresponding control ROI.
Conflict of interest
None to report.
Acknowledgments
This work was supported by a grant from the National Natural Science Foundation of China (61173116).
References
[1] | Haynes JD. A Primer on Pattern-Based Approaches to fMRI: Principles, Pitfalls, and Perspectives. Neuron. (2015) ; 87: (2): 257-70. |
[2] | Averbeck BB, Latham PE, Pouget A. Neural correlations, population coding and computation. Nat Rev Neurosci. (2006) ; 7: (5): 358-66. |
[3] | Ogawa K, Inui T. Neural representation of observed actions in the parietal and premotor cortex. Neuroimage. (2011) ; 56: (2): 728-35. |
[4] | Downing PE, Wiggett AJ, Peelen MV. Functional magnetic resonance imaging investigation of overlapping lateral occipitotemporal activations using multi-voxel pattern analysis. J Neurosci. (2007) ; 27: (1): 226-33. |
[5] | Gallivan JP, McLean DA, Valyear KF, Culham JC. Decoding the neural mechanisms of human tool use. eLife. (2013) ; 2: : 1-29. |
[6] | Haxby JV, Gobbini MI, Furey ML, Ishai A, Schouten JL, Pietrini P. Distributed and overlapping representations of faces and objects in ventral temporal cortex. Science. (2001) ; 293: (5539): 2425-30. |
[7] | Kriegeskorte N, Mur M, Bandettini P. Representational similarity analysis – connecting the branches of systems neuroscience. Front Syst Neurosci. (2008) ; 2: : 4. |
[8] | Haynes JD, Rees G. Predicting the stream of consciousness from activity in human visual cortex. Curr Biol. (2005) ; 15: (14): 1301-7. |
[9] | Haynes JD, Rees G. Decoding mental states from brain activity in humans. Nat Rev Neurosci. (2006) ; 7: (7): 523-34. |
[10] | Kamitani Y, Tong F. Decoding the visual and subjective contents of the human brain. Nat Neurosci. (2005) ; 8: (5): 679-85. |
[11] | Lemm S, Blankertz B, Dickhaus T, Muller KR. Introduction to machine learning for brain imaging. Neuroimage. (2011) ; 56: (2): 387-99. |
[12] | Etzel JA, Gazzola V, Keysers C. An introduction to anatomical ROI-based fMRI classification analysis. Brain Res. (2009) ; 1282: : 114-25. |
[13] | Pereira F, Mitchell T, Botvinick M. Machine learning classifiers and fMRI: A tutorial overview. Neuroimage. (2009) ; 45: (1): 199-209. |
[14] | Ku S, Gretton A, Macke J, Logothetis NK. Comparison of pattern recognition methods in classifying high-resolution BOLD signals obtained at high magnetic field in monkeys. Magn Reson Imaging. (2008) ; 26: (7): 1007-14. |
[15] | Misaki M, Kim Y, Bandettini PA, Kriegeskorte N. Comparison of multivariate classifiers and response normalizations for pattern-information fMRI. Neuroimage. (2010) ; 53: (1): 103-18. |
[16] | Brett M, Anton JL, Valabregue R, Poline JB. Region of interest analysis using an SPM toolbox. 8th International Conference on Functional Mapping of the Human Brain; (2002) June 2-6; Sendai (Japan). |
[17] | Hanke M, Halchenko YO, Sederberg PB, Hanson SJ, Haxby JV, Pollmann S. PyMVPA: A python toolbox for multivariate pattern analysis of fMRI data. Neuroinformatics. (2009) ; 7: (1): 37-53. |
[18] | Cox DD, Savoy RL. Functional magnetic resonance imaging (fMRI) “brain reading”: detecting and classifying distributed patterns of fMRI activity in human visual cortex. Neuroimage. (2003) ; 19: (2): 261-70. |
[19] | Olson DL, Delen D. Advanced Data Mining Techniques. Berlin Heidelberg: Springer-Verlag; (2008) . |
[20] | Gallivan JP, McLean DA, Smith FW, Culham JC. Decoding Effector-Dependent and Effector-Independent Movement Intentions from Human Parieto-Frontal Brain Activity. J Neurosci. (2011) ; 31: (47): 17149-68. |


