
Country statistical capacity: A recent assessment tool and further reflections on the way forward1
Abstract
A country’s statistical capacity takes an indispensable part in its development. We offer a comprehensive comparison between the World Bank’s Statistical Performance Indicators and Index (SPI) and its predecessor, the Statistical Capacity Index (SCI) regarding different conceptual and empirical aspects. We further examine the relationships of the two indexes with some agriculture development indicators such as food security, food sustainability and productivity as well as other key indicators including headcount poverty, GDP per capita, and an SDG progress index. Our analysis employs the latest SPI data update in 2022, which were not available in previous studies. We also propose clear guidelines on how the SPI can be maintained and updated in the future to ensure that this process is transparent, replicable, safeguarded with high quality, and provides comparable data over time.
1.Introduction
A country’s statistical capacity takes a central role in its development. Strong statistical capacity results in accurate measurement of economic activities (which provides timely inputs for policy response) and better information flows among various stakeholders (which enhances governance and efficiency). For poorer countries that often have weaker capacity, strong statistical capacity is particularly important, since it helps with monitoring poverty reduction and transparent uses of international aid.
Table 1
An Overview of the World Bank’s Statistical Capacity Index (SCI) in Selected Recent Studies
| 1 | Angrist, Goldberg and Jolliffe (2021) | Journal of Economic Perspective | Global analysis | Measuring economic growth in developing countries | Poorer countries have lower statistical capacity, which can severely bias their reported measurements of economic growth. |
|---|---|---|---|---|---|
| 2 | Anderson and Whitford (2017) | Review of Policy Research | 100 countries | Technological attainment and statistical capacity | Countries with greater levels of technological attainment have greater national statistical capacity. |
| 3 | Goren and Winkler (2022) | Journal of African Economies | 57 African countries | Low-quality statistics, slave trades and development | Replacing mismeasured GDP per capita by nighttime light intensity per capita significantly reduces the impact of the slave trade on economic development by a factor of 2 to 4. |
| 4 | Hanson and Sigman (2021) | Journal of Politics | 139 countries | Measuring state capacity in political science research | The SCI is most strongly correlated with state capacity compared to other indicators in bureaucratic quality, public administration, law and order ratings, or state fiscal capacity. |
| 5 | Henderson, Storeygard and Weil (2012) | American Economic Review | 113 countries | Better measuring income growth with night lights data | SCI can help provide more accurate estimates of country income growth. |
| 6 | Hu and Yao (2022) | Journal of Econometrics | 162 countries | Estimating the relationship between nighttime light growth and GDP growth | SCI can help provide more accurate estimates of country GDP growth. |
| 7 | Jacob (2017) | World Development | 145 countries | Impact of data gaps on Millennium Development Goals achievement (MDG) | Stronger country statistical capacity increases the probability of MDG success. |
| 8 | Martinez (2022) | Journal of Political Economy | 137 countries | Autocracies overstate yearly GDP growth | Limitations in country statistical capacity do not significantly affect autocracies’ exaggeration of GDP growth. |
| 9 | Oechslin and Steiner (2022) | Review of International Organization | 146 countries | Statistical capacity and corrupt bureaucracies | A positive relationship between the growth rate of real GDP per capita and statistical capacity exists for countries with low corruption, but not for countries with high corruption. |
| 10 | Sanderfur and Glassman (2015) | Journal of Development Studies | Sub-Saharan African countries | Political economy of bad data | Sub-Saharan African countries as a whole have a lower SCI score (i.e., 58) than the global average (i.e., 64), but much heterogeneity exists with country scores ranging from the bottom to more than the 75th global percentile. |
| 11 | Sanga et al. (2011) | International Statistical Review | 43 African countries | Proposing an index to measure statistical capacity for African countries | The SCI does not cover certain aspects of an NSO such as organization, human development, and funding. There is a weak correlation between the SCI and the proposed index. |
| 12 | Tapsoba et al. (2017) | Journal of International Development | 62 developing countries | Statistical capacity building impacts on reducing procyclical fiscal policy | IMF-supported technical analysis to countries improves their statistical capacity during 1990–2012. |
Note: SCI stands for statistical capacity index.
The Statistical Capacity Index (SCI) is a tool developed by the World Bank in 2004 to assess improvements in country statistical capacity [1]. The SCI has been widely employed by different international and national agencies to measure progress with various development indicators including development trends [2], or areas of statistical improvement in member countries [3], or tracking the Sustainable Development Goal (SDG) for child development [4]. It also strongly contributes to the academic literature. We offer in Table 1a brief overview of some selected academic studies in the past decade that employ the SCI. These studies highlight the importance of statistical capacity building [5, 6] and its useful values for measuring economic growth and government institutions and governance [7, 8, 9, 10, 11, 12, 13] as well as country potential success with achieving the Millennium Development Goals (MDGs) [14].22
Yet, the SCI has several key limitations [15]. First, the various aspects of the capacity of a national statistical system (NSS) that the SCI measures have fast become outdated. Since its launch, the SCI’s methodology and coverage have remained the same, while technological advances with computing and data storage capacity have enabled NSSs to make significant advancements with data collection methods and better dissemination practices. While the international community’s adoption of the SDGs raised the bar for NSSs regarding their capacity to produce higher-quality and more (frequent) data, the SCI includes no indicators of some important surveys (including the labor force surveys and establishment surveys). Second, the SCI focuses on poorer countries, which limits its relevance and application in an increasingly globalized world. Third, the conceptual principles and mathematical properties of the SCI leave much room for improvement. For example, key concepts underlying data production and data usage are not clearly defined, which may contribute to the misconceptions that all the stakeholders use similar standards in safe-guarding data quality and make similar efforts to ensure open data access. Technical concerns were also raised over the lack of a solid foundation behind the index’s aggregation method [18]. These concerns have practical relevance. For example, the overall SCI scores of Cameroon and Sudan rose from 55.6 and 51.1 in 2015 to 68.9 and 63.3 in 2016, respectively, indicating a 24-percent improvement of statistical capacity over one year. This stands in sharp contrast with the common knowledge that a country’s statistical capacity often improves incrementally.
The Statistical Performance Indicators and Index (SPI) represents an effort to address these limitations. While it was just recently introduced [19, 15], the SPI has been adopted for measuring country statistical capacity in various policy reports on progress with the Sustainable Development Goals (SDGs) [20, 21, 22]. SPI indicators have been formally employed to measure country statistical capacity under the SDG monitoring framework (SDG indicator 17.18.1). Researchers have also started employing the SPI to study country statistical capacity, ranging from assessing and improving data openness and accessibility, the quality of NSSs, government use of data, and future official statistics [23, 24, 25, 26] to better understanding national statistical offices’ (NSOs) response to the Covid-19 pandemic [27]. The SPI was also used to study sector-specific topics such as food and agriculture statistics [28] and forecasting GDP growth [29].
We make several new contributions in this paper. First, we offer detailed comparison for the SPI with its predecessor, the SCI, regarding different conceptual and empirical aspects between the two indexes, including their coverage for the years, countries, indicators, data sources and dimensions (categories), conceptual framework, and development focus. Second, we further examine the relationships of the SPI and the SCI with some key agriculture development indicators such as food security, food sustainability and productivity as well as headcount poverty, GDP per capita, and an SDG progress index [22]. To our knowledge, while previous studies briefly compare these two indexes [5, 30, 31], we offer the most comprehensive comparison between the SPI and the SCI in this paper.33 Our analysis employs the latest SPI data update in 2022, which were not available in previous studies. Finally, moving forward we propose clear guidelines on how the SPI can be maintained and updated to ensure that the process is transparent, replicable, safeguarded with high quality, and provides data consistency over time.
We find that the SPI is built on clear conceptual and mathematical foundations, which distinguishes it from the SCI. The method used to aggregate the SPI is based on three-level nested weighting approach, compared to simple arithmetic weighting for the SCI. It is supported with data on up to 186 countries, for both poorer and richer countries, while the SCI covers only 145 poorer countries. The SPI offers a shorter time series but more recent data for the period 2016–2022, while the SCI covers the period 2004–2020. The SPI offers more than twice the number of indicators as that of the SCI, covers more data dimensions (including more agricultural data), and is more closely linked to the SDGs. The SPI also has a stronger correlation with most agricultural development indicators as well as other key indicators.
This paper consists of six sections. We provide in the next section an overview of the SPI, including its conceptual framework (Section 2.1) and a description of country SPI scores (Section 2.3). We subsequently compare the SPI and the SCI in Section 3 before further examining their relationships with key (agriculture) development indicators, such as undernourishment, food insecurity, food sustainability, agricultural productivity, headcount poverty, GDP per capita, and an SDG progress index. We offer some reflections on guidelines for maintaining and updating the SPI in policy discussion Section 5 and finally conclude in Section 6. Supplementary materials for further analysis is provided in Appendix A.
Figure 1.
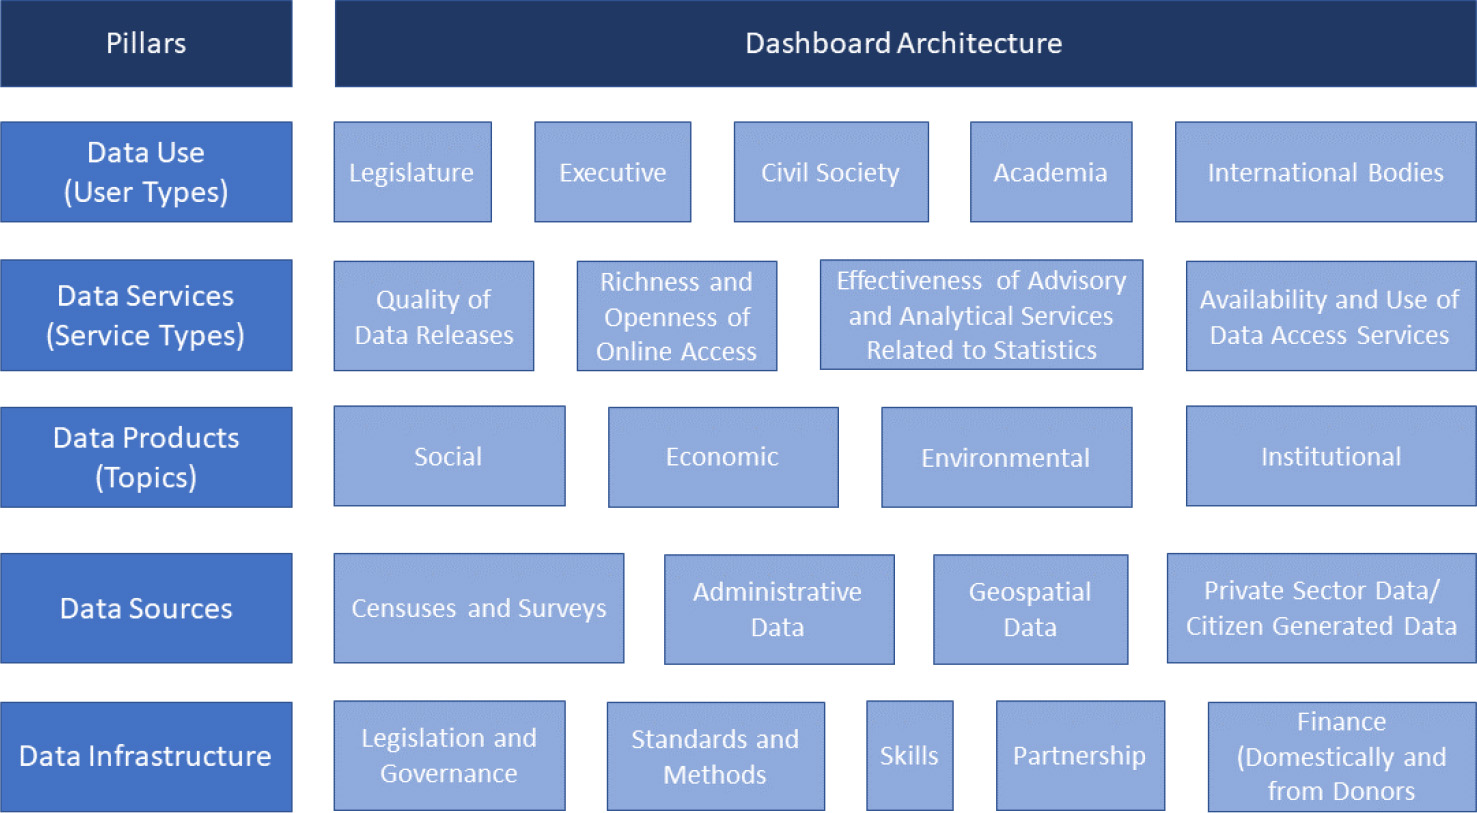
The Pillars and Dimensions that Construct the New SPI. Source: Dang et al. (2023).
2.Overview of SPI
2.1Conceptual framework
The SPI measures both less mature statistical systems and advanced systems, covers a country’s entire NSS (rather than just the NSO as with some previous index), and provides countries with incentives to build modern statistical system. The SPI also takes a much broader view of statistics and places emphasis on the data system underpinning the statistical system. It is built on standard desiderata for a statistical index (i.e., simple, coherent, motivated, rigorous, implementable, replicable, incentive consistent), as well as clear conceptual and mathematical foundations. Importantly, the SPI is also open-data and open-code where users can freely access data and experiment with different adjustments to the index on the World Bank’s website.44
Figure 1 shows five key pillars of a country’s statistical performance. These are data use, data services, data products, data sources, and data infrastructure, which can be further disaggregated into 22 dimensions. This figure shows these pillars and dimensions in the form of a dashboard, which can help countries identify areas for development in their statistical system. We briefly describe these pillars below and provide more details on the dimensions of the SPI, including ongoing data work, in [15].
Since the ultimate value of statistics is their use, the first pillar of the SPI is data use. The second pillar of the SPI is data services, which connect data users and producers and facilitate dialogue between them to meet user needs. The dialogue between users and suppliers in turn drives the design of statistical products, resulting in data products as the third pillar of the SPI. To create the products required, the statistical system needs to make use of a variety of sources from both inside and outside the government, including both typical data collection methods like censuses and surveys, and also newer data sources such as administrative data, geospatial data, and citizen-generated data. The fourth pillar of the SPI is therefore data sources. For the cycle to be complete, capability needs continuous review and improvement to ensure that the required products, services and ultimately data are delivered. The fifth pillar of the SPI is therefore data infrastructure.
In summary, a successful statistical system offers highly valued and well-used statistical services, generates high quality statistical indicators that can also track progress for the SDGs, draws on all types of data sources relevant to the indicators that are to be produced, develops both hard infrastructure (including legislation, governance, standards) and soft infrastructure (including skills, partnerships), and has the financial resources to deliver.55
The SPI overall score is constructed using [32] nested weighting structure. Compared to other weighting schemes, this weighting structure offers properties such as symmetry, monotonicity, and subgroup decomposability.66 Our statistical performance indicators have a three-level structure, and the SPI overall score is formed by sequentially aggregating the indicators at each level.
In particular, a score for each dimension within a given pillar, which, unless otherwise stated, is an unweighted average of the indicators within that dimension. A score for each pillar is subsequently computed as the average score of the dimensions in that pillar. The SPI overall score (
(1)
where
2.2SPI country scores
Figure 2.
Country SPI Score. Panel A. SPI Overall Score, 2022; Panel B. Changes in SPI Overall Score, 2016–2022.
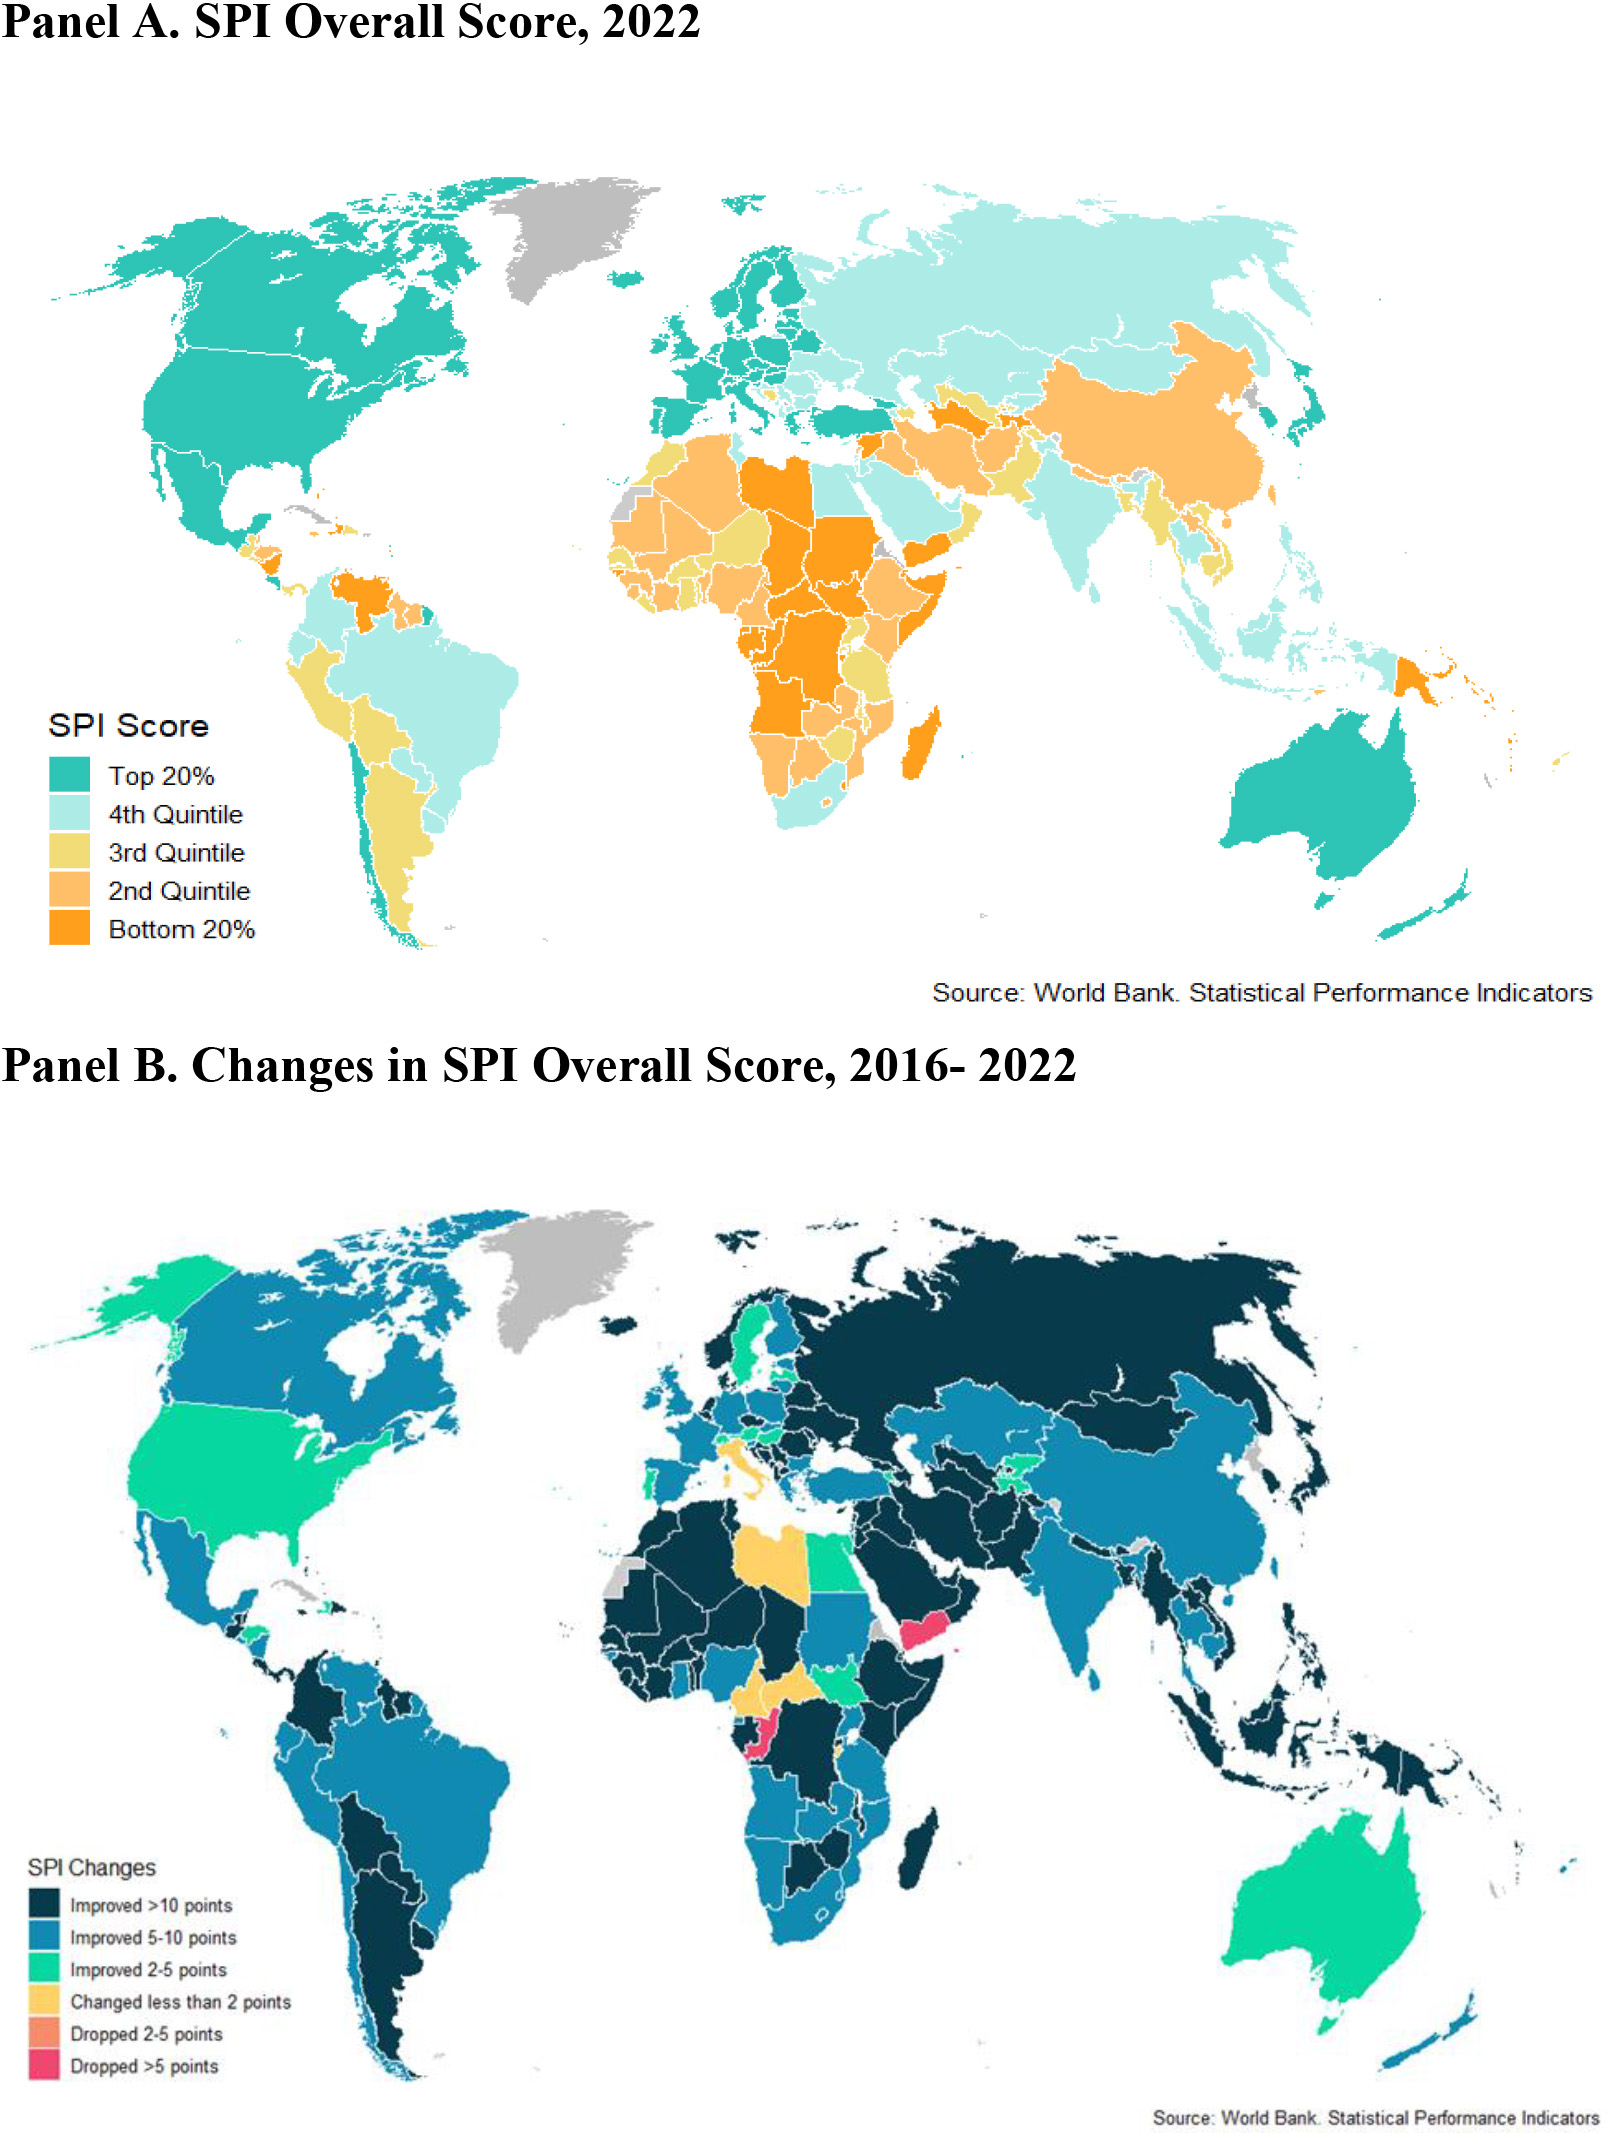
We map in Fig. 2, Panel A the SPI scores in 2022 for all countries. To provide a visual aid with interpretations, the countries are color-coded into five groups based on their performance. Figure 2 shows much heterogeneity for countries in different geographical regions or at different income levels.
Consequently, we examine the SPI in more detail by region and income levels in Table 2.77 Panel A of this table shows that there are large differences across regions. North America is the region with the strongest average SPI (93), which is followed by Europe and Central Asia (85), South Asia (67), Latin America and the Caribbean (65), East Asia and the Pacific (64), Middle East and North Africa (64), and Sub-Saharan Africa (58).
While Panel A notes the countries with the minimum and maximum scores for each region in parentheses, significant variation in the SPI overall score exists within regions. For instance, Fig. A.1, Panel A (Appendix A) shows that in the Latin America and Caribbean region, Costa Rica is the country with the highest SPI score of 89, while Haiti, one of the lowest-scoring country in the region, earns a far lower score of 39.6. In Sub-Saharan Africa, the highest-scoring country is South Africa with a score of 82.4, while the lowest-scoring country is South Sudan with a score of 33.8. In the East Asia and Pacific region, the top-scoring country is Australia with a score of 89.9, while the lowest-scoring country is Nauru with a score of 32.6.
Table 2
SPI overall score by region and Income Level
| Group | Mean | Min | Max |
|---|---|---|---|
| Panel A: By region | |||
| East Asia and Pacific | 64.3 | 32.6 (Nauru) | 89.9 (Australia) |
| Europe and Central Asia | 84.6 | 31.4 (Turkmenistan) | 93.6 (Finland) |
| Latin America and Caribbean | 65.5 | 39.6 (Haiti) | 89.9 (Costa Rica) |
| Middle East and North Africa | 64.3 | 24.4 (Libya) | 83.4 (West Bank and Gaza) |
| North America | 92.9 | 92.8 (United States) | 92.9 (Canada) |
| South Asia | 66.9 | 58 (Afghanistan) | 79.1 (Sri Lanka) |
| Sub-Saharan Africa | 58.4 | 33.8 (South Sudan) | 82.4 (South Africa) |
| Panel B: By income level | |||
| Low income | 54.4 | 31.9 (Syrian Arab Republic) | 70.7 (Uganda) |
| Lower middle income | 62.6 | 35.3 (Micronesia, Fed. Sts.) | 84 (Mongolia) |
| Upper middle income | 68.5 | 24.4 (Libya) | 90.7 (Georgia) |
| High income | 81.1 | 32.6 (Nauru) | 93.6 (Finland) |
| Not classified | 52.3 | 52.3 (Venezuela, RB) | 52.3 (Venezuela, RB) |
Note: countries with the minimum and maximum scores are shown in parentheses next to their scores.
We further examine the SPI score by income levels in Table 2, Panel B. This panel shows that countries with a higher income level have a higher SPI score. In particular, high income countries have an average SPI of 81, which is followed by upper middle income countries (69), lower middle income countries (63), and low income countries (54). In terms of relative differences, the SPI score for high income countries is 19 percent higher than that of upper middle income, 29 percent higher than that of lower middle income countries, and 50 percent higher than that of low income countries. Overall, the Pearson correlation in 2022 between (logged) GDP per capita and the SPI overall score is 0.58.88
Figure 2, Panel B further plots the changes in the SPI scores over the period 2016–2022. Most countries improved their score over this period. Countries that improve the most (more than 10 points) spread across different regions and include Chile, India, Indonesia, and Russia. On the other hand, certain countries such as Yemen perform worse, perhaps due to its ongoing conflicts. More details on changes in the SPI scores by region and income levels are shown in Appendix A, Table A.2.
We provide full overall scores and pillar scores for all countries in 2022 in Table A.1 (Appendix A). Further analysis shows that all the SPI pillar scores are positively correlated with one another, but no perfect correlation exists, suggesting that each pillar provides additional information on a country’s statistical performance. Compared to richer countries, low-income countries perform worse regarding data infrastructure and data sources [15].99 The SPI is publicly available at www.worldbank.org/spi.1010
Table 3
Comparing the SPI and the SCI
| No. | Characteristics | SPI | SCI |
|---|---|---|---|
| 1 | Years covered | 2016–2022 | 2004–2020 |
| 2 | Number of covered countries for overlapping years (unique scores) | ||
| 2016 | 167 (167) | 145 (83) | |
| 2017 | 174 (174) | 145 (87) | |
| 2018 | 174 (174) | 145 (86) | |
| 2019 | 174 (174) | 145 (83) | |
| 2020 | 181 (181) | 145 (83) | |
| 2021 | 181 (181) | N/A | |
| 2022 | 186 (186) | N/A | |
| 3 | Number of indicators | 51 | 25 |
| Annually collected | 44 | 25 | |
| Non-annually collected | 7 | 0 | |
| 4 | Data sources (%) | ||
| Public International Databases | 86 | 80 | |
| NSO website | 14 | 20 | |
| Total | 100 | 100 | |
| 5 | Aggregation method | 3-level nested weight | Simple arithmetic weight |
| 6 | Conceptual framework | Yes | Not clear |
| 7 | Mathematical foundation | Yes | No |
| 8 | Dimensions | Covers 5 data dimensions (data use, data services, data products, data sources, and data infrastructure) | Covers 3 data dimensions (data products, data sources, and data infrastructure) |
| 9 | Agricultural data | More | Less |
| 10 | Focus | Sustainable Development Goals | Millennium Development Goals |
Note: All the numbers are for the latest overlap year (2020) between the two indexes, unless otherwise noted. The numbers of unique scores are shown in parentheses next to the number of covered countries in each year. “N/A” denotes “not available”. All indicators are annually collected in the SPI, except for indicators produced by Open Data Watch, which are collected on a two-year cycle (indicators in dimension 2.2 and 4.3).
3.SPI and SCI
We turn next to comparing the SPI and the SCI. The SPI has several advantages over the SCI on both the conceptual and empirical fronts. In general, it better responds to the modern data landscape as well as countries’ current operational needs to monitor and improve their statistical capacity. In particular, the SPI explicitly offers standard desiderata for a statistical index (i.e., simple, coherent, motivated, rigorous, implementable, replicable, incentive consistent) [32].
Table 3 compares various features of the SPI against those of the SCI. The SPI offers data from 2016 onwards, while the SCI covers the period 2004–2020 (row 1). Further examining the overlap period 2016–2020 for the two indexes, Table 3 shows that the SPI covers between 167 and 186 countries (which include both low-income and high-income countries and more countries over time due to better data sources), while the SCI focuses on 145 non-high-income countries only (row 2). The importance of the new addition of high-income countries should not be underemphasized, since for the first time, the SPI allows for comparison of the strengths of well-regarded NSSs with the less-developed institutions in lower- and middle-income countries as well as measurement of the differences between low- and high-income countries regarding their capability to produce and disseminate statistical products and services [30].1111
Besides more country coverage, the SPI has better measurement power over distinguishing country scores. The SPI offers unique scores for all the countries (numbers in parentheses in row 2) during 2016–2020, which implies that the SPI can distinguish each and every country’s statistical performance. In contrast, the SCI offers a unique value for just more than half of the countries it covers in the same period, implying that it can distinguish only around half of these countries regarding their statistical capacity.1212 Furthermore, the SPI offers 51 indicators, which is more than twice the 25 indicators provided by the SCI (row 3). The majority of the SPI indicators are collected on an annual basis (44 out of 51 indicators) and the SPI has a greater number of such indicators (44 indicators collected annually in the SPI versus 25 for the SCI), although as a percentage the SCI had a higher share collected annually (86% for the SPI versus 100% for the SCI).
The SPI and the SCI both follow the guiding principles that the source data should be publicly available and meet certain quality standards (e.g., as provided by the curators of the international databases). Consequently, the two indexes largely collected data from publicly available, international databases (around 80 percent) and collect the remaining data from NSO websites (row 4).
Conceptually, the SPI has much clearer conceptual framework and it is built on a clear mathematical foundation with three-level nested weighting structure that offers desirable properties for an index such as symmetry, monotonicity, and subgroup decomposability [32]. These features are not available with the SCI (rows 5–7). Specifically, the SPI consists of five pillars of data use, data services, data products, data sources, and data infrastructure, which provide an updated characterization of a modern NSS. In contrast, the SCI offers zero coverage for the first two dimension (i.e., data use, data services) and only covers the three latter dimensions of the SPI (i.e., data products, data sources, and data infrastructure) (row 8; also see [31] for more discussion).
Regarding agricultural data, the SPI has more indicators related to agriculture than the SCI. In particular, the SCI only looks at the availability of an agriculture census and the availability of child stunting indicators. The SPI includes those, but also covers the availability of agricultural surveys. Furthermore, it additionally covers all the indicators related to agriculture, food, and nutrition under SDG number 2 (row 9).
Finally, the SPI cover indicators related to the SDGs, while the SCI cover indicators related to the (older) MDGs (row 10). Specifically, the SPI offers 22 indicators related to the SDGs, with two indicators provided by the World Bank. We provide a mapping of the SPI indicators to the SDG indicators in Table A.3 (Appendix A).
Figure 3.
Scatter plot and Trends of SPI and SCI Overall Scores for 2016–2020.
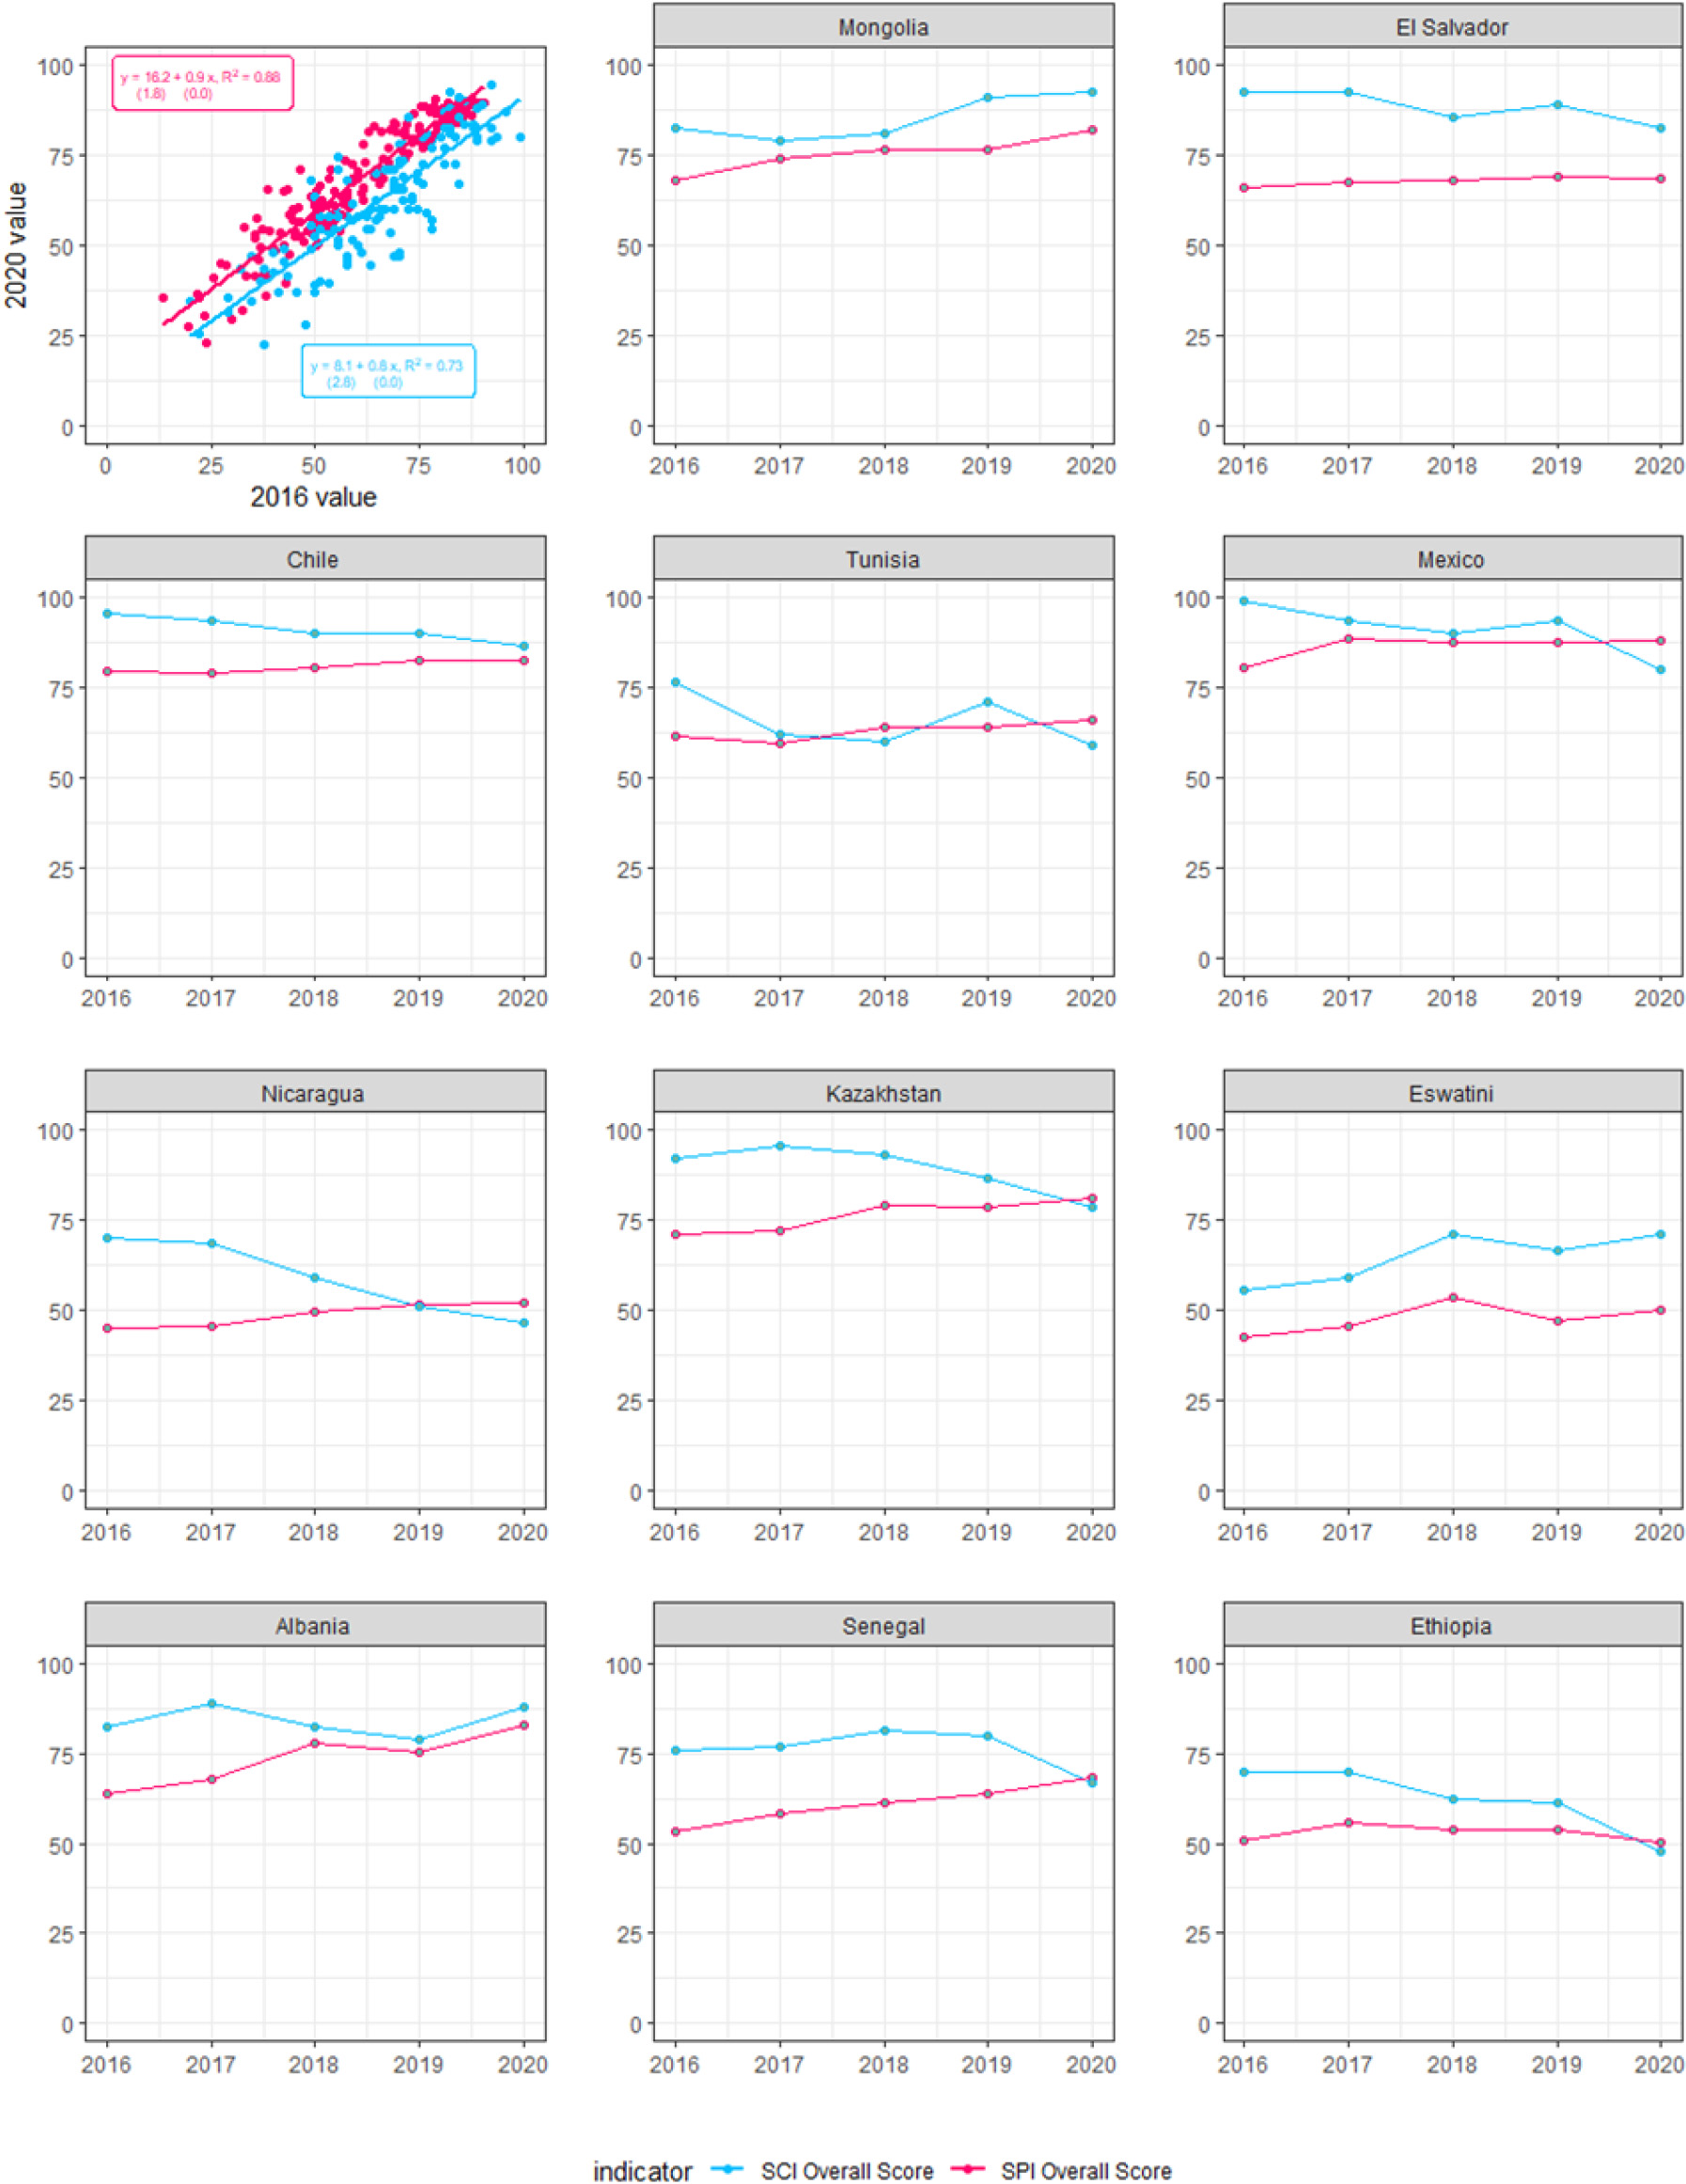
As a further check, we compare the volatility of the SPI and the SCI over time. Since country statistical capacity typically takes time to build up and so tends to change gradually, rather than abruptly [18, 32], an index is generally preferable if it has less volatility.1313 For the overlapping years, 2016 to 2020, the SCI has slightly more volatility during this period with an average standard deviation of 4.2, while the corresponding figure for the SPI is 3.9. For a visual illustration, Fig. 3 plots the relationship between the overall scores in 2016 and 2020 for the two indexes and some randomly selected countries. Regressing the 2020 SPI scores on the 2016 SPI scores provides an R2 of 0.88, which is stronger than that of 0.73 for the SCI (top left corner panel). Some countries are shown to have more fluctuations with their SCI scores than the SPI scores in this period. In particular, El Salvador, Ethiopia, Mexico, Mongolia, and Tunisia stand out. Some countries including Chile, Kazakhstan, Mexico, Nicaragua, and Senegal even show opposite trends for the two indexes.
While in-depth analysis is necessary to offer further insights into these countries, Mexico offers an illustrative case study. The country’s National Institute of Statistics and Geography (INEGI) offers high-quality data and statistics, contributing to the country’s maximal score on data use and excellent SPI scores on data services, data products and data sources (Appendix A, Table A.1). Various factors are regarded as conducive to INEGI’s success, such as its full technical and management autonomy from the government, democratic political environment, and the willingness to adopt international standards [38, 39]. This is consistent with the finding that an NSO’s independence has a positive correlation with its SPI score [19].
4.Relationship with key agricultural development indexes
Development practitioners are typically interested in how well the statistical tools can help them evaluate a country’s performance in specific sectors. We thus examine the correlations between the SPI, the SCI and five common agriculture-related indexes produced by different organizations. The aim in this section is to examine whether the indicators of statistical capacity and performance are correlated with important agricultural development outcomes. And, if both are correlated, to examine if one is consistently more correlated with outcomes of interest. The outcomes include Food and Agriculture Organization’s prevalence rates of undernourishment and severe food insecurity [40], the Economist’s global food security index [41] and food sustainability index [42], and the United States Department of Agriculture’s international agricultural productivity index [43]. We also add three other key development indicators, including the headcount poverty rate (using the daily $2.15 poverty line), GDP per capita, and an SDG progress index [22].
Figure 4.
Absolute Value of Pearson Correlations between the SPI and the SCI and Key Agriculture Indexes. Note: The Pearson correlation coefficients are fully shown with the statistically significant levels in Table A.7. The correlations are shown for the averaged value of the index over the most recent two consecutive years (to reduce volatility). The years used for the indicators are: $2.15 poverty headcount rate (2021–2022 or latest two years available), GDP per capita (2021–2022 or latest two years available), SDR: SDG Index Score (2021–2022), Prevalence of Undernourishment (2019–2020 or latest two years available), Prevalence of Severe Food Insecurity (2020–2021 or latest two years available), EIU: Global Food Security Index (2021–2022), EIU: Food Sustainability Index (2021), USDA International Agriculture Productivity Index (2019–2020).
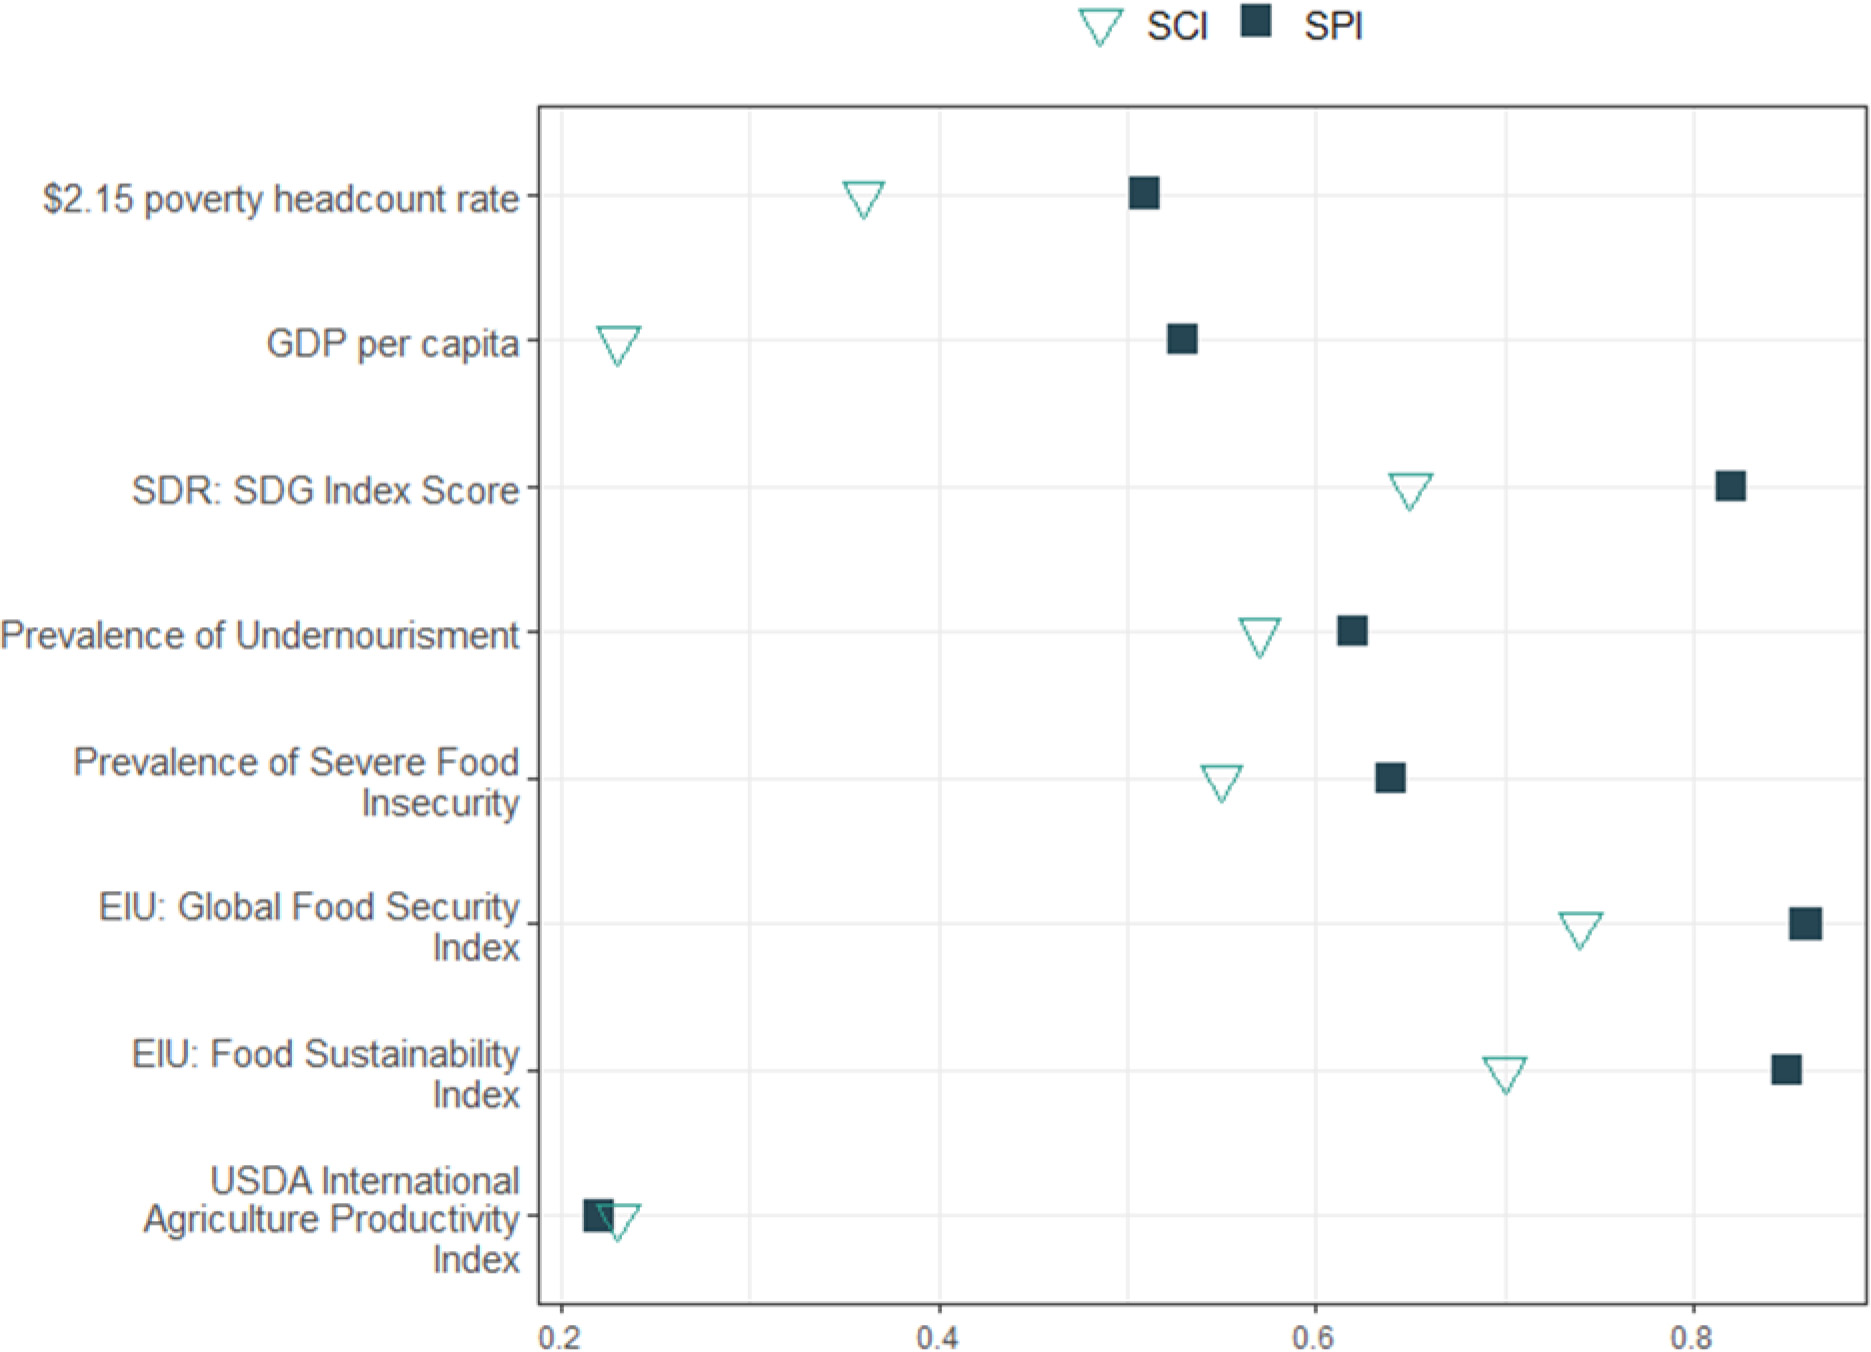
The results, plotted in Fig. 4, show that the SPI has a stronger Pearson correlation with all the indexes except for the USDA’s agricultural productivity index where its correlation is almost the same as that of the SCI. Notably, the SPI’s correlations with six indexes are statistically significant different from those of the SCI (Appendix A, Table A.4).
5.Further reflections on the way forward
We propose a set of rules that will be followed by the World Bank’s SPI team to update the SPI over time. These rules cover the quality control of new releases, the frequency and timing of data releases, the processes regarding updating and adding of indicators, versions of the SPI, and countries’ recourse. While these rules could be further improved in the future, setting up these rules can offer both transparency (regarding how the overall index scores can be expected to evolve as new data becomes available) and data comparability over time.
We also follow the guiding principle that data gaps affecting various dimensions of the SPI framework will be addressed in partnership with the international community. This will also involve developing new methodologies and constructing new data sets for measuring areas not yet measured. The result will be to produce a new set of indicators to include as part of the SPI, including in the SPI overall score, pillar scores, and dimension scores.
The adaptable and dynamic nature of the SPI framework is one of key features and innovations over existing approaches. However, any changes to or additions of the indicators is expected to affect the comparability of the SPI overall score, pillar scores, and dimension scores from one vintage of the data to the next. If these changes are not implemented well, this could potentially diminish the utility of the index scores.
We discuss next the governance of the SPI and the proposed rules to update the SPI over time.
5.1Governance of the SPI
A new SPI Working Group (SPIWG), headed by the Chief Statistician of the World Bank and comprised of experts at the World Bank, will be established to provide an annual review of SPI data, to provide guidance on methodology, and to ensure that the data quality assurance practices discussed in this document are followed.
The composition of the SPIWG will be as follows. The Chief Statistician of the World Bank chairs the SPIWG. Staff from the World Bank Practice Groups and Regions will participate as members on a rotating basis, as follows: Practice Group and Regional Chief Economists and Operations Directors will be invited to become members or to nominate staff to represent them. Because the Poverty GP manages statistical capacity building operations at the World Bank, the Poverty Global Director or a representative designated by this Global Director will be a permanent member of SPIWG. Three external (ex officio) observers will be invited to attend SPIWG meetings as needed and appropriate, from whom advice or input may be solicited by SPIWG members. These ex officio observers may be invited, for example, from academia, other international agencies, the International Association of Official Statistics (IAOS), or a current or former chief statistician of a national statistical office.
The SPIWG’s scope of responsibilities includes, but is not limited to, the following:
• Reviewing and approving SPI data and the index before each release.
• Reviewing and approving:
– Changes to the SPI pillars and dimensions.
– Changes to the methodology for scoring indicators.
– The inclusion of new indicators in the SPI.
– Updated methodologies or data sources.
The SPIWG does not address issues related to how World Bank operational teams may utilize SPI data for operational or research purposes. Rather, an SPI focal point will be named by the World Bank Chief Statistician to liaise with World Bank operational teams.
Prior to each release of the SPI, the SPI team will disseminate data to World Bank country poverty economists who will be given a window of at least 2 weeks to comment on the data before release. Following this review and at least one month prior to the annual release of SPI data and the index, the SPIWG will ensure that any concerns about the data have been satisfactorily addressed before publication. This will typically take place in March or April. At least one week before the meeting, provisional SPI data and index values along with feedback from the country economist consultation process will be circulated to SPIWG members for review. During the meeting, working group members can provide any feedback or reflections about the data and its collection process. Once the SPI team has addressed this input, the SPIWG will approve the release of the updated data. The discussions and decision process will be documented in meeting minutes. The annual review of the SPI data by these staff and the SPIWG will be done in lieu of an annual Bank wide review.
Methodological reviews may occur on an as-needed basis, and may involve, for example, adjustments to SPI dimensions, scoring of indicators, inclusion of new indicators, or updated methodologies or data sources. Materials will be circulated at least one week before any methodological review meeting. SPIWG members will have an opportunity to ask questions and provide feedback related to the proposed changes. The final decision about any SPI methodological adjustments rests with the chair of the SPIWG, the World Bank Chief Statistician. The discussion and decision process will be documented in meeting minutes.
5.1.1Rule 1. Data releases will follow a consistent quality control process
SPI updates will follow a review process to ensure quality. The SPI team in DECDG will perform a set of rigorous data quality checks that are described in greater detail in [15]. Additionally, World Bank country poverty economists will have an opportunity to review and comment on the SPI data prior to its release. The SPI data will then be submitted to a SPI Working Group (SPIWG) for review and approval prior to release. If data fail these quality checks, they will not be included in the SPI.
Country scores will be sent to the regional directors and country directors for information before each release. Regional reports will be produced for each World Bank region, which include the regional aggregate scores, the scores for countries within each region, and time trends.
5.1.2Rule 2. The data series and indices will be updated annually
To enable users to use the data and indices in a predictable way, the SPI will be updated annually on a consistent timetable. As a first step in updating the indicators, the Bank team will begin collecting all input data for the SPI in January in each calendar year. This includes capturing information such as censuses and surveys that have become available since the last update, as well as all other information needed to produce indicators in the SPI. The appendix contains a table, which provides details about the source and point of contact for each of the 51 indicators in the SPI.
The input data will then be processed, the SPI Working Group will be consulted, and changes will be documented in a “What’s new in the SPI” document. The publication will summarize the newly released data and contain a table showing changes between the current release and the previous release. The data release will typically be by May/June. As such, a typical data release will take around 4 months to complete from data collection in January and publication in May/June of the same year.
5.1.3Rule 3. The pillars and dimensions of the SPI are expected to remain stable and only change with approval from the SPI Working Group
There are five pillars of the SPI: data use, data services, data products, data sources, and data infrastructure. These five pillars are defining features of the SPI and are highly unlikely to change during the life of the project. Changes will only be made in coordination with the SPIWG.
Within the 5 pillars, there are 22 dimensions in the SPI. These dimensions are unlikely to change soon because the SPI was built on a forward-looking framework. When developments to statistical systems require an update to the dimensions of the SPI for it to remain relevant, such an update will be introduced with the approval of the SPI Working Group.
5.1.4Rule 4. New indicators will be added after meeting quality and coverage factors
The underlying indicators measuring the SPI dimensions are based on the information that is currently available. Currently, 8 of the 22 dimensions could not be measured. The ambition going forward is to fill these data gaps.
As such, new indicators are expected to be introduced over time. Before adding new indicators to the SPI, the methodology will be presented to the SPI Working Group for their approval. This is intended to ensure that any new indicators added to the SPI are of high quality and add value. The key criteria for inclusion will be its relevance for measuring the performance of statistical systems.
Apart from deciding whether an indicator should be included as part of the SPI, another issue is whether it should be part of the SPI index. Additional criteria will be used to judge whether an indicator will be included in the index. The indicator’s country coverage and time coverage will be important factors. Complexities can arise if new indicators do not cover the same number of years or countries as the existing indicators in the index, affecting comparability. The SPI Working Group will review whether an indicator meets the bar for inclusion in the index before approval.
In circumstances where the SPI team suggests that an existing indicator should be modified or removed, it will be done in consultation with the SPIWG. The SPI expects that all indicators will be reviewed on an approximately three-year cycle. Additionally, indicators may be reviewed on an ad hoc basis. If existing indicators are modified, the changes will be applied to data points in all years of the new vintage, so that the SPI data are backwards comparable. Additionally, the SPI team continues to maintain the SPI github repository, so users can track changes to the input information collected in detail through the version control tools of Github.
5.1.5Rule 5: All versions of the SPI data series will remain available to users
The SPI is built on a dynamic framework, which means that new indicators are expected to be introduced as new data sources become available. Changing the number of indicators within a dimension comes with a tradeoff between comparability with prior vintages of the SPI and improved measurement. While introducing new indicators will improve the measurement of statistical performance, the overall SPI score and dimension sub-scores can change and no longer be comparable to prior vintages.
This can have implications for users of the SPI who are tracking progress according to the initial set of indicators. Each time new indicators are introduced, older versions of the SPI index (that do not contain the new indicators) will be archived. An older vintage will be maintained by the SPI team if approved by the SPI Working Group. The archived series will be made available in the SPI github repository and in the World Bank’s data catalog for the public to access. All changes to methodology will be tracked through a publicly available github repository and all code and underlying data to produce the indicators will be published. The github repository documents every change in the data and code of the entire project dating back to July 2020. Any user can view how an indicator was constructed, and any change to the code or data that took place back to July 2020. Using the github repository, users will be able to recreate and continue an old vintage of the SPI data series into the future as their needs may require.
5.1.6Rule 6: Countries will have a process for correcting/updating data
The data for the SPI are collected from established public and open sources. The SPI team makes every effort to ensure that the data presented in the SPI are accurate, but it is possible that data from the sources for constructing the SPI are occasionally not up to date or accurate despite these efforts. Countries and all other users can inquire about the values that make up the indicators through contacting the Bank directly or via SPI@worldbank.org.
The SPI relies primarily on databases maintained by specialized international organizations. These organizations, such as the IMF, ILO, FAO, and UNSD, are in the best position to determine whether certain data methodologies are being followed, such as whether international standards of classification of employment, or if data sources are available, such as whether a country has a complete civil registration and vital statistics system (CRVS). A country or organization looking to update data used for the SPI from one of these sources are encouraged to get in touch with the respective organizations about updating the relevant information or submitting new data to their repositories. The SPI team will facilitate such communication when requested. Table A.9 in the appendix provides details about the data source and point of contact for each of the 51 indicators in the SPI.
The SPI data represents a snapshot in time of what can be found in public data sources. Data that is not updated in the databases of these public sources by the end of December, when the SPI team begins data collection for that calendar year, will not be reflected in the SPI scores for that year. Data updated after the December cut-off point will be reflected in the subsequent SPI releases.
6.Conclusion
We provide a comprehensive comparison between the World Bank’s recently launched Statistical Performance Indicators and Index (SPI) and its predecessor, the Statistical Capacity Index (SCI). We find that the SPI is built on clear conceptual and mathematical foundations, with more sophisticated aggregation method than that of the SCI. We find that the SPI is more strongly correlated with several measures of food security, sustainability of food systems, and a broader measure of health linked in part to food systems and food security (i.e., undernourishment).
The SPI offers a shorter time series but more recent data for the period 2016–2022, while the SCI covers the period 2004–2020. The SPI provides data on up to 186 countries, covering both poorer and richer countries, while the SCI covers only 145 poorer countries. It offers more than twice the number of indicators as that of the SCI, covers more (agriculture) data dimensions, and is more relevant to the SDGs. The SPI also has a stronger correlation with most agricultural development indicators as well as other key indicators. We also propose a set of rules for maintaining and updating the SPI.
Beyond its contributions to monitoring and building country statistical capacity, the SPI offers various promising research directions. One potential venue is to better understand how it compares with other (open) data indexes that are also used to gauge country statistical capacity. Another is to further study whether, and the extent to which, it helps countries improve their progress with the SDGs.
Notes
2 The SCI was also used to study other topics such as country technological development [16] and the impacts of institutions (i.e., the slave trade) on development [17]. The selected studies in Table 1 cover a range of journals, which are generally considered to be top general interest economic journals and leading field journals in development, political science, and econometrics/ statistics.
3 In particular, [30] only examines the SPI data in 2016. [32] compare an early version of the SPI with the SCI. [15] and [31] briefly examine a few features of the two indexes. These include the number of countries and time periods covered for 2020, the pillars, the aggregation methods, operational relevance, some weaknesses, and volatility of the two indexes over 2016–2020. The comparison offers qualitatively similar findings but has a much more limited scope than what we offer in this paper.
4 While measuring a country’s statistical capacity is our ultimate goal, this task is difficult, if not impossible to implement at scale for all countries, given the typically unobserved inherent characteristics with an NSS. It is, however, relatively more straightforward to measure a country’s statistical performance through objective and comparable indicators. This challenge is highlighted by a large number of indicators with missing data that we discuss later. Also see [32] for further discussion on this and the desiderata.
5 Figure A.1 [15] offers an alternative visual description of the beneficial interactions of the different data pillars, which reinforce each other through stakeholders’ partnership, joint accountability, better capacity, and meeting user needs. Improvements in performance can be represented as a virtuous data cycle that can become self-sustaining.
6 It is based on [33] counting method, which was employed to construct a social exclusion index [34] and to measure adjusted multi-dimensional poverty [35].
7 The regional and income group averages are unweighted country averages since we considered the unit of analysis to be the statistical system of a country.
8 We examine a related ranking of the SPI by World Bank’s country lending status, which shows a similar positive correlation between country income level and its SPI score. In particular, the SPI scores are lowest for IDA (poorest) countries and highest for unclassified (high-income) countries. Similarly, dividing countries into FCS (Fragile and Conflict) status versus non-FCS status respectively yields the scores of 73 and 51 for the former and latter groups of countries (results are available upon request).
9 [30] provides further multivariate regression analysis on other determinants of SPI scores using the SPI score in 2016, which suggests that the SPI is positively and significantly correlated with the economic complexity index, more educated populations and more developed civil society (as measured by the voice and accountability index). Using similar control variables, we estimate richer panel data models, which show that these results largely do not hold when the country fixed effects are included (Results are available upon request.). While further analysis is necessary, this highlights the importance of analyzing panel data models for more rigorous results.
10 The associated code and underlying raw data are available at our project site https://github.com/worldbank/SPI.
11 This is further seen in Fig. A.2 (Appendix A), which plots the standardized distributions of the two indexes for each overlapping year and all the overlapping years. The SPI has bi-modal distributions since it covers both low-income and high-income countries. Its distributions also have longer tails than those of the SCI due to the more countries it covers.
12 While the SPI offers complete data on all the indicators (and the index) for up to 186 countries, it also provides data on some indicators for 218 countries. Of the 51 indicators, 44 indicators are used to construct the SPI overall score. For each specific pillar of the SPI, there are 18 unique scores for Pillar 1 on data use. The data use indicator is coming solely from pillar 1.5 on data use by international organizations. For Pillar 2, there are 163 unique scores, whereas for Pillars 3 and 4 there are 172 unique scores. Lastly, there are 20 unique scores for pillar 5.
Acknowledgments
We would like to thank the editors Pietro Gennari and Linda Young, two anonymous reviewers, Lisa Bersales, Joao Pedro Wagner De Azevedo, Mustafa Dinc, Haishan Fu, Pietro Gennari, Johannes Hoogeveen, Christoph Lanker, Hiroko Maeda, Daniel Mahler, Jimmy McHugh, Yongyi Min, Johan Mistiaen, Yusuf Murangwa, Juan Oviedo, Viveka Palm, Carolina Sanchez Paramo, Francesca Perucci, Martin Rama, Walter Radermacher, Tara Vishwanath, and participants at the 63rd ISI World Statistics Congress, the 9th International Conference on Agricultural Statistics, and seminars at the World Bank for useful discussion on earlier versions of this paper. We would like to thank Juderica Dias and Dereje Ketema Wolde for helpful support with the data. We are grateful to the UK Foreign Commonwealth and Development Office (FCDO), formerly the Department of International Development, for funding assistance through various Knowledge for Change (KCP) grants and the Data and Evidence for Tackling Extreme Poverty (DEEP) Research Program.
Supplementary data
The supplementary files are available to download from http://dx.doi.org/10.3233/SJI-230093.
References
[1] | World Bank. Statistical capacity indicators [webpage]; (2020) . Available from: https://datatopics.worldbank.org/statisticalcapacity/. |
[2] | United Nations. Evaluation of the contribution of the United Nations development system to strengthening national capacities for statistical analysis and data collection to support the achievement of the millennium development goals (MDGs) and other internationally-agreed development goals; (2016) . Available from: https//digitallibrary.un.org/record/840707?ln=en. |
[3] | Organisation of Islamic Cooperation (OIC). Current State of Statistical Capacity in the OIC Member Countries. February 2013. Available from https://sesricdiag.blob.core.windows.net/sesric-site-blob/files/article/460.pdf. |
[4] | UNICEF. Progress for every child in the SDG era. UNICEF New York; (2018) . Available from: https//www.unicef.org/reports/progress-every-child-sdg-era. |
[5] | Sanga D, Dosso B, Gui-Diby S. Tracking progress towards statistical capacity building efforts: The African statistical development index. Int Stat Rev. (2011) ; 79: (3): 303-329. |
[6] | Tapsoba SJ-A, Noumon CN, York RC. Can statistical capacity building help reduce procyclical fiscal policy? J Int Dev. (2017) ; 29: (4): 407-430. |
[7] | Henderson JV, Storeygard A, Weil DN. Measuring economic growth from outer space. Am Econ Rev. (2012) ; 102: (2): 994-1028. |
[8] | Sandefur J, Glassman A. The political economy of bad data: Evidence from African survey and administrative statistics. The Journal of Development Studies. (2015) Feb 1; 51: (2): 116-32. |
[9] | Angrist N, Goldberg PK, Jolliffe D. Why is growth in developing countries so hard to measure? J Econ Perspect. (2021) ; 35: (3): 215-242. |
[10] | Hanson JK, Sigman R. Leviathan’s latent dimensions: Measuring state capacity for comparative political research. J Politics. (2021) ; 83: (4): 1495-1510. |
[11] | Hu Y, Yao J. Illuminating economic growth. J Econometrics. (2022) ; 228: (2): 359-378. |
[12] | Martinez LR. How much should we trust the dictator’s GDP growth estimates? J Polit Econ. (2022) . Available from: https//doi.org/10.1086/720458. |
[13] | Oechslin M, Steiner E. Statistical capacity and corrupt bureaucracies. Rev Int Organ. (2022) ; 17: (1): 143-174. |
[14] | Jacob A. Mind the gap: Analyzing the impact of data gap in millennium development goals’ (MDGs) indicators on the progress toward MDGs. World Dev. (2017) ; 93: : 260-278. |
[15] | Dang H-A H, Pullinger J, Serajuddin U, Stacy B. Statistical performance indicators and index: A new tool to measure country statistical capacity. Sci Data. (2023) ; 10: : 146. |
[16] | Anderson DM, Whitford AB. Developing knowledge states: Technology and the enhancement of national statistical capacity. Rev Policy Res. (2017) ; 34: (3): 400-420. |
[17] | Gören E, Winkler A. Statistical capacity matters: The long-term effects of Africa’s Slave Trade on development reflected by nighttime light intensity. Journal of African Economies. (2023) Aug; 32: (4): 383-414. |
[18] | Ngaruko F. The World Bank’s framework for statistical capacity measurement: Strengths, weaknesses, and options for improvement. Afr Stat J. (2008) ; 7. |
[19] | World Bank. World development report 2021: Data for better lives. World Bank; (2021) . Available from: https//wdr2021.worldbank.org/. |
[20] | Sachs J, Kroll C, Lafortune G, Fuller G, Woelm F. Sustainable development report 2021. Cambridge University Press; (2021) . Available from: https//doi.org/10.1017/9781009106559. |
[21] | Sachs J, Lafortune G, Kroll C, Fuller G, Woelm F. Sustainable development report 2022. Cambridge University Press; (2022) . Available from: https//www.sustainabledevelopment.report/reports/sustainable-development-report-2022/. |
[22] | Sachs J, Kroll C, Lafortune G, Fuller G, Drumm E. Sustainable development report 2023. Cambridge University Press; (2023) . Available from: https//doi.org/10.25546/102924. |
[23] | Radermacher WJ. Governing-by-the numbers–résumé after one and a half years. Stat J IAOS. (2021) ; 37: : 701-711. |
[24] | Asher S, Bhowmick A, Campion A, Lunt T, Novosad P. Big, Open Data for Development: A Vision for India. In: Gupta P, Bosworth B, Muralidharan K, editors. India Policy Forum. (2021) ; 18: . SAGE Publishing India; 2022. |
[25] | Bersales LGS. Standards in social statistics: The capacity of national statistical systems to adapt to the international standards, problems, challenges. Stat J IAOS. (2022) ; 38: : 533-543. |
[26] | Ekhator-Mobayode UE, Hoogeveen J. Microdata collection and openness in the Middle East and North Africa. Data and Policy. (2022) ; 4: : e31. |
[27] | Wollburg P, Contreras I, Carletto C, Morales LG, Perucci F, Zezza A. The uneven effects of the COVID-19 pandemic on national statistical offices. Stat J IAOS. (2022) ; 38: (3): 785-803. |
[28] | Bizier V, Gennari P, Navarro DK. Role of international, regional and country organizations in adapting to statistical standards and regional differences: The case of food and agriculture statistics. Stat J IAOS. (2022) ; 38: : 511-532. |
[29] | Gatti R, Lederman D, Islam A, Fan RY, Wood C, Lotfi R, Mousa M, et al. Reality Check: Forecasting Growth in the Middle East and North Africa in Times of Uncertainty. World Bank Policy Research Working Paper No. 10406. (2022) . Available from: https//documents1.worldbank.org/curated/en/099410204122333916/pdf/IDU059a788530925704a0b08f7e0c3e8b9e9d753.pdf. |
[30] | Lokshin M. The highways and side roads of statistical capacity building. Stat J IAOS. (2022) ; 38: : 753-768. |
[31] | Dang H-AH, Pullinger J, Serajuddin U, Stacy B. Reviewing assessment tools for measuring country statistical capacity. IZA Discussion Paper no. 16745. (2024) . |
[32] | Cameron G, Dang H-A, Dinc M, Foster J, Lokshin M. Measuring the statistical capacity of nations. Oxford Bull Econ Stat. (2021) ; 83: (4): 870-896. |
[33] | Atkinson AB. Multidimensional deprivation: Contrasting social welfare and counting approaches. J Econ Inequal. (2003) ; 1: (1): 51-65. |
[34] | Chakravarty SR, D’Ambrosio C. The measurement of social exclusion. Rev Income Wealth. (2006) ; 52: (3): 377-398. |
[35] | Alkire S, Foster J. Counting and multidimensional poverty measurement. J Public Econ. (2011) ; 95: (7): 476-487. |
[36] | Glaeser EL, La Porta R, Lopez-de-Silanes F, Shleifer A. Do institutions cause growth? J Econ Growth. (2004) ; 9: : 271-303. |
[37] | Savoia A, Sen K. Measurement, evolution, determinants, and consequences of state capacity: A review of recent research. J Econ Surveys. (2015) ; 29: (3): 441-458. |
[38] | Dargent E, Lotta G, Mejía-Guerra JA, Moncada G. The political economy of statistical capacity in Latin America: Who wants to know? Inter-American Development Bank. (2018) . Available from: https//publications.iadb.org/en/who-wants-know-political-economy-statistical-capacity-latin-america. |
[39] | SDSN TReNDS, Open Data Watch. Improved Governance and Meaningful User Engagement to Expand Data Use: A Case Study of Mexico’s National Institute of Statistics and Geography. (2023) . Available from: https://opendatawatch.com/blog/mexico-expands-data-use-with-improved-governance-and-user-engagement/. |
[40] | FAOStat. Food security index and prevalence of undernourishment; (2023) . Available from: https://www.fao.org/faostat/en/#data/FS. |
[41] | Economist. Global food security index. (2022) . Available from: https//impact.economist.com/sustainability/project/food-security-index. |
[42] | Economist. Food sustainability index. (2021) . Available from: https//impact.economist.com/projects/foodsustainability/fsi/about-the-food-sustainability-index/. |
[43] | USDA. International Agricultural Productivity index. (2022) . Available from: https://www.ers.usda.gov/data-products/international-agricultural-productivity/. |


