
Data reconciliation and estimation in an agricultural survey
Abstract
The Puerto Rico Census of Agriculture (Census) is the leading source of statistics about the island’s agricultural production. The Census is conducted every 5 years, in years ending in 2 and 7. However, the most recent Census was administered in 2018 due to delays caused by Hurricane Maria. Because the Census list frame is incomplete, a separate survey is conducted to inform measures of undercoverage, nonresponse, and misclassification, leading to adjusted weights. At the time of Hurricane Maria, the 2017 survey had already been conducted in preparation for the planned Census that year. In 2018, the survey was repeated using the same sample. Linking and analyzing the 2017 and 2018 survey data provide insights into the impacts of Hurricane Maria on the island’s agriculture. Furthermore, the 2018 survey gives an opportunity to evaluate the 2018 Census results. Although the same sample was used in 2017 and 2018, automated record linkage methods are not suitable to link records from the two surveys. This paper discusses record linkage and estimation approaches used to determine the number of farms and land in farms in Puerto Rico before and after Hurricane Maria based on the two surveys and the Census of Agriculture.
1.Introduction
As data become increasingly available, National Statistical Offices (NSOs) are increasingly combining data from diverse sources to reduce respondent burden and to produce new or more precise official statistics. Two general approaches to combining data from disparate sources are (1) to combine estimates from each source and (2) to link records, resulting in a record with more variables than any record from a single data source, and then produce estimates.
If a unique identification is associated with each record from all sources, then record linkage can be conducted without error as long as there are no errors in the identification variable. In some cases, no unique identification is available. For example, in the U.S., there is no farm register, which would provide a unique identification number. Record linkage of farms relies primarily on names and addresses. The variability in how these are provided, such as an individual’s name listed as John Brown, John D. Brown, and J.D. Brown on different records, make record linkage challenging, and a small amount of error is common. Understanding how these errors affect estimates is a primary focus of this paper and will be discussed in the context of the 2018 Puerto Rico Census of Agriculture.
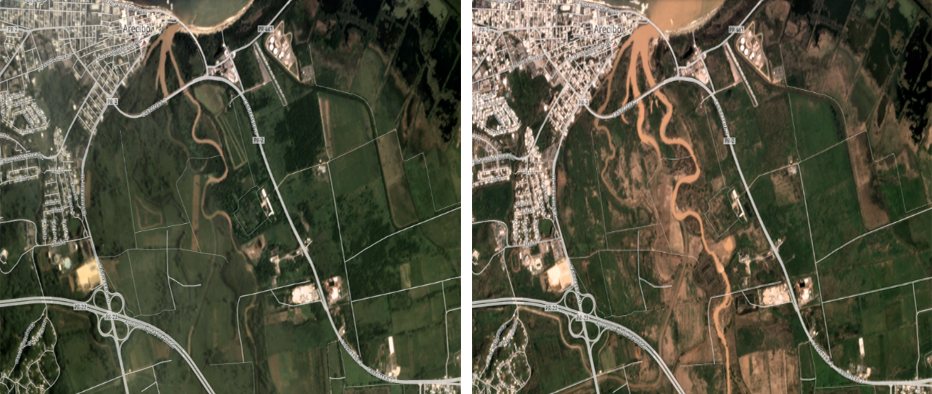
Figure 1.
An agricultural area of Puerto Rico before (left) and after (right) Hurricane Maria.
USDA’s National Agricultural Statistics Service (NASS) conducts the Puerto Rico Census of Agriculture (Census) every 5 years (in years ending in 2 and 7). The Census is the leading source of statistics about Puerto Rico’s agriculture, which includes an enumeration of Puerto Rican farms and the people who operate them. By definition, a Puerto Rican farm is any agricultural operation from which $500 or more of agricultural products were produced and sold, or normally would have been sold, during the Census year [1]. Unlike many other countries, the U.S., which includes Puerto Rico, does not have a farm registry. Thus, NASS has created and maintains a list of all known Puerto Rican farms and potential farms. Potential farms are records having agricultural potential, but have not been confirmed to satisfy the definition of being a farm; that is, they have unknown operating status. NASS screens the potential farm records periodically to determine whether they are farms. In preparation for the Census, the list of farm operations from the previous Census is updated and new farms and potential farms are added based on information from other sources [1, 2, 3]. Shortly before the Census, this list frame is “frozen” (no additional farms or potential farms are added or removed) and becomes the Census Mailing List (CML). During the Census, a questionnaire is sent to each operation on the CML.
Despite the efforts to make the list complete, the CML does not cover all farm operations in Puerto Rico. To measure undercoverage, NASS uses the Agricultural Coverage Evaluation Survey (ACES), which is based on an area frame that covers all land in Puerto Rico. The responding CML and ACES records are matched to determine the records that (1) were only on the CML, (2) were only on the ACES, or (3) were on both the CML and the ACES. Then a capture-recapture approach is applied to Census and ACES records to account for undercoverage, nonresponse, and misclassification in the Census [1, 2, 3, 4, 5, 6, 7, 8, 9, 10, 11, 12, 13, 14, 15].
The Puerto Rico Census of Agriculture was to be conducted in 2017. However, preparations were disrupted when, on September 20, 2017, Hurricane Maria devastated the island. Given the damage to the infrastructure, NASS decided to conduct the Census in 2018, thereby delaying it by one year. Although the 2017 ACES data had already been collected as scheduled, the survey was repeated in 2018 using the same sample.
Hurricane Maria had a major impact on Puerto Rico’s agriculture with agricultural land being washed out in many areas (see Fig. 1). NASS anticipated this could have resulted in a large drop in the number of farms but could have also led to the formation of new farms. Each ACES can be used to estimate the number of farms, land in farms (amount of land devoted to farming), and other farm characteristics. By using a longitudinal survey in 2017 and 2018, NASS had an opportunity to estimate the numbers of farms that sustained production, went out of business, and started business in the aftermath of Hurricane Maria. This provides insight into Puerto Rico’s agriculture before and after Hurricane Maria.
To explore the impact of the hurricane on Puerto Rican farming, the 2017 and 2018 records needed to be linked. Automated record linkage methods could not be used for this purpose because record identifiers were not kept the same in 2017 and 2018. Thus, name and address (N&A) information on electronically saved images of completed survey questionnaires were manually compared. The number of farms and land in farms before and after Hurricane Maria were then estimated by using information obtained from the manual record linkage of the two surveys. Estimates were also obtained from the 2018 Puerto Rico Census of Agriculture.
This paper highlights the effects that uncertainty in record linkage have on quantifying some of the impacts of Hurricane Maria on Puerto Rico’s agriculture. The approaches used to link the 2017 and 2018 survey records and to estimate the number of farms and land in farms from the two surveys as well as the 2018 Census of Agriculture are discussed. In Section 2, the Census and the ACES are described. The methods used to link and compare the 2017 and 2018 ACES records are outlined in Section 3. In Section 4, the ACES and Census estimation methods are presented. The results and discussion are provided, respectively, in Sections 5 and 6.
2.The Census and the ACES
2.1The Census
The Census sampling frame is a list frame. The list contains both agricultural operations that are in the target population (farms) and operations that are not in the target population (non-farms). List building activities for the 2018 Census started in 2015 with updating information from respondents to the 2012 Puerto Rico Census of Agriculture [1]. New farms and potential farms were identified from a variety of agricultural sources and added to the list frame. Measures were taken to improve the quality of the N&A information, and record linkage programs were run to detect and remove duplicate records. The list frame was “frozen” in September 2018, and the frozen frame became the official CML for the 2018 Puerto Rico Census of Agriculture. The CML had a total of 21,378 records.
Census data collection was primarily conducted by mail, but producers who preferred to report online were also provided with a Computer-Assisted Self-Interviewing (CASI) instrument [1]. Nonresponse follow-up and in-person enumeration were conducted for selected operations that could have significant impacts on the accuracy of Census estimates. Hurricane Maria negatively impacted Puerto Rico’s infrastructure, which had not been fully restored by the time of data collection for the 2018 Census. Consequently, Census data collection was extremely challenging, and the 2018 Census response rate dropped to 29.1%, well below the 55.5% response rate of the 2012 Census [1].
2.2The ACES
The ACES collects information about Puerto Rico’s crops, livestock, and type and size of farms, among other important measures. The sample is drawn from an area frame stratified by municipios (incorporated towns and cities) as the distribution of crops and livestock can vary considerably within and across the municipios. Within each municipio, land is first stratified based on cultivation percentage and then sub-stratified by similarity of agriculture. The land within each substratum is divided into primary sampling units (PSUs), and PSUs are randomly sampled from each substratum (See Fig. 2). The selected PSUs are partitioned into segments, each of which has an area of about one square mile (about 659 cuerdas, where 1 cuerda
Figure 2.
Puerto Rico ACES sampling frame.
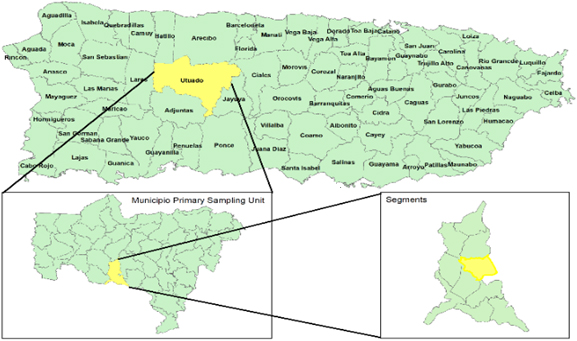
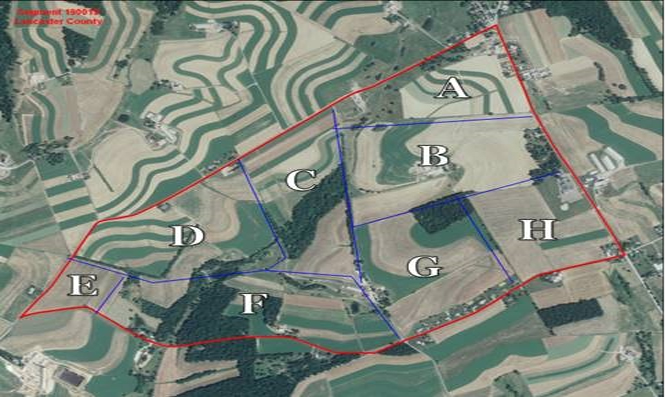
Figure 3.
ACES segment and tracts A-H within the segment.
The survey is conducted in two phases: pre-screening and data collection. Sampled segments are pre-screened in May, June, and July. In this phase, interviewers visit their assigned segments to identify segment boundaries, segment layout, non-agricultural areas within the segment, and the N&As of possible contacts associated with segment tracts. An area screening form, which is completed for each sampled segment, provides an inventory of all tracts within the segment and contains screening questions that determine whether each tract has agricultural activity. The screening applies to all land in the identified operating arrangement (i.e., both inside and outside the segment). Screening both inside and outside of the segment is important to determine whether the land is associated with an agricultural operation, whether or not the agricultural activity occurs within the segment. A tract is considered agricultural if it has qualifying agricultural activity either inside or outside the segment; otherwise, it is defined as non-agricultural. Non-agricultural tracts belong to one of three categories: (1) non-agricultural with potential, (2) non-agricultural with unknown potential, or (3) non-agricultural with no potential.
During the data collection phase of ACES, the producers of those operations (tracts) that qualify as agricultural are interviewed using the ACES questionnaire, which collects detailed agricultural information about all of the producer’s land, both inside and outside the segment. Interviewers are instructed to estimate tract-level agricultural data when a producer is either inaccessible for an interview or refuses to participate in the survey [16]. These estimated tracts are a source of response error and may result in the misclassification of farm status. An agricultural tract is classified as a farm if its entire operation qualifies with at least $500 in agricultural sales or potential sales. All non-agricultural tracts and agricultural tracts with less than $500 in sales are classified as non-farms. Sales or potential sales are obtained by combining data from all tracts within each farm, and the $500 threshold is applied at the farm level.
Identifying all unique operations (tracts) within a segment is challenging. In the conterminous U.S., the June Area Survey (JAS) is conducted annually based on an area frame. The JAS has a rotating panel design with about 20% of the units leaving and another 20% entering the sample each year. For each panel, the JAS has the same basic design as the ACES. In 2009, NASS conducted the Farm Numbers Research Project (FNRP), a one-time follow-on survey to the JAS segments [17]. For the FNRP, all non-agricultural or estimated tracts in the panel of units new to the 2009 sample (2009 segments) were revisited and the farm status determined. The study indicated that the JAS has substantial misclassification. The dense vegetation and often rolling landscape in the agricultural regions of Puerto Rico make identifying tracts particularly challenging. This issue was exacerbated after Hurricane Maria damaged or destroyed many of the island’s roads [18].
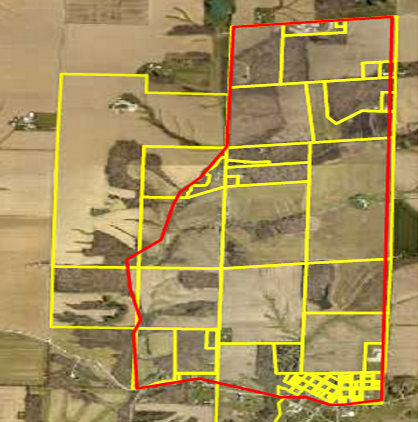
NASS has explored the use of geo-referenced real estate property information to aid in the identification of potential farms in the JAS [19]. Centro de Recaudación de Ingresos Municipales (CRIM) is a Puerto Rican government agency responsible for collecting property tax information. All properties (e.g., apartments, buildings, houses and farms) registered with CRIM, have a unique number or “número de catastro”. The “catastro” digital (https://portal.crim360.com/crimpr/index.htm) compiles all the registered properties with different levels of information (e.g., owner, structures, boundaries and other) attached to each property in a geospatial format. NASS provided CRIM with the 2018 ACES segment boundaries in Geographic Information Systems (GIS) format (See Fig. 4). In turn, CRIM provided NASS with a geo-database of property parcels. These parcels were intersected against the 2018 ACES segments and clipped to only show the parcels within the ACES segments (See Fig. 5). N&A information accompanied many of the property parcels. This information was available to aid with pre-screening ACES segments in 2018, but not 2017.
Figure 4.
Area outlined is a sampled ACES segment.
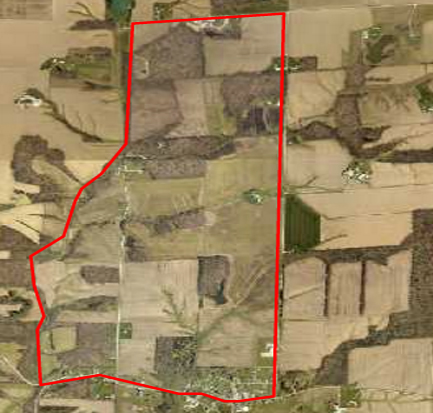
Figure 5.
ACES sampled segment intersected with CRIM parcels.
3.Linking the 2017 and 2018 ACES records
The same 300 segments were surveyed in both the 2017 and 2018 surveys. In 2017, each tract within a segment was outlined on the segment map and given a tract identification number. The combined segment and tract identification numbers uniquely identified each tract. Because the 2017 sample was intended for use only in 2017, the mapped boundaries of each tract within the segment were not preserved. Thus, in 2018, new tract identification numbers were assigned to tracts within a segment. Consequently, although the 2017 and 2018 samples could be linked at the segment level, they could not be linked to the specific tract within a segment based only on segment and tract identification numbers.
Figure 6.
The first page of a 2018 Feith image. 2017 and 2018 Feith images were used to link 2017 and 2018 ACES tracts.
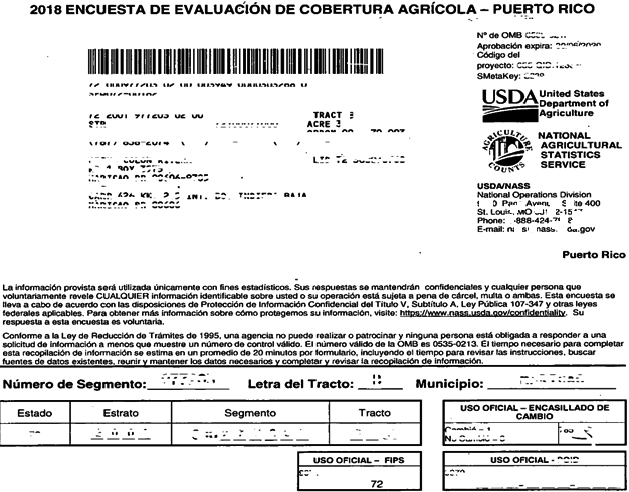
To ensure proper linkage of the records from the two surveys, information on electronically saved images of completed 2017 and 2018 ACES questionnaires (hereafter, Feith images) were compared (See Fig. 6). These questionnaires, which were completed by NASS interviewers, contain the N&As of the producers associated with each tract. Using the Feith images, within each of the 300 segments, the 2017 tract producer N&A was manually compared to the 2018 tract producer N&A. Thus, the N&A comparisons were made for 2017 and 2018 tracts within the same segment. In some situations, tract-level information (such as the year of establishment of the operation) was used to supplement N&As in linking tracts. If the producer N&A was the same on the Feith images, the 2017 and 2018 tract records were identified as “linked.” Whenever the tract identification numbers differed for linked records, the number for one tract was revised so that the two matched. In some cases, there were similarities between 2017 and 2018 tracts within a segment, but the differences were substantial enough to make the linkage questionable; these record pairs were identified as “uncertain-link” tracts. For example, a segment with 5 tracts in each year may have four pairs of tracts linked but names or addresses may be missing for the remaining pair of tracts. Such tracts were classified as having uncertain links as the tracts can possibly represent the same or different operations in 2017 and 2018. If the N&A information on a tract in a segment from one year differed from the N&As of all the tracts in that segment from the other year, it was unknown whether this was due to the farm having a new owner, having become part of another farm, not being identified in the other year, or not being linked for some other reason. These records were categorized as “not linked.” Thus, a tract in a segment from one year was identified as ‘not linked’ if its N&A information differed from N&As of all tracts of that segment from the other year. A few records for which Feith images were not available were categorized as not linked.
4.Estimation
4.1Estimation from the ACES
In addition to quantifying the undercoverage of the CML, the ACES can be used to estimate the number of farms, land in farms, and other agricultural characteristics. These are design-based estimates. Because some farms can have land in more than one segment, the tract-to-farm ratio (i.e., the ratio of cuerdas of land in a tract to cuerdas of land in the farm associated with that tract) is an important component of the design-based estimator. Let
(1)
where
(2)
where,
4.2Estimation from the Census of agriculture
To account for undercoverage, nonresponse, and misclassification in the Census, adjusted weights are estimated by applying a capture-recapture analysis [1, 2, 3, 4, 5] and referred to here as capture-recapture weights. The ACES sample is used to assess undercoverage of the CML. The analysis is based on five assumptions [4, 5]: (1) The population must be closed; no farms enter or leave the population during the Census data collection for the CML and ACES records. (2) The CML and area frame are independent; that is, a record’s inclusion on one list is independent of it being on the other list. (3) All farms are equally likely to be caught in each sample. (4) Capturing a farm in one sample does not affect its catchability in the other sample. (5) Lastly, farms caught in the first sample can be identified if they are caught in the second sample. These assumptions imply that the proportion of farms captured by the CML that are also captured by the ACES sample is approximately equal to the proportion of the entire population captured by the CML, allowing estimation of population coverage by the first sample [1, 4, 5, 23].
Because data collection for the CML and ACES records is conducted at the same time, the first assumption is satisfied. NASS has well established processes in place to ensure the independence of its list frame and its area frame, thereby satisfying the second assumption. Although all farms are not equally likely to be captured (assumption 3), models can account for this unequal catchability [23, 24]. Thus far no evidence has been found that capturing the farm from the Puerto Rico list frame impacts the probability of it being captured in the ACES; thus, assumption 4 is likely satisfied. In general, it is challenging to link two lists of farms without error, and linkage error is certainly present in this study. The consequences of the failure of assumption 5 to be satisfied are a primary focus of this paper.
To be recorded as a farm, an operation must be on the CML, respond to the Census, and be classified as a farm based on the Census report. Thus, the probability of capture,
(3)
Although the probability that a farm is misclassified as a non-farm is accounted for in the capture probability in Eq. (4.2), the probability of a farm on the Census being classified correctly as a farm, which is one minus the probability that a non-farm is misclassified as a farm, is not and is thus estimated separately by Eq. (4) [4, 5].
(4)
The capture-recapture weight for farm
(5)
The number of farms on the Census,
(6)
where
The conditional probabilities of coverage, response, and correct classification of farms in Eq. (4.2) are estimated using logistic regression models. The probability of correct classification of a farm by the Census,
Table 1
2017 and 2018 record-linkage results before adjustments
| Year 2017 | Year 2018 | |||
|---|---|---|---|---|
| # Records | Weighted estimate | # Records | Weighted estimate | |
| Linked farms | 219 | 5,911 | 198 | 4,411 |
| Uncertain linked farms | 41 | 1,261 | 39 | 1,008 |
| Not linked farms | 31 | 988 | 95 | 2,097 |
| Linked non-farms | 702 | 723 | ||
| Uncertain linked non-farms | 222 | 224 | ||
| Not linked non-farms | 116 | 1,891 | ||
| Total | 1,331 | 3,170 | ||
5.Results
5.1Linking the 2017 and 2018 ACES records
In the 2017 ACES, a total of 1,331 tracts were surveyed within 300 segments. The minimum and maximum numbers of tracts in a segment were 1 and 20, respectively, with a mean of 4.4 tracts per segment. Of the 1,331 tracts, 291 were farm tracts. The weighted number of farms and land in farms from the survey were 8,160 farms and 453,387 cuerdas, respectively. The 2018 survey included a total of 3,170 tracts within the same 300 segments, where the number of farm tracts was 332. The weighted estimates of the number of farms and land in farms from the 2018 survey were 7,516 farms and 441,774 cuerdas, respectively.
Comparison of N&As on the Feith images from the two surveys resulted in 921 of the 2017 tracts being linked to tracts from 2018 (see Table 1). Of the remaining 410 tracts in the 2017 ACES, 263 (41 farms and 222 non-farms) had uncertain links, and 147 (31 farms and 116 non-farms) had no links to the 2018 ACES records. The 263 tracts with uncertain links in 2017 also were tracts with uncertain links in 2018. Of these, 39 were farms and 224 were non-farms in 2018. A total of 1,986 tracts from the 2018 survey had no links to the 2017 ACES records (95 farms and 1,891 non-farms).
The farm status of the linked farm tracts provides insights into the impact of Hurricane Maria and the recovery that had occurred by 2018 (See Table 2). A total of 185 and 689 of the 921 linked tracts were, respectively, farms and non-farms in both the 2017 and 2018 ACES. Of the 198 linked tracts that were reported to be farms in the 2018 survey, 13 were reported to be non-farms in 2017. However, upon review of the 2018 responses for these 13 records, all were reported to have been formed prior to 2017. Thus, these tracts were likely misclassified during the 2017 ACES pre-screening process, and their 2017 farm status was changed from non-farms to farms. In addition, 34 of the linked tracts that were farms in 2017 were non-farms in the 2018 survey, reflecting the many farm operations that went out of business due to the hurricane.
Table 2
Adjusted farm status of the linked 2017 and 2018 ACES records
| Year 2018 | Total | ||
| Year 2017 | Farms | Non-farms | |
| Farms | 198 (21.5%) | 34 (3.7%) | 232 (25.2%) |
| Non-farms | 0 (0.0%) | 689 (74.8%) | 689 (74.8%) |
| Total | 198 (21.5%) | 723 (78.5%) | 921 |
The 2018 farm records that had no links or uncertain links to 2017 tracts were also reviewed to determine whether they were in operation prior to 2017 (Table 3). Of the 134 such farm tracts, 35 with uncertain links and 87 with no links were associated with farms that began before 2017 (i.e., a total of 122 farm tracts). Thus, only 12 of the 134 farm tracts were established after 2017.
Table 3
Year of establishment for 2018-farm tracts
| Established | Link to 2017 tracts | # Records | Weighted estimate |
|---|---|---|---|
| Prior to 2017 | Linked | 198 | 4,411 |
| Uncertain linked | 35 | 835 | |
| Not linked | 87 | 1,964 | |
| Since 2017 | Linked | – | – |
| Uncertain linked | 4 | 173 | |
| Not linked | 8 | 133 | |
| Total | 332 | 7,516 |
5.2Estimation of the number of farms and land in farms
The record linkage between the 2017 and 2018 survey data led to a substantial number of uncertain and not-linked records for each year. In addition to the design-based unadjusted survey estimates, lower and upper bound estimates that reflect the extremes in the number of farms and land in farms for each year were developed. Although the original ACES dataset was used to produce unadjusted point estimates for each year, lower and upper bounds were estimated by combining records from the two surveys based on information gained from record linkage.
Table 4
Estimates and standard errors (SE) of the number of farms and land in farms from the 2017 and 2018 ACES before and after data reconciliation, and corresponding 2012 and 2018 Census estimates after calibration
| Source | Number of farms (SE) | Land in farms (SE) | ||
|---|---|---|---|---|
| 2017 | 2018 | 2017 | 2018 | |
| ACES | ||||
| Unadjusted | 8,160 (578) | 7,516 (470) | 453,387 (26,499) | 441,774 (22,513) |
| Lower estimate | 9,177 (612) | 7,516 (470) | 456,694 (29,362) | 441,774 (22,513) |
| Upper estimate | 11,273 (774) | 9,765 (704) | 568,571 (37,437) | 539,044 (35,672) |
| Census | 2012 | 2018 | 2012 | 2018 |
| 13,159 (92) | 8,230 (1,160) | 584,988 (9,945) | 487,775(73,912) | |
First, considering the lower bounds, in 2018, 13 of the 198 linked farm tracts were non-farms in 2017, and 87 of the 95 unlinked farms were created before 2017. These 100 records (13 linked and 87 not-linked records) were likely misclassified in 2017 and should have been recorded as 2017 farm tracts. In addition, 31 of the 2017 farm tracts had no links to 2018 records. Thus, in 2017, at least 350 tracts were associated with farms (219 linked farms
Unlike 2017, the misclassification of the 2018 tracts cannot be assessed because misclassification in either the linked or unlinked records cannot be evaluated. Thus, the 2018 estimated lower bounds of farms and land in farms are based on the data reported for the 2018 ACES records. These are equal to the corresponding unadjusted estimates of 7,516 (SE
Now considering the estimated upper bounds for 2017, in 2018, as noted above, 13 linked and 87 unlinked farm records (total of 100 farm records) were misclassified in 2017 based on their 2018 responses. In addition, 35 of the 39 farm tracts with uncertain links in 2018 were created prior to 2017, an indication that these were misclassified. These 135 (13
Similarly, in 2017, 41 and 31 farm records, respectively, had uncertain links or were not linked to a 2018 ACES tract. Some of these could have gone out of business. Some of the uncertain links could already be counted among the 2018 tracts (farms or non-farms). After adjusting for these potential sources of misclassification, an upper bound of the number of 2018 farm tracts was 404 (332 reported farm tracts
Both the lower and the upper values of the number of farms and land in farms from the 2017 ACES were smaller than the corresponding estimates from the 2012 Census, but the differences can possibly be explained by a general decreasing trend in the number of farms and land in farms in Puerto Rico. The difference in the number of farms between the 2012 Census estimate and the 2017 ACES lower estimate was 3,982 farms (i.e., a 30.3% decrease). The corresponding difference for land in farms was 128,294 cuerdas, which amounts to a 21.9% decrease from 2012 to 2017.
Figure 7.
Estimates of the number of farms from the 2017 and 2018 ACES, and the 2018 Census with error bars extending 2 (SE) of the estimates.
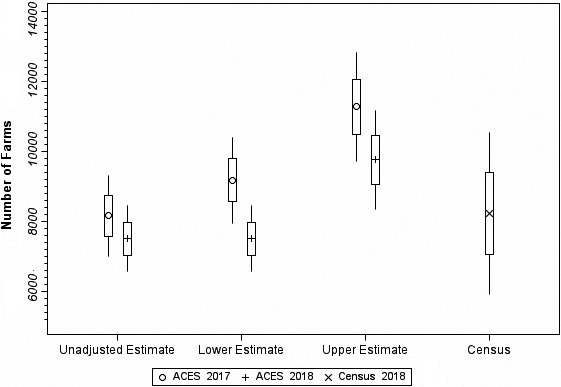
Figure 8.
Estimates of land in farms from the 2017 and 2018 ACES and the 2018 Census with error bars extending 2 (SE) of the estimates.
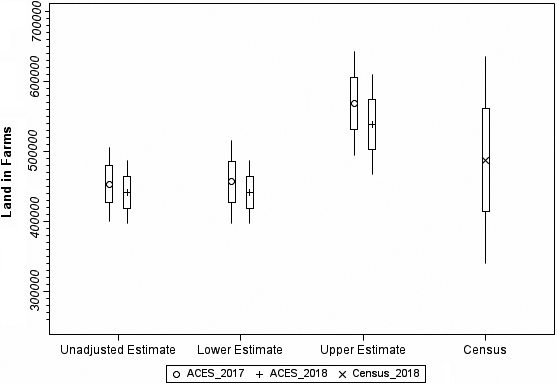
The 2018 Census of Puerto Rico estimates were produced by applying the capture-recapture model discussed in Section 4 followed by calibration. The estimates of the number of farms and land in farms are between the corresponding lower and upper bounds of the 2018 ACES estimates (see Figs 7 and 8, respectively).
The difference between the lower bound of the number of farms from the 2017 ACES and the corresponding upper bound from the 2018 survey, which is equal to
6.Discussion
Based on the 2009 FNRP conducted by NASS to assess misclassification of JAS segments, misclassification led to an estimated undercount of 581,373 farms in the conterminous US [17]. Puerto Rico’s dense vegetation and often rolling landscape makes data collection challenging, and the impact of Hurricane Maria on the Island’s roads further complicated the data collection efforts in 2018. However, the availability of CRIM data for 2018 ACES data collection led to better data quality compared to the 2017 ACES, which was conducted prior to obtaining access to CRIM data. By linking the records from the two years, at least some of the misclassification occurring in 2017 could be identified and corrected.
Adjusting for misclassification in 2017 based on 2018 information led to an increase of 1,017 (12.5%) in the estimated number of farms and 3,307 (0.7%) cuerdas in the estimated land in farms. Based on the unadjusted estimates, the average land in a farm is estimated to be 55.6 cuerdas. The estimated average land in a farm associated with the additional 1,017 farms identified by adjusting for misclassification is 3.3 cuerdas, which reflects the greater difficulty in identifying small farms compared to large farms. It is unlikely that all misclassification was identified for either year. In preparation for the 2022 Puerto Rico Census of Agriculture, a new dashboard has been developed that will allow interviewers to review aerial photography, CRIM data, and all other available data so that owners of tracts with potential agriculture can be more readily identified and contacted, which should help reduce misclassification.
The inability to associate 2017 ACES tracts with a specific tract within a sampled segment made record linkage more difficult. Beginning in 2021, NASS began identifying each tract within a JAS sample segment using a geographic information system. This allows the responses to each tract’s questionnaire to be combined with administrative, remotely sensed, and other available data. Having all data geo-referenced provides new opportunities to improve estimates by using data from multiple sources. For 2022, the ACES tracts in Puerto Rico should also be geo-referenced.
Surveying the same segments in both 2017 and 2018 provided an opportunity to better understand the impact of Hurricane Maria on Puerto Rico’s agriculture and the extent to which the island’s agriculture had recovered in less than a year. The linked records represented 6,225 farms in 2017 and 4,441 farms in 2018. The weighted farm number estimate associated with the 34 linked farm tracts in 2017 that were not in business in 2018 was 1,258, and the weighted 2018 estimate from the 12 linked farms that had been established since 2017 was 306. From these, a rough estimate of the proportion of 2017 farms that ceased to operate from 2017 to 2018 is 20.2%, and the proportion of new farms in 2018 was about 6.9%. Because these estimates do not consider the farms with uncertain or no links, they are subject to numerous sources of error. For example, the proportion of farms going out of or coming into business could differ for linked versus uncertain or not-linked farms. However, they do provide some insight into the effects that the events occurring during this period had on Puerto Rico’s agriculture.
The response rate to the 2018 Puerto Rico Census of Agriculture was 29.1%, a substantial drop from the 55.5% response rate in the 2012 Census [1]. The adjustments for undercoverage, nonresponse, and misclassification to the number of farms were, respectively, 20.8%, 41.3%, and 9.2%. The adjustments to the estimate of land in farms were 29.5%, 69.4%, and 13.7% for undercoverage, nonresponse, and misclassification, respectively. The overall adjustments of 71.4% for the estimated number of farms and 112.5% for the estimated land in farms were substantial [1]. The final estimates of 8,230 for number of farms and 487,775 cuerdas for land in farms were between the lower and upper bounds from the 2018 ACES, providing a positive quality check on the results.
This record linkage project provided insights into the challenges associated with data collection for a sample drawn from an area frame in Puerto Rico. Identifying all farm operations within a sampled segment was difficult given the Island’s topography, and Hurricane Maria’s devastation of numerous roads added further complications. Yet, the 2017 and 2018 ACES segments provide insights into the number of farms lost and gained between the two data collection periods. The 2018 ACES provided a measure of undercoverage for the 2018 Puerto Rico Census of Agriculture and a quality check on the estimates arising from that Census. Finally, the effort has highlighted areas that have been or will be improved for the 2022 Puerto Rico Census of Agriculture.
Acknowledgments
The findings and conclusions in this paper are those of the authors and should not be construed to represent any official USDA or US Government determination or policy.
References
[1] | USDA National Agricultural Statistics Service (NASS). 2020 Census of Agriculture: Puerto Rico ((2018) )Island and Regional Data, Vol. 1: Geographic Area Series, Part 52. Report AC-17-A-52, U.S.D.A.: Washington DC. 2020. Available from: https://www.nass.usda.gov/Publications/AgCensus/2017/Full_Report/Outlying_Areas/Puerto_Rico/prv1.pdf |
[2] | USDA National Agricultural Statistics Service (NASS). U.S. Census of Agriculture: United States Summary and State Data, Vol. 1: Geographic Area Series, Part 51. Report AC-12-A-51, U.S.D.A.: Washington DC. (2014) . Available from: https://agcensus.library.cornell.edu/wp-content/uploads/usv1.pdf. |
[3] | USDA National Agricultural Statistics Service (NASS). U.S. Census of Agriculture: United States Summary and State Data, Vol. 1: Geographic Area Series, Part 51. Report AC-17-A-51, U.S.D.A.: Washington DC. (2019) . Available from: https://www.nass.usda.gov/Publications/AgCensus/2017/Full_Report/Volume_1,_Chapter_1_US/usv1.pdf. |
[4] | Young LJ, Lamas AC, Abreu DA, Wang S, Adrian D. Statistical methodology for the 2012 U.S. Census of Agriculture. In the Proceeding 59th ISI World Statistics Congress. (2013) . pp. 1063–1068. Available from: https://www.statistics.gov.hk/wsc/IPS105-P3-S.pdf. |
[5] | Young LJ, Lamas AC, Abreu DA. The 2012 census of agriculture: A capture-recapture analysis. Journal of Agricultural, Biological and Environmental Statistics. (2017) ; 22: (4): 523–539. |
[6] | Alho JM. Logistic regression in capture-recapture models. Biometrics. (1990) ; 46: : 623–635. |
[7] | Alho JM, Mulry MH, Wurdeman K, Kim J. Estimating heterogeneity in the probabilities of enumeration for dual-systems estimation. Journal of the American Statistical Association. (1993) ; 88: : 1130–1136. |
[8] | Alho JM. Analysis of sample-based capture-recapture experiments. Journal of Official Statistics. (1994) ; 10: : 245–256. |
[9] | US Census Bureau. Accuracy and Coverage Evaluation of Census 2000: Design and Methodology. (2004) . Available from:https://www2.census.gov/programs-surveys/decennial/2000/technical-documentation/coverage-evaluation/dssd03-dm.pdf. |
[10] | US Census Bureau. 2010 Census Coverage Measurement Estimation Methodology. (2008) . Available from: https://www2.census.gov/programs-surveys/decennial/2010/technical-documentation/methodology/ccm-workshop/2010-e-18.pdf. |
[11] | National Research Council. Coverage Measurement in the 2010 Census: Panel on Correlation Bias and Coverage Measurement in the 2010 Decennial Census. Ed. Robert M. Bell and Michael L. Cohen. The National Academies Press: Washington, DC. (2008) . |
[12] | Mule T. 2010 Census Coverage Measurement Estimation Report: Summary of Estimates of Coverage for Persons in the United States. DSSD 2010 Census Coverage Measurement Memorandum Series #2010-G-01. Washington, DC; U.S. Census Bureau. (2012) . |
[13] | Chao A. An overview of closed capture-recapture methods. Journal of Agricultural, Biological, and Environmental Statistics. (2001) ; 6: : 158–175. |
[14] | Seber GAF. The Estimation of Animal Abundance and Related Parameters, 2nd edition. The Blackburn Press: Caldwell, New Jersey. (2002) . |
[15] | Armstrup SC, McDonald TL, Manly BF. Handbook of Capture-Recapture Analysis. Princeton University Press: Princeton, NJ. (2005) . |
[16] | Lopiano KK, Lamas AC, Abreu DA, Arroway P, Young LJ. Adjusting the June Area Survey estimate of the number of US farms for misclassification and non-response. Proceedings of the Joint Statistical Meetings, Section on Survey Research Methods. (2010) ; 1849–1854. Available from: www.asasrms.org/Proceedings/y2010/Files/306879_55729.pdf. |
[17] | Abreu DA, McCarthy JS, Colburn LA. Impact of the Screening Procedures of the June Area Survey on the Number of Farms Estimates. Research and Development Division. RDD Research Report Number RDD-10-03. Washington, DC: USDA, National Agricultural Statistics Service. (2010) . |
[18] | The Washington Post-Kaiser Family Foundation. Survey of Puerto Rico Residents. (2018) . Available from: https://files.kff.org/attachment/Topline-and-Methodology-Views-and-Experiences-of-Puerto-Ricans-One-Year-After-Maria. |
[19] | Abreu DA, Deaton M, Barboza W. Enhancing the June Agricultural Survey Pre-Screening through the Use of County Assessor’s Information. In the Proceedings of the Joint Statistical Meetings. (2015) . Available from: http://www.asasrms.org/Proceedings/y2015/files/233869.pdf. |
[20] | Lamas AC, Abreu DA, Arroway P, Lopiano KK, Young LJ. Modeling misclassification in the June Area Survey. In JSM Proceedings, Survey Research Methods Section. American Statistical Association. (2010) ; 2480–2488. Available from: http://www.asasrms.org/Proceedings/y2010/Files/307274_58211.pdf. |
[21] | Benecha HK, Abreu DA, Abernethy J, Sartore L, Young LJ. Evaluation of a New Approach for Estimating the Number of U.S. Farms. In JSM Proceedings, Survey Research Methods Section. Baltimore, MD: American Statistical Association. (2017) . Available from: http://www.asasrms.org/Proceedings/y2017/files/593986.pdf. |
[22] | Pollock KH, Turner SC, Brown CA. Use of capture-recapture techniques to estimate population size and population totals when a complete frame is unavailable. Survey Methodology. (1994) ; 20: : 117–124. |
[23] | Young LJ, Jacobsen M. Sample Design and Estimation When Using a Web-Scraped List Frame and Capture-Recapture Methods. Journal of Agricultural, Biological and Environmental Statistics. (2022) ; 27: : 261–279. Available from: https://doi.org/10.1007/s13253-021-00476-w. |
[24] | Hyman M, Sartore L, Young LJ. Capture-Recapture Estimation of Characteristics of US Local Food Farms Using a Web-Scraped List Frame. Journal of Survey Statistics and Methodology. (2022) ; 10: (4): 979–1004. Available from: https://doi.org/10.1093/jssam/smab008. |
[25] | Sartore L, Toppin K, Young LJ, Spiegelman C. Developing integer calibration weights for Census of Agriculture. Journal of Agricultural, Biological and Environmental Statistics. (2019) ; 24: (1): 26–48. Available from: https://doi.org/10.1007/s13253-018-00340-4. |


