
Assessment of the quality of administrative data for use in a population census; applying census test results in Indonesia
Abstract
BPS-Statistics Indonesia plans to carry out its seventh population census in 2020. In contrast to the traditional method in previous censuses, it will use administrative data obtained from the Ministry of Home Affairs combined with field enumeration. Individual information recorded in the administrative data will be used as the initial data source for the field enumeration as well as to ensure adequate coverage. These changes could be a step towards a register-based census in the future. Given the important role of register data in the upcoming Indonesian census, it is necessary to assess the quality of the administrative data which have been recorded by the Ministry of Home Affairs. Therefore, this study aimed to analyze whether there are significant differences on selected individual variables between the data from the administrative source and the census test results. The census test was conducted in three selected villages using multi-mode data collection. The comparison of the selected individual variables and the statistical test results indicate that this administrative data is of sufficient quality to be used as the data source for a combined method census in Indonesia.
1.Introduction
As a part of an integrated National Statistical System, the United Nations recommends all countries around the world to conduct population and housing census at least once in a 10-year period [1]. Furthermore, population and housing censuses in Indonesia are also required by the national law on Statistics. Indonesia, through BPS-Statistics Indonesia as the agency responsible for official statistics, has conducted six population and housing censuses since 1961. Until its last census in 2010, data collections have been carried out using traditional methods. Through full field enumeration, information on individuals and households were collected using questionnaires with door-to-door interviews by enumerators. The method is considered very complex and requires large resources to undertake.
Considering the shortcomings of a traditional census, BPS-Statistics Indonesia began to look for alternative approaches in conducting future censuses. It is hoped that in the future Indonesia can perform a register-based census. Register-based censuses are considered to be cheaper, faster, and could reduce respondent burden [2]. The register-based census method has been carried out by many countries including the Netherlands, Denmark, Finland, Norway, Sweden, Austria, Slovenia, South Korea, and Singapore [2, 3, 4]. Before being able to conduct a full register-based census, BPS-Statistics Indonesia will perform the combined method in the upcoming census and make some changes in the business process. The method has been used by Statistics Netherlands since 1981 by combining register and survey data in its censuses [5]. Before moving towards a register-based census in 2021, Spain also performed a combined census in 2011 [6]. In the 2020 census, BPS-Statistics Indonesia will use administrative data combined with field enumeration. The enumeration will be carried out using multi-mode data collection with gadget (CAPI) and online form (CAWI) besides paper questionnaire.
Currently, Indonesia already has a population administrative system managed by the Ministry of Home Affairs. Every Indonesian resident registered in the system has a unique identity number. Although not all Indonesian residents are registered in the system, it is estimated that about 97% of the total population has been electronically recorded in the system [7].
The Indonesian administrative system uses biometric verification technology. The digital identification system using this biometric verification ensures that each person can only have one valid identification number [8]. As using unique identity numbers is becoming the mandatory requirement to access almost all services and administrative documents, it is assumed that there will be more and more residents who will proactively request to be registered in the system. However, even though administrative data are available and have covered almost all population, changes in individual data are not always updated in the system. Therefore, there may be some individual data in administrative records that is not updated in a timely manner.
Due to such limitations in administrative data, the upcoming population census in Indonesia cannot be fully carried out on a registration basis. However, despite its limitation, BPS-Statistics Indonesia can still use the administrative source for the 2020 census as the basic frame to ensure adequate coverage. It is also possible to borrow some individual information from administrative data to obtain certain population variables. Field enumeration is still needed to complete household or individual information that is not relevant or not available in the administrative data. Therefore, this combined census will be the starting point for a register-based census in the future.
Although several census tests were conducted in 2018 and 2019, the purpose of the census test in 2018 was limited to testing different features of traditional methods rather than the use of administrative data. Therefore, to test the census mechanism and the use of administrative data in census, BPS-Statistics Indonesia conducted a combined census test in February 2019. This combined census test is important because it forms the basis for shifting the census method from a traditional to a combined census. The census test was carried out in three selected villages in two provinces; one village in West Java province (Sukamiskin), and two villages in South Kalimantan (Mekarsari and Indah Sari). The locations were selected from the previous pilot census locations so that the results of the combined census test can be compared with the results from the previous census tests using traditional methods.
An assessment of administrative data is needed to test the variables that exist both in the administrative source and the data obtained from the census test. Polish experiences and UNECE guidance suggest that in order to facilitate the use of administrative data in census, the quality of data registers is the most important element that should be considered [9]. One way to measure the quality of administrative data is by comparing administrative data with individual data from a survey or census. In preparation for the 2021 Census, Statistics Portugal also measured the quality of available administrative data by comparing administrative data with census micro data [10]. A similar approach was used to assess the quality of available administrative data in Indonesia with several aspects adjusted to the context in Indonesia.
This study aimed to analyze whether there are significant differences in selected individual variables between the data from administrative source and the census test. The results may also suggest some aspects for improvement, either in the enumeration mechanism or in the administrative data for the future censuses.
2.Methodology
2.1Administrative data source
The administrative data being used as the basis for the Indonesian combined census can be obtained only from one data source. The data is managed by the Directorate General of Population and Civil Registration, in the Ministry of Home Affairs. Based on Law No. 23/2006 on Population Administration, population data and civil records in Indonesia are governed by implementing a population administrative information system called SIAK. The use of SIAK allows more accurate population data collection and enables an automatic and permanent provision of a unique identity number for each Indonesian resident, including foreign citizens who have permanent residency permits. Thus, the system can eliminate the occurrence of multiple identity ownership. Individual data recording is performed through SIAK by regency and municipality level governments as the lowest sub-division of local government units in Indonesia. The data is then stored in an internet-based nationally integrated database in the Ministry of Home Affairs. To ensure that the data compiled from all regions in Indonesia is clean and there is no data redundancy, data validation or data reconciliation is scheduled every semester or twice a year.
The data used for the census test were the results of data reconciliation in the second semester of 2018. Therefore, apart from the fact that changes in individual data are not always reported immediately to the authorities, some individual variables might no longer be valid at the time of census test in February 2019. For example, a person’s marital status or highest education attainment might have changed after the last report in the system.
2.2Data transfer
The legal frame which allows BPS-Statistics Indonesia to access administrative data was established by Law no. 16/1997 on Statistics. However, at the institutional level, technical regulations are needed for more detailed implementation mechanisms on data transfer and data use. At the time of the census test, the regulation to fully duplicate administrative records from the Ministry of Home Affairs to BPS-Statistics Indonesia had not been completed. Therefore, for the purposes of the census test and based on the agreement between both institutions, BPS-Statistics Indonesia was given access to population data registered up to the regency/municipality level in the census test’s areas, i.e. Kota Bandung and Barito Kuala. Administrative data from both of the test areas were then duplicated from the server of the Ministry of Home Affairs to the server in BPS-Statistics Indonesia. This process used an Application Programming Interface (API) in the form of a web service designed to support interoperability of machine-to-machine interactions over a network. The data obtained related to the reconciled results from the second semester of 2018.
2.3Data cleansing
After the data had been duplicated to BPS-Statistics Indonesia’s server, the data variables were cleansed so that they could be used for the next census business process. The variables obtained from the data are as follows: Province, Regency/Municipality, District, Village, Address, Family Card Number, Unique Identity Number, Name, Sex, Date of Birth, Place of Birth, Relationship Status with the Head of the Family, Mother’s Name, Education, Marital Status, Religion and Occupation.
The processes at the data cleansing stage were:
1. Checking and harmonizing the administrative units
The data from the Ministry of Home Affairs had problems with non-standard administrative division codes and names, especially for the more detailed regional level. Therefore, checks and corrections were carried out in order to have a correct linking of each individual data. The checking was carried out on the variable Province, Regency/Municipality, District, and Village. The results found that there were some administrative unit data unmatched with the standard administrative division codes available in BPS-Statistics Indonesia, especially at village level. The differences were due to the fact that village information on administrative data was not updated as well as non-standard naming nomenclature for villages. Furthermore, corrections were made for unmatched cases after confirming the data to the Ministry of Home Affairs.
2. Data checking and data encoding
The data obtained from the Ministry of Home Affairs were still in the form of characters for each variable. In general, the completeness of the entries was good, but there were some inconsistent entries found that may complicate the coding process. As an example, in the Education variable, there were some entries in the database that refer to the same level of education. Therefore, it was necessary to establish a data dictionary for all different terms in the database so that the coding process could be done properly.
3. The establishment of master data of the local administrative unit (SLS Master)
Forming the SLS master is basically grouping population data based on information of local administrative units contained in individual address variables. This is important, since each individual is expected to be identified in one smallest local administrative unit (SLS). However, the Ministry of Home Affairs did not have the SLS master since the establishment of the smallest SLS is within the authority of the regency/municipality governments. In addition, there was no national standard on the formation of SLS. Therefore, the establishment of SLS master has to be done carefully so that it may cover all SLS in all regencies/municipalities.
Table 1
Number of individual based on location, administrative data, and verification stage in the census test
No. Name of village Regency/municipality Number of records Administrative data Verification stage in census test 1 Indahsari Barito Kuala 1.585 1.466 2 Mekarsari Barito Kuala 3.306 3.077 3 Sukamiskin Bandung City 22.397 21.630 Total 27,169 26,292 Table 2
Number and percentage of matched respondents with administrative records based on the enumeration mode
No. Mode Number of respondent in enumeration stage Matched records with administrative data Respondent Percentage 1 CAPI 1,801 997 55% 2 CAWI 886 671 76% Total 2,693 1,668 62% 4. The selection of individual records
The census test was carried out in two stages. First is the verification stage to verify the coverage. This is achieved by the head official of the smallest local administrative unit verifying each individual in the population list of the smallest local administrative unit (SLS). The enumerators visit the head of the SLS to identify whether each individual is still living in that area or not. In total, from the verification stage, there were 26,292 individuals identified as the residents in the three villages compared to 27,169 listed in the database for the same villages. These lists of individuals combine those who are already on the list and those whose names were not recorded as residents in these villages but were considered as usual residents in those areas. Table 1 shows the number of individuals in the three villages from administrative data and after the verification stage.
After the verification stage, enumeration was done in three modes: enumerator interviews using gadgets (CAPI); self-enumeration through a website (CAWI); and self-enumeration using paper questionnaires (DOPU). Since this stage was not designed to complete the enumeration of the entire population in the census test areas, therefore there were only 2,793 respondents (10.62% of confirmed population in three villages) who were successfully reached through all three modes.
In the test, there was no data processing for the paper questionnaires or from DOPU because the system was still in preparation at that time. The documents will be used to test data processing system using capture recogniting later on. Therefore, there were 100 respondents from DOPU excluded from being matched with administrative data. It was possible to match other respondents obtained from CAPI and CAWI with administrative records. The matching process was done using a unique population ID Number, called a NIK, as a match-key. As a result, the successful rate for the matched individuals was 62% (see Table 2). The unmatched cases were thought to be caused by two possibilities. First, some individuals might have been recorded in the administrative data, but were identified as residents in regencies/municipalities other than Kota Bandung or Barito Kuala. This is due to the fact that the regulation to fully duplicate administrative data at the national level was not ready yet at the time of the census test; as a result, the database contained only records from the two provinces. Second, some individuals can be new-born infants or even adults who have never been recorded in the administrative data. Therefore, for the purpose of this study, in total there were 1,668 matched datasets that could be further analyzed.
2.4Statistical analyses
The study aimed to determine whether there were differences between the data on selected variables taken from the census test results and administrative data for the same individual. The variables that could be tested from the two data sources are Sex, Religion, Marital Status, Date of Birth, Province of Residence, Province of Birth, Educational Attainment, and Age. Those six variables were chosen because they exist in both data sources.
Table 3
Variable, type of data and statistical test
| No. | Variable | Type of data | Statistical test |
|---|---|---|---|
| 1 | Sex | Nominal with 2 categories | McNemar Test |
| 2 | Religion, Marital Status, Province of Residence, | Nominal with more than 2 categories | Marginal Homogeneity Test |
| Province of Birth | |||
| 3 | Highest Educational Attainment, Age | Ordinal, interval | Wilcoxon Test |
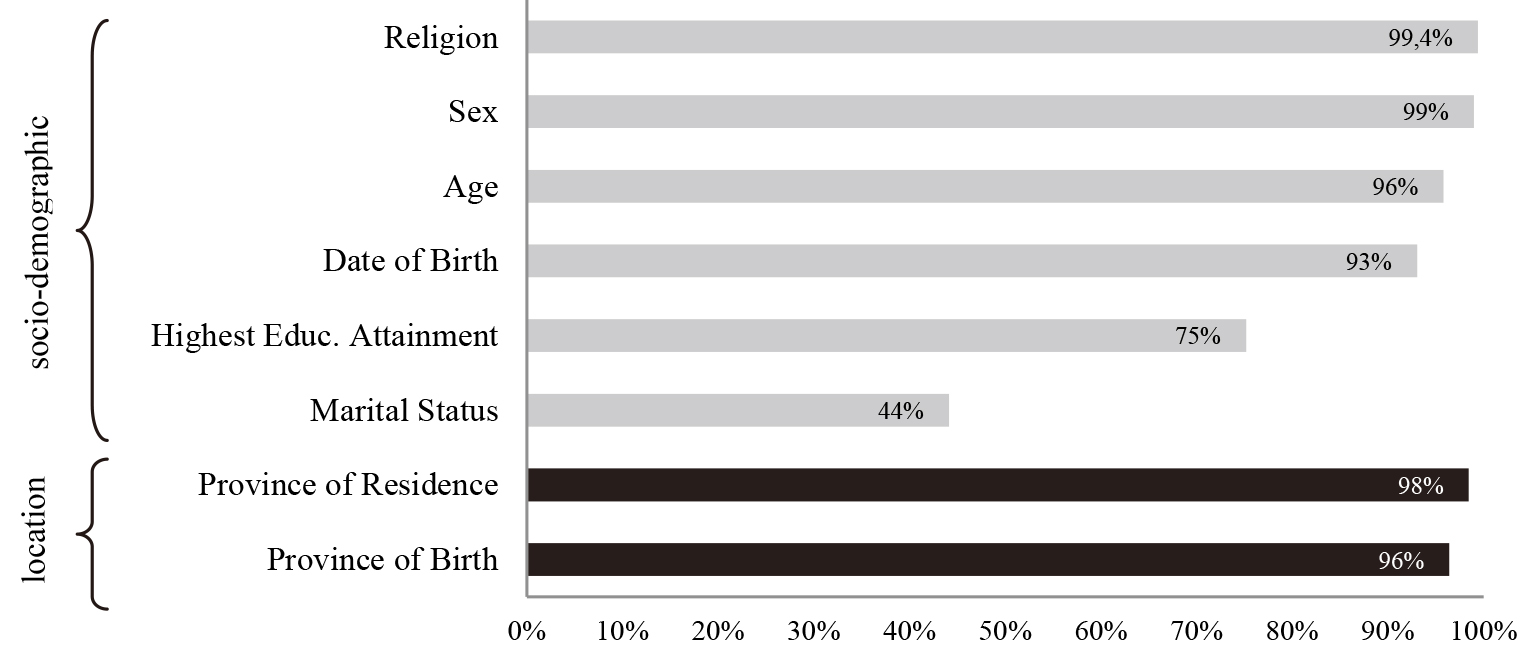
Figure 1.
Equality rates of eight selected variables from census test and administrative data records.
The study used descriptive and non-parametric statistical analysis methods to determine whether there were differences in the eight variables obtained from administrative data and the census tests. Non-parametric analysis was used because assumptions on the distribution parameters are not met for the variables. Statistical analysis of paired samples was used to compare the information drawn from administrative records and census test data for the same individual that had been identified through the NIK as the match-key. The different treatment on the paired test can be defined as the differences of the data sources. It was assumed that the census test data was more up to date than the data from the administrative source.
The null hypothesis of the statistical test stated that the two marginal probabilities for each outcome are the same for the paired samples from the administrative source and the census test. Because there were different data types for the eight variables, the type of paired-sample statistical tests were adjusted according to the data type of each variable (see Table 3).
3.Results
3.1Descriptive statistics
Corresponding with the purpose of this study, eight selected variables from the census test and administrative records were compared: Sex, Religion, Marital Status, Date of Birth, Province of Residence, Province of Birth, Highest Educational Attainment, and Age. The equality rate between census test and administrative data records for each variable are shown in Fig. 1. The comparison results show that four socio-demographic variables, i.e. Religion, Sex, Age, Date of Birth, have high rates of consistency. More than 90% of paired respondents have matched information on these variables. The result indicates that administrative records for these four socio-demographic variables have a high degree of accuracy. Highest Educational Attainment has a lower consistency, with about 75%. On the other hand, marital status is the variable with the lowest equality rate with about 44%. These results indicate that individual information on marital status and educational attainment were not updated in the administrative system. Information regarding the place of residence and place of birth at the provincial level (the highest level of sub-national government in Indonesia) also has high equality rates. About 98% and 96% of the paired individuals have the same information on province of residence and province of birth respectively.
Figure 2.
Age group frequency based on data sources.
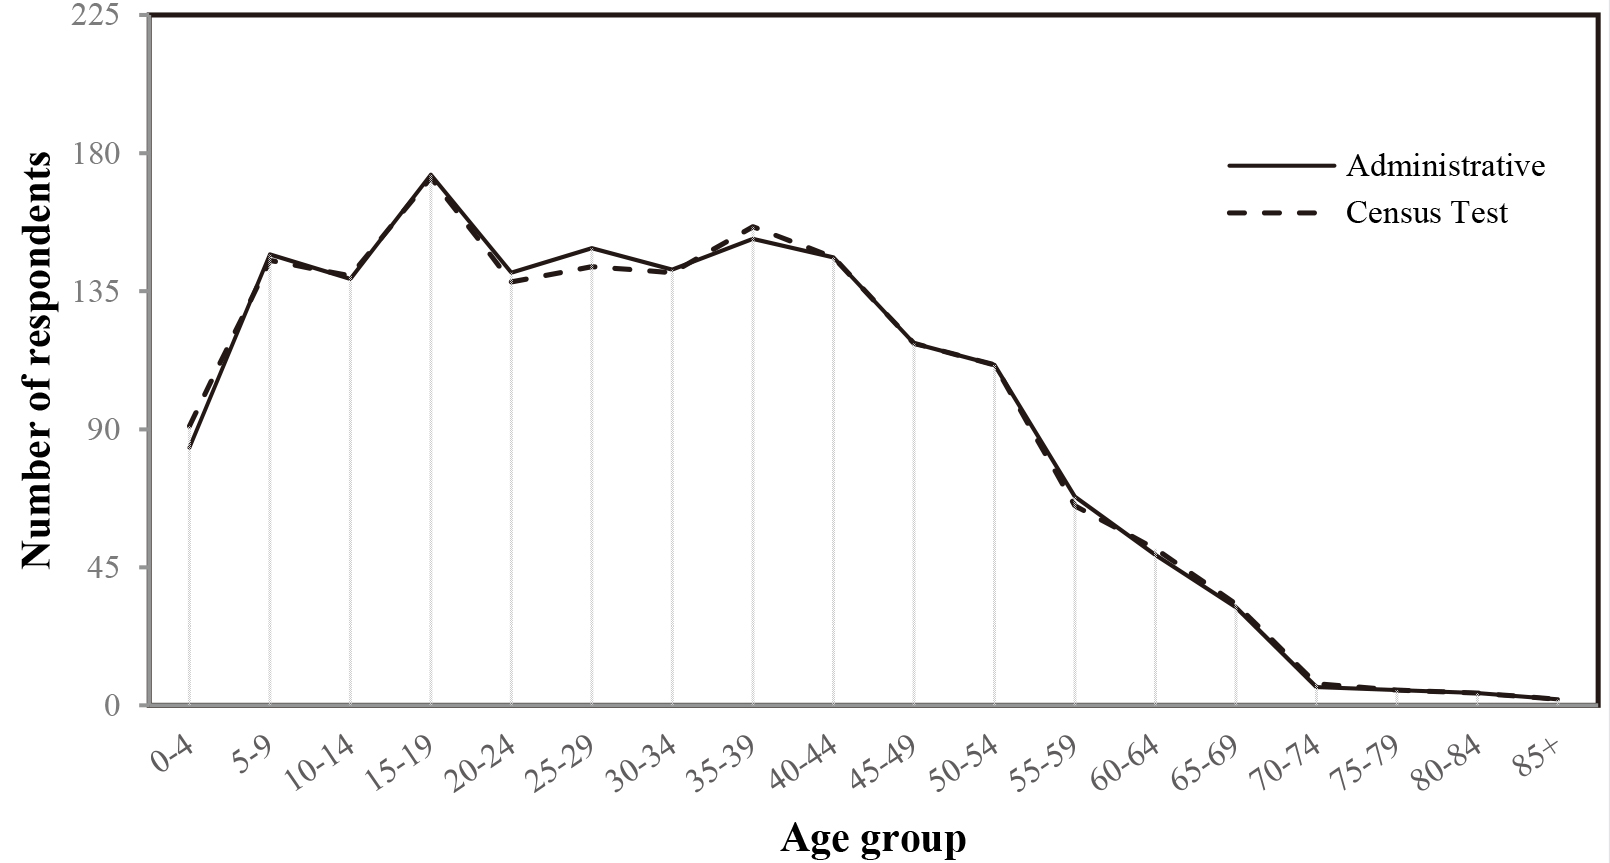
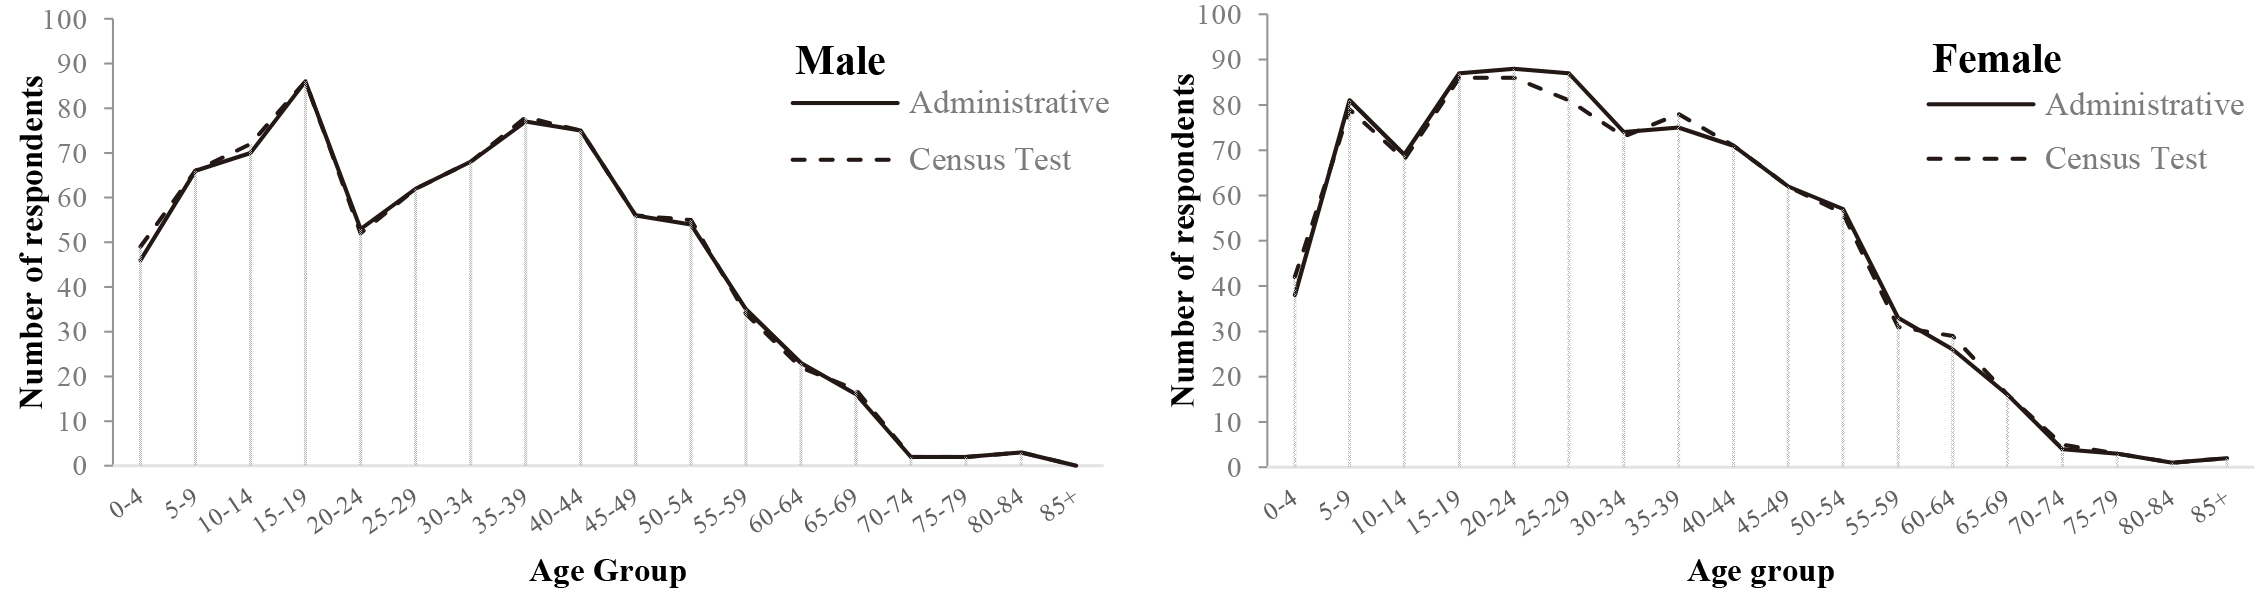
Figure 3.
Age group frequency based on sex and data sources.
The quality of administrative data can be analyzed by comparing the frequency of the Age variable between the administrative and the census test data. Age and sex are the basic individual characteristics of the human population [11], as they can affect all aspects of demographic and socio-economic processes. Therefore, comparison of age frequencies between the two data sources should also be compared by sex. The overlapping graph lines indicate very similar information on the age variable between the two sources.
Figure 2 shows that the two data sources, represented by the two curves, are very close to each other in terms of levels and trends. The slight differences between the two data sources are seen in the age group of 25–29 and 35–39 years old. When data are aggregated by sex (see Fig. 3), it can be seen that data of males from both sources tend to have more similarity in all age groups. On the other side, data of females have slight differences at some age groups. Administrative data have more females in the age group 25–29 years old, while there are fewer females in the age group 35–39 and 60–64 years old compared to the data from the census test.
In order to explore the cause of the discrepancies, further checking was carried out for individuals who have different ages in the census test and administrative data. The rationality checking was taken between Age variable and other individual variables, such as the Relationship with the Head of the Family, Marital Status, and Highest Education Attainment. From the checking, it is indicated that there were data input errors by enumerators in variable Date of Birth or Age from CAPI mode. In addition, error in filling in Sex variable also contributed to the differences, especially for females. Furthermore, by looking at the peak discrepancy in age group 25–29, the difference is only 6 out of around 90 people. It is difficult to say that the difference is substantial because of the small sample for this age group.
Additional examination was conducted to ensure the correctness of Sex variable data. Although sex change through genital surgery is possible nowadays, for the case of Indonesia 1% differences in sex information is still considered suspicious. Therefore, further data checking on respondent names was performed. Based on common sense and Indonesian culture, there are names that are specific to a particular sex (see Table 4). The results of the examinations indicate that most inconsistencies in Sex variable were resulted from the census test rather than from administrative records.
Table 4
Sex identification based on individual’s name
| No | Name | Administrative record | Census test result | Identification result | |
|---|---|---|---|---|---|
| CAPI | CAWI | ||||
| 1 | Meita xxxxxxxxx | Female | Male | Female | |
| 2 | Ahmadi xxxx xxxxxxx | Female | Male | Male | |
| 3 | Nawafiansyah xxxxx xxxxx | Male | Female | Male | |
| 4 | Kevin xxxxx xxxxxxxxxxx | Male | Female | Male | |
| 5 | Syaiful xxx | Male | Female | Male | |
| 6 | Winda xxxxxx xxxxxxx | Male | Female | Female | |
| 7 | M. Nashrullah | Male | Female | Male | |
| 8 | Muhammad xxxxx | Male | Female | Male | |
| 9 | Chaterine xxxxxxxx xxxxx | Female | Male | Female | |
| 10 | Vitra xxxxxxxxxxx | Female | Male | Female | |
| 11 | Dinara xxxxxx | Female | Male | Female | |
| 12 | Aqilah xxxxxx | Female | Male | Female | |
| 13 | Della xxxxxxxxx | Female | Male | Female | |
| 14 | Migawati | Female | Male | Female | |
| 15 | Nasywa xxxxxxxx xxxxx | Female | Male | Female | |
| 16 | Mira xxxxxx | Female | Male | Female | |
| 17 | Sariba | Female | Male | Female | |
Note: some names are not displayed for confidentiality reason.
Table 5
Comparison matrix of the highest educational attainment from administrative data and census test
| Category | Administrative data | |||||||||||
|---|---|---|---|---|---|---|---|---|---|---|---|---|
| No schooling | Not completed el. school | Elementary school | Junior high school | Senior high school | Dipl. I/II | Dipl. III | Bachelor’s degree | Master’s degree | Doctoral degree | Total | ||
| Census | No schooling | 143 | 4 | 1 | 1 | 149 | ||||||
| test | Not completed el. school | 112 | 88 | 3 | 2 | 3 | 208 | |||||
| data | Elementary school | 19 | 41 | 162 | 6 | 5 | 1 | 234 | ||||
| Junior high school | 4 | 39 | 7 | 182 | 23 | 255 | ||||||
| Senior high school | 10 | 7 | 27 | 408 | 1 | 4 | 2 | 459 | ||||
| Diploma I/II | 1 | 10 | 1 | 1 | 13 | |||||||
| Diploma III | 1 | 8 | 1 | 58 | 4 | 72 | ||||||
| Bachelor’s degree | 1 | 1 | 2 | 17 | 7 | 192 | 9 | 1 | 230 | |||
| Master’s degree | 2 | 18 | 21 | 41 | ||||||||
| Doctoral degree | 3 | 4 | 7 | |||||||||
| Total | 278 | 183 | 180 | 221 | 465 | 12 | 72 | 219 | 33 | 5 | 1668 | |
Table 6
| No. | Variable | |
|---|---|---|
| 1 | Sex | 0.332 |
| 2 | Religion | 0.072 |
| 3 | Highest Educational Attainment |
0.000 |
| 4 | Marital Status |
0.005 |
| 5 | Age | 0.357 |
| 6 | Date of Birth | 0.377 |
| 7 | Province of Residence | 0.155 |
| 8 | Province of Birth | 0.952 |
Examination was also conducted on the inconsistencies of the Highest Educational Attainment variable in both sources. About 4% of respondents had lower educational attainment levels than the results from the census test (see Table 5). The initial assumption in this study is that the data from the census test are more updated compared to administrative data; therefore that inconsistency is an anomaly and indicates an error in the census test process.
Both examinations on Sex and Highest Educational Attainment indicate that the inconsistencies in data could exist due to non-sampling error. It can be caused by human errors or system errors. Enumerators or respondents might fill in the wrong answer. In addition, unsuitable application interface designs, both on the CAPI and CAWI, could also lead to errors.
3.2Statistical tests
In order to identify the statistical differences between the data from both sources, the hypothesis tests were performed on the eight selected variables. Table 6 shows the
4.Conclusion and recommendations
Evaluation of the quality of administrative data for census purposes was carried out by comparing data from administrative records with the data from a census test. Descriptive and statistical test results consistently showed that administrative data have already a good level of accuracy on several variables such as Sex, Religion, Age, Date of Birth, Province of Residence, and Province of Birth. However, there are significant differences in the variables of Highest Educational Attainment and Marital Status.
Based on test results, it can be concluded that administrative records from the Ministry of Home Affairs could be used as the initial data source for a combined method census in Indonesia. For the 2020 population census, administrative data will be used mainly for coverage checking and confirmation purposes. In addition, individual information on sex from administrative data has a satisfactory quality and can be borrowed as the variable in census to minimize errors caused during the census enumeration.
It is important to pay attention to the quality of data provided by enumerators using CAPI or by respondents independently via website. Based on the findings from the census test, there are still data errors obtained from the two modes. The errors could be caused by a lack of understanding of enumerators or respondents about certain concepts, accidental or intentional mistakes by respondents, or by an insufficient application’s user interface. Therefore, training of field enumerators is one of the important elements to ensure data quality. For respondents who fill out the questionnaire through the website it is necessary to provide an adequate user interface. It is also necessary to provide concepts and definitions or guidelines that are easily understood by the public.
In order to be able to conduct full register-based population censuses in the future, the quality of administrative data from the Ministry of Home Affairs must be further improved. Special attention must be given to variables with a low level of accuracy, i.e. variables that are vulnerable to change over time. Furthermore, it is recommended to assess individual variables in other administrative data sources in Indonesia. Information from various administrative data sources can be employed to complete individual data for the future register based census in Indonesia.
Acknowledgments
We like to thank Mr. Eunkoo Lee from the United Nations Statistical Institute for Asia and the Pacific for his kind mentorship in finalizing this paper; Mr. Matthew Shearing and the United Nations Economic and Social Commission for Asia and the Pacific for facilitating the mentorship.
References
[1] | UNDESA Statistics Division. Principles and recommendations for population and housing censuses, revision 3. New York: United Nations; (2017) . |
[2] | UNECE. Guidelines on the use of registers and administrative data for population and housing censuses. Geneva: UNECE; (2018) . |
[3] | Statistics Korea. Introducing register-based census in Korea. KOSTAT. (2018) [cited 1 May 2020]. Available from http://kostat.go.kr/iwsm/download/2018/S3-4.pdf. |
[4] | Jialin C, Lip T. Challenge in the development of register-based population statistics. Singapore: Statistics Singapore Newsletter; (2017) . |
[5] | Schulte Nordholt E. The usability of administrative data for register-based censuses. Statistical Journal of the IAOS. (2018) Jan 1; 34: (4): 487–98. doi: 10.3233/SJI-180425. |
[6] | Valle JLV, Jiménez AA, Julián MP. Moving towards a register based census in Spain. Statistical Journal of the IAOS. (2020) Jan 1; 187–192. doi: 10.3233/SJI-190516. |
[7] | Kemendagri. Go digital siap wujudkan single identity number. Kementerian Dalam Negeri Republik Indonesia. [updated 9 February 2019; cited 1 May, 2020]. Available from https://www.kemendagri.go.id/berita/baca/19131/Go-Digital-Dukcapil-Siap-Wujudkan-Single-Identity-Number. |
[8] | Bachenheimer D, Baker D, Banerjee S, Chatfield C, Hyvonen I, Iyer A, Jha M, Kudaravalli S, Leong C, Madhav S, Malik R. Technology landscape for digital identification. World Bank; (2018) . |
[9] | Dygaszewicz J. Transition from traditional census to combined and registers based census. Statistical Journal of the IAOS. (2020) Jan 1; (36): 165–175. doi: 10.3233/SJI-190566. |
[10] | Lagarto S, Delgado A, Paulino P, Capelo J. When is administrative data good enough to replace statistical information? A quality indicator based on census comparison. Statistical Journal of the IAOS. (2017) Jan 1; 33: (3): 749–53. doi: 10.3233/SJI-160333. |
[11] | Poston DL, Micklin M. Handbook of population. Springer US; (2005) . doi: 10.1007/b100598. |


