
A study on the quality of novel coronavirus (COVID-19) official datasets
Abstract
Policy makers depend on complex epidemiological models that are compelled to be robust, realistic, defendable and consistent with all relevant available data disclosed by official authorities which is deemed to have the highest quality standards. This paper analyses and compares the quality of official datasets available for COVID-19. We used comparative statistical analysis to evaluate the accuracy of data collection by a national (Chinese Center for Disease Control and Prevention) and two international (World Health Organization; European Centre for Disease Prevention and Control) organisations based on the value of systematic measurement errors. We combined excel files, text mining techniques and manual data entries to extract the COVID-19 data from official reports and to generate an accurate profile for comparisons. The findings show noticeable and increasing measurement errors in the three datasets as the pandemic outbreak expanded and more countries contributed data for the official repositories, raising data comparability concerns and pointing to the need for better coordination and harmonized statistical methods. The study offers a COVID-19 combined dataset and dashboard with minimum systematic measurement errors, and valuable insights into the potential problems in using databanks without carefully examining the metadata and additional documentation that describe the overall context of data.
1.Introduction
The local outbreak of pneumonia detected in December 2019 in Wuhan (Hubei, China), later determined to be caused by a novel coronavirus denominated severe acute respiratory syndrome coronavirus 2 (SARS-CoV-2), has since spread rapidly to every province of mainland China as well as more than 200 other countries/regions, with more than 3.4 million confirmed cases as of 2 May 2020, threatening human lives and significantly disrupting the world economy and society [1]. The special characteristic of this new virus is how it spread undetected for weeks, which exposed the tardiness and unpreparedness of health systems since its outbreak. Governments and public health systems need accurate and agile information about the characteristics and behaviour of COVID-19 to respond to this ongoing public health emergency appropriately. Researchers, public health authorities, and the general public will benefit from reliable and expeditious data to evaluate the impact of the Coronavirus pandemic on health care systems and to plan for an appropriate policy response at all levels of government [2]. Currently, governments and policymakers throughout the world are being forced to make decisions and take actions based on alternative mathematical models developed for other diseases and/or the experience of other countries in which the outbreak has been detected early and developed. In this situation, high-quality institutional-based datasets are the prerequisite of necessary analysis for public health, which is inherently a data-intensive domain [3]. Effective data quality assessment in the data collection process would guarantee the concordant outcomes from different studies worldwide.
There are several institutional-based repositories of public health data with the capability of electronic data collection and dissemination such as the datasets of public health information systems (PHIS), with various data quality assessment methods and standards [3]. However, poor data quality or coding errors in PHIS is not a new issue and can lead to inaccurate inferences of health interventions [4]. For COVID-19, multi-source datasets of the “World Health Organization (WHO)”, “European Centre for Disease Prevention and Control” and “Chinese Center for Disease Control and Prevention (Chinese CDC)” are reputable references for global BI dashboards and academic research, comprising measures of confirmed, deaths, severe, suspected and recovered cases. These resources are widely used to monitor trends in the virus outbreak and assess the risks of the pandemic in several countries and regions.
This study assesses the systematic measurement errors, completeness, accuracy, and timeliness of the mentioned official datasets for COVID-19 by using text-mining, reviewing reports, metadata and reference data to extract the essential information for qualitative and quantitative assessment. As we are in the primary stage of this world pandemic, our goal is to investigate and compare the official COVID-19 datasets for data-quality assessment to identify potential improvements and to provide a novel combined dataset with minimum systematic measurement errors to be used by researchers and decision makers. The findings show noticeable and increasing measurement errors in the three datasets as the pandemic outbreak expanded and more countries contributed data for the official repositories, raising data comparability concerns and pointing to the need for better coordination and harmonized statistical methods. The presence of measurement errors causes biased and inconsistent parameter estimates and leads to erroneous conclusions to various degrees in epidemiological analysis. We provide a corrected dataset incorporating our findings of the necessary corrections of these data sources, imputation of missing values, outlier treatment and adjusting the date attribute, which we concluded were suffering from a one or two-day lag. This data set with 11,838 rows and 37 attributes and minimal measurement error is available for further research and the users of these official data sources [5]. The authors provide also a dedicated data dashboard for an online visual summary of the main findings of this article, which is available online as a graphical abstract [5].
The description of the dataset comparisons provides valuable insights into the potential problems in using databanks that are the repository of information from many countries without carefully examining the metadata and additional documentation that describe the content and the overall context of data. Developing guidelines, standards, and ontologies for data documentation is crucial for researchers and policymakers in terms of understanding the context of data creation and collection. Moreover, the altering way in which confirmed cases and deaths have been classified in China points to similar problems which may arise in other countries which require a careful forensic analysis on a regular basis to understand how definitions are applied and to what extent data are comparable. There is a growing need for harmonization and standardization of the data gathering, reporting and data analysis processes.
In epidemic modelling, there is an increasing need to exploit information from multiple conventional and non-conventional sources, ensuring decision-making on public health policies geared to control epidemics is progressively data and model driven [6, 7]. Several epidemiological models of COVID-19’s outbreak and spread have been used to provide a preliminary assessment of the magnitude and timeline for confirmed cases, long-term predictions of deaths or hospital utilization, the effects of quarantine, stay-at-home orders and other social distancing measures, travel restrictions or the pandemic’s turning point. The accuracy and validity of these models crucially depends on data availability and quality. The impact on epidemiological models of the errors that can be found in the international databases is of matter of great concern since these models will continue to be used worldwide to inform national and local authorities on how to implement an adaptive response approach to re-opening the economy, re-open schools, alleviate business and social distancing restrictions, allow sports events to resume. To highlight these problems, we provide a brief study of the impact of imported cases on model fitting considering the data for China and to underline the implications for models developed in countries where imported cases have been prominent in triggering the pandemic there.
Table 1
Sample of extracted data from situation reports of the World Health Organisation (WHO)
| Row | Date | Code | Area | Country | Confirmed cases | Confirmed new cases | Deaths | New deaths |
|---|---|---|---|---|---|---|---|---|
| 2501 | 20200316 | CN | Western Pacific Region | China | 81077 | 29 | 3218 | 14 |
| 2514 | 20200316 | IT | European Region | Italy | 24747 | 3590 | 1809 | 368 |
| 2569 | 20200316 | ID | South-East Asia Region | Indonesia | 117 | 0 | 4 | 0 |
| 2577 | 20200316 | IR | Eastern Mediterranean | Iran | 14991 | 2262 | 853 | 245 |
| 2594 | 20200316 | US | Region of the Americas | USA | 1678 | 0 | 41 | 0 |
| 2628 | 20200316 | ZA | African Region | S. Africa | 51 | 13 | 0 | 0 |
| 2652 | 20200316 | * | Cruise ship Diamond Princess (Japan) | Other | 712 | 15 | 7 | 0 |
Although this analysis is being conducted at a relatively early stage of the epidemics and, in the course of time, additional data sets have become available, the paper approach on the identification of measurement errors remains timely, useful, and important. Indeed, our paper shows that the significant challenges posed by the epidemic context offer a renovated opportunity to improve the quality of official statistical methodology, particularly where several datasets may be needed to inform an epidemiological model. The paper also contributes to the ongoing discussion triggered by the Statistical Journal of the IAOS (SJIAOS) on the need for good (old and new) official statistics in the preparation of the important political decisions required to tackle the problems that will be at the top of the agenda in the next phases of the crisis management (e.g., economic recovery plans, unemployment, collateral illnesses (depression, suicide), domestic violence), as well as to address all the topics that were given lower priority in the short-term crisis (e.g., UN Sustainable Development Goals, reducing poverty and inequality, climate change and biodiversity challenges) that will shape the world of tomorrow.11 The current experience also shows that the preparation and dissemination of official statistics contributes to reduce the “pandemics of fear” and “fake news” that either try to minimize or overstate the severity of the public health threat, eroding trust in public health authorities, potentially reducing compliance with essential protective guidance. The structure of the remaining of this paper is as follows: Section 2 provides a brief description of the official COVID-19 datasets and how the data was handled. Section 3 describes the data and methods used in this study. Section 4 presents and discusses the main results of the investigation. Finally, Section 5 concludes.
2.Official COVID-19 datasets: An overview
2.1World Health Organization (WHO) reports
The World Health Organization (WHO) has been in regular and direct contact with Chinese as well as authorities in other countries since the reporting of their cases. It provides daily situation reports for within and outside of mainland China. These situation reports include the raw data and the metadata, in pdf format files, to represent the numbers and inform the developments of public health policies such as quarantine and the establishment of priorities such as urgent research for implementing surveillance of this new disease [1]. The first report was published on January 21 2020, with a small table consisting of four countries and included four territories or areas of China with reported confirmed cases of 20 January 2020. There are informative details about the reported cases, Wuhan City, and the surveillance and preparedness in all infected countries. We loaded the data by using a semi-automated table recognition strategy for the WHO pdf files and read the contents of the reports for additional data or information by purpose. The structure of pdf files was not similar, and the number of tables was not fixed. Therefore, it was difficult to read their data fully automatically, and we interfered manually to adjust the program several times. The result was a table with 11,838 rows of time-series data referring to countries and nine columns consisting of attributes, namely, Row, Date, Country Code, WHO Region, Country/Territory/Area, Confirmed Cases, New Cases, Total Deaths, and New Deaths, a sample of which is shown in Table 1. Data entry and number verification took several days to avoid systematic data collection errors. This process could have been fully automated had the number of tables in the different pdf files, and the structure of the tables been fixed by the WHO. However, as the outbreak evolved the manual collecting and reporting process became unsustainable.
Table 2
Top 10 rows of aggregated attributes of COVID-19 for China (CN) – Western Pacific Region
| Row | Date | Total confirmed cases in PLADs | Total severe cases | Total deaths | Total recovered and discharged | Total suspected cases | Total confirmed cases in Regions | Total confirmed in PLADs and Regions |
|---|---|---|---|---|---|---|---|---|
| 1 | 20200118 | 62 | 0 | 62 | ||||
| 2 | 20200119 | 198 | 0 | 198 | ||||
| 3 | 20200120 | 291 | 0 | 291 | ||||
| 4 | 20200121 | 440 | 9 | 0 | 440 | |||
| 5 | 20200122 | 571 | 95 | 17 | 3 | 574 | ||
| 6 | 20200123 | 830 | 166 | 25 | 8 | 838 | ||
| 7 | 20200124 | 1287 | 237 | 41 | 38 | 1965 | 18 | 1305 |
| 8 | 20200125 | 1975 | 324 | 56 | 49 | 2684 | 28 | 2003 |
| 9 | 20200126 | 2744 | 461 | 80 | 51 | 5794 | 45 | 2789 |
| 10 | 20200127 | 4515 | 976 | 106 | 60 | 6973 | 65 | 4580 |
Source: Author’s preparation based on the Chinese CDC.
Table 3
Top 10 rows of new attributes of COVID-19 for China (CN) – Western Pacific Region
| Row | Date | New confirmed cases in PLADs | New severe cases | New deaths | New recovered and discharged | New suspected | New confirmed cases in Regions | New confirmed cases in PLADs and | |||
|---|---|---|---|---|---|---|---|---|---|---|---|
| Regions | Close contacts | Have been released | Under medical observation | ||||||||
| 1 | 20200118 | 0 | |||||||||
| 2 | 20200119 | 136 | 136 | ||||||||
| 3 | 20200120 | 77 | 77 | ||||||||
| 4 | 20200121 | 149 | 3 | 0 | 149 | ||||||
| 5 | 20200122 | 131 | 8 | 257 | 3 | 134 | 5897 | 969 | 4928 | ||
| 6 | 20200123 | 259 | 8 | 6 | 680 | 5 | 264 | 9507 | 1070 | 8437 | |
| 7 | 20200124 | 444 | 16 | 3 | 1118 | 10 | 454 | 15197 | 1230 | 13967 | |
| 8 | 20200125 | 668 | 87 | 15 | 11 | 1309 | 10 | 678 | 23431 | 325 | 21556 |
| 9 | 20200126 | 769 | 137 | 24 | 2 | 3806 | 17 | 786 | 32799 | 583 | 30453 |
| 10 | 20200127 | 1771 | 515 | 26 | 9 | 2077 | 20 | 1791 | 47833 | 914 | 44132 |
Source: Author’s preparation based on the Chinese CDC.
2.2European Centre for Disease Prevention and Control dataset (ECDC)
A data file in Excel format and the appropriate R software code to read the file from its source are available on the ECDC website [8]. It is updated daily and contains the latest available public data on COVID-19. This data file put the attributes of Date, Day, Month, Year, Confirmed Cases, Death, Name of the Country, population in 2018 [9] and alpha-2/alpha 3 Country code [10, 11] in columns. The date and alpha-2 country code attributes are useful to be concatenated as a single code for merging different databases and putting the numbers in the corresponding rows of the query dataset. We used this strategy to find the unique rows in the different datasets and to make a unique dataset for our further analysis. In this case, the date and code of countries should be accurate to allow users to manipulate the data and use it for statistical analysis or reporting purposes. Name of countries is not recommended, because they might be written in different ways, especially for countries with separate names, which could be compiled with dashes, parentheses, or blanks.
2.3Chinese Center for Disease Control and Prevention (Chinese CDC)
The Chinese CDC Weekly website makes daily reports available for the public via their online portal [12]. This platform has started to publish COVID-19 reports, by using various national data sources from 19 January, 22:00 CST (UTC
Table 4
Analytical base table (ABT) of joined data sources
| Attribute | Description | Additional information |
|---|---|---|
| Row | Row number | It is useful to sort the dataset to its original order. |
| Date | Date of the referenced day | Date in the yyymmdd format referenced to the past 24 hours of the date mentioned. |
| Year | Year of referenced day | Year in the yyyy format. |
| Month | Month of referenced day | Month in the mm format. |
| Day | Referenced day | Day in the dd format. |
| Area | WHO region | The World Health Organization divides the world into six WHO regions, for the purpose of reporting, analysis and administration. |
| Country | Name of country | Name of countries based on WHO reports. |
| Country_Number | M49 code | Standard country or area codes for statistical use. |
| Alpha-2 | Abbreviation code of the country – Two letters | Includes two letters for each country, except for JPG11668, which is allocated to the Diamond Princess Cruise Ship (Japan). |
| Alpha-3 | Abbreviation code of the country – Three letters | Includes three letters for each country, except for JPG11668, which is allocated to the Diamond Princess Cruise Ship (Japan). |
| latitude | Latitude of the country | |
| longitude | Longitude of the country | |
| Population | Total population of the country (thousands) | From World Population Prospects 2019, United Nations, Department of Economic and Social Affairs. |
| WHO_TCC | WHO Total confirmed cases | Total confirmed cases are the aggregation of confirmed cases during the time, including both laboratory-confirmed and clinically diagnosed cases in WHO reports. |
| WHO_NCC | WHO New confirmed cases | New confirmed cases is similar to WHO_TCC but for new cases in WHO reports. |
| WHO_TD | WHO Total deaths | Cumulative aggregation of deaths in WHO reports. |
| WHO_ND | WHO New deaths | Number of new deaths in WHO reports. |
| CCDC_TCC | CCDC Total confirmed cases | Cumulative aggregation of confirmed cases includes both laboratory-confirmed and clinically diagnosed cases in CCDC reports. |
| CCDC_NCC | CCDC New confirmed cases | New confirmed cases are similar to CCDC_TCC but for new cases in CCDC reports. |
| CCDC_TD | CCDC Total deaths | Cumulative aggregation of deaths in CCDC reports. |
| CCDC_ND | CCDC New deaths | Number of new deaths in CCDC reports. |
| ECDC_TCC | ECDC Total confirmed cases | This column is calculated from ECDC_NCC by author’s. |
| ECDC_NCC | ECDC New confirmed cases | New confirmed cases in the ECDC public dataset. |
| ECDC_TD | ECDC Total deaths | This column is calculated from ECDC_ND by author’s. |
| ECDC_ND | ECDC New deaths | Number of new deaths reported in the ECDC public dataset. |
| TCC_authors | Corrected total confirmed cases | Total confirmed cases with measurement error correction by authors. |
| NCC_authors | Corrected new confirmed cases | New confirmed cases with measurement error correction by authors. |
| TD_authors | Corrected total deaths | Total deaths with measurement error correction by authors. |
| ND_authors | Corrected new deaths | New deaths with measurement error correction by authors. |
| MR | Mortality rate | Mortality rate (TD_authors/Population) based on measurement error correction by authors. |
| FR | Fatality rate | Fatality rate (TD_authors/TCC_authors) based on measurement error correction by authors. |
| TCC/Pop | Corrected TCC adjusted for Population (thousands) | Corrected total confirmed cases with an adjustment for population. |
| NCC/Pop | Corrected NCC adjusted for Population (thousands) | Corrected new confirmed cases with an adjustment for population. |
Source: Author’s preparation. DOI: 10.17632/nw5m4hs3jr.2.
3.Methods
3.1Data
The data used in this study is from the repositories of the World Health Organisation (WHO), the European Centre for Disease Prevention and Control dataset (ECDC) and the Chinese Center for Disease Control and Prevention (Chinese CDC). First, we performed the text mining and loaded the data of the reports from the pdf files and websites along with the perusal of the full reports. Then, by reading the first eight characters of the country names, the alpha-2 codes were added to all rows of these datasets, combined with the Date variable for each row to make a unique primary key for each country and each day. This primary key was used to combine these three datasets into one. A manual search of the reports and dataset metadata was conducted to improve accuracy and to identify new attributes and statistics inside the text of the reports together with some new information referenced by other publications or well-known communities. For instance, data referring to 17 November and 20 December 2019, were added to those mentioned datasets. An Analytical Base Table of the combined data sources is shown in Table 4 [5].
Table 5
Negative values in datasets
| Date | Code | Area | Country | WHO_TCC | WHO_NCC | ECDC_NCC |
|---|---|---|---|---|---|---|
| 20200310 | KH | Western Pacific Region | Cambodia | 2 | 0 |
|
| 20200310 | JPG11668 | Cruise ship (Diamond Princess) | Other | 696 | 0 |
|
| 20200419 | ES | European Region | Spain | 191726 | 3658 |
|
| 20200429 | LT | European Region | Lithuania | 1449 | 0 |
|
Source: Author’s preparation.
Figure 1.
Scatter plot and correlation between CCDC reports with WHO, and ECDC reports.
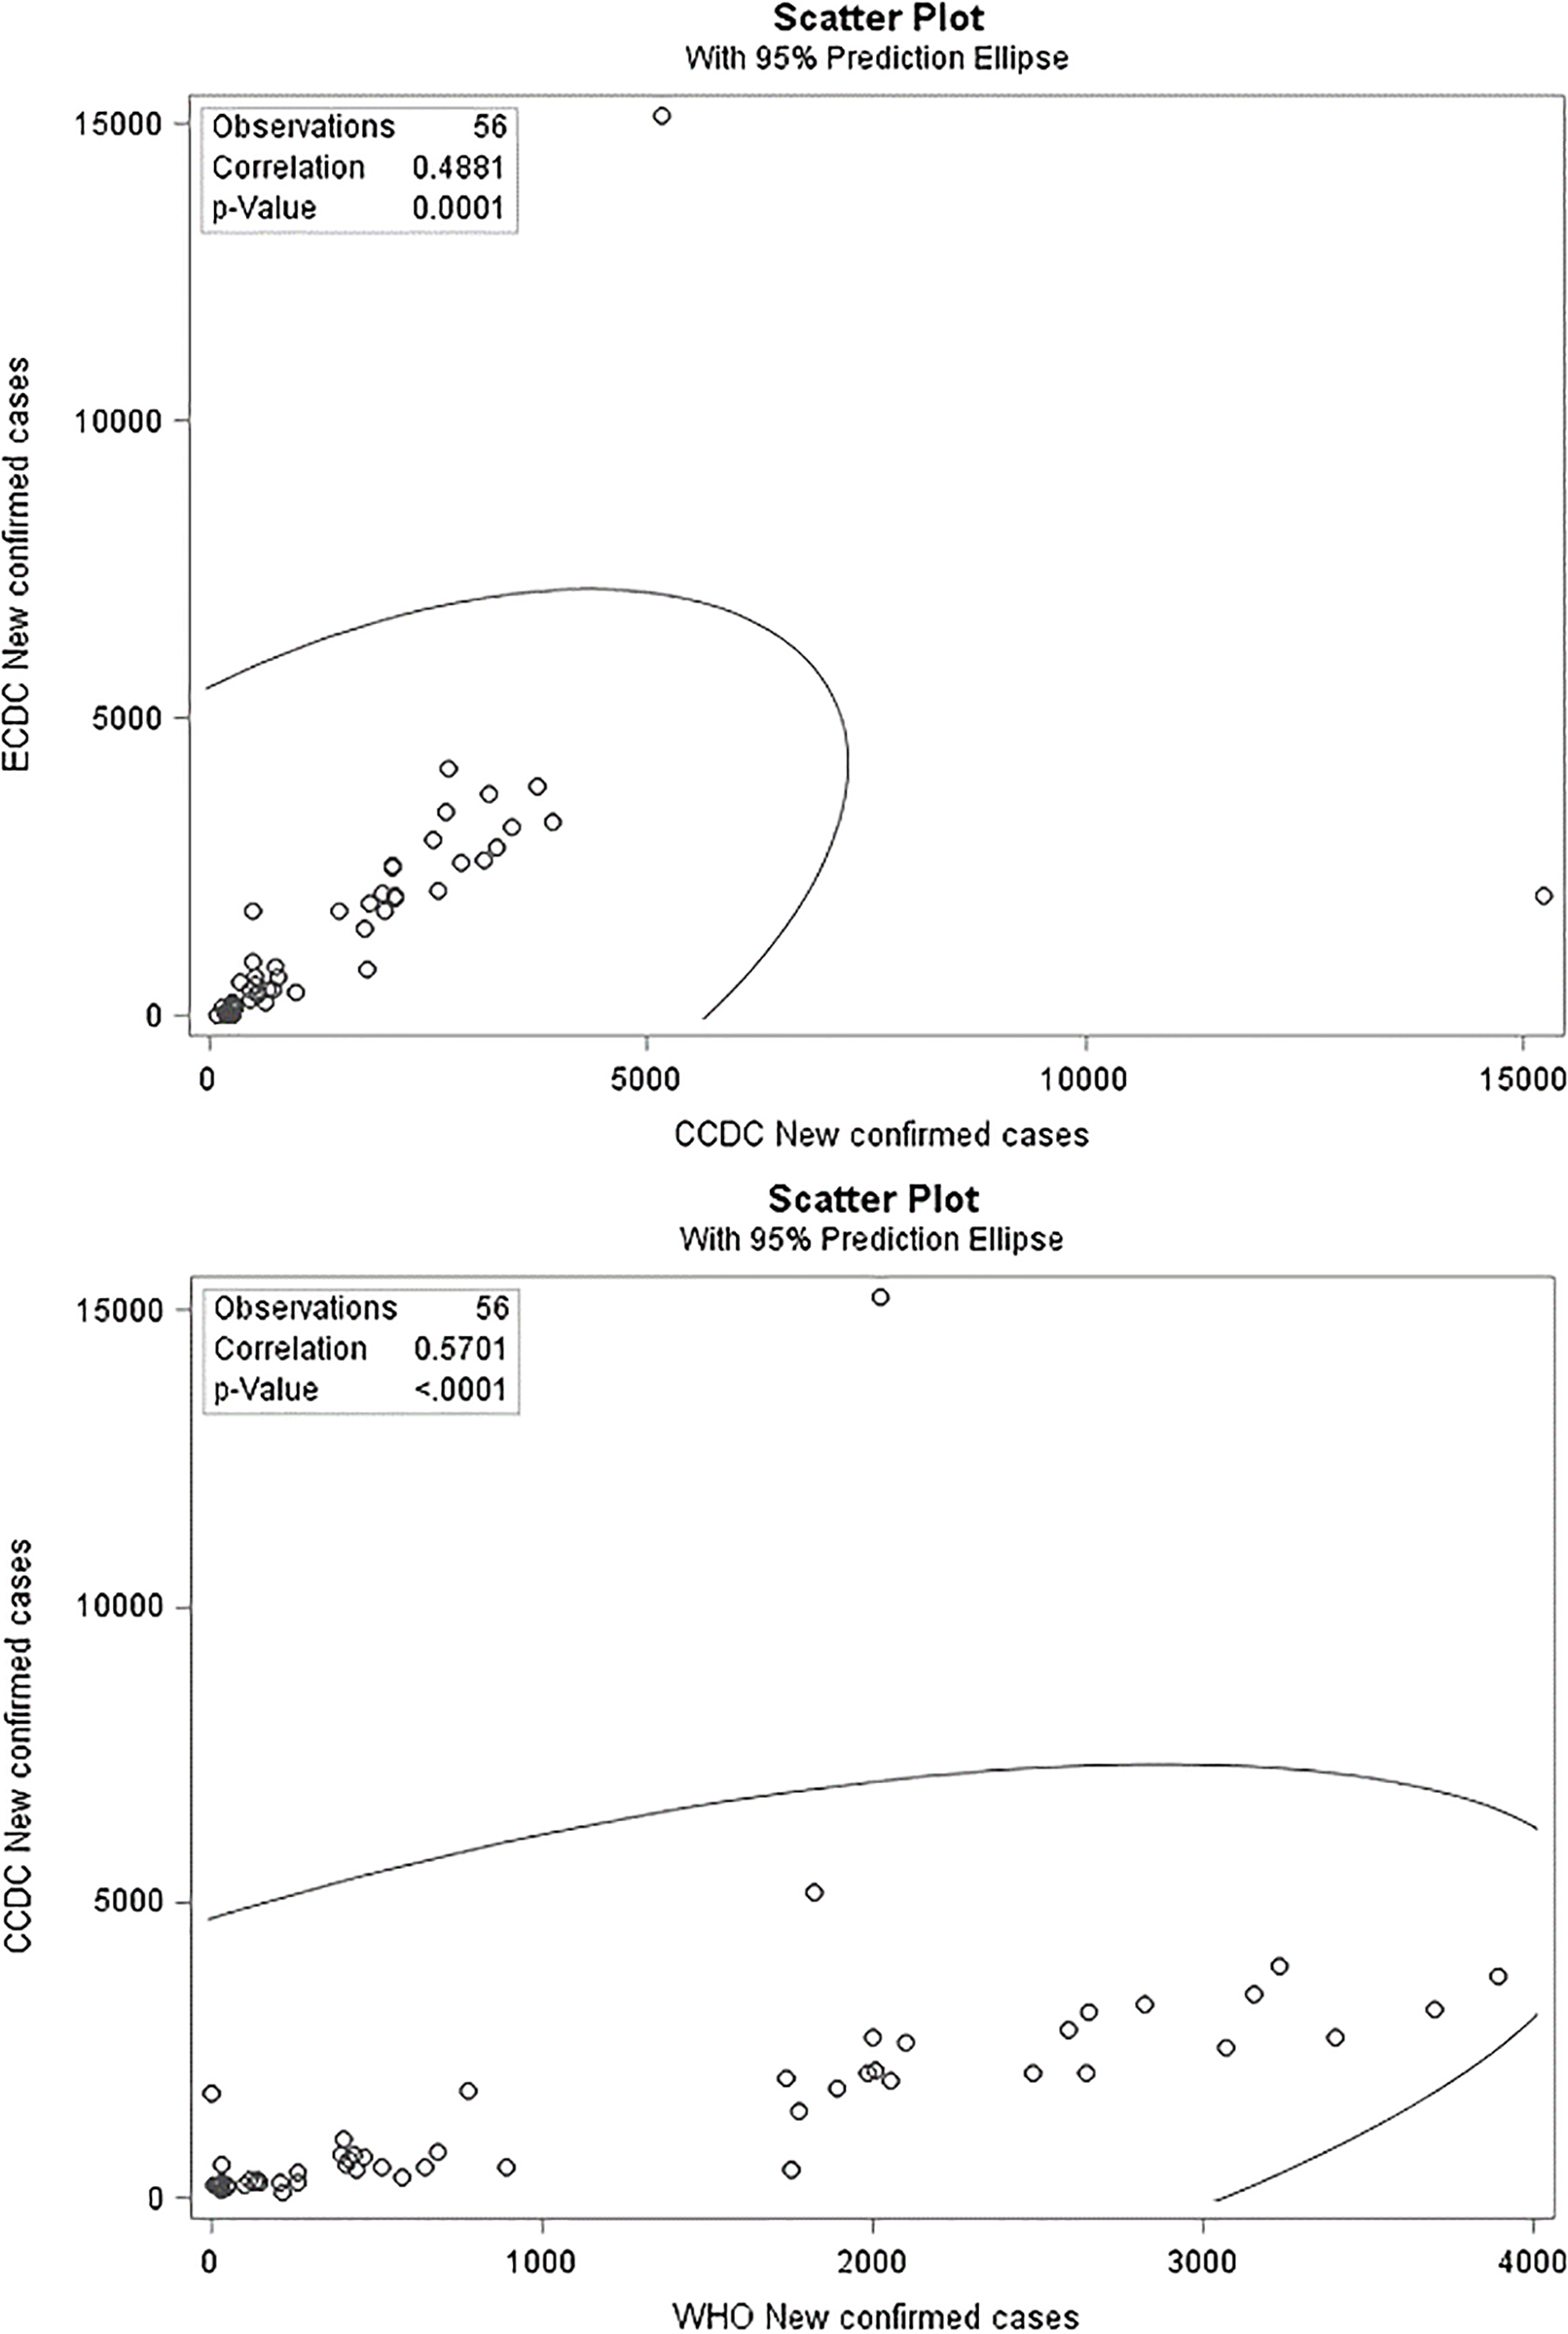
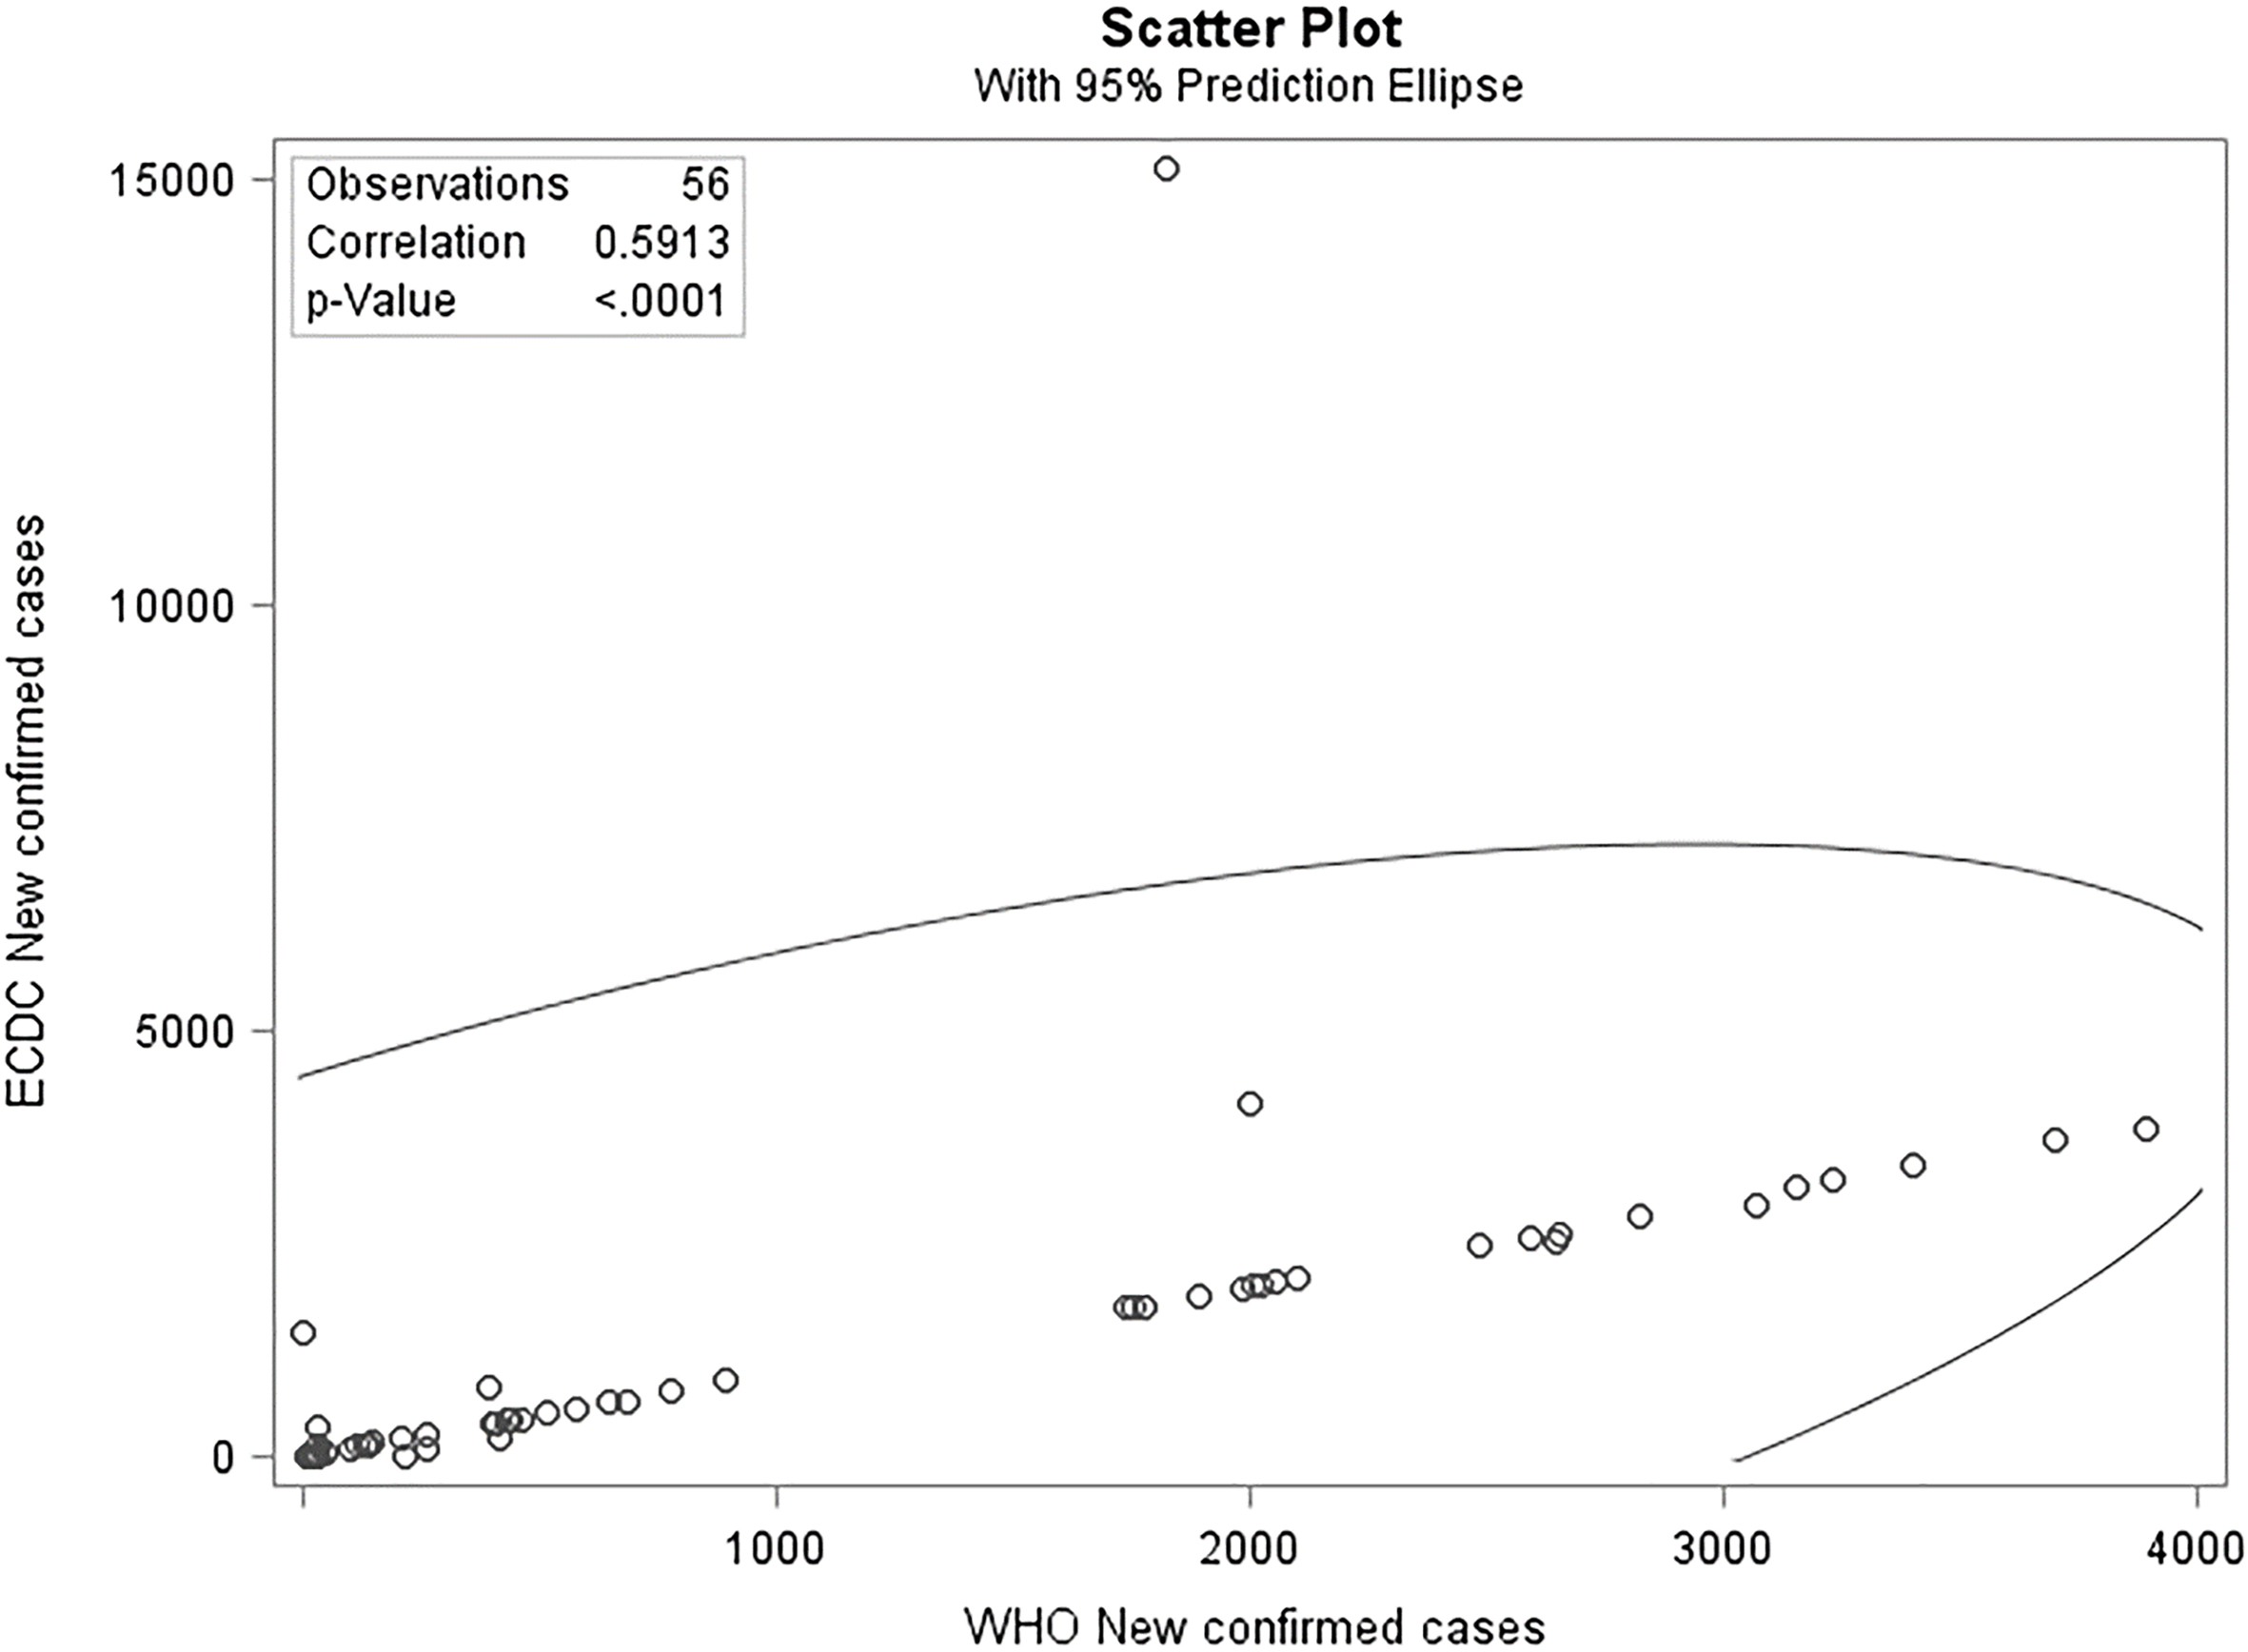
Figure 2.
Correlation of NCC between WHO and ECDC reported data.
3.2Errors and outliers
We checked the new dataset for negative numbers and discovered four negative values in the attribute of new confirmed cases in the ECDC dataset, as shown in Table 5. As evident in the first row of Table 5, the value of minus nine is not possible when the total infected is two. Some official statistics authorities usually use the digit 9 for unknown situations; however, in this case, we did not find any evidence of this tradition. Also, the WHO reported zero new confirmed cases for the Diamond Princess Cruise ship on 10 March 2020. Therefore, we corrected these four negative values, according to the WHO reported values. In Fig. 1, we can see the correlation between the three datasets for new confirmed cases in China, which is less than 60%. Because China (Wuhan, Hubei) was the first place to face the COVID-19 outbreak, one might expect the Chinese data to be completer and more robust when compared to other countries. Nevertheless, the correlations among the CCDC dataset and the two other official datasets are very low as presented in Fig. 1, especially for attributes which should have almost the same values. As discussed, the authors extracted the CCDC data directly from the official CCDC website, which is assumed to be a reliable source for the comparisons. These corrections were not enough to significantly reduce the distortions in these datasets. Indeed, the correlation between new confirmed cases reported by the WHO and ECDC (Fig. 2) continues to be less than 60%, which is still considered to be a small number, but we can now observe that the distortion is slightly smaller than that in Fig. 1 and the correlation is almost linear.
One attribute which could make this situation possible is the calendar date variable. Therefore, we checked the date variable and corresponding values in the three datasets. We determined that the values of this variable suffer from a one-day lag between the different datasets as follows. The WHO reports were initiated on 21 January 2020 and, as mentioned, in the first report that date refers to the occurrences on 20 January. Subsequently, the January 22
This distortion was judged to need correction because, as mentioned, it is common to use the date attribute and country codes to create a primary key for these kinds of datasets. Furthermore, the exact report dates were essential to evaluate the outcomes of policy interventions and the effectiveness of public health measures to reduce the disease severity. In this regard, even a small error in the date of clinical reports can change the clinical data analysis explanations and results and wrongly inform decision makers.
The data analysis also identified some outliers, which are shown in Figs 1 and 2. Finally, in the first four days, the values presented in the reports were dramatically different, and there were especially acute different values for some other days in some parts of datasets. The root mean square errors of attributes in the paired comparison of datasets were noticeable and increasing with time as the pandemic outbreak expanded and more countries contributed data for the official datasets (Table 6). This points increasing risks on the use of innacurate datasets as the pandemic develops and global modelling and comparisons is made.
Table 6
Root mean square errors of attributes of different reports
| TCC | NCC | NCC of WHO & ECDC | NCC of CCDC & ECDC | TD | ND | ND of WHO & ECDC | ND of CCDC & ECDC | |
| January | ||||||||
| RMSE | 73.44 | 432.96 | 123.24 | 28.22 | 123.23 | 25.75 | 7.38 | 1.04 |
| N | 12 | 12 | 147 | 12 | 12 | 12 | 147 | 12 |
| 29 February | ||||||||
| RMSE | 2444.9 | 2166.94 | 419.46 | 190.85 | 71 | 53.44 | 11.08 | 16.89 |
| N | 41 | 41 | 1050 | 41 | 41 | 41 | 1050 | 41 |
| 31 March | ||||||||
| RMSE | 4965.82 | 1663 | 300.63 | 343.45 | 53.69 | 40.34 | 10.41 | 12.8 |
| N | 72 | 72 | 5689 | 72 | 72 | 72 | 5689 | 72 |
| 30 April | ||||||||
| RMSE | 1591.67 | 393.3 | 805.33 | 137.16 | 132.8 | 50.75 | 128.82 | 1591.67 |
| N | 101 | 11836 | 101 | 101 | 101 | 11836 | 101 | 101 |
Source: Author’s preparation. Notes: 1 – Cumulative aggregation of confirmed cases; 2 – New confirmed cases; 3 – Cumulative aggregation of deaths; 4 – Number of new deaths.
Figure 3.
Daily Sum of square error aggregated for all attributes, countries and datasets.
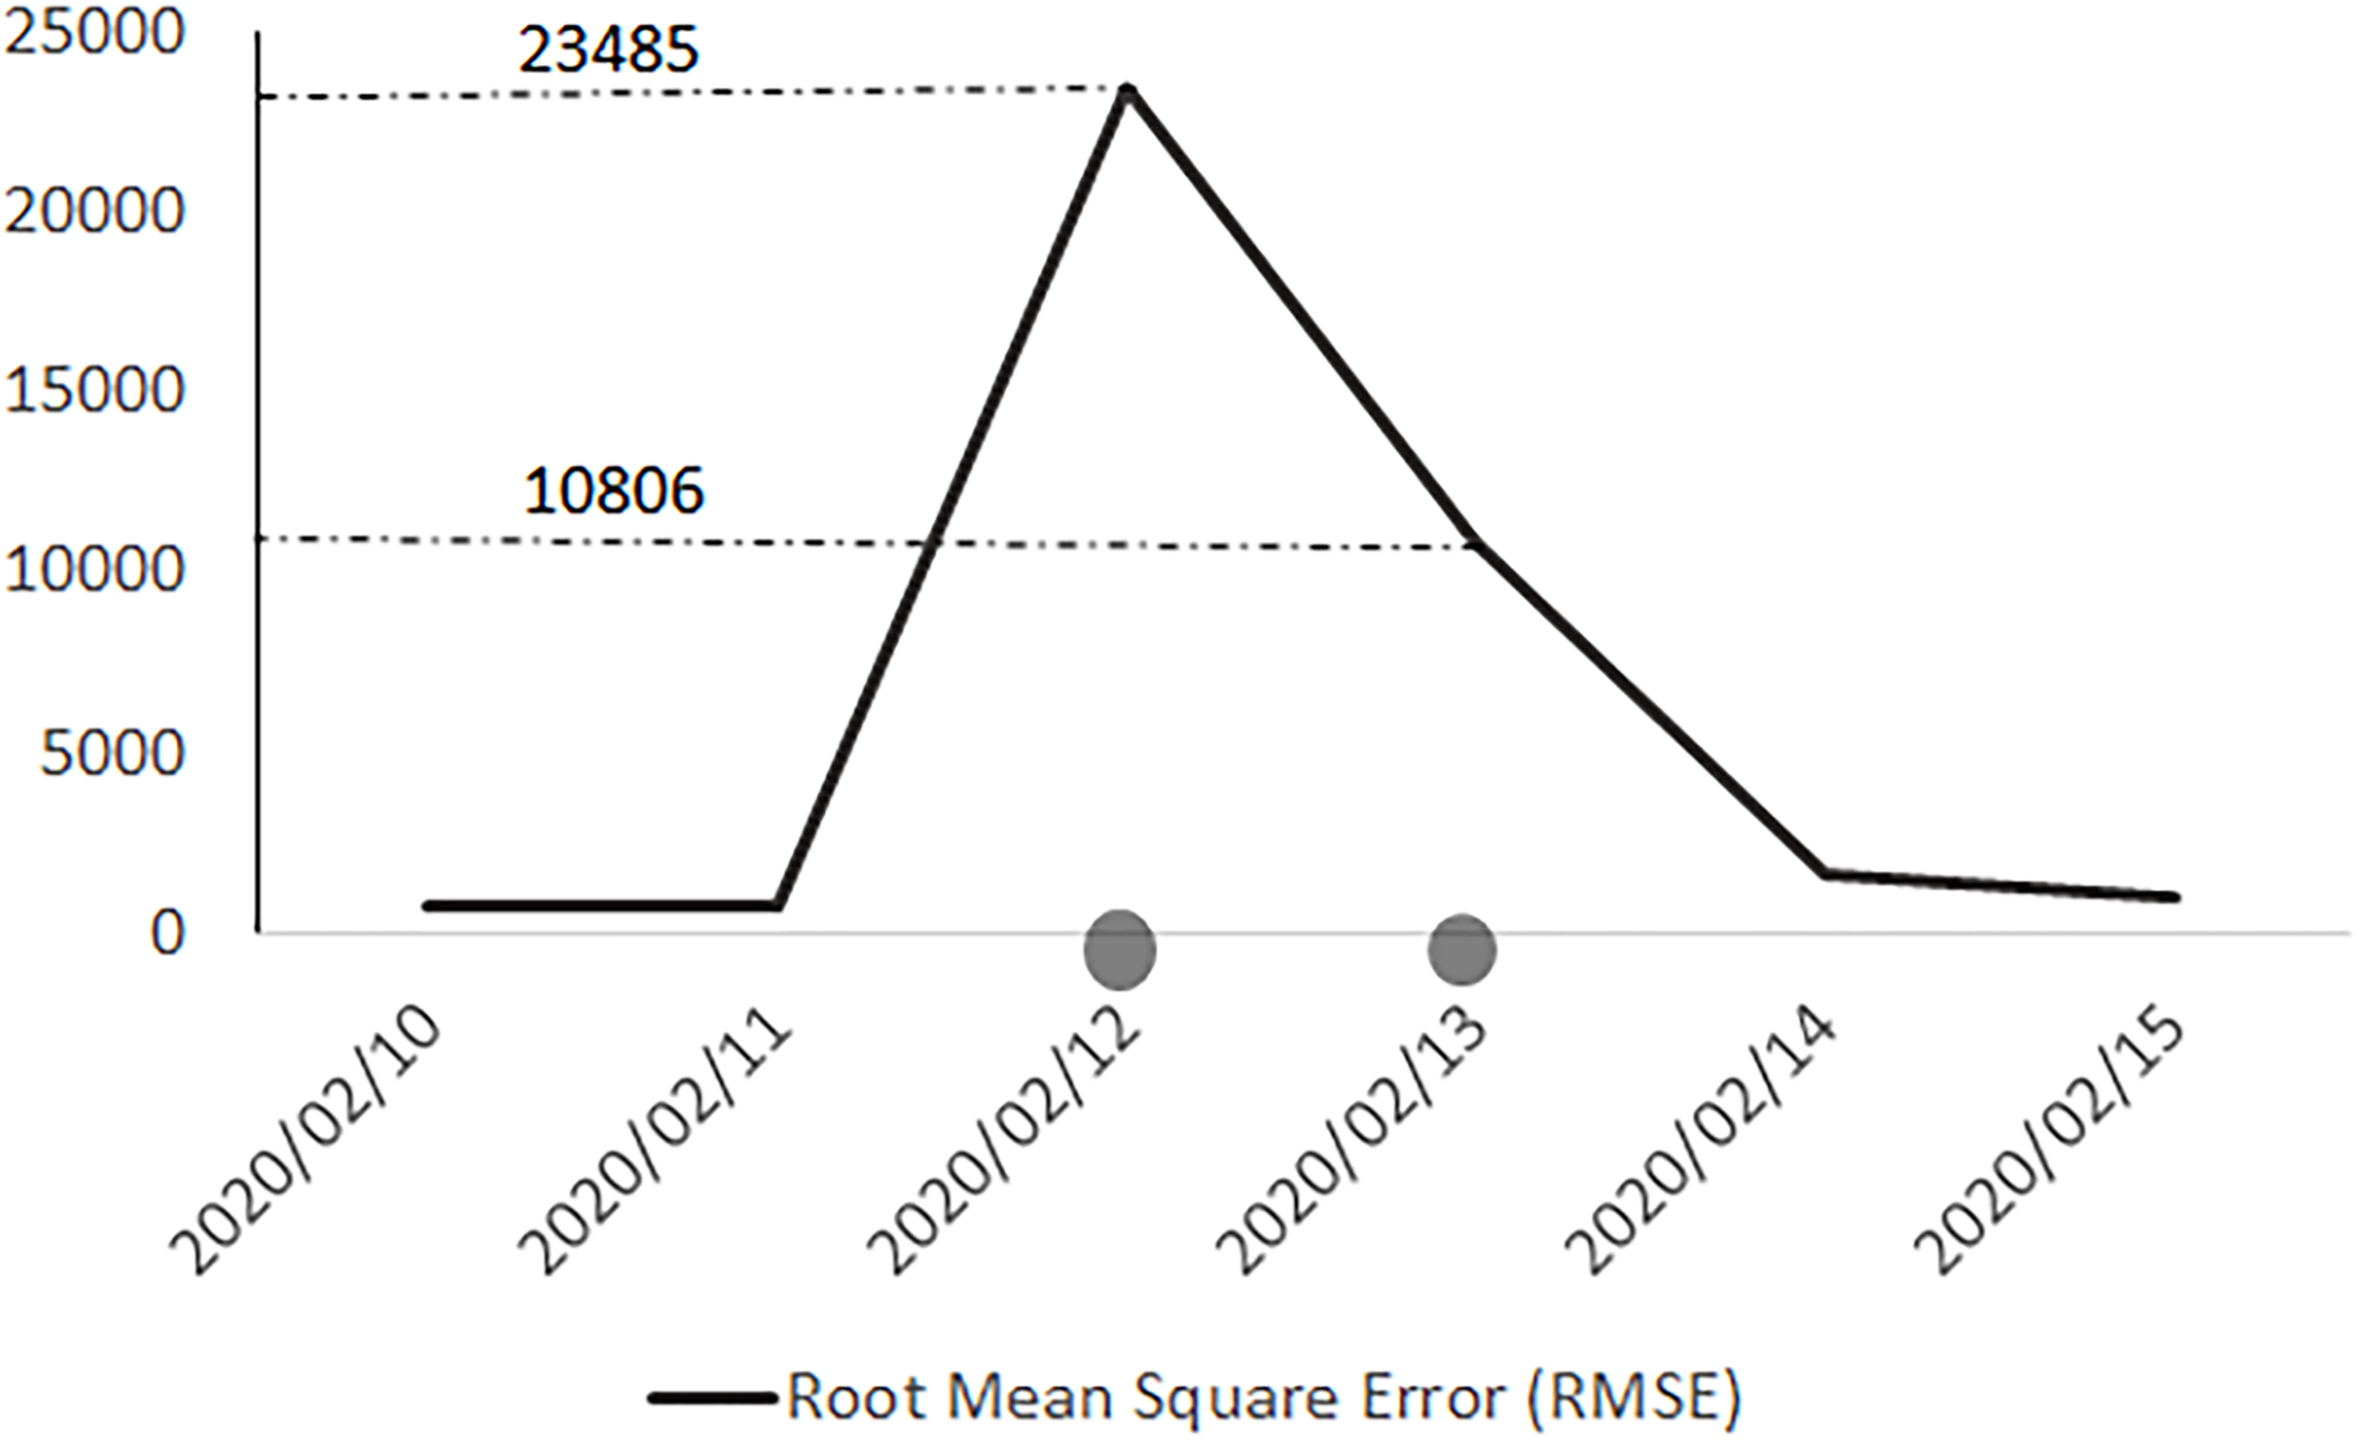
As a result, we reviewed the resources and looked for the logic behind the irregular values of these attributes. From Fig. 3, we noted the first problematic dates are 12 and 13 February. We discerned that the structure of the WHO reports was changed several times on these dates. For instance, the report structure was changed on 13 February 2020, and total deaths and total new deaths were no longer reported. By comparing to the other reports, we could conclude that the WHO became aware of the fact that the Chinese data only referred to laboratory-confirmed cases and did not include clinically diagnosed ones. As a result, in the next report, the report structure was changed once again. On 14 February 2020, instead of reporting China as a whole in the table of countries, the table of Chinese provinces, regions and cities was extended with additional information for laboratory-confirmed and clinically diagnosed cases, and a total number for China could be read from the column aggregates. From this report and comparing the numbers, we could conclude that the numbers, which were previously reported under the “Confirmed Cases” nomenclature only included laboratory-confirmed incidents and not clinically diagnosed ones. Therefore, we could observe a jump in confirmed cases in these three official data sources on 12 and 13 February. This time series leap is what analysts should not consider as a real surge, showing a special treatment of COVID-19 or a real pick in the distribution of data. The use of smoothing techniques could be recommended to researchers for this part of the data sets.
Again, in the 17 February 2020 report, the Chinese table structure was changed to one aggregated column in the WHO situation report, including “reported laboratory-confirmed” and “clinically diagnosed”. Finally, in the 2 March 2020 report, the structure of countries table was changed yet again and the number of new cases and new deaths, which were previously reported in parentheses in front of total confirmed cases and total deaths in the same columns, were separated into new columns. As a result, for the purpose of this research and using the WHO data as one of the main resources, data entry for these days was done manually by the researchers and the missing total deaths and total new deaths relative to 13 February were imputed by using interpolation and available information from 12 to 14 February.
Figure 4.
Positive trend in the root mean square error aggregated for all attributes related to new cases for all countries in the three reference datasets.
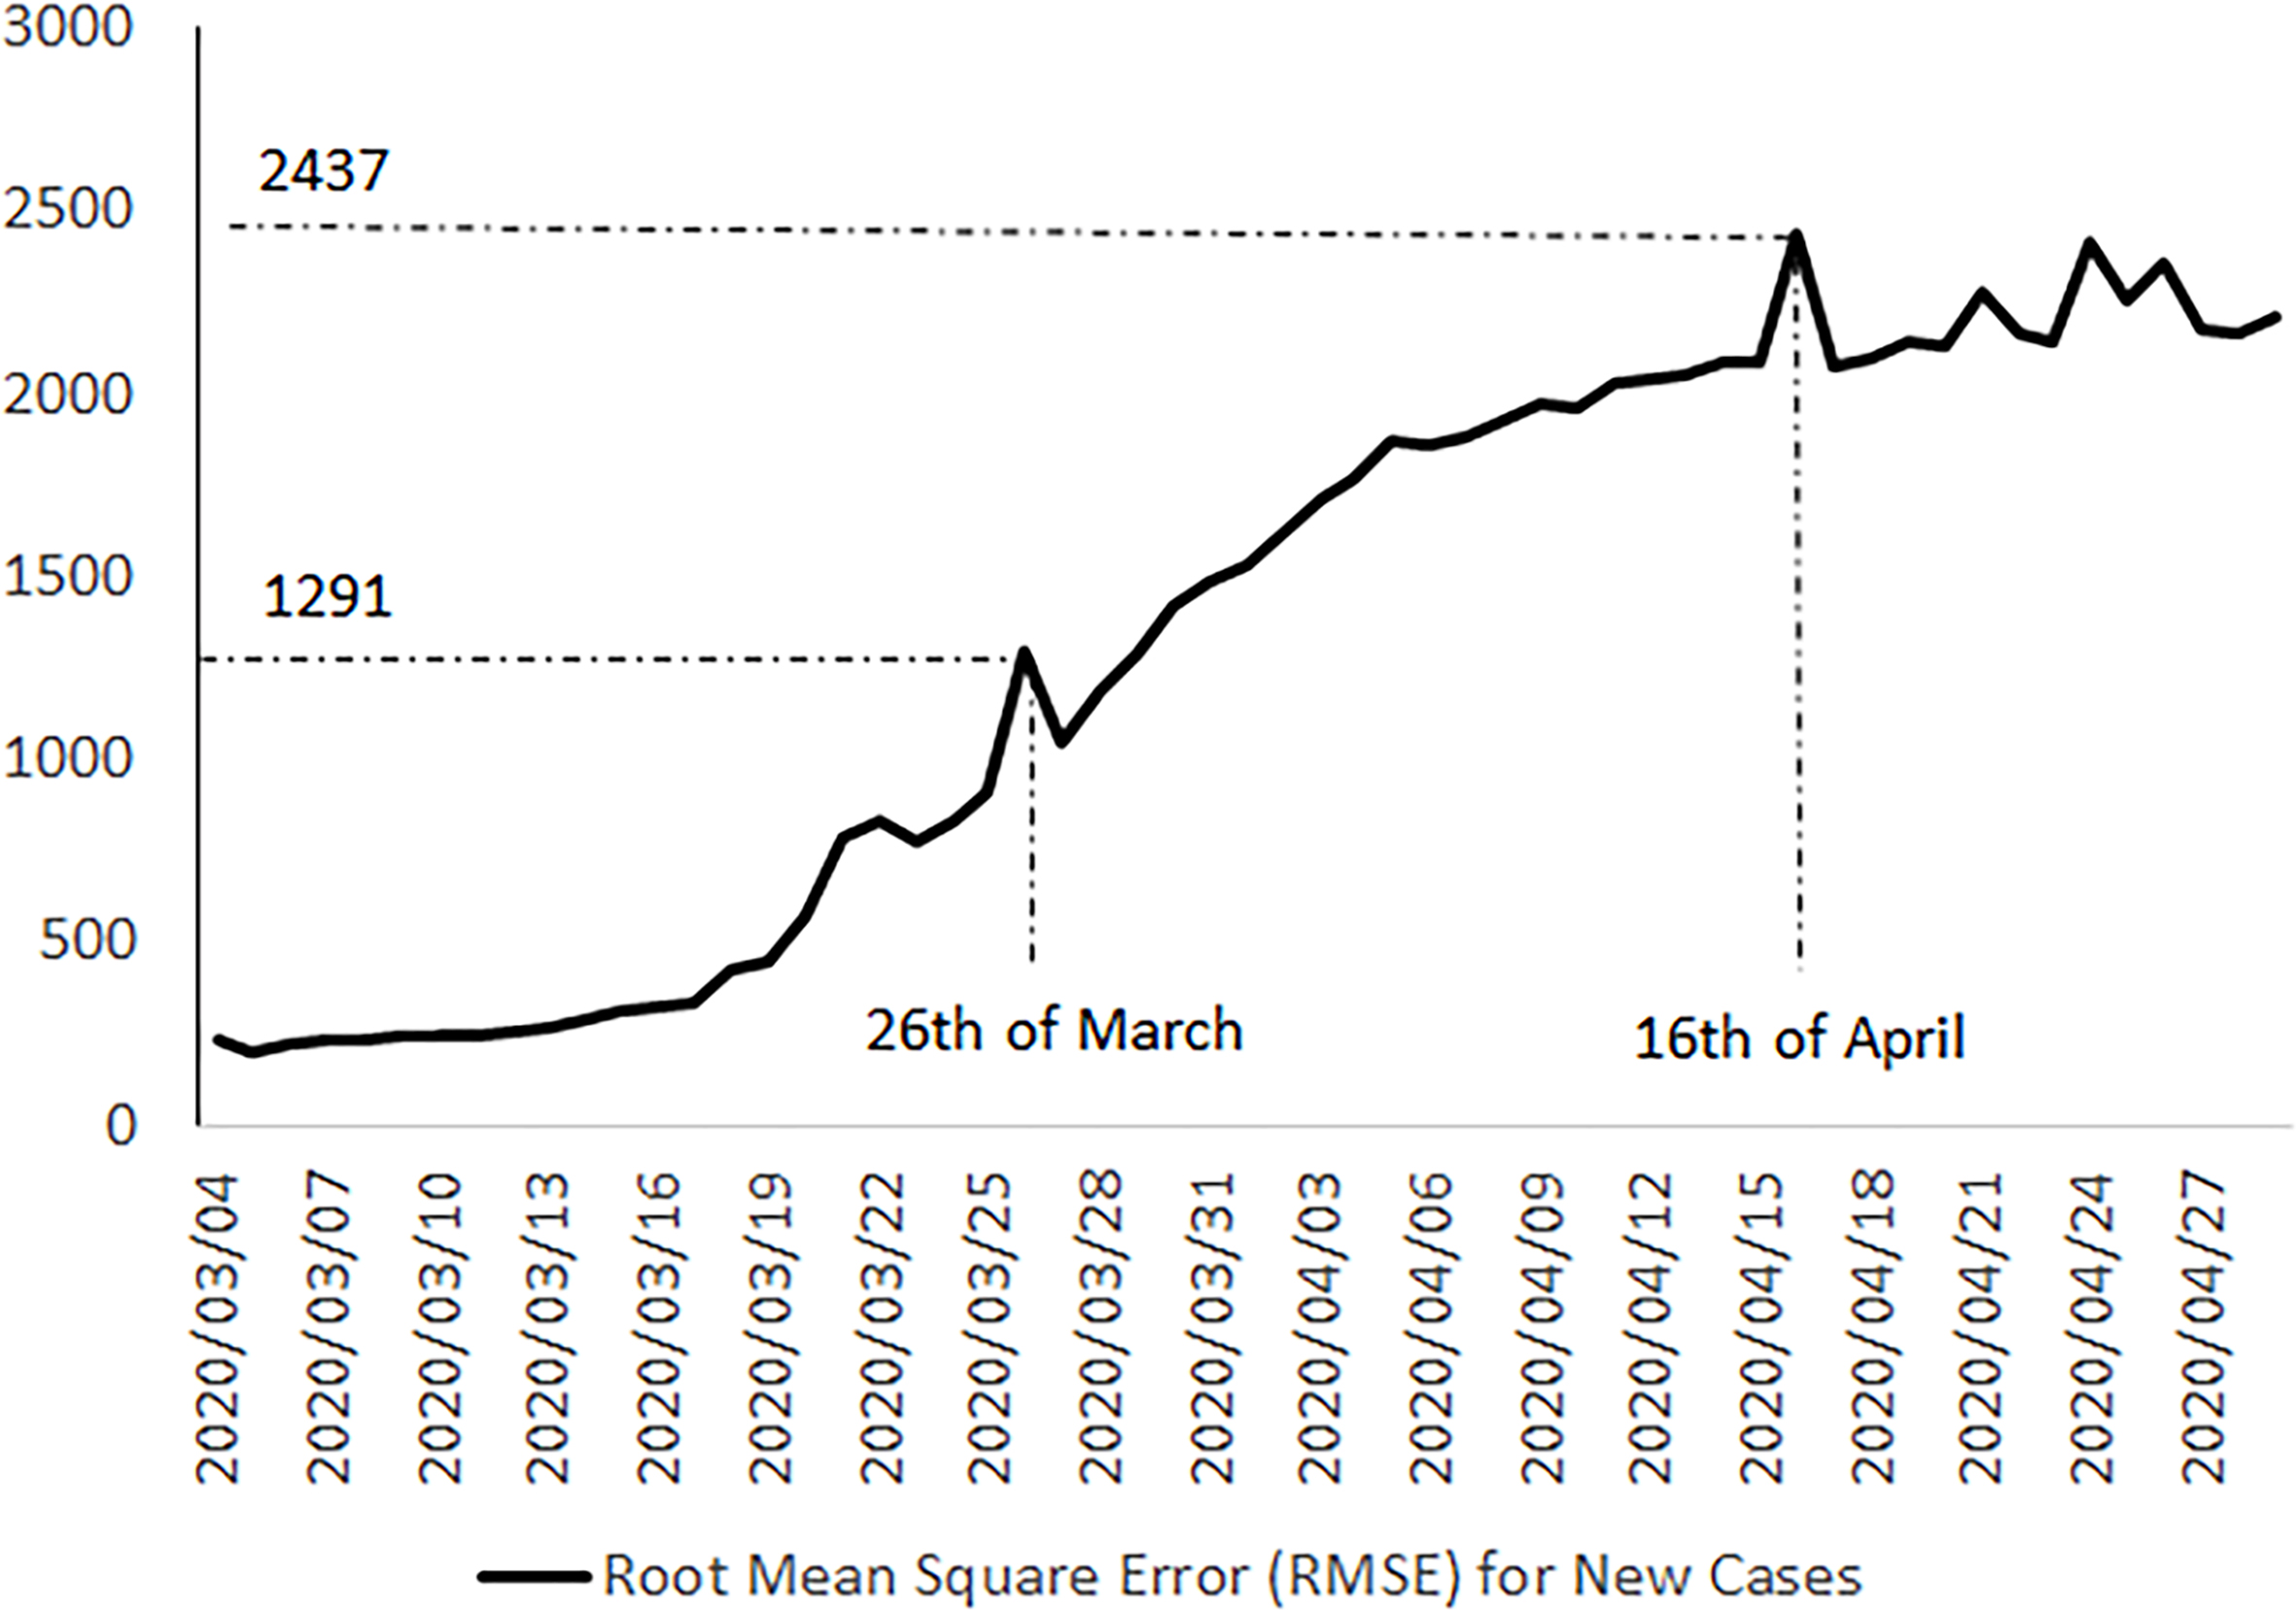
Figure 5.
Positive trend in the root mean square error aggregated for total confirmed cases of all countries in the three reference datasets.
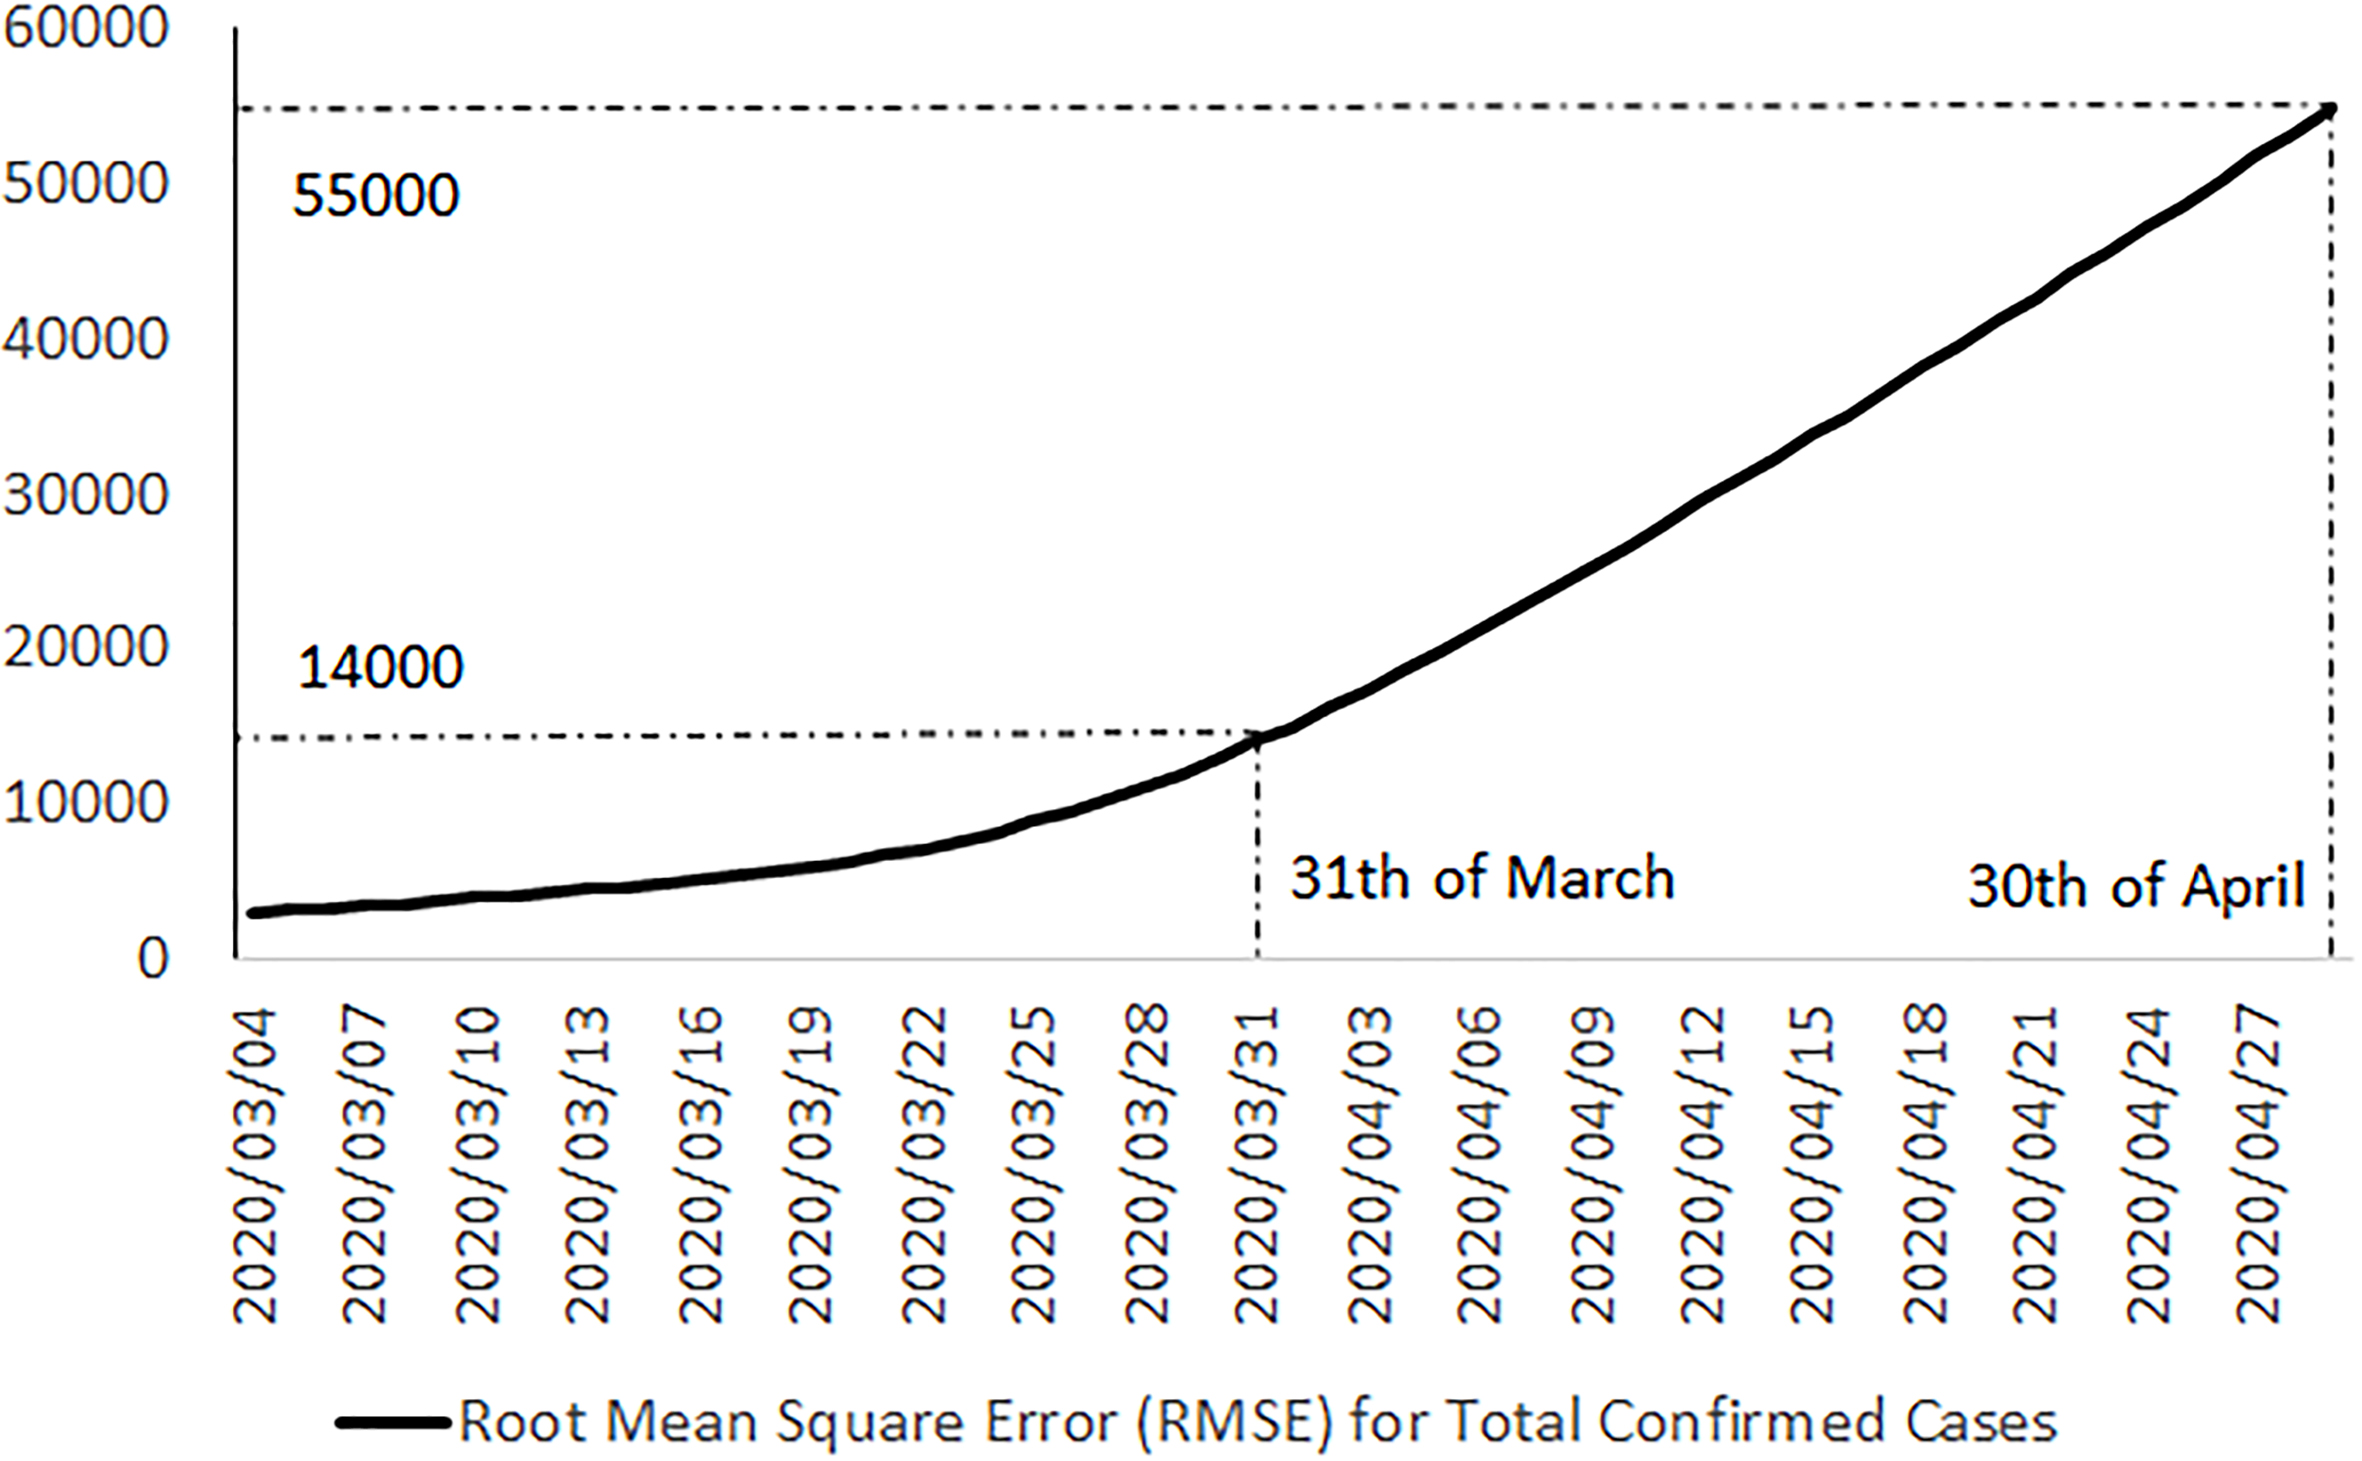
Finally, in Figs 4 and 5, we can see a positive trend for errors in recent last days, which could be considered as an alert for serious inhomogeneity of these three public official data sources. It seems that by increasing the reported positive cases and the epidemic of COVID-19 in more countries, the homogeneity of these data sets is decreasing.
4.Results
The main outcome of our analysis is showing an increasing measurement error in the three datasets as the the pandemic outbreak expanded and more countries contributed data for the official repositories, an estimation of the distribution of new positive cases in China, and an extracted, and corrected dataset from the WHO situation reports, the ECDC dataset and CCDC daily reports, plus one extra row at the beginning of the dataset, related to the first infected person as the COVID-19 Patient-Zero, which was reported on 17 November 2019 in China. The corrected dataset incorporates our findings of the necessary corrections of these data sources, imputation of missing values, outlier treatment and adjusting the date attribute, which we concluded were suffering from a one or two-day lag. For China, we considered the CCDC reports and the maximum of cumulative values by the WHO and ECDC for other countries. It includes the data from the Hong Kong Special Administrative Region of (China), Macau Special Administrative Region (China), and Taiwan (China).
For other countries, we suggested the maximum values for aggregated attributes such as total confirmed cases, because of the time lag of the reports for the preceding 24 hours and the different updating time of reports which suggests the maximum as a most recent reported value by countries. If the difference between the CCDC and WHO reported values was more than double, we did not apply the maximum anymore but selected the WHO value as a reference instead. This data set with 11,838 rows and 37 attributes and minimal measurement error is available for further research and the users of these official data sources [5]. The authors designed a data dashboard for an online visual summary of the main findings of this article, which is available online as a graphical abstract [5].
Another table with more COVID-19 attributes, which is extracted by text mining from the CCDC daily reports and its related metadata review and supporting documents with double-checking by the authors, was specified to China [5].
Finally, the distribution of new positive cases in China was studied by using our new dataset. We considered the attribute of date as our main variable and the number of new positive cases as corresponding frequencies. According to the shape of the data, we candidate some distributions such as Gamma, Weibull and Lognormal (Table 7). Then we used the root mean square error to compare these candidate distributions.
Table 7
Comparing distributions based on RMSE
| Distribution | Gamma | Weibull | Lognormal | |
|---|---|---|---|---|
| Quantiles | Observed | Estimated | Estimated | Estimated |
| 1% | 67 | 66.7031 | 63.6799 | 67.0697 |
| 5% | 71 | 70.3026 | 67.9578 | 70.6231 |
| 10% | 73 | 72.6388 | 70.9318 | 72.8641 |
| 25% | 78 | 77.2546 | 76.8001 | 77.2518 |
| 50% | 83 | 83.5129 | 84.2636 | 83.256 |
| 75% | 90 | 91.0554 | 92.2934 | 90.7295 |
| 90% | 99 | 99.0123 | 99.7472 | 99.0075 |
| 95% | 107 | 104.3273 | 104.2483 | 104.8004 |
| 99% | 120 | 115.4559 | 112.6977 | 117.6933 |
| RMSE | 1.84 | 3.24 | 1.13 | |
Source: Author’s preparation.
We identified that the distribution of new positive cases in China over time is very well expressed by the Lognormal distribution with threshold parameters of Theta equal to 52.4, scale parameter of Zeta equal to 3.43 and 0.32 for Sigma as shape parameter (Fig. 6).
Figure 6.
The Lognormal distribution for attributed new confirmed cases in China.
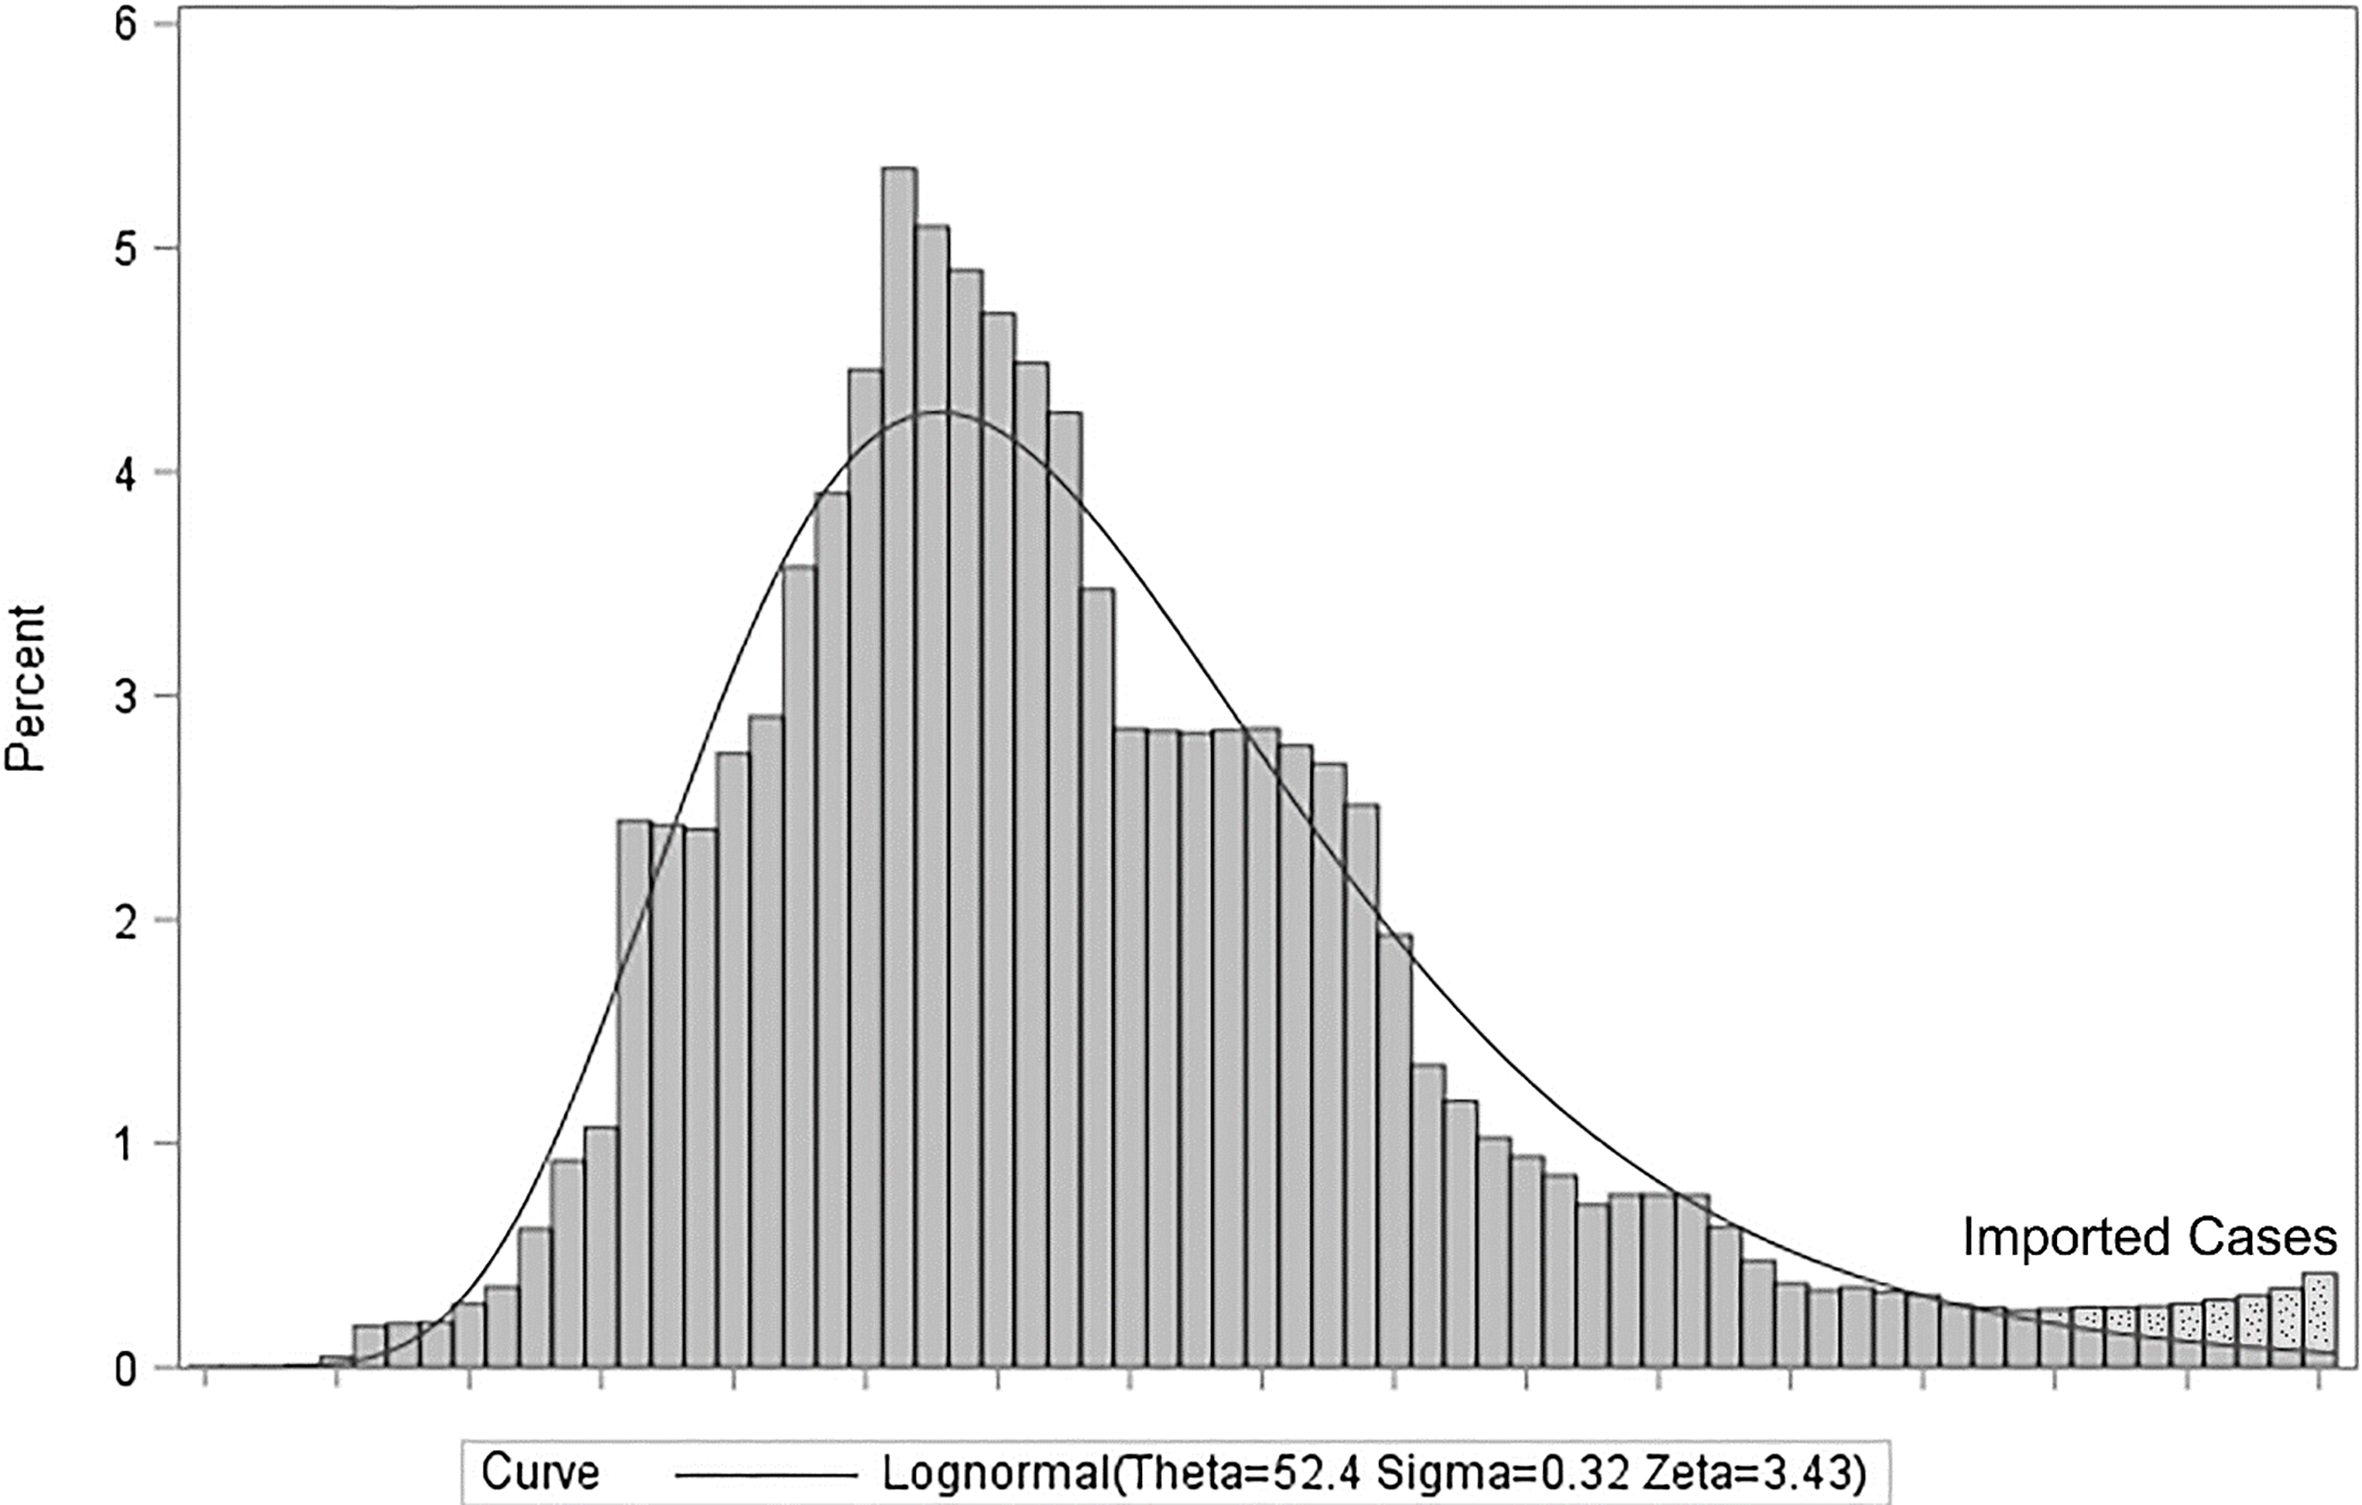
Table 8
Imported cases to China from outside
| Row | Date | Total imported | New imported |
|---|---|---|---|
| 1 | 20200303 | 0 | 18 |
| 2 | 20200304 | 20 | 2 |
| 3 | 20200305 | 36 | 16 |
| 4 | 20200306 | 60 | 24 |
| 5 | 20200307 | 63 | 3 |
| 6 | 20200308 | 67 | 4 |
| 7 | 20200309 | 69 | 2 |
| 8 | 20200310 | 79 | 10 |
| 9 | 20200311 | 85 | 6 |
| 10 | 20200312 | 88 | 3 |
Table 9
Comparing distributions based on RMSE with correction for imported positive cases
| Distribution | Gamma | Weibull | Lognormal | |
|---|---|---|---|---|
| Quantiles | Observed | Estimated | Estimated | Estimated |
| 1% | 67 | 66.7031 | 63.6799 | 67.0697 |
| 5% | 71 | 70.3026 | 67.9578 | 70.6231 |
| 10% | 73 | 72.6388 | 70.9318 | 72.8641 |
| 25% | 78 | 77.2546 | 76.8001 | 77.2518 |
| 50% | 83 | 83.5129 | 84.2636 | 83.256 |
| 75% | 90 | 91.0554 | 92.2934 | 90.7295 |
| 90% | 99 | 99.0123 | 99.7472 | 99.0075 |
| 95% | 106 | 104.3273 | 104.2483 | 104.8004 |
| 99% | 120 | 115.4559 | 112.6977 | 117.6933 |
| NEW RMSE | 1.7 | 3.16 | 0.95 | |
| OLD RMSE | 1.84 | 3.24 | 1.13 | |
Source: Author’s preparation.
As shown in Fig. 6, the right tail of the distribution is not fitted appropriately. We investigated this situation by checking the CCDC daily reports and discovered a new paragraph that was added to the 3 March 2020, for the new imported cases from outside of China. These new cases do not belong to the country, and for the purpose of fitting a distribution to new confirmed cases in China, we should subtract these new imported cases from the corresponding new confirmed cases.
The number of imported cases to China from outside is shown in Table 8.
As we can see in Tables 7 and 9, the observed values for quantile 95% is changed from 107 to 106, and the New RMSE shows a better fitting of the distribution to this new data. However, the Lognormal distribution is still the best suggested one compared to the Gamma and Weibull distributions.
5.Conclusion
This study assessed the measurement error of three official datasets for COVID-19, currently used as the main references for researchers around the world and domain BI dashboards. These data sources will be used to model the COVID-19 pandemic and apply different methods such as machine learning and time-series algorithms to predict the future. As we know, most of these algorithms work based on computational linear algebra and linear space. This linearity is important to put machines to work. For instance, R software and Python utilise linear algebra packages such as BLAS and LAPACK. Therefore, researchers prefer linear space in comparison to the norm space to be able to take advantage of the different mathematical tools in a vector space and use multivariate analysis, measures of central tendency and variations. As a result, it would be possible to solve complex problems with easy additive univariate models in vector space without the need to create new algorithms. However, the accuracy of these data-driven tools is sensitive to distortions and measurement errors, especially when the dataset is small.
Although we can fit an approximate line, surface or high dimension solution to our data in vector space, on most occasions, we need to smooth the data to take advantage of many tools for optimising smooth functions such as derivatives for optimisation. This smoothness and averaging are also dramatically sensitive to measurement errors. Therefore, even minor measurement errors in official COVID-19 datasets could significantly impact the final outcomes of mathematical models used to forecast the development of this infectious disease. This matter shows the importance of the accuracy, timeliness and completeness of COVID-19 official datasets for better models and interpretations.
We studied three referenced COVID-19 datasets and tried to provide an improved dataset for further studies of researchers. Additionally, this study shows a positive trend in the risk of measurement errors in these official datasets, which could be prevented by responsible authorities with excogitating some precautions. Finally, the distribution of COVID-19 in China was estimated. Our results suggest that the best goodness of fit corresponds to a Lognormal distribution with threshold parameters of Theta equal to 52.4, a scale parameter of Zeta equal to 3.43 and 0.32 for Sigma as a shape parameter. A Gamma distribution with estimated parameters of 58.80 for Theta, 4.25 for Sigma and 6.13 for Alpha is another appropriate candidate, which could be tested into models by researchers. It could help understand the behaviour of COVID-19, considering as a prior for Bayesian methods and estimating the infection rate in different countries.
Notes
1 See www.officialstatistics.com for details on the ongoing discussion on the role of Official Statistics in the context of the COVID-19 crisis and in shaping the world of tomorrow.
References
[1] | World Health Organization. Geneva, Switzerland: Coronavirus disease, (2019) (COVID-19) situation reports [Internet]. Available from: https://www.who.int/emergencies/diseases/novel-coronavirus-2019/situation-reports/. |
[2] | Cheng P, Gilchrist A, Robinson KM, Paul L. The risk and consequences of clinical miscoding due to inadequate medical documentation: A case study of the impact on health services funding. Health Inf Manag. (2009) ; 38: (1): 35–46. |
[3] | World Health Organization; Geneva, Switzerland: (2012) . Framework and standards for country health information systems. Second edition. |
[4] | Chen H, Hailey D, Wang N, Yu P. A Review of data quality assessment methods for public health information systems. Int J Environ Res Public Health. (2014) May; 11: (5): 5170–5207. doi: 10.3390/ijerph110505170. |
[5] | Ashofteh A, Bravo JM. Corona-virus disease (COVID-19) Data-set with Improved Measurement Errors of Referenced Official Data Sources. Mendeley Data [Distributor], V2 [Version], (accessed May 1, 2020), with reference to dashboard. doi: 10.17632/nw5m4hs3jr.2. |
[6] | De Angelis D, Presanis AM, Birrell P, Tomba GS, Housed T. Four key challenges in infectious disease modelling using data from multiple sources. Epidemics. (2015) Mar; 10: : 83–87. doi: 10.1016/j.epidem.2014.09.004. |
[7] | Rutherford G, McFarland W, Spindler H, White K, Patel S, Grasse JA, Sabin K, Smith N, Tache S, Garcia JC, Stoneburner R. Public health triangulation: Approach and application to synthesizing data to understand national and local HIV epidemics. BMC Public Health. 10: 447. |
[8] | European centre for disease prevention and control, Data on the geographic distribution of COVID-19 cases worldwide [Internet]. Available from: https://www.ecdc.europa.eu/en/publications-data/download-todays-data-geographic-distribution-covid-19-cases-worldwide. |
[9] | United Nations, Department of economic and social affairs, Population division. World population prospects 2019, Online edition. Rev. 1. |
[10] | International Standard ISO 3166-1, Codes for the representation of names of countries and their subdivisions – Part 1: Country codes, ISO 3166-1: 2006 (E/F), International Organization on Standardization (Geneva, 2006) [Internet]. The latest version is available from: http://www.iso.org/iso/home/standards/country_codes.htm. |
[11] | “Standard country or area codes for statistical use” (ST/ ESA/STAT/SER.M/49/Rev.3) [Internet], available from: http://unstats.un.org/unsd/methods/m49/m49.htm. |
[12] | Chinese center for disease control and prevention (Chinese CDC), National health commission updates [Internet]. Available from: http://weekly.chinacdc.cn/news/TrackingtheEpidemic.htm#NHCMar18. |


