
The role of combining national official statistics with global monitoring to close the data gaps in the environmental SDGs
Abstract
The Sustainable Development Goals (SDGs) have elevated the profile of the environmental dimension of development – and how we monitor this dimension. However, they have also challenged national statistical systems and the global statistical community to put in place both the methodologies and mechanisms for data collection and reporting on environmental indicators. According to a recent analysis, there is too little data to formally assess the status of 68% of the environment-related SDGs [1].
Many environment-related indicators were not part of the purview of national statistical systems and did not have a methodology or data collection system in place prior to the adoption of the SDG indicator framework [2]. Moderate improvements have been made, as evidenced by the reduced proportion of environment-related SDG indicators classified as Tier III between the original classification in 2016 and May 2019 – dropping from 50% to 28% [3]. As of March 2020, there are currently no Tier III indicators; however, as many of the SDG indicators have been recently reclassified the data availability and experience in compiling these indicators is severely limited. Socioeconomic indicators have far outpaced environmental indicators in this shift, with only 7% of non-environmental indicators classified as Tier III in May 2019 [1,4,5].
As the custodian agency for 26 of the environment-related SDG indicators, UN Environment is establishing methodologies and mechanisms to collect country-level data. However, many countries currently do not have national systems in place for monitoring these environmental indicators and thus there is a risk that much of the environmental dimension of development cannot be captured by using reporting mechanisms which only include traditionally collected national official statistics. For many of these indicators, UN Environment is exploring new data sources, such as data from citizen science. Citizen science has the potential to contribute to global and local level SDG monitoring. Realizing its full potential however, would require building key partnerships around citizen science data and creating an enabling environment. Global modelling is another approach to fill data gaps. These new types of data could not only improve global estimations but could be incorporated in national official statistics in order to improve nationally relevant data and analysis [6]. The Global Material Flow database, which estimates Domestic Material Consumption (covering SDG indicators 8.4.2 and 12.2.2), and the Global Surface Water Explorer application (covering SDG indicator 6.6.1) are a couple of examples of where UN Environment is complementing national data with global data products in the official SDG reporting process. In these cases the use of globally-derived data has been agreed by the Inter-Agency and Expert Group on SDG Indicators (IAEG-SDGs) [7].
Expanding globally-estimated or -modelled data to cover environment-related SDG indicators could build the foundation for a digital ecosystem for the planet, which would provide a basis for developing integrated analysis and insights. A Sustainability Gap Index could be one mechanism to bring together the environmental dimension of development into a single metric, which could inform the achievement of the SDGs, environmental assessments and national policy. This paper presents a summary of how the world is faring in terms of measuring the environmental dimension of the SDGs.
1.Introduction
The 2030 Agenda for Sustainable Development (2030 Agenda) provides a holistic framework for development which aims to transcend the pursuit of siloed interventions related to social development, economic development and environmental protection and resource use [8]. The 2030 Agenda includes 17 Sustainable Development Goals (SDGs), 169 targets and 244 indicators which form the basis for monitoring and implementing the 2030 Agenda [9]. At the core of the 2030 Agenda is an attempt to identify the most pressing issues for global development while keeping within planetary boundaries [10]: How can natural resources be sustainably managed while at the same time providing food, energy and water for the growing global population? What are the underlying governance and partnership requirements for sustainable development? What is the interaction between human health and the natural environment? How can we protect biodiversity and terrestrial and marine environments while still achieving economic growth? In order for the SDG framework to be useful for answering these key questions, data, analysis and science for each of the 244 SDG core development indicators are required. Unfortunately, there is a dearth of information for understanding the environment. An assessment of the global environmental goals during the 5th Global Environment Outlook process, which included a review of more than 320 environmental goals which are included in legally and non-legally binding multilateral environmental agreements (MEAs), revealed that data availability, comparability and fragmentation impede the ability of countries to report and fulfil their obligations [11]. The data gaps are even more pronounced when trying to understand specific local contexts or the interactions between gender, poverty and vulnerable populations and the environment [4, 12, 13].
The use of comparable data, which follow harmonized definitions and standards, for financial and economic decision making has existed in every civilization that has a system of writing and trade – as early as 3300 BC in Egypt [14]. By comparison, the work to measure, account for and value the environment is recent in comparison with the first attempt of a global environment statistics framework, the Framework for the Development of Environment Statistics published in 1984, the first environmental accounting framework, the System of Environmental Economic Accounting published in 2012, and the initial establishment of the Group on Earth Observation in 2005 [15, 16]. Despite efforts to work toward comparable definitions, methodologies and standards for environmental data, geospatial data and statistics, there are still gaps in the existing frameworks and much of the environment-related data products which have been developed with a specific purpose in mind are not comparable. In comparison to economic and social statistics, monitoring of the environment is a recent development and is the weakest area of monitoring in the SDG framework based on the number of indicators with available data by type.
2.Methodology
This analysis is based on the 244 SDG indicators which have been adopted for global monitoring by the UN Statistical Commission [9]. This indicator list includes some duplication of indicators which are listed under multiple targets and thus there are 232 unique indicators; for the purpose of this analysis, all 244 indicators were included as this provides a method for understanding the availability of data for assessing each of the 169 targets and 17 goals.
The SDG Tier Classification was developed by the IAEG-SDGs and endorsed by the UN Statistical Commission and the Tiers are defined as: “Tier I: Indicator is conceptually clear, has an internationally established methodology and standards are available, and data are regularly produced by countries for at least 50 percent of countries and of the population in every region where the indicator is relevant. Tier II: Indicator is conceptually clear, has an internationally established methodology and standards are available, but data are not regularly produced by countries. Tier III: No internationally established methodology or standards are yet available for the indicator, but methodology/standards are being (or will be) developed or tested” [17]. As of March 2020, all indicators have now been reclassified to Tier I or II; however, the analysis presented by Tier change between 2016 and 2019 aims to show the progression of the SDG indicator methodological development.
There is no agreed definition of which indicators and targets should be included in the environmental dimension of sustainable development. Different definitions have been used in different analysis, with some analysis of which goals are strictly related to the environment; for example, focusing on the SDG indicators with a direct link to the physical environment, focusing on climate change (SDG 13), water (SDG 6), land (SDG 15) and oceans (SDG 14) [18, 19] or the physical environment plus the goals related to the sustainable use of natural resources, thus adding energy (SDG 7) and sustainable consumption and production (SDG 12) [20]. The analysis in this paper is based on a classification of SDG indicators included as a background document at the 20 September 2018 meeting of the UN Environment Assembly Committee of Permanent Representative subcommittee [21] and the list used by UN Environment in the Global Environment Outlook process [1, 22] (included in Annex 1). The list is subjective and should not be interpreted as a comprehensive list of all SDG indicators which interact with the environment, but as an initial attempt to identify the SDG indicators which are directly related to environmental policy, environmental state or trends, sustainable consumption and production and natural resource use or interactions between people and the environment.
The list of environment-related SDG indicators was then categorized into four indicator types: indicators related to (1) mechanisms, enabling environment or policy; (2) change in behaviour or consumption or production patterns; (3) environmental state and trends; and (4) linkages between people and the environment (access to natural resources to meet basic needs or for livelihoods, vulnerability to climate change and disasters, environmental mortality, etc.). This classification done by the authors is shown in Annex 1.
To assess data availability, UN Environment maintains a database of indicators related to the environment which includes more than 1000 indicators [23]. These indicators cover all 93 indicators which are included in UN Environment’s list of environment-related SDG indicators. Global and regional aggregations are made available in the UN Environment database when possible. When global and regional aggregations are not available, UN Environment uses an algorithm to aggregate data to the regional and global level [24]. Note that the aggregation procedure is only completed if at least 30% of the total population, area, GDP or countries (depending on the weight of the indicator) have a data point for the year being aggregated and 70% must have either a valid data point or a data point within 5 years of the year being aggregated which can be used for extrapolation or interpolation. This is the methodology that UN Environment uses for all SDG indicators [24].
For each country, region and at the global level, a determination on sufficient or insufficient data was made based on the inability to attempt to extrapolate data based on a regression model. Thus if there were no available data points or, in the case of regional and global aggregates, if there was not sufficient data for the aggregation procedure, between 2000 – 2018 or the most recent data point was prior to 2010 then the indicator was classified as ‘no data available’. If an indicator has data after 2010, but only has a single data point, then this represents insufficient data for assessing progress and the indicator was classified as ‘some data, but not sufficient data available’. This assessment was based on data available as of June 2019. For the analysis by income group, the World Bank classification of income groups for 2018 was used [25].
Country-level analysis was done for the 193 United Nations Member States based on data available in the Global SDG Indicators Database as of June 2019. For each indicator, data was deemed available for a country if it had any observations. Countries were then aggregated into four groups: OECD, non-OECD, Small Island Developing States (SIDS), Least Developed Countries (LDC), and Landlocked Developing Countries (LLDC) using UNSD definitions [26]. The reporting coverage (percentage) for each group is the average of the percentage of indicators for which there is data for each country.
3.Result
The IAEG-SDGs was established in 2015 to develop the SDG indicator framework [27]. In order to do so, the IAEG-SDGs conducted an open consultation involving a wide range of stakeholders from across government, civil society, academia and regional and international organizations [28]. From a conceptual perspective, the SDG indicators were developed in order to capture an ideal, ambitious monitoring framework for development, including environmental state, trends and impacts. However, from a practical perspective, the SDG indicator framework took into account an interest in increasing synergies with existing processes (e.g. the Millennium Development Goals, UN Framework Convention on Climate Change, the Sendai Framework on Disaster Risk Reduction) in order to reduce the reporting burden for countries, increase feasibility, capitalize on prior experiences of national statistical offices in collecting official statistics on a topic and use a well-developed plan for developing and rolling out indicator proposals [29]. Despite the interest in using existing indicators, when the original tier classification was developed in 2016, 50% of environment-related SDG indicators were classified as Tier III as compared to 28% of the remaining indicators. There has been significant progress to develop methodologies and reporting mechanisms for the SDGs and as of May 2019, 26% of the environment-related SDG indicators are Tier III compared to 7% of the other indicators (Table 1).
Table 1
SDG indicators by Tier, 2016 and 2019
| Percentage of Tier I | Percentage of Tier II | Percentage of Tier III | ||||
|---|---|---|---|---|---|---|
| 2016 | 2019 | 2016 | 2019 | 2016 | 2019 | |
| Environment-related SDG indicators | 26% | 23% | 24% | 37% | 51% | 26% |
| All other SDG indicators | 53% | 51% | 19% | 42% | 28% | 7% |
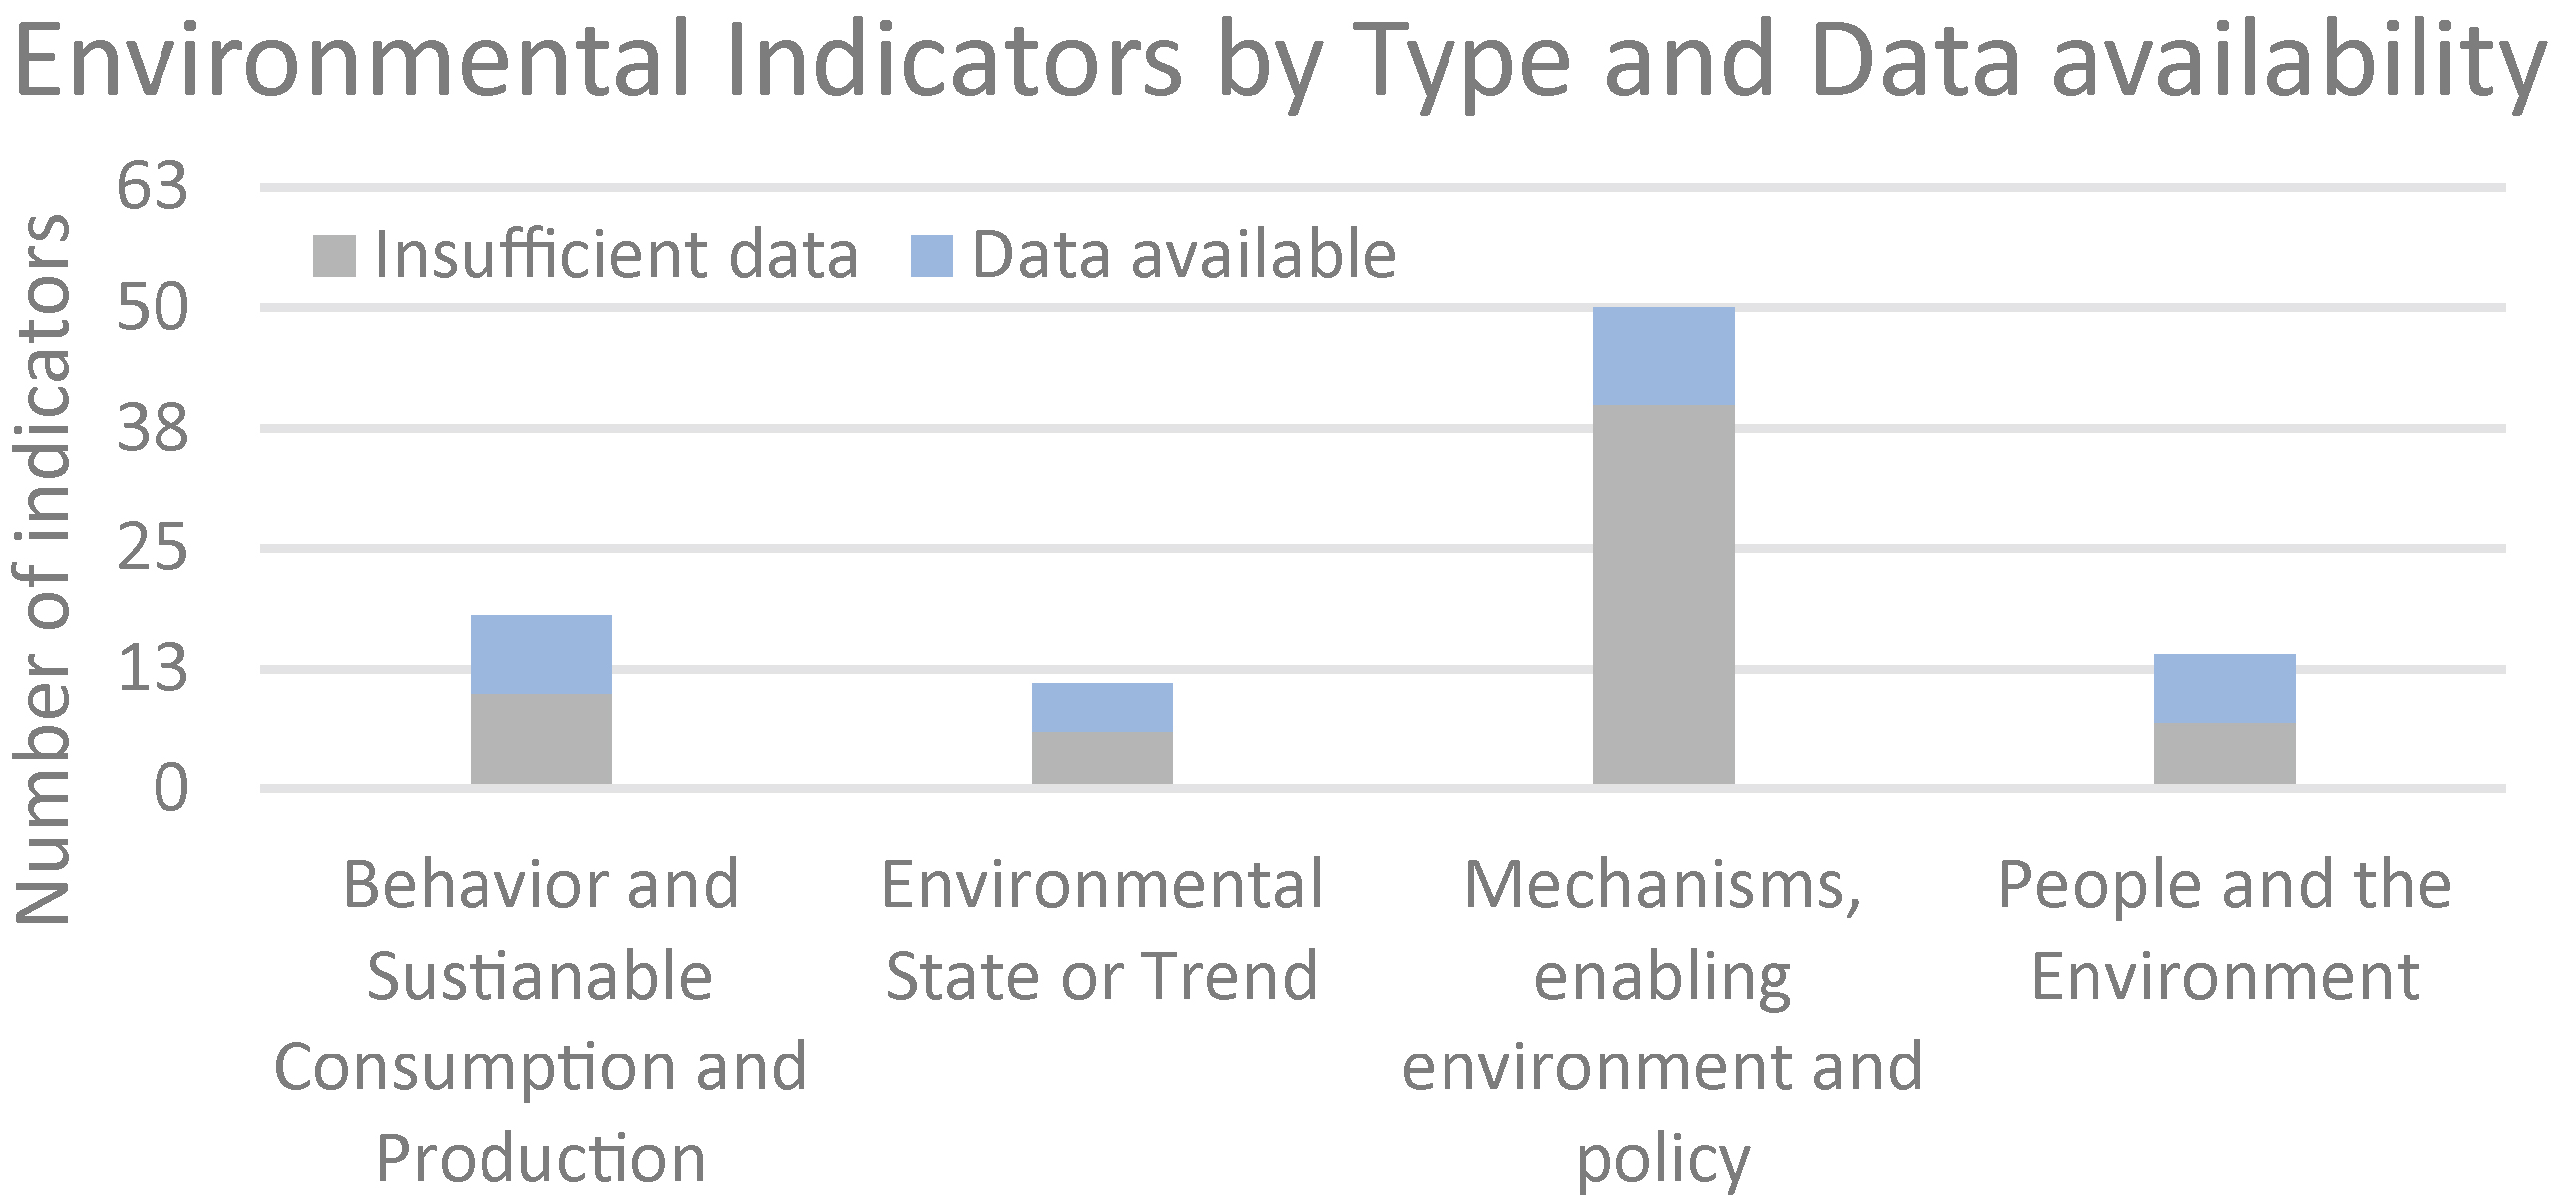
In terms of the environmental dimension of the SDGs, holistic measurement of the environment is complicated by a lack of existing globally-agreed methodologies related to specific SDG targets and the fact that many statistical offices do not have experience in compiling environment statistics or environmental economic accounts [30]. The System of Environmental Economic Accounts provides a useful conceptual framework which can underpis more 40 of the environment-related SDGs [17, 31]. Out of the 244 indicators in the SDG framework, less that 5% (11 indicators) are related to environmental state and trends (Fig. 1).
Figure 1.
Total number of environmental Indicators by type and data availability, 2019.
3.1Country level data availability
Country level reporting depends on various factors like the capacity of national statistical offices, data availability and political interest. Some indicators are reported independent of national reporting capacity based on international estimates and models (proxy data) such as SDG8.4.1 on material footprint and SDG6.6.1 on water-related ecosystems. Others rely more heavily on national capacity and interest (national data) such as SDG12.1.1 on sustainable consumption and production action plans and SDG11.6.1 on urban solid waste management. Analyzing country-level data availability can help identify gaps in national capacity or highlight areas where political interest may be lacking.
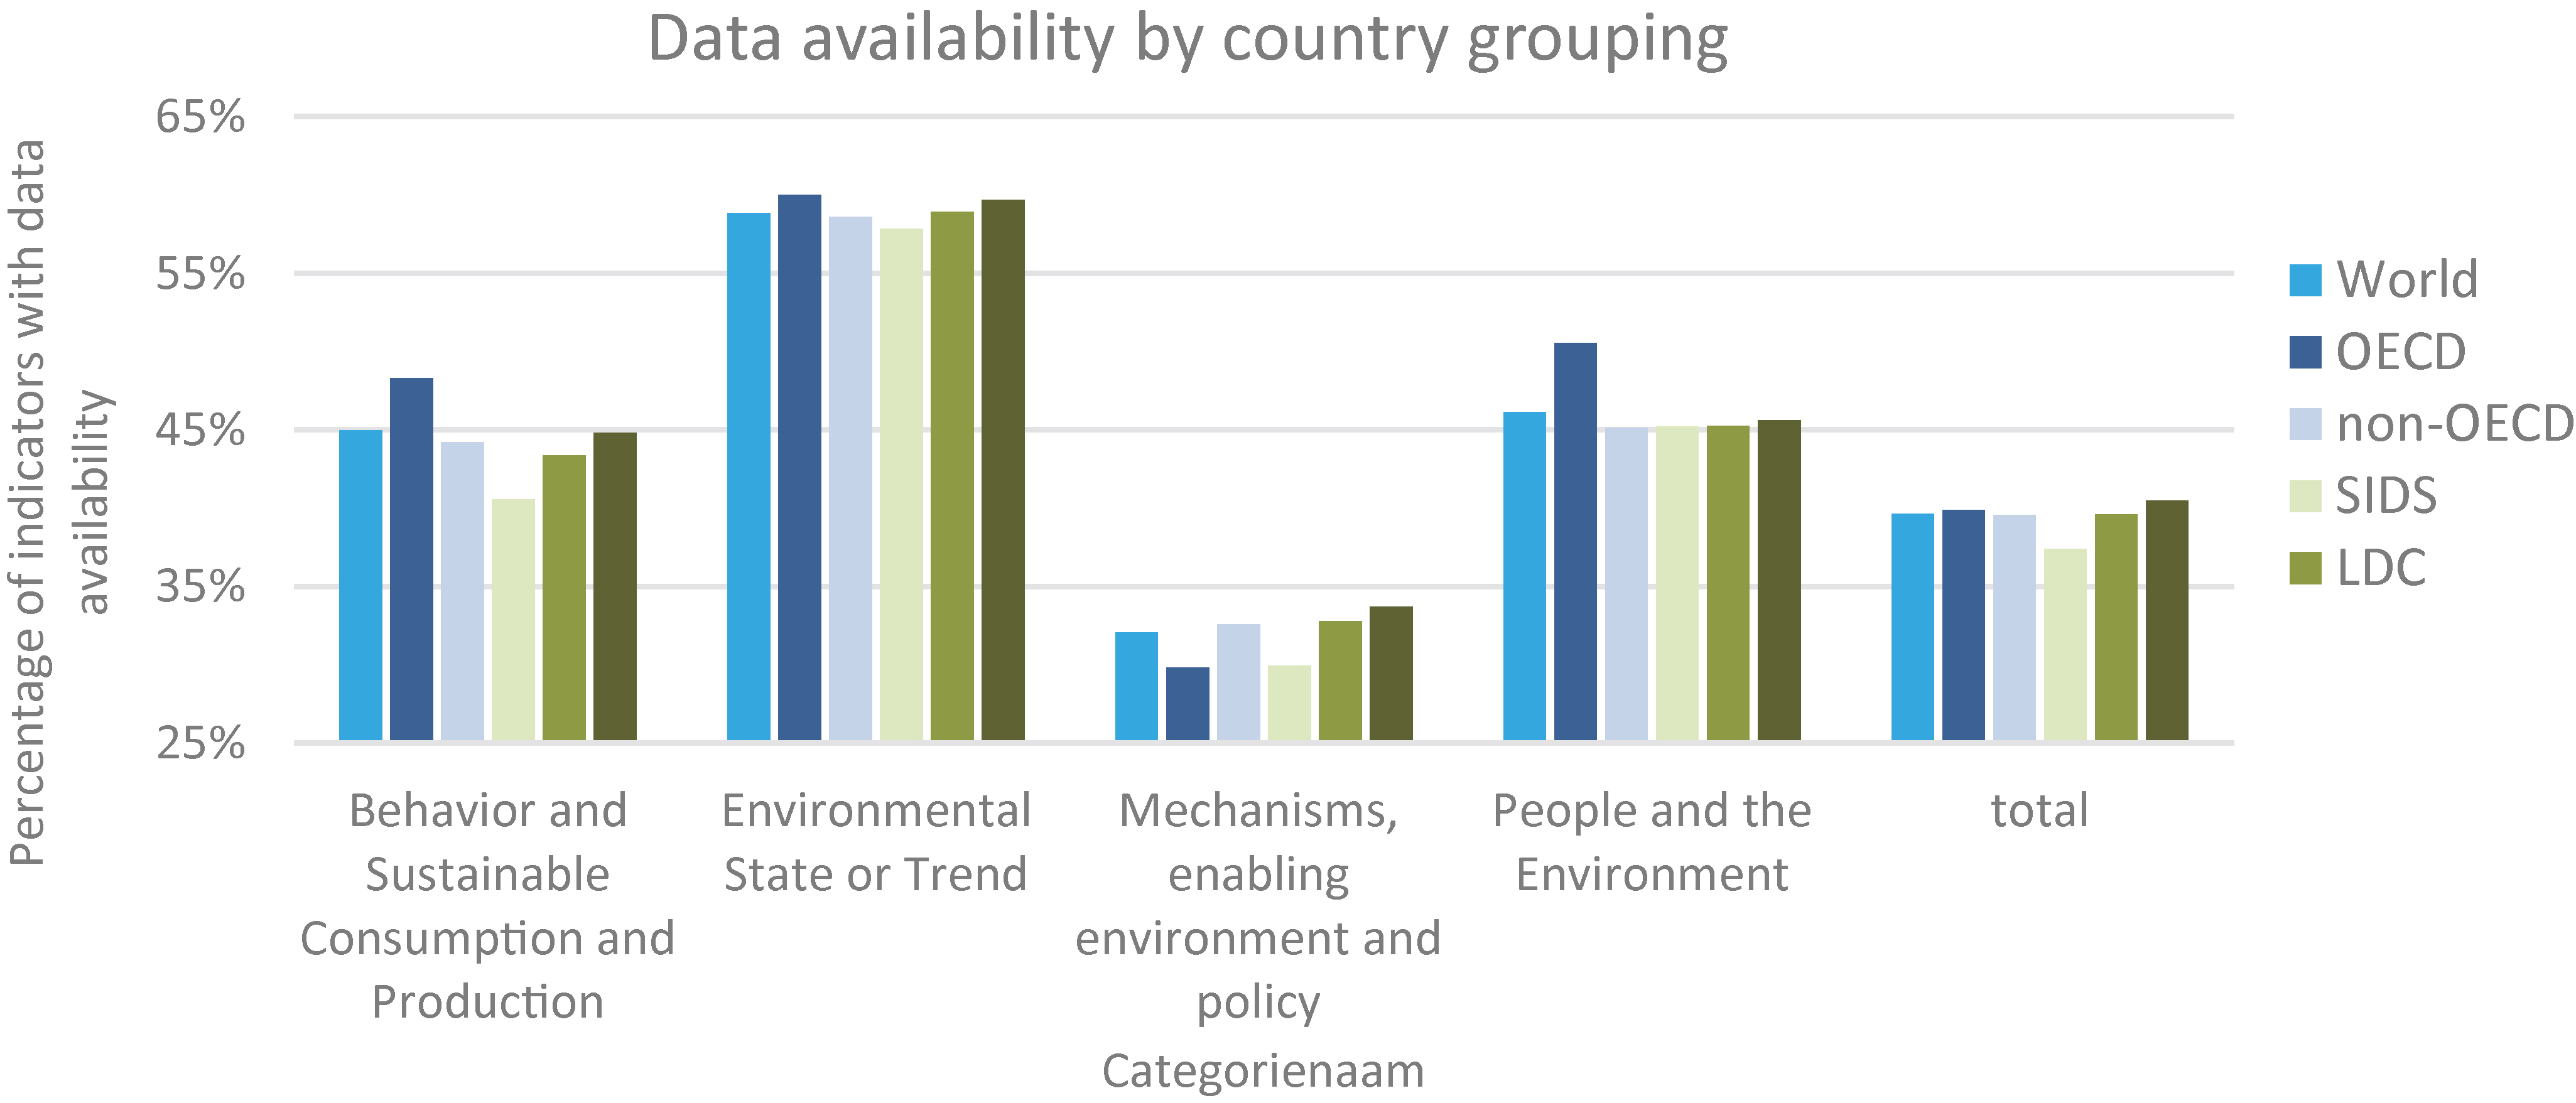
Overall, there is about a 40% country-level data coverage for the 93 environment-related indicators (including Tier III indicators) (Fig. 2). There is more difference in reporting across the four indicator types than the five country categories (OECD, non-OECD, SIDS, LDC and LLDC). Indicators in the “Environmental State or Trend” category have the highest country-level coverage (about 59%). Indicators in the “Mechanisms, enabling environment and policy” category have the lowest data coverage (about 32%). This is consistent with the proportion of Tier III indicators in each of these indicator types (Fig. 1).
While the biggest differences in country-level data availability are based on the indicator types, there are also some differences in reporting level based on country categories. OECD countries (all of which are high-income countries except for Mexico and Turkey) have higher levels of data availability than non-OECD countries for all indicator categories except for “Mechanisms, enabling environment and policy” indicators. On the other hand, SIDS have the lowest levels of country-level data reporting across all indicators. The biggest gap being for indicators in the “Behavior and Sustainable Consumption and Production” category where country-level reporting in SIDS countries (41%) is 4% lower than the global average (45%) and 7% lower than OECD countries (48%) (Fig. 2). SIDS small size, remoteness, narrow resource and exposure to global environmental change may be factor to their low levels of country-level reporting [2].
Figure 2.
Data availability by indicator category and country group, 2019.
3.2Citizen science for monitoring the environmental dimension of the SDGs
New data sources beyond national statistical data sets have yet to be fully exploited for the SDG reporting process. In addition to non-traditional data streams such as Earth Observation and big data analytics, citizen science also has the potential to be used for SDG monitoring. Citizen science is the involvement of citizens in scientific research, from data collection up to higher levels of scientific contribution such as data analysis and hypothesis generation [32]. To date, numerous citizen science initiatives have already generated a considerable amount of data in the environmental domain, some of which are being used in national and global biodiversity monitoring frameworks such as the Convention on Biodiversity (CBD). One critical source of information which is used for CBD reporting on Aichi target 11 which covers species occurrence using data provided by the Global Biodiversity Information Facility (GBIF), an inter-governmental network that focuses on making standardized and interoperable biodiversity data available from around the world. It is estimated that as much as 50% of the data provided to GBIF has been contributed by citizen science projects [33].
Data sets sourced from citizen science are also currently contributing to a few of the environmental indicators outlined in Annex 1 but there is still considerable scope for expansion. For example, BirdLife International, which has a huge network of volunteers, compiles the bird taxonomic component of the International Union for Conservation of Nature and Natural Resources (IUCN)’s Red List Index of Threatened Species (covering SDG indicator 15.5.1). In addition to their own volunteer data, BirdLife International incorporates data from the eBird citizen science project, which collects millions of bird observations annually from around the globe. Other examples of where citizen science data have been used are in any indicators that involve protected areas such as SDG indicators 14.5.1 “Coverage of protected areas in relation to marine areas”, 15.1.2 “Proportion of important sites for terrestrial and freshwater biodiversity that are covered by protected areas, by ecosystem type” and 15.4.1 “Coverage by protected areas of important sites for mountain biodiversity”. Many protected areas overlap with Key Biodiversity Areas (KBAs) and Important Bird and Biodiversity Areas (IBAs), which the latter have been established by BirdLife International using citizen science data as one source. Hence citizen science is currently contributing to SDG reporting to an important, yet still very limited, degree.
Other SDG indicators, particularly Tier III, may benefit from citizen science projects as a source of new information. Citizen science may also help to validate indicators that have been generated top down at the national level by providing an alternative bottom up data collection process. An example is SDG indicator 14.1.1 on floating marine debris. There are numerous citizen science projects with different purposes and data collection protocols related to marine plastic operating in diverse coastal environments around the world. Although these projects are not currently focused contributing to indicator 14.1.1, a dialogue could be initiated between the custodian agency, UN Environment, scientists working in the fields of marine debris and citizen science projects in order to find ways forward, e.g. through establishing acceptable protocols for data collection demonstrated through pilot projects in selected countries or as potential validation for the global modelling approach proposed for this indicator.
In addition to global monitoring, citizen science could also support national level SDG reporting. Bringing data from citizen science into the scope official statistics at the country level depends on the creation of an enabling environment, which could be achieved through partnerships and capacity building. Nurturing collaborations between the NSOs and the citizen science community would support countries to increase their ability to process and use citizen science data and help citizen science practitioners understand the SDG indicator framework and country requirements on data quality for official reporting. When designed collaboratively, with the needs and roles of different stakeholders in mind, citizen science could offer a great potential not only for generating the environmental data needed for the SDGs through relatively cost-effective means, but also for increasing awareness and action among citizens for SDG achievement.
4.Discussion and conclusion
Faced with the SDGs’ 169 targets and 244 indicators – a number of which still lack clear measurement methodologies – countries are stymied in both action and monitoring of SDG progress. This is no more true than in regards to environmental indicators which are outpaced among all indicators in globally-agreed methodologies and, regardless of a country’s stated priorities, will impact progress on other targets [34, 35, 36].
In order for the SDGs to be an effective tool for galvanizing action, there is a need to urgently uplevel monitoring and build a digital ecosystem for the planet [37]. The idea behind a digital ecosystem is to improve accessibility and access to traditional statistics along with data from citizen science, remote sensing, transactional data and other forms of data in a decentralized data ecosystem. This would include improving the accessibility and interoperability of raw data and data products on the environment while at the same time ensuring that privacy and security. This would provide a foundation to fill data gaps for targets lacking data disaggregated by crucial specificities and disparities (including by gender, income quintile, education, disability and other vulnerable groups) and even lacking data at all. Such an ecosystem would also help build the tools and capacity to conduct integrated analysis that can be used to generate actionable insights [1, 38]. Global data products and global modelling can form a basis for filling data gaps and ensuring that there is some data for all countries. These products also can demonstrate environmental concerns that should be further monitored through high-frequency or high-resolution remote sensing or through in situ collection or other means. Existing global data products like those for SDG target 6.6 (https://www.sdg661.app/) and SDG targets 8.4 and 12.2 (material flows) can provide an example of how such products can and have already been accepted for official SDG monitoring [16, 39].
Complementing global products and global modelling is citizen science, which can also help fill data gaps in some countries. Citizen science is already contributing to SDG indicators, e.g. 15.5.1, but further efforts are needed to investigate the potential of citizen science for other environmental SDG indicators, particularly Tier III. Citizen science projects and representatives from the citizen science community need to be brought into the high-level discussions on methodology development and data collection to explore the best way forward. Making progress on one indicator, e.g., 14.1.1. on marine plastic debris, may be provide a blueprint for integrating citizen science in other places.
In economic policy, a single headline indicator – Gross Domestic Policy – is used as a flag for economic progress. There has been some discussion on developing an equivalent indicator, with corresponding sub-indicators, for measuring sustainable development [40, 41]. Building out the portfolio of country-level data on globally-agreed environmental indicators could support consensus on a headline indicator on the environmental dimension of development. However, building the capacity of countries to collect the underlying basic data and better utilizing existing data – including from non-traditional data sources such as satellites, drones and citizen science – are at the crux of being able to monitor the SDGs and develop integrated analyses or indices [42].
The current limitations on understanding environmental indicator progress illustrate a “catch-22 situation” when it comes to achieving the SDGs for the sustainability of the planet and for humanity: We use existing data to identify priorities, but priorities for data collection are identified on the basis of which topics are priorities. It is the role of the international statistical community to disrupt this dynamic, leverage the commitment to monitoring the SDGs to better monitor across all sustainable development issues and to ensure that development occurs within planetary boundaries.
References
[1] | UN Environment. Measuring Progress: Towards Achieving the Environmental Dimension of the SDGs. United Nations Environment Programme, Nairobi. (2019) . |
[2] | United Nations. SIDS Accelerated Modalities of Action (SAMOA) Pathway. Sixty-ninth Session of the General Assembly on 14 November 2014. A/RES/69/15. (2014) . |
[3] | United Nations. Provisional Proposed Tiers for Global SDG Indicators as of March 24, (2016) . [published 2016 March; cited 2019 June]. https://unstats.un.org/sdgs/files/meetings/iaeg-sdgs-meeting-03/Provisional-Proposed-Tiers-for-SDG-Indicators-24-03-16.pdf. |
[4] | United Nations. SDG Indicator changes (15 October 2018 to 2019). [published 2019 May; cited 2019 June]. https://unstats.un.org/sdgs/files/List_of_changes_since_15_Oct_2018.pdf. |
[5] | United Nations. Tier Classification for Global SDG Indicators. [updated 2019 June; cited 2019 June]. https://unstats.un.org/sdgs/iaeg-sdgs/tier-classification/. |
[6] | MacFeely, S., and Nastav, B. “You say you want a [data] revolution”: A proposal to use unofficial statistics for the SDG Global Indicator Framework. Statistical Journal of the IAOS. (2019) ; 35: (3): 309-327. |
[7] | United Nations. Indicator 6.6.1: Change in the extent of water-related ecosystems over time. (2018) . [updated 2018 March; cited 2019 June]. https://unstats.un.org/sdgs/metadata/files/Metadata-06-06-01a.pdf. |
[8] | United Nations. Transforming our world: the 2030 Agenda for Sustainable Development. Seventieth session of the General Assembly on 25 September 2015. A/RES/70/1. (2015) . |
[9] | United Nations. Work of the Statistical Commission pertaining to the 2030 Agenda for Sustainable Development. Seventy-first session of the General Assembly on 6 July 2017. A/RES/71/313. (2017) . |
[10] | Randers, J., and Rockström, J., Stoknes, P.E., Golüke, U., Collste, D., and Cornell, S. Transformation is feasible: How to achieve the Sustainable Development Goals within Planetary Boundaries. Stockholm Resilience Centre. Stockholm. (2018) . |
[11] | UN Environment. Measuring Progress: Environmental Goals & Gaps. United Nations Environment Programme, Nairobi. (2012) . |
[12] | Daguitan, F., Lehohla, P., Mwangi, C., Seager, J., Sonntag, W., Clark, G., Donovan, J.M., Gutierrez, S.J.A.S., Tan, M.G., and Patel, A.R. Global Environment Outlook - GEO-6: Healthy Planet, Healthy People. Chapter 3: The State of Data and Knowledge. UN Environment Programme, Nairobi. (2019) . |
[13] | UN Environment. Gender and environment statistics: unlocking information for action and measuring the SDGs. UN Environment Programme, Nairobi. (2019) . |
[14] | Carmona, S., and Ezzamel, M. Accounting and accountability in ancient civilizations: Masopotamia and ancient Egypt. Accounting Auditing & Accountability Journal. (2007) ; 20: : 177-209. |
[15] | Daguitan, F., Mwangi, C., Tan, M., Clark, G., Cooper, D., Donovan, J., Gutierrez, S., Kruglikova, N., Lehohla, P., Seager, J., Sonntag, W., and Patel, A. Global Environment Outlook – GEO-6: Healthy Planet, Healthy People. Chapter 24: The Future of Data and Knowledge. UN Environment Programme, Nairobi. (2019) . |
[16] | United Nations, European Union, Food and Agriculture Organization of the United Nations, International Monetary Fund, Organisation for Economic Co-operation and Development, the World Bank. System of Environmental-Economic Accounting 2012 Central Framework. United Nations, New York. (2014) . |
[17] | United Nations. Report of the Inter-Agency and Expert Group on Sustainable Development Goal Indicators. Forty-ninth Session of the Statistical Commission on 6–9 March 2018. E/CN.3/2018/2. (2019) . |
[18] | ICSU, ISSC. Review of the Sustainable Development Goals: The Science Perspective. International Council for Science (ICSU), Paris. (2015) . |
[19] | Lim, M.M.L., Søgaard Jørgensen, P., and Wyborn C.A. Reframing the sustainable development goals to achieve sustainable development in the Anthropocene – a systems approach. Ecology and Society. (2018) ; 23: (3): 22. |
[20] | United Nations. Statistical Yearbook for Asia and the Pacific 2017: Measuring SDG progress in Asia and the Pacific: Is there enough data? United Nations Economic and Social Commission for Asia and the Pacific, New York. (2017) . |
[21] | UN Environment. Committee of Permanent Representatives Subcommittee meeting. 20 September (2018) . https://www.unenvironment.org/events/subcommittee-meetings/committee-permanent-representatives-subcommittee-meeting-14. [published 2018 September; cited 2019 June]. |
[22] | UN Environment. Global Environment Outlook – GEO-6: Healthy Planet, Healthy People. Nairobi. UN Environment Programme, Nairobi. (2019) . |
[23] | UN Environment. Data Downloader. Environment Live. N.d. [updated daily; cited 2019 June]. https://uneplive.unep.org/downloader. |
[24] | UN Environment. UNEP Live Global database aggregation methods. (2016) . [updated 2016 May; cited 2019 June]. https://uneplive.unep.org/media/docs/graphs/aggregation_methods.pdf. |
[25] | The World Bank. How does the World Bank classify countries? The World Bank. [updated daily; cited 2019 June]. https://datahelpdesk.worldbank.org/knowledgebase/articles/378834-how-does-the-world-bank-classify-countries. |
[26] | United Nations. Standard country or area codes for statistical use (M49). Department of Economic and Social Affairs Statistics Division. (2016) . [updated 2016 May; cited 2019 June]. https://unstats.un.org/unsd/methodology/m49/overview/. |
[27] | United Nations. Report on the forty-sixth session of the St8tistical Commission on 3–6 March 2015. United Nations Economic and Social Council. E/2015/24-E/CN.3/2015/40. (2015) . |
[28] | United Nations. Open Consultation with IAEG-SDG Members and Observers. Department of Economic and Social Affairs Statistics Division. (2016) . [updated 2016 October; cited 2019 June]. https://unstats.un.org/sdgs/iaeg-sdgs/open-consultation-iaeg-sdgs. |
[29] | United Nations Statistical Commission. Technical report by the Bureau of the United Nations Statistical Commission (UNSC) on the process of the development of an indicator framework for the goals and targets of the post-2015 development agenda. (2016) . [updated 2016 March; cited 2019 June]. https://sustainabledevelopment.un.org/content/documents/6754Technical%20report%20of%20the%20UNSC%20Bureau%20(final).pdf. |
[30] | United Nations. Global Assessment of Environmental-Economic Accounting and Supporting Statistics 2014. Forty-sixth Session of the Statistical Commission 3–6 March 2015. (2016) . [updated 2016 March; cited 2019 June]. https://unstats.un.org/unsd/statcom/doc15/BG-UNCEEA.pdf. |
[31] | UNEP-WCMC. Assessing the linkages between global indicator initiatives, SEEA Modules and the SDG Targets. (2019) . [updated 2019 June; cited 2019 August]. https://seea.un.org/sites/seea.un.org/files/seea_global_indicator_review_methodological_note_post_workshop_0.pdf. |
[32] | Bonney, R., Cooper, C.B., Dickinson, J., et al. Citizen science: A developing tool for expanding science knowledge and scientific literacy. BioScience. (2009) ; 59: : 977-984. |
[33] | Copas, K., Legind, J., and Masinde, S. Citizen science contributions to EBVs: GBIF.org as a case study. First International ECSA Conference, Berlin. (2016) . |
[34] | Nilsson, M. Important interactions among the Sustainable Development Goals under review at the High-Level Political Forum 2017. Stockholm Environment Institute, Stockholm. (2017) ; 6. https://www.sei.org/publications/sdg-interactions-framework/. |
[35] | Griggs, D., Nilsson, M., Stevance, A., and McCollum, D., (eds). A guide to SDG interactions: from science to implementation. International Council for Science (ICSU), Paris. (2017) . |
[36] | Weitz, N., Carlsen, H., Nilsson, M., and Skånberg, K. Towards systemic and contextual priority setting for implementing the 2030 Agenda. Sustainability Science. (2018) ; 13: (2): 531-48. |
[37] | Jensen, D., and Campbell, J. Discussion paper: The Case for a Digital Ecosystem for the Environment: Bringing together data, algorithms and insights for sustainable development. Science Policy Business Forum of UN Environment Programme. Nairobi. (2019) . |
[38] | Data Revolution Group. A World that Counts: Mobilising the Data Revolution for Sustainable Development. United Nations Secretary-General’s Independent Expert Advisory Group on a Data Revolution for Sustainable Development (IEAG). United Nations, New York. (2014) . |
[39] | United Nations. Indicator 8.4.2: Domestic material consumption, domestic material consumption per capita, and domestic material consumption per GDP. (2018) . [updated 2018 June; cited 2019 August]. https://unstats.un.org/sdgs/metadata/files/Metadata-08-04-02.pdf. |
[40] | Ekins, P., and Simon, S. ‘Determining the Sustainability Gap: National Accounting for Environmental Sustainability’ in Vaze, P. ed. UK Environmental Accounts: Theory, Data and Application, Office for National Statistics, London. (1998) ; pp. 147-167. |
[41] | Ekins, P., and Simon, S. The sustainability gap: A practical indicator of sustainability in the framework of the national accounts. International Journal of Sustainable Development (1999) ; 2: (1): 32-58. |
[42] | Holloway, J., Mengersen, K., and Helmstedt, K. Spatial and machine learning methods of satellite imagery analysis for Sustainable Development Goals. OECD, Paris. (2018) . |
Appendices
Annex 1. List of environment related SDG indicators (UN Environment, 2018)
| Indicator | Initial Tier | Current Tier | Type of indicator |
|---|---|---|---|
| 1.4.2 Proportion of total adult population with secure tenure rights to land, (a) with legally recognized documentation, and (b) who perceive their rights to land as secure, by sex and type of tenure | 3 | 2 | Mechanisms, enabling environment and policy |
| 1.5.1 Number of deaths, missing persons and directly affected persons attributed to disasters per 100,000 population | 2 | 2 | People and the Environment |
| 1.5.2 Direct economic loss attributed to disasters in relation to global gross domestic product (GDP) | 2 | 2 | People and the Environment |
| 1.5.3 Number of countries that adopt and implement national disaster risk reduction strategies in line with the Sendai Framework for Disaster Risk Reduction 2015–2030 | 2 | 1 | Mechanisms, enabling environment and policy |
| 1.5.4 Proportion of local governments that adopt and implement local disaster risk reduction strategies in line with national disaster risk reduction strategies | 2 | Mechanisms, enabling environment and policy | |
| 2.4.1 Proportion of agricultural area under productive and sustainable agriculture | 3 | 2 | Behavior and SCP |
| 2.5.1 Number of plant and animal genetic resources for food and agriculture secured in either medium- or long-term conservation facilities | 3 | 1 | Mechanisms, enabling environment and policy |
| 2.5.2 Proportion of local breeds classified as being at risk, not at risk or at unknown level of risk of extinction | 2 | 1 | Environmental State or Trend |
| 3.9.1 Mortality rate attributed to household and ambient air pollution | 1 | 1 | People and the Environment |
| 3.9.2 Mortality rate attributed to unsafe water, unsafe sanitation and lack of hygiene (exposure to unsafe Water, Sanitation and Hygiene for All (WASH) services) | 2 | 1 | People and the Environment |
| 3.9.3 Mortality rate attributed to unintentional poisoning | 2 | 1 | People and the Environment |
| 4.7.1 Extent to which (i) global citizenship education and (ii) education for sustainable development, including gender equality and human rights, are mainstreamed at all levels in (a) national education policies; (b) curricula; (c) teacher education; and (d) student assessment | 3 | 3 | Mechanisms, enabling environment and policy |
| 5.a.1 (a) Proportion of total agricultural population with ownership or secure rights over agricultural land, by sex; and (b) share of women among owners or rights-bearers of agricultural land, by type of tenure | 3 | 2 | Mechanisms, enabling environment and policy |
| 6.1.1 Proportion of population using safely managed drinking water services | 1 | 2 | People and the Environment |
| 6.3.1 Proportion of wastewater safely treated | 3 | 2 | People and the Environment |
| 6.3.2 Proportion of bodies of water with good ambient water quality | 3 | 2 | Environmental State or Trend |
| 6.4.1 Change in water-use efficiency over time | 3 | 2 | Behavior and SCP |
| 6.4.2 Level of water stress: freshwater withdrawal as a proportion of available freshwater resources | 1 | 1 | Behavior and SCP |
| 6.5.1 Degree of integrated water resources management implementation (0–100) | 1 | 1 | Mechanisms, enabling environment and policy |
| 6.5.2 Proportion of transboundary basin area with an operational arrangement for water cooperation | 3 | 1 | Mechanisms, enabling environment and policy |
| 6.6.1 Change in the extent of water-related ecosystems over time | 3 | 1 | Environmental State or Trend |
| 6.a.1 Amount of water- and sanitation-related official development assistance that is part of a government-coordinated spending plan | 1 | 1 | Mechanisms, enabling environment and policy |
| Indicator | Initial Tier | Current Tier | Type of indicator |
|---|---|---|---|
| 6.b.1 Proportion of local administrative units with established and operational policies and procedures for participation of local communities in water and sanitation management | 1 | 1 | Mechanisms, enabling environment and policy |
| 7.1.2 Proportion of population with primary reliance on clean fuels and technology | 1 | 1 | Behavior and SCP |
| 7.2.1 Renewable energy share in the total final energy consumption | 1 | 1 | Behavior and SCP |
| 7.3.1 Energy intensity measured in terms of primary energy and GDP | 1 | 1 | Behavior and SCP |
| 7.a.1 International financial flows to developing countries in support of clean energy research and development and renewable energy production, including in hybrid systems | 3 | 2 | Mechanisms, enabling environment and policy |
| 7.b.1 Investments in energy efficiency as a proportion of GDP and the amount of foreign direct investment in financial transfer for infrastructure and technology to sustainable development services | 3 | 3 | Mechanisms, enabling environment and policy |
| 8.4.1 Material footprint, material footprint per capita, and material footprint per GDP | 2 | 2 | Behavior and SCP |
| 8.4.2 Domestic material consumption, domestic material consumption per capita, and domestic material consumption per GDP | 2 | 1 | Behavior and SCP |
| 8.9.2 Proportion of jobs in sustainable tourism industries out of total tourism jobs | 2 | 3 | People and the Environment |
| 9.4.1 CO2 emission per unit of value added | 1 | 1 | Behavior and SCP |
| 11.2.1 Proportion of population that has convenient access to public transport, by sex, age and persons with disabilities | 2 | 2 | People and the Environment |
| 11.3.1 Ratio of land consumption rate to population growth rate | 2 | 2 | Behavior and SCP |
| 11.3.2 Proportion of cities with a direct participation structure of civil society in urban planning and management that operate regularly and democratically | 3 | 2 | Mechanisms, enabling environment and policy |
| 11.4.1 Total expenditure (public and private) per capita spent on the preservation, protection and conservation of all cultural and natural heritage, by type of heritage (cultural, natural, mixed and World Heritage Centre designation), level of government (national, regional and local/municipal), type of expenditure (operating expenditure/investment) and type of private funding (donations in kind, private non-profit sector and sponsorship) | 3 | 3 | Mechanisms, enabling environment and policy |
| 11.5.1 Number of deaths, missing persons and directly affected persons attributed to disasters per 100,000 population | 2 | 2 | People and the Environment |
| 11.5.2 Direct economic loss in relation to global GDP, damage to critical infrastructure and number of disruptions to basic services, attributed to disasters | 2 | 2 | People and the Environment |
| 11.6.1 Proportion of urban solid waste regularly collected and with adequate final discharge out of total urban solid waste generated, by cities | 2 | 2 | Behavior and SCP |
| 11.6.2 Annual mean levels of fine particulate matter (e.g. PM2.5 and PM10) in cities (population weighted) | 1 | 1 | Environmental State or Trend |
| 11.7.1 Average share of the built-up area of cities that is open space for public use for all, by sex, age and persons with disabilities | 2 | 2 | People and the Environment |
| 11.b.1 Number of countries that adopt and implement national disaster risk reduction strategies in line with the Sendai Framework for Disaster Risk Reduction 2015–2030 | 3 | 1 | Mechanisms, enabling environment and policy |
| 11.b.2 Proportion of local governments that adopt and implement local disaster risk reduction strategies in line with national disaster risk reduction strategies | 2 | 2 | Mechanisms, enabling environment and policy |
| 11.c.1 Proportion of financial support to the least developed countries that is allocated to the construction and retrofitting of sustainable, resilient and resource-efficient buildings utilizing local materials | 3 | 3 | Mechanisms, enabling environment and policy |
| 12.1.1 Number of countries with sustainable consumption and production (SCP) national action plans or SCP mainstreamed as a priority or a target into national policies | 2 | Mechanisms, enabling environment and policy | |
| 12.2.1 Material footprint, material footprint per capita, and material footprint per GDP | 2 | 2 | Behavior and SCP |
| 12.2.2 Domestic material consumption, domestic material consumption per capita, and domestic material consumption per GDP | 2 | 1 | Behavior and SCP |
| 12.3.1 (a) Food loss index and (b) food waste index | 3 | 2 | Behavior and SCP |
| 12.4.1 Number of parties to international multilateral environmental agreements on hazardous waste, and other chemicals that meet their commitments and obligations in transmitting information as required by each relevant agreement | 1 | 1 | Mechanisms, enabling environment and policy |
| 12.4.2 Hazardous waste generated per capita and proportion of hazardous waste treated, by type of treatment | 2 | 3 | Behavior and SCP |
| 12.5.1 National recycling rate, tons of material recycled | 3 | 3 | Behavior and SCP |
| Indicator | Initial Tier | Current Tier | Type of indicator |
|---|---|---|---|
| 12.6.1 Number of companies publishing sustainability reports | 3 | 3 | Mechanisms, enabling environment and policy |
| 12.7.1 Number of countries implementing sustainable public procurement policies and action plans | 3 | 3 | Mechanisms, enabling environment and policy |
| 12.8.1 Extent to which (i) global citizenship education and (ii) education for sustainable development (including climate change education) are mainstreamed in (a) national education policies; (b) curricula; (c) teacher education; and (d) student assessment | 3 | 3 | Mechanisms, enabling environment and policy |
| 12.a.1 Amount of support to developing countries on research and development for sustainable consumption and production and environmentally sound technologies | 3 | 3 | Mechanisms, enabling environment and policy |
| 12.b.1 Number of sustainable tourism strategies or policies and implemented action plans with agreed monitoring and evaluation tools | 3 | 3 | Mechanisms, enabling environment and policy |
| 12.c.1 Amount of fossil-fuel subsidies per unit of GDP (production and consumption) and as a proportion of total national expenditure on fossil fuels | 3 | 2 | Mechanisms, enabling environment and policy |
| 13.1.1 Number of deaths, missing persons and directly affected persons attributed to disasters per 100,000 population | 2 | 2 | People and the Environment |
| 13.1.2 Number of countries that adopt and implement national disaster risk reduction strategies in line with the Sendai Framework for Disaster Risk Reduction 2015–2030 | 2 | 1 | Mechanisms, enabling environment and policy |
| 13.1.3 Proportion of local governments that adopt and implement local disaster risk reduction strategies in line with national disaster risk reduction strategies | 2 | Mechanisms, enabling environment and policy | |
| 13.2.1 Number of countries that have communicated the establishment or operationalization of an integrated policy/strategy/plan which increases their ability to adapt to the adverse impacts of climate change, and foster climate resilience and low greenhouse gas emissions development in a manner that does not threaten food production (including a national adaptation plan, nationally determined contribution, national communication, biennial update report or other) | 3 | 3 | Mechanisms, enabling environment and policy |
| 13.3.1 Number of countries that have integrated mitigation, adaptation, impact reduction and early warning into primary, secondary and tertiary curricula | 3 | 3 | Mechanisms, enabling environment and policy |
| 13.3.2 Number of countries that have communicated the strengthening of institutional, systemic and individual capacity-building to implement adaptation, mitigation and technology transfer, and development actions | 3 | 3 | Mechanisms, enabling environment and policy |
| 13.a.1 Mobilized amount of United States dollars per year between 2020 and 2025 accountable towards the $100 billion commitment | 3 | 3 | Mechanisms, enabling environment and policy |
| 13.b.1 Number of least developed countries and small island developing States that are receiving specialized support, and amount of support, including finance, technology and capacity-building, for mechanisms for raising capacities for effective climate change-related planning and management, including focusing on women, youth and local and marginalized communities | 3 | Mechanisms, enabling environment and policy | |
| 14.1.1 Index of coastal eutrophication and floating plastic debris density | 3 | 3 | Environmental State or Trend |
| 14.2.1 Proportion of national exclusive economic zones managed using ecosystem-based approaches | 3 | 3 | Mechanisms, enabling environment and policy |
| 14.3.1 Average marine acidity (pH) measured at agreed suite of representative sampling stations | 3 | 2 | Environmental State or Trend |
| 14.4.1 Proportion of fish stocks within biologically sustainable levels | 1 | 1 | Environmental State or Trend |
| 14.5.1 Coverage of protected areas in relation to marine areas | 1 | 1 | Mechanisms, enabling environment and policy |
| 14.6.1 Degree of implementation of international instruments aiming to combat illegal, unreported and unregulated fishing | 3 | 2 | Mechanisms, enabling environment and policy |
| 14.7.1 Sustainable fisheries as a proportion of GDP in small island developing States, least developed countries and all countries | 3 | 1 | People and the Environment |
| 14.a.1 Proportion of total research budget allocated to research in the field of marine technology | 3 | 2 | Mechanisms, enabling environment and policy |
| 14.c.1 Number of countries making progress in ratifying, accepting and implementing through legal, policy and institutional frameworks, ocean-related instruments that implement international law, as reflected in the United Nations Convention on the Law of the Sea, for the conservation and sustainable use of the oceans and their resources | 3 | 3 | Mechanisms, enabling environment and policy |
| 15.1.1 Forest area as a proportion of total land area | 1 | 1 | Environmental State or Trend |
| Indicator | Initial Tier | Current Tier | Type of indicator |
|---|---|---|---|
| 15.1.2 Proportion of important sites for terrestrial and freshwater biodiversity that are covered by protected areas, by ecosystem type | 1 | 1 | Mechanisms, enabling environment and policy |
| 15.2.1 Progress towards sustainable forest management | 3 | 2 | Mechanisms, enabling environment and policy |
| 15.3.1 Proportion of land that is degraded over total land area | 3 | 2 | Environmental State or Trend |
| 15.4.1 Coverage by protected areas of important sites for mountain biodiversity | 1 | 1 | Mechanisms, enabling environment and policy |
| 15.4.2 Mountain Green Cover Index | 2 | 1 | Environmental State or Trend |
| 15.5.1 Red List Index | 1 | 1 | Environmental State or Trend |
| 15.6.1 Number of countries that have adopted legislative, administrative and policy frameworks to ensure fair and equitable sharing of benefits | 3 | 1 | Mechanisms, enabling environment and policy |
| 15.7.1 Proportion of traded wildlife that was poached or illicitly trafficked | 1 | 2 | Behavior and SCP |
| 15.8.1 Proportion of countries adopting relevant national legislation and adequately resourcing the prevention or control of invasive alien species | 3 | 2 | Mechanisms, enabling environment and policy |
| 15.9.1 Progress towards national targets established in accordance with Aichi Biodiversity Target 2 of the Strategic Plan for Biodiversity 2011–2020 | 3 | 3 | Mechanisms, enabling environment and policy |
| 15.a.1 Official development assistance and public expenditure on conservation and sustainable use of biodiversity and ecosystems | 1 | 1 | Mechanisms, enabling environment and policy |
| 15.b.1 Official development assistance and public expenditure on conservation and sustainable use of biodiversity and ecosystems | 1 | 1 | Mechanisms, enabling environment and policy |
| 15.c.1 Proportion of traded wildlife that was poached or illicitly trafficked | 1 | 2 | Behavior and SCP |
| 16.8.1 Proportion of members and voting rights of developing countries in international organizations | 1 | 1 | Mechanisms, enabling environment and policy |
| 17.6.1 Number of science and/or technology cooperation agreements and programmes between countries, by type of cooperation | 3 | Mechanisms, enabling environment and policy | |
| 17.7.1 Total amount of approved funding for developing countries to promote the development, transfer, dissemination and diffusion of environmentally sound technologies | 3 | 3 | Mechanisms, enabling environment and policy |
| 17.9.1 Dollar value of financial and technical assistance (including through North-South, SouthSouth and triangular cooperation) committed to developing countries | 1 | 1 | Mechanisms, enabling environment and policy |
| 17.14.1 Number of countries with mechanisms in place to enhance policy coherence of sustainable development | 3 | 3 | Mechanisms, enabling environment and policy |


