
MTab4D: Semantic annotation of tabular data with DBpedia
Abstract
Semantic annotation of tabular data is the process of matching table elements with knowledge graphs. As a result, the table contents could be interpreted or inferred using knowledge graph concepts, enabling them to be useful in downstream applications such as data analytics and management. Nevertheless, semantic annotation tasks are challenging due to insufficient tabular data descriptions, heterogeneous schema, and vocabulary issues. This paper presents an automatic semantic annotation system for tabular data, called MTab4D, to generate annotations with DBpedia in three annotation tasks: 1) matching table cells to entities, 2) matching columns to entity types, and 3) matching pairs of columns to properties. In particular, we propose an annotation pipeline that combines multiple matching signals from different table elements to address schema heterogeneity, data ambiguity, and noisiness. Additionally, this paper provides insightful analysis and extra resources on benchmarking semantic annotation with knowledge graphs. Experimental results on the original and adapted datasets of the Semantic Web Challenge on Tabular Data to Knowledge Graph Matching (SemTab 2019) show that our system achieves an impressive performance for the three annotation tasks. MTab4D’s repository is publicly available at https://github.com/phucty/mtab4dbpedia.
1.Introduction
Many tabular data resources have been made available on the Web and data portals, thanks to the Open Data initiative in recent years. The resources contain valuable information that helps establish transparency, improve human life quality, and inspire business opportunities. Although tabular data offers enormous potential, it is difficult to be used in applications due to insufficient descriptions, heterogeneous schema, and vocabulary issues.
One possible solution for the usability problems is to generate semantic annotation of tables, particularly matching table elements with knowledge graphs (KGs) such as DBpedia. As a result, the meaning of tabular data could be interpreted or inferred by knowledge graph concepts; therefore, it is easy to be used in other downstream applications such as data analytics and management.
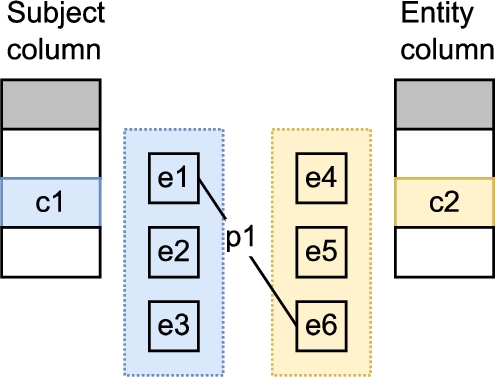
This paper presents MTab4D, a semantic annotation system for tabular data, designed to address the three annotations tasks of the Semantic Web challenge on tabular data annotation with knowledge graphs (SemTab 2019).11 SemTab 2019 is a systematic benchmark for promoting a comparison of state-of-the-art annotation systems [7]. Figure 1 illustrates the three semantic annotation tasks. Cell-Entity annotation (CEA) is the task of assigning an entity to a table cell (Fig. 1a). Column-Type annotation task (CTA) assigns entity types (e.g., DBpedia class hierarchy) to a table column (Fig. 1b). Column Pair-Property annotation (CPA) is the task of assigning a property or a predicate to the relation between two table columns (Fig. 1c).
Fig. 1.
Tabular data annotations with DBpedia. dbr: is an entity prefix, and dbo: is a type prefix.
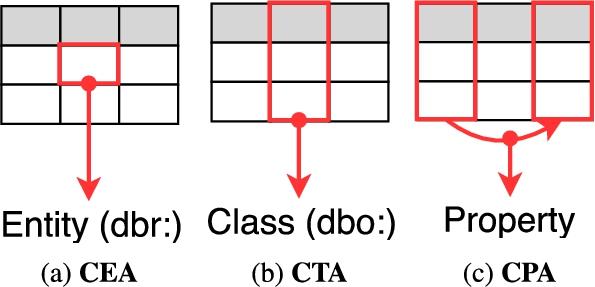
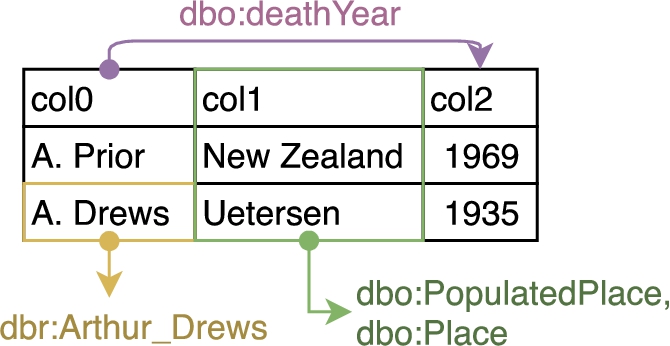
Figure 2 depicts an example of semantic annotations for tabular data. dbr:Arthur_Drews is an entity annotation for cell “A. Drews”. The type annotations for column “col1” are dbo:PopulatedPlace and dbo:Place. The property of dbo:deathYear is the annotation for the relation between column “col0” and column “col2”.
Fig. 2.
An example of semantic annotation of tabular data.
This paper proposes an annotation pipeline that combines multiple matching signals from table elements to address schema heterogeneity and ambiguity. Our system is inspired by the graphical probability model-based approach [11] and the signal (or confidence) propagation as in the T2K system [22]; however, our system improves the annotation tasks’ performance with the following contributions:
– Table Pre-processing: We introduce a method for pre-processing tables to deal with data noisiness consisting of cell normalization, datatype prediction for cells and columns, header prediction, subject column prediction, and matching target prediction.
– Entity Search: Most previous systems used online entity search services to generate candidate entities (e.g., DBpedia lookup); however, it is hard to reproduce the same search results if the search index change due to the evolution of the knowledge graph. We introduce novel entity search modules as in Section 3.3 (keyword search, fuzzy search, and aggregation search) based on the DBpedia October 2016 dump that enables the entity search results to be reproduced for future studies.
– Numerical Column Matching: Data matching for numerical columns is challenging because the corresponding value in KG is rarely equal to a query value. Therefore, we adopt EmbNum+ [16] as the semantic labeling for numerical columns to find relevant properties and use DBpedia ontology to infer entity types which are the domains of the relevant properties.
– Column-based Matching: We introduce column-based matching between the table subject column and other remaining table columns (i.e., entity columns, literal columns). The novel column-based signals could enhance the overall matching performance.
– Data Analysis and Extra Resources for Reproducibility: This paper provides insightful analysis and extra resources on benchmarking semantic annotation with knowledge graphs. Since the knowledge graph changes over time, it is hard to compare annotation systems that used a different version of the target knowledge graph. To standardize the evaluation of the tabular data annotation tasks, we provide the extra resources, the adapted SemTab 2019 dataset built on the October 2016 version of DBpedia (similar to the SemTab 2019 setting), as in [14]. The resources are also accessible from the public APIs,22 e.g., entity search, entity information retrieval, numerical attribute retrieval, and evaluation retrieval.
– Annotation API and Graphical Interface: We provide tabular data annotation API, graphical interface,33 and instruction on replicating MTab4D experiment results.44 Our implementation supports multilingual tables (covered the most popular languages) and could process many table formats such as Excel, CSV, TSV, or markdown tables.
MTab4D is an extended version of our work MTab [13,15] (the best performance for the three matching tasks: the 1st rank in all (four) rounds and all (three) tasks). This system advances the previous study in the three directions:
– Refactoring Implementation: We refactor the codes over most of the components of MTab [13,15] to optimize MTab4D efficiency. Moreover, MTab4D could auto predict table header, subject column, and matching targets (Section 3.2), and provide annotations. MTab4D is publicly available at4 under an open-source license.
– Reproducibility: MTab’s entity search modules are built by aggregating many online entity search services from DBpedia, Wikipedia, and Wikidata [13,15]. As a result, it is hard to reproduce the entity search results since the search index changes over time. We build new search modules based on the DBpedia October 2016 dump to enable reproducibility. Moreover, we also provide the adapted SemTab 2019 data with the DBpedia October 2016 version [14]. These resources enable a consistent environment setup for a fair comparison between annotation systems in future studies.
– Public services: We also focus on building public services so that we refactor the implementation, optimize system efficiency, and support multilingual tables, and could be able to process various table formats such as Excel, CSV, TSV, or markdown tables. We also provide a graphical interface that enables the user to do table annotation by pasting the table of contents from table files or websites. Wang et al. [26] state that only our system could generate the annotations, while other annotation systems require high time complexity.
The rest of this paper is organized as follows. In Section 2, we define the annotation tasks and describe MTab4D assumptions. Then, we present the overall framework and the details of each framework’s module in Section 3. Section 4 reports experimental settings, results, and error analysis. We describe MTab4D public APIs and graphical interfaces in Section 5. Section 6 discusses the related work on semantic annotation of table data and summarizes the participant approaches. Finally, we summarize the paper and discuss future directions and the lessons learned in Section 7.
2.Definitions and assumptions
In this section, we provide formal definitions for the three annotation tasks in Section 2.1. The assumptions on MTab4D are described in Section 2.2.
2.1.Problem definitions
2.1.1.Knowledge graph
The DBpedia knowledge graph G can be described as an RDF graph consisting of a set of RDF triples (facts)
We denote the set of entities as
Entity types are related by an rdfs:subClassOf relation. When
Entity
A triple comprises an entity e, a property p, and an object (an entity
2.1.2.Tabular data
Let S be a two-dimensional table consisting of an ordered set of N rows and M columns. We denote a table row as
2.1.3.Matching targets
Let
2.1.4.Semantic annotation tasks
Given the DBpedia knowledge graph G, table S, and matching targets
– Cell-Entity matching (CEA): matching each table cell in the CEA matching targets (
– Column-Type matching (CTA): matching each table column in the CTA matching targets (
– Column Pair Relation-Property matching (CPA): matching each relation between two columns in the CPA matching targets (
2.2.Assumptions
We build MTab4D system based on the following assumptions:
Assumption 1.
MTab4D is built based on a closed-world assumption.
MTab4D annotates tabular data based on the knowledge graph information. Therefore, we assume that the knowledge graph (DBpedia) is complete and correct. When table elements are not available in the knowledge graph, the system mistakenly returns the most relevant results (incorrect answers).
Assumption 2.
The tabular input data is a horizontal relational table type.
A horizontal relational table contains semantic knowledge graph triples as (subject, predicate, object). The table also has a subject column containing entity names, and the relation between the subject column and other table columns represents the predicate relation between the entities (subject) and attribute values (object).
Assumption 3.
All the cell values of the same column have the same datatype, and the entities related to cell values of the same column are of the same type.
3.MTab4D approach
In this section, we describe the MTab4D framework in Section 3.1. The details of each step are described from Section 3.2 to Section 3.7.
Fig. 3.
MTab4D framework for tabular data annotations.
3.1.Framework
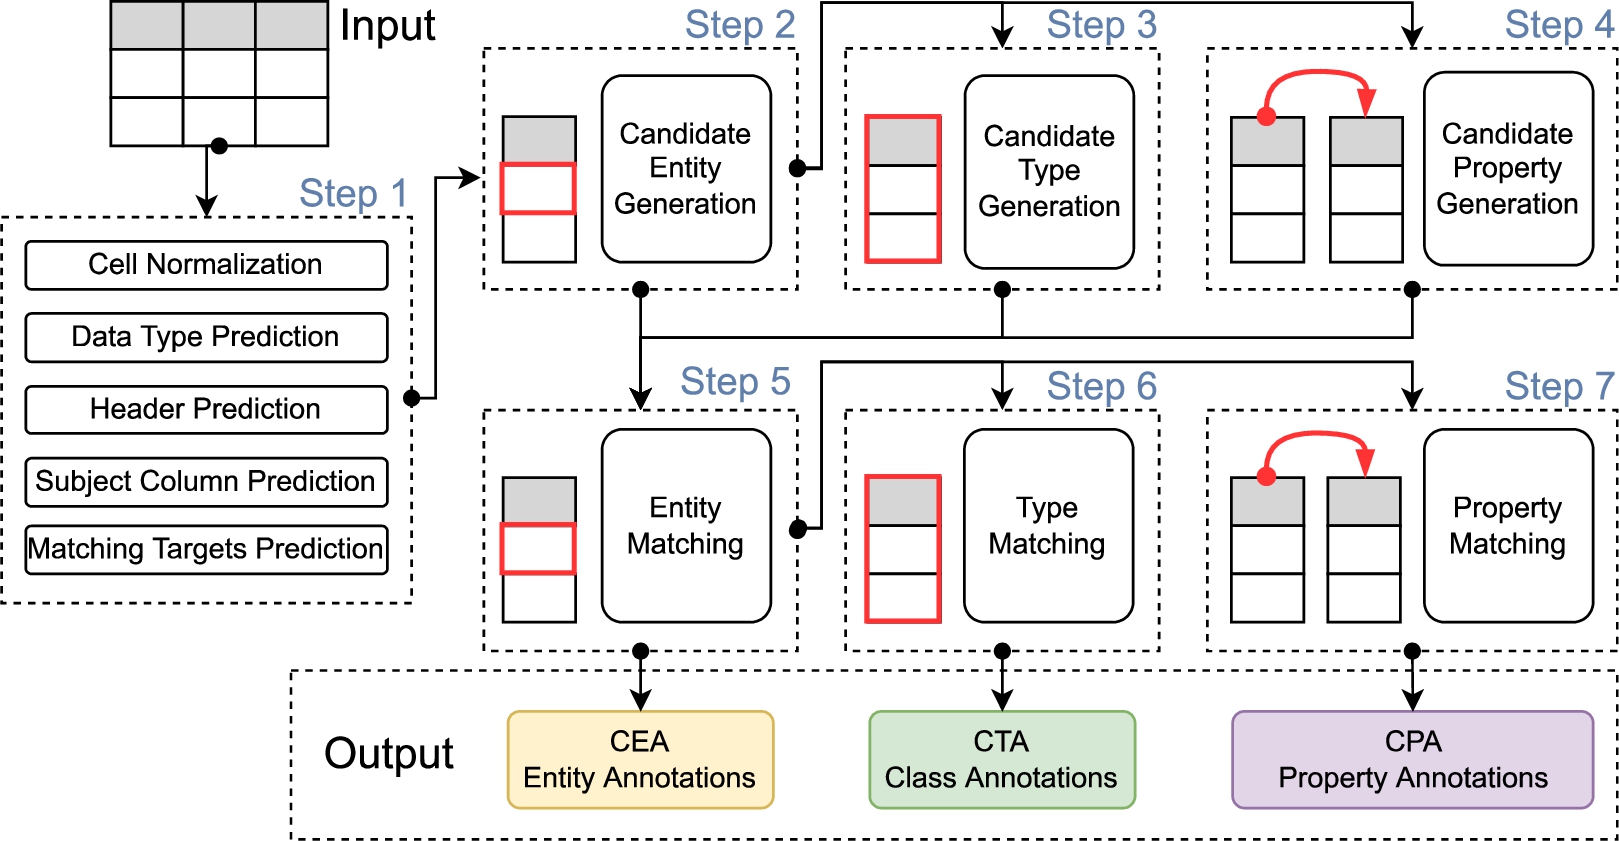
We design MTab4D as the seven-step pipeline as shown in Fig. 3.
Step 1 pre-processes the input table consisting of cell value normalization, cell and column datatype prediction, header prediction, subject column prediction, and matching targets prediction. Step 2 is to generate candidate entities.
Then, Step 3 and Step 4 generate candidate types and properties using the row-based aggregation from Step 2, respectively. Step 5 disambiguates candidate entities with confidence aggregation from Step 2, Step 3, and Step 4.
Step 6 and Step 7 are to disambiguate candidate types and properties with results from Step 5, respectively.
The following are detailed explanations of each step of the framework.
3.2.Step 1: Pre-processing
We perform the five following processes: cell normalization, datatype prediction, header detection, and subject column prediction, matching targets prediction.
3.2.1.Cell normalization
We remove HTML tags and non-cell-values such as -, NaN, none, null, blank, unknown, ?, #. Additionally, we use the ftfy tool [23] to fix all noisy cells caused by incorrect encoding during file loading.
3.2.2.Data type prediction
The system predicts a table cell’s datatype into either non-cell (empty cell), literal, or named-entity (NE). We use the pre-trained SpaCy models [8] (OntoNotes 5 dataset) to identify named and numeric entities. A cell has a named-entity type when the SpaCy model recognizes an entity-name tag such as PERSON (human names), NORP (nationalities), FAC (building), ORG (companies), GPE (countries, cities), LOC (locations), PRODUCT (objects, vehicles), EVENT (wars, sports events), WORK_OF_ART (books, songs), LAW (law documents), LANGUAGE (named language). A cell has a literal type when the recognized SpaCy tag is a numeric tag such as DATE (date), TIME (time), PERCENT (percentage), MONEY (amount of money), QUANTITY (measurements), ORDINAL (ordinal), and CARDINAL (other numerical values). If no tag is assigned, we associate the cell type with named-entity because the SpaCy model could miss the named-entity types.
Next, the system predicts a table column’s datatype into either a non-match column (empty column)
3.2.3.Header prediction
Let
– Table headers could be located in some of the first rows of a table.
– If the list of datatypes of the header candidate row differs from most datatypes of the remaining rows, the candidate is the table header. For example, the list of datatypes of header candidate (row) is [named-entity, named-entity, named-entity], while the list of the majority datatype of remaining rows is [named-entity, literal, literal].
– We also found that the length of header text is empirically shorter or longer than the remaining data rows. If the length of values of the header candidate row is less than the 0.05 quantile or larger than the 0.95 quantiles of the length of the value of remaining rows, the candidates are the table header.
3.2.4.Subject column prediction
Let
– A column is a subject column when its datatype is a named-entity type.
– The average cell value length is from 3.5 to 200. We also add a restriction that only considers non-header cells since the length of table headers could differ from the remaining cells.
– The subject column is determined based on the uniqueness score as an increased score for columns with many unique values and reduces the score for columns with many missing values. The subject column is the highest unique score column. If we have many columns with the same score, the left-most column is chosen.
3.2.5.Matching targets prediction
MTab4D uses the following heuristics to generate matching targets for the three annotations tasks when the input does not have matching targets.
– CEA task: matching targets are the table cells whose datatypes are strings.
– CTA task: matching targets are columns so that the column datatypes are strings.
– CPA task: matching targets are the relation between the core attribute and the remaining table columns.
3.3.Step 2: Candidate entity generation
To generate candidate entities for the CEA matching targets, we perform entity searching on the MTab4D search engine.55 Unlike previous work using online entity search services to generate candidate entities, the MTab4D entity search engine is built from DBpedia’s October 2016 dump version for reproducibility. We extracted 5,226,192 entities (ignore disambiguate entities) and 35,331,799 entity labels (including entity labels, aliases, other names, redirect entity labels, and disambiguation entity names) from DBpedia dump files in the most popular languages (i.e., English, China, German, France, Arabic, Russia, Italy, Japanese, Netherlands, Poland, Portugal).
We build the three entity search modules (i.e., keyword search, fuzzy search, and aggregation search) to address table cell values’ ambiguity and noisiness.
Let q be a query which is a table cell
For the three search modules, the default limit of the ranking list is set as 100 in all our experiments for efficiency reasons. The detail of search modules is described as follows.
3.3.1.Keyword search
We build the keyword search to address table cells ambiguity and entity name variant. We use the Elasticsearch engine66 to index Wikidata entity labels as separated documents. The ranking scores are calculated using the default BM25 ranking function of Elasticsearch and entity popularities. The entity popularities are pre-calculated using the PageRank algorithm on DBpedia. The ranking scores of the keyword search module
3.3.2.Fuzzy search
Another challenge of entity search is that table cells might be noisy, contain many spelling errors, and are expressed as abbreviations. We introduce the fuzzy search module using edit distance (Damerau–Levenshtein) and entity popularities. The ranking score of fuzzy search is calculated as follows.
Since the edit distance calculation is expensive, we perform candidate filtering and hashing to reduce the number of operations on pairwise edit distance calculation. We remove candidate entities with their length larger or smaller
3.3.3.Aggregation search
This search module is designed to aggregate keyword search and fuzzy search results with a weighted fusion as the following equation.
3.4.Step 3: Candidate type generation
This step is to generate candidate types for the named-entity columns. The overall confidence scores of candidate types are described in Section 3.4.5. The details of entity search signals, named-entity recognition signals, table header signals, numerical column signals are described in Section 3.4.1, Section 3.4.2, Section 3.4.3, and Section 3.4.4.
3.4.1.Entity search signals
Let
3.4.2.Named-entity recognition signals
We denote the potential function of candidate types derived from name-entity recognition signals as
Finally, we normalize the confidence scores of candidate types to the range
Table 1
Mappings between named entities (using SpaCy toolkit) and DBpedia entity types
| NER Tags | DBpedia Entity Types |
| PERSON | dbo:Person |
| NORP | dbo:Country, dbo:Religious, dbo:PoliticalParty |
| FAC | dbo:PopulatedPlace, dbo:Building, dbo:RouteOfTransportation, dbo:Airport |
| ORG | dbo:Organization |
| LOC | dbo:PopulatedPlace |
| GPE | dbo:PopulatedPlace |
| PRODUCT | dbo:Device, dbo:Food |
| EVENT | dbo:Event |
| WORK_OF_ART | dbo:Work |
| LAW | dbo:LawFirm |
| LANGUAGE | dbo:Language |
3.4.3.Table header signals
Let
We also normalize candidate type confidence scores to
3.4.4.Numerical column signals
Let
We first use EmbNum+ [16] for column
Fig. 4.
Property lookup with EmbNum+.
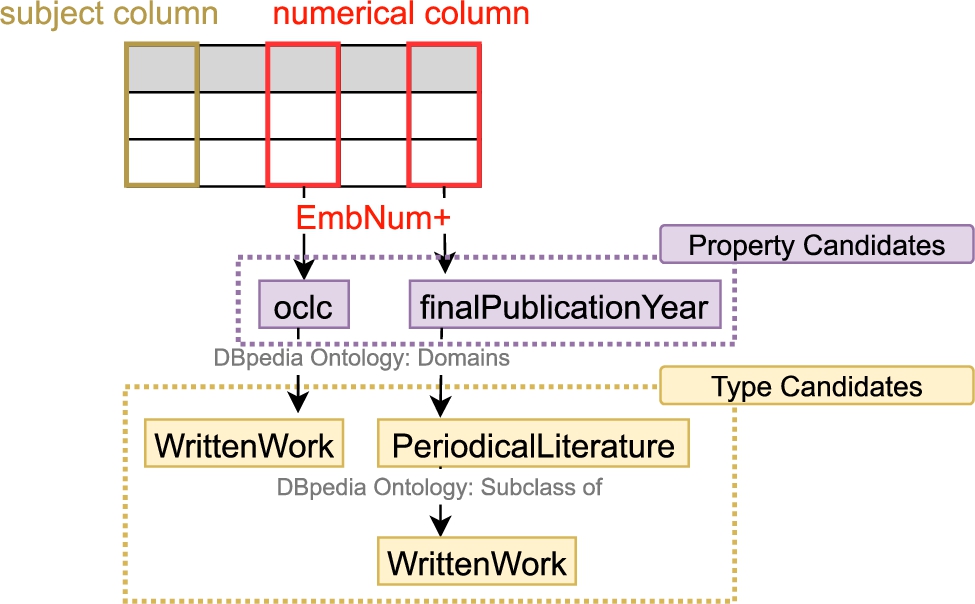
Next, we use the candidate properties to infer the classes (types) for the subject column. The inferred classes are the candidate properties’ domain classes (dbo:domain). For example, in Fig. 4, the candidate properties of the two numerical columns are “dbo:oclc” and “dbo:finalPublicationYear”. The inferred candidate types of the subject column given the two numerical columns are “dbo:WrittenWork” and “dbo:PeriodcalLiterature” (the domain types of the candidate properties).
Let
3.4.5.Signal aggregation
The confidence scores of candidate types
To avoid adding too much noise to the final aggregation, we omit the types that have confidence scores less than γ.88 MTab4D uses an equal contribution for the weighting of
3.5.Step 4: Candidate property generation
This step is to generate candidate properties
3.5.1.Subject column – named-entity column
Let
Cell
We assume that there is a relation between candidate entities of
Figure 5 illustrates candidate property generation between the subject and entity columns. The list of
Fig. 5.
Illustration of candidate property generation between the subject column and an entity column.
3.5.2.Subject column – literal column
Let
We perform value-based matching to calculate the similarities between entity attribute values of the
– Textual values: We use the normalized Damerau–Levenshtein distance as the similarity between
where– Numerical values: we adapt the relative change as the numerical similarity as the following equation.
Fig. 6.
Illustration of candidate property generation between the subject column and a literal column.
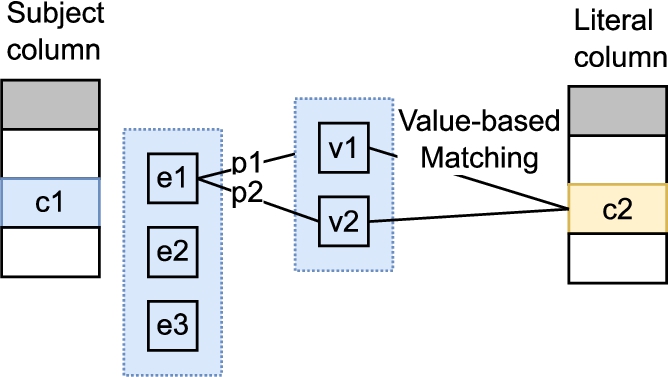
Figure 6 illustrates candidate property generation between the subject and literal columns. The list of
3.6.Step 5: Entity matching
This step is to re-calculate the candidate entities based on the prior signals from the previous steps. Given a table cell
–
–
–
–
The candidate entity confidence scores of the table cell of
3.7.Step 6, 7: Type and property matching
We aggregate the highest probabilities of candidate entities in Step 5 for each cell
4.Evaluation
This section first reports the detail about benchmark datasets in Section 4.1, evaluation metrics in Section 4.3, and experimental setting in Section 4.4. The overall results are reported in Section 4.5.
4.1.Datasets
We use the two datasets as the original SemTab 2019 (four rounds) and the adapted SemTab 2019 with the 2016 October of DBpedia [14]. Table 2 reports the number of tables in each dataset; target cells (in CEA), columns (in CTA), and column pairs (in CPA) of the original and adapted versions of the SemTab 2019 dataset.
Table 2
Statistics of matching targets on the original and adapted SemTab 2019 datasets
| Round | #Table | CEA Targets | CPA Targets | CTA Targets | |||
| Original | Adapted | Original | Adapted | Original | Adapted | ||
| 1 | 70 | 8418 | 8406 | 116 | 116 | 120 | 120 |
| 2 | 11925 | 463796 | 457567 | 6762 | 6762 | 14780 | 14333 |
| 3 | 2162 | 406827 | 406820 | 7575 | 7575 | 5762 | 5673 |
| 4 | 818 | 107352 | 107351 | 2747 | 2747 | 1732 | 1717 |
4.1.1.Original SemTab 2019 dataset
The SemTab 2019 challenge has four rounds; each round came with a different set of tables and matching targets for each annotation task [7]. In detail, Round 1 data is a subset of the T2Dv2 dataset, a standard dataset in tabular data annotation. Round 2 is the biggest and most complex since it combines Wikipedia tables and automatically generated tables from DBpedia. Round 3 and 4 datasets also are automatically generated from DBpedia, but the easily matched cells are removed in Round 4. To generate the tabular data, firstly, a list of classes and properties are gathered, then for each class, the generator selects groups of properties and uses them to create “realistic” tables using SPARQL queries. Finally, the “realistic” tables are added noise into the surface textual of table cells or removed “easy” matches cells.
4.1.2.Adapted SemTab 2019 dataset
This section presents an adapted SemTab 2019 with the 2016 October of DBpedia for reproducibility [14]. It is challenging to compare annotation systems while not using the same experimental setting (DBpedia version). Knowledge Graphs change over time so that the schema or instances from a DBpedia version have many differences from another version. As a result, an annotation system could yield a different performance when benchmarked on different DBpedia versions.
To enable reproducibility, we perform adaptations on the original version of the SemTab 2019 dataset to October 2019 of DBpedia as in Section 4.1.3. Section 4.1.4 reports the open resources from the adapted dataset.
4.1.3.Ground truth
We process the original SemTab 2019 dataset as follows:
– We make matching targets, and ground truth answers consistent by removing the matching targets that are not available in the ground truth and the original matching targets.
– We remove invalid entities, types, and properties that are not available in the October 2016 version of DBpedia.
– We add missing redirects, equivalent entities, types, and properties.
– We remove prefixes to avoid redirect issues. For example, the expected prefix of the entity “Lake Alan Henry” is “http://dbpedia.org/resource/Lake_Alan_Henry” while the CEA ground truth of the original SemTab 2019 Round 1 has “http://dbpedia.org/page/Lake_Alan_Henry”. Removing the prefix also have a data storage-efficient (The adapted SemTab 2019 saves 51.3% more space than the original dataset).
4.1.4.Public resources
We also prepare open resources to be reproduced for future studies.
– Schema: We prepare the CSV files as DBpedia class hierarchy, properties, and equivalents.
– Data: We also published an entity JSON list dump (all information about entities) of the October 2016 version of DBpedia. The information of each entity could be accessed quickly using our opened API4 without processing entire all DBpedia entities.
– Entity Search: We provide a public API of entity search based on entity label and aliases (multilingual) of DBpedia 2016 October. The search results will be expected to be the same using our API, while using other online entity searches (e.g., DBpedia entity search or Wikipedia search) could yield different answers.
– Other resources: We also provide other public APIs4 of tabular data annotations, numerical attribute labeling, annotation evaluation for the original and adapted SemTab 2019 datasets [14].
4.2.Analysis of the original SemTab 2019 dataset
CEA task Table 3 depicts the number of inconsistencies between the SemTab 2019 ground truth data and the October 2016 version of DBpedia.
Index Inconsistencies (IIndex) describes the number of invalid table cell indexes of CEA targets. Encoding Inconsistencies (IEncoding) describes the number of encoding errors of DBpedia URIs. Many samples are inconsistent with URI encoded and decoded representation. For example, an entity URI of dbr:Angélica_Rivera could be encoded as “dbr:Ang%C3%A9lica_Rivera” and decoded as “dbr:Angélica_Rivera”. The ground truth of CEA contains a mixture between encoded URI and decoded URI. The encoding URI (percent-encoding) is not encouraged.99 Invalid Inconsistencies (IInvalid) is the number of invalid entities not in the October 2016 version of DBpedia, and Redirect Inconsistencies (IRedirect) is the number of matching targets missing redirect entities.
The Round 2 dataset contains many inconsistencies, including the four types of inconsistencies (7.8% inconsistencies) because this dataset combines a subset of Wikipedia tables (with a different KG target: the October 2015 version of DBpedia) and automatically generated tables (from the October 2016 version of DBpedia). Round 1 dataset is the second place of inconsistencies (7%) since this is the subset of the T2D dataset (with a KG target as the 2014 version of DBpedia). Round 3 dataset has 3% inconsistencies, and Round 4 dataset is the cleanest in four rounds (2% inconsistencies).
Table 3
Analysis of the CEA task of SemTab 2019 with the DBpedia October 2016
| Round | IIndex | IEncoding | IInvalid | IRedirect |
| 1 | 0 | 418 | 22 | 203 |
| 2 | 250 | 21912 | 7662 | 6130 |
| 3 | 0 | 7427 | 763 | 4140 |
| 4 | 0 | 1487 | 22 | 682 |
CTA task Table 4 depicts the number of inconsistencies of CTA with the October 2016 version of DBpedia. Index errors (IIndex) describes the number of invalid table column indexes of CTA targets. Missing equivalent classes (IHierarchy) is the number of hierarchy classes’ inconsistencies in the CTA ground truth. There are 2% index errors in the Round 2 dataset. Although the CTA ground truth is derived from the October 2016 version of DBpedia, there are some inconsistencies, such as dbo:Region class is not an ancestor of dbo:City in the October 2016 version of DBpedia while it is an ancestor in the ground truth data. The class hierarchy also misses equivalent classes such as dbo:PenaltyShootOut class is the equivalent with dbo:Event. It could be semantic incorrect about (dbo:PenaltyShootOut owl:equivalentClass dbo:Event); however, we adopt the fact to follow DBpedia correctness and completeness assumption.
Round 2 dataset has 2% index errors where the target matching is not available in the input table. Round 1 has no errors, while Round 2, 3, 4 have 5%, 6%, and 1% IHierarchy error rates.
Table 4
Analysis on CTA task of SemTab 2019 with the October 2016 version of DBpedia
| Round | IIndex | IHierarchy |
| 1 | 0 | 0 |
| 2 | 323 | 697 |
| 3 | 0 | 353 |
| 4 | 0 | 14 |
CPA task We found that the ground truth of the CPA task misses many equivalent properties. For example, the properties of dbo:team has its equivalent property as dbo:club. Some of the equivalent properties in the October 2016 version of DBpedia are (dbo:team, dbo:club), (dbo:composer, dbo:musicBy, dbo:jureLanguage), and (dbo:area, dbo:landArea, dbo:waterArea).
Table 5 depicts statistics on missing equivalent properties (IIEquivalent) in the October 2016 version of DBpedia. Round 1 has 4% of ground truth missing equivalent properties. Round 2, 3, 4 have approximately 28% missing equivalent properties.
Table 5
Analysis on CPA task of SemTab 2019 with the October 2016 version of DBpedia
| Round | IEquivalent |
| 1 | 5 |
| 2 | 1911 |
| 3 | 2030 |
| 4 | 828 |
4.3.Evaluation metrics
There are four different metrics used to evaluate tabular data annotation:
F1-score is a harmonic mean of precision and recall. It is used as the primary score to measure the performance of entity annotations (CEA – all rounds), property annotations (CPA – all rounds), and type annotation (CTA – Round 1). The F1 metric is calculated as follows.
Regarding the type annotation CTA task, two metrics are designed to measure the hierarchy of class annotations (Average Hierarchical – AH) and perfect class annotations (Average Perfect – AP) [9]. The AH score is used as the primary score, while the AP score is used as the secondary score for rounds 2, 3, 4 of CTA task.
Let the list of target columns be
4.4.Experimental settings
MTab4D is built based on the October 2016 version of DBpedia with three versions (a, b, f) depending on the use of the entity search module. MTab4Db is the system that uses the keyword search, MTab4Df is used the fuzzy search, and MTab4Da is used the aggregation search.
We compare MTab4D with other systems, using the results reported in SemTab 2019 dataset (original version). Unlike our participated system MTab, MTab4D focuses on reproducibility, where we use the entity search built from dump data of DBpedia.
We also conduct experiments MTab4D on the adapted version of SemTab 2019, where we remove the inconsistencies between ground truth and the October 2016 version of DBpedia.
4.5.Experimental results
In this section, we first report the results of MTab4D with other SemTab 2019 participants on the original data version in Section 4.5.1. The full results are reported on the challenge websites.1010 Then, we present the results of MTab4D on the adapted version of SemTab 2019 in Section 4.5.2.
4.5.1.Original SemTab 2019 dataset
Table 6 depicts the CEA results in the F1 score and Precision of MTab4D compared to the other systems on the original version of SemTab 2019. Because of the high data inconsistencies in Rounds 1 and 2, MTab4D could not provide comparable results with the original system MTab. However, MTab4Db, with a keyword search, got slightly higher performance than the MTab system in Round 3 and Round 4. In Round 1 and Round 2, MTab4Df using fuzzy search achieves higher performance than MTab4D using keyword search and aggregation search. It could be explained that the datasets have a higher noisy level of table cells, such as incorrect encoding parsing, entity labels variance, or abbreviation. In rounds 3 and 4, MTab4Db using keyword search achieves higher performance since the table cells are more likely similar to entity labels of DBpedia.
Table 6
CEA results in F1 score and Precision for the four rounds of the original version of SemTab 2019
| F1 score | Precision | |||||||
| Round: | 1 | 2 | 3 | 4 | 1 | 2 | 3 | 4 |
| MTab* | 1.000 | 0.911 | 0.970 | 0.983 | 1.000 | 0.911 | 0.970 | 0.983 |
| CSV2KG* | 0.448 | 0.883 | 0.962 | 0.907 | 0.627 | 0.893 | 0.964 | 0.912 |
| Tabularisi* | 0.884 | 0.826 | 0.857 | 0.803 | 0.908 | 0.852 | 0.866 | 0.813 |
| MantisTable* | 1.000 | 0.614 | 0.633 | 0.973 | 1.000 | 0.673 | 0.679 | 0.983 |
| LOD4ALL* | 0.852 | 0.757 | 0.828 | 0.648 | 0.874 | 0.767 | 0.833 | 0.654 |
| ADOG* | 0.657 | 0.742 | 0.912 | 0.835 | 0.673 | 0.745 | 0.913 | 0.838 |
| DAGOBAH* | 0.897 | 0.713 | 0.725 | 0.578 | 0.941 | 0.816 | 0.745 | 0.599 |
| MTab4Db | 0.839 | 0.888 | 0.984 | 0.984 | 0.839 | 0.888 | 0.984 | 0.984 |
| MTab4Df | 0.867 | 0.892 | 0.983 | 0.983 | 0.873 | 0.899 | 0.983 | 0.983 |
| MTab4Da | 0.839 | 0.885 | 0.983 | 0.983 | 0.839 | 0.885 | 0.983 | 0.983 |
* Results are taken from SemTab 2019 [9].
Table 7 depicts the CTA results in AH score and AP score of MTab4D compared to the other systems on the original version of SemTab 2019. Because of the CTA inconsistencies of the ground truth, MTab4D results are not comparable with our system MTab in SemTab 2019. MTab4Df achieves slightly higher performance than MTab4D using other entity search modules.
Table 7
CTA results in F1 and Precision for Round 1 and AH score, and AP score of the original version of SemTab 2019
| AH score | AP score | |||||||
| Round: | 1 (F1) | 2 | 3 | 4 | 1 (Precision) | 2 | 3 | 4 |
| MTab* | 1.000 | 1.414 | 1.956 | 2.012 | 1.000 | 0.276 | 0.261 | 0.300 |
| CSV2KG* | 0.833 | 1.376 | 1.864 | 1.846 | 0.833 | 0.257 | 0.247 | 0.274 |
| Tabularisi* | 0.825 | 1.099 | 1.702 | 1.716 | 0.825 | 0.261 | 0.277 | 0.325 |
| MantisTable* | 0.929 | 1.049 | 1.648 | 1.682 | 0.933 | 0.247 | 0.269 | 0.322 |
| LOD4ALL* | 0.850 | 0.893 | 1.442 | 1.071 | 0.850 | 0.234 | 0.260 | 0.386 |
| ADOG* | 0.829 | 0.713 | 1.409 | 1.538 | 0.851 | 0.208 | 0.238 | 0.296 |
| DAGOBAH* | 0.644 | 0.641 | 0.745 | 0.684 | 0.580 | 0.247 | 0.161 | 0.206 |
| MTab4Db | – | 0.952 | 1.837 | 1.922 | – | 0.217 | 0.247 | 0.289 |
| MTab4Df | – | 0.996 | 1.839 | 1.927 | – | 0.225 | 0.249 | 0.289 |
| MTab4Da | – | 0.970 | 1.838 | 1.922 | – | 0.218 | 0.247 | 0.289 |
* Results are taken from SemTab 2019 [9].
Table 8 depicts the CPA results in F1 score and precision of MTab4D compared to the other systems on the original version of SemTab 2019. MTab4D results are slightly lower than our system MTab in SemTab 2019 because of lacking equivalent properties of the CPA ground truth. The results of using different search modules are similar; as a result, we conclude that there is no effect of using different entity search modules in MTab4D.
Table 8
CPA results in F1 score and Precision for the four rounds of the original version of SemTab 2019
| F1 score | Precision | |||||||
| Round: | 1 | 2 | 3 | 4 | 1 | 2 | 3 | 4 |
| MTab* | 0.987 | 0.881 | 0.844 | 0.832 | 0.975 | 0.929 | 0.845 | 0.832 |
| CSV2KG* | – | 0.877 | 0.841 | 0.830 | – | 0.926 | 0.843 | 0.835 |
| Tabularisi* | 0.606 | 0.79 | 0.827 | 0.823 | 0.638 | 0.792 | 0.83 | 0.825 |
| MantisTable* | 0.965 | 0.46 | 0.518 | 0.787 | 0.991 | 0.544 | 0.595 | 0.841 |
| LOD4ALL* | – | 0.555 | 0.545 | 0.439 | – | 0.941 | 0.853 | 0.904 |
| ADOG* | – | 0.459 | 0.558 | 0.75 | – | 0.708 | 0.763 | 0.767 |
| DAGOBAH* | 0.415 | 0.533 | 0.519 | 0.398 | 0.347 | 0.919 | 0.826 | 0.874 |
| MTab4Db | – | 0.839 | 0.844 | 0.830 | – | 0.842 | 0.849 | 0.838 |
| MTab4Df | – | 0.839 | 0.844 | 0.830 | – | 0.842 | 0.849 | 0.838 |
| MTab4Da | – | 0.839 | 0.844 | 0.830 | – | 0.843 | 0.849 | 0.838 |
* Results are taken from SemTab 2019 [9].
4.5.2.Adapted SemTab 2019 dataset
This section compares the MTab4D performance on the original and adapted versions of the SemTab 2019 datasets.
Table 9 depicts the MTab4D results in the F1 score of the CEA task on the original and adapted version of the SemTab 2019 dataset. MTab4D, built on the October 2016 version of DBpedia, consistently achieves better performance on the adapted version dataset than the original one. Round 1 and 2 results in the adapted version have more improvement than Round 3, 4 because Round 1, 2 have more inconsistencies in the original dataset.
Table 9
CEA results in F1 score of MTab4D for the original and adapted version of SemTab 2019 dataset
| Method | Round 1 | Round 2 | Round 3 | Round 4 | ||||
| Original | Adapted | Original | Adapted | Original | Adapted | Original | Adapted | |
| MTab4Db | 0.839 | 0.857 (+2.15%) | 0.888 | 0.918 (+3.38%) | 0.984 | 0.992 (+0.81%) | 0.984 | 0.987 (+0.30%) |
| MTab4Df | 0.867 | 0.886 (+2.19%) | 0.892 | 0.923 (+3.48%) | 0.983 | 0.992 (+0.92%) | 0.983 | 0.987 (+0.41%) |
| MTab4Da | 0.839 | 0.860 (+2.50%) | 0.885 | 0.916 (+3.50%) | 0.983 | 0.992 (+0.92%) | 0.983 | 0.986 (+0.31%) |
Table 10 depicts the MTab4D results in the AH score of the CTA task on the original and adapted version of the SemTab 2019 dataset. The performance of MTab consistently improves on the adapted version.
Table 10
CTA results in AH score of MTab4D for the original and adapted version of SemTab 2019 dataset
| Method | Round 1 | Round 2 | Round 3 | Round 4 | ||||
| Original | Adapted | Original | Adapted | Original | Adapted | Original | Adapted | |
| MTab4Db | 1.292 | 1.350 (+4.49%) | 0.952 | 0.986 (+3.57%) | 1.837 | 1.926 (+4.84%) | 1.922 | 1.923 (+0.05%) |
| MTab4Df | 1.337 | 1.396 (+4.41%) | 0.996 | 1.031 (+3.51%) | 1.839 | 1.928 (+4.84%) | 1.927 | 1.926 (−0.05%) |
| MTab4Da | 1.300 | 1.358 (+4.46%) | 0.970 | 1.006 (+3.71%) | 1.838 | 1.927 (+4.84%) | 1.922 | 1.923 (+0.05%) |
Table 11 depicts the MTab4D results in the F1 score of the CPA task on the original and adapted version of the SemTab 2019 dataset. The performance of MTab significantly improves on the adapted version, adding the equivalent properties into the ground truth data. Due to the incompleteness of DBpedia, there are many indirect equivalent properties in DBpedia. For example, dbo:deathCause and dbo:causeOfDeath have the same equivalent property of wikidata:P509 (cause of death). The problem of knowledge graph completion is not the main focus of this work, but we can expect the improvement of property annotations when the completeness of DBpedia is improved.
Table 11
CPA results in F1 score of MTab4D for the original and adapted version of SemTab 2019 dataset
| Method | Round 1 | Round 2 | Round 3 | Round 4 | ||||
| Original | Adapted | Original | Adapted | Original | Adapted | Original | Adapted | |
| MTab4Db | – | – | 0.839 | 0.982 (+17.04%) | 0.844 | 0.975 (+15.52%) | 0.830 | 0.983 (+18.43%) |
| MTab4Df | – | – | 0.839 | 0.982 (+17.04%) | 0.844 | 0.975 (+15.52%) | 0.830 | 0.983 (+18.43%) |
| MTab4Da | – | – | 0.839 | 0.983 (+17.16%) | 0.844 | 0.975 (+15.52%) | 0.830 | 0.983 (+18.43%) |
4.6.Errors analysis
This section analyzes the error cases of entity CEA, CTA, and CPA tasks of MTab4D. Specifically, we perform the following analysis objectives:
– EA1: How many MTab4D errors are on the CEA task? Which source caused these errors?
– EA2: How many MTab4D errors are on the CTA task? Do CEA results affect the annotation result of the CTA task?
– EA3: How many MTab4D errors are on the CPA task? Do CEA results affect the annotation result of the CPA task?
– EA4: How many MTab4D errors are on different table sizes?
For each question, we analyze MTab4D results on the adapted datasets (Section 4.5.2) using the MTab4Db (MTab4D with the keyword search in Section 3.3.1) since this setting achieved the best performance in this dataset. Error details on each table and errors of other MTab4D versions (i.e., MTab4Df, and MTab4Da) are available on the MTab4D repository.1111
4.6.1.EA1: MTab4D errors on the CEA task
Statistics of entity annotation errors on the adapted SemTab 2019 dataset depicts in Table 12. The error rate of entity annotation is from 0.75% to 14.32%. MTab4D results have higher error rates in noisy data as Round 1 (14.32%), and Round 2 (8.17%), and lower error rates in the synthesis data Round 3 (0.75%), and Round 4 (1.27%).
Most entity annotation errors (from 89.21% to 95.88%) do not have correct answers in entity search modules in Step 2. Due to the high ambiguity of table cells, there are 4.12%–10.79% of other CEA errors even if there is a correct answer in the step of candidate entity generation.
Because MTab4D entity search modules return the top 100 relevant entities as a default setting (efficiency reasons), a correct answer might be ranked lower than the top 100. To understand MTab4D performances in a larger search limit, we re-run the experiments with the search limit setting as 1,000. Table 13 depicts MTab4D performances with the search limit as 1,000 and as 100 on the adapted SemTab 2019 dataset. Although there is an increasing search limit in MTab4D, the differences in final results are not significant. Building a better search engine for tabular data is challenging for future studies because table data contains ambiguous text, abbreviations, misspellings.
Table 12
Statistics of entity annotation errors on the adapted SemTab 2019 dataset. We show the number of CEA matching targets as #Targets, the number of errors of MTab4Db as #Errors, the percentage of CEA errors when there is no correct entity available in the candidate entity list of the search modules (Section 3.3) as Search, and Others (other error cases)
| Round 1 | Round 2 | Round 3 | Round 4 | |
| #Targets | 8,406 | 457,567 | 406,820 | 107,351 |
| #Errors | 1,204 (14.32%) | 37,365 (8.17%) | 3,069 (0.75%) | 1,360 (1.27%) |
| Search | 89.78% | 93.92% | 89.21% | 95.88% |
| Others | 10.22% | 6.08% | 10.79% | 4.12% |
Table 13
Annotation results of MTab4D on the adapted SemTab 2019 dataset with the search limit as 1,000. We also show the percentage difference of the results with search limit as 1000 and the results of the search limit of 100 (as in Table 9, 10, and 11)
| Task | Method | Round 1 | Round 2 | Round 3 | Round 4 |
| CEA | MTab4Db | 0.849 (−0.93%) | 0.918 (+0.00%) | 0.994 (+0.20%) | 0.992 (+0.51%) |
| MTab4Df | 0.883 (−0.34%) | 0.925 (+0.22%) | 0.994 (+0.20%) | 0.991 (+0.41%) | |
| MTab4Da | 0.851 (−1.05%) | 0.916 (+0.00%) | 0.993 (+0.10%) | 0.991 (+0.51%) | |
| CTA | MTab4Db | 1.358 (+0.59%) | 0.975 (−1.12%) | 1.927 (+0.05%) | 1.923 (+0.00%) |
| MTab4Df | 1.396 (+0.00%) | 1.031 (+0.00%) | 1.930 (+0.10%) | 1.925 (−0.05%) | |
| MTab4Da | 1.358 (+0.00%) | 0.986 (−1.99%) | 1.928 (+0.05%) | 1.923 (+0.00%) | |
| CPA | MTab4Db | – | 0.982 (+0.00%) | 0.975 (+0.00%) | 0.983 (+0.00%) |
| MTab4Df | – | 0.982 (+0.00%) | 0.975 (+0.00%) | 0.984 (+0.10%) | |
| MTab4Da | – | 0.983 (+0.00%) | 0.975 (+0.00%) | 0.983 (+0.00%) |
4.6.2.EA2: MTab4D errors on the CTA task
Statistics of type annotation errors on the adapted SemTab 2019 dataset are depicts in Table 14. In this analysis, a type annotation is an error when there is no overlapping between the annotated and ground truth types (the concatenation of perfect and OK types). The error rate of type annotation is from 1.57% to 16.75%. MTab4D results have higher error rates in noisy data as Round 1 (9.17%), and Round 2 (16.75%), and lower error rates in the synthesis data Round 3 (1.75%), and Round 4 (1.57%).
There is also a large portion of the CEA annotation errors (80%-99.35%) for type errors. Since the MTab4D type annotation module aggregates confidence signals from CEA annotation results, the errors in CEA tasks also affect the performance of CTA tasks.
Table 14
Statistics of type annotation errors on the adapted SemTab 2019 dataset. We show the number of CTA matching targets as #Targets, the number of errors of MTab4Db as #Errors. CEA errors depicts the probability of having CEA errors in the table that have CTA errors
| Round 1 | Round 2 | Round 3 | Round 4 | |
| #Targets | 109 | 14,333 | 5,673 | 1,717 |
| #Errors | 10 (9.17%) | 2,401 (16.75%) | 99 (1.75%) | 27 (1.57%) |
| CEA errors | 80.00% | 99.35% | 88.16% | 81.82% |
4.6.3.EA3: MTab4D errors on the CPA task
Statistics of property annotation errors on the adapted SemTab 2019 dataset are depicts in Table 15. The error rate of type annotation is from 2.66% to 2.97%. We also have the same observation as the CTA tasks; the CPA results are strongly affected by the CEA task performance as a large portion of the CEA annotation errors (80%-99.35%) for property annotation errors.
Table 15
Statistics of property annotation errors on the adapted SemTab 2019 datasets. We show the number of CPA matching targets as #Targets, the number of errors of MTab4Db as #Errors. CEA errors depicts the probability of having CEA errors in the table that have CPA errors
| Round 1 | Round 2 | Round 3 | Round 4 | |
| #Targets | – | 6,762 | 7,575 | 2,747 |
| #Errors | – | 151 (2.23%) | 225 (2.97%) | 73 (2.66%) |
| CEA errors | – | 98.75% | 90.09% | 88.89% |
4.6.4.EA4: MTab4D errors on different table sizes
Statistics of MTab4D errors on different table sizes are reported in Table 16. Overall, MTab4D performance increase with the increase of table size. Regarding the CEA task, MTa4D provides many errors (31.78% of the annotations are incorrect) in the small tables (less than ten cells), while the system performs very well in large tables. In the CTA task, MTab4D results also have many errors in small table sizes (30.66% of the annotations are errors); however, the system works well for large tables. There is no target matching for tables with the number of cells less than ten and larger than 10,000 cells for the CPA task. MTab4D provides the best results for tables with cells from 100 to 1,000 with only 5.72% incorrect answers.
Table 16
Statistics of MTab4D errors on different table sizes
| #Cells | 10 | 100 | 1,000 | 10,000 | 100,000 |
| CEA | 31.78% | 1.82% | 0.10% | 0.03% | 0.00% |
| CTA | 30.66% | 9.79% | 2.72% | 1.77% | 0.00% |
| CPA | – | 7.89% | 5.72% | 9.26% | – |
5.MTab4D APIs, and graphical interface
This section describes our implementations as described in Section 3: MTab4D APIs and MTab4D graphical interface.
5.1.MTab4D APIs
We provide the five following APIs.
– Entity Search: This API is used to search relevant entities from the October 2016 version of DBpedia. There are three search modules (Section 3.3): keyword search, fuzzy search, and aggregation search.
– Entity Information Retrieval: This API is used to retrieve entity information from the October 2016 version of DBpedia. The responded object includes DBpedia title, mapping to Wikidata, Wikipedia, label, aliases, types, entity popularity (PageRank score), entity triples, and literal triples.
– Table Annotation: This API sends a table to the API and gets the annotation results, including structural and semantic annotations. The user could provide the annotation targets for CEA, CTA, or CPA tasks as the input, or MTab4D also could automatically predict the targets based on cell and column datatypes as in Section 3.2.5.
– Numerical Labeling: The user could do numerical labeling from numerical columns and get a ranking list of relevant properties as EmbNum+ [16].
– SemTab 2019 Evaluation: The user could submit the annotation results of CEA, CTA, and CPA tasks to calculate the evaluation metrics from the original and adapted datasets of SemTab 2019.
5.2.MTab4D graphical interface
We provide two interfaces entity search and table annotation.
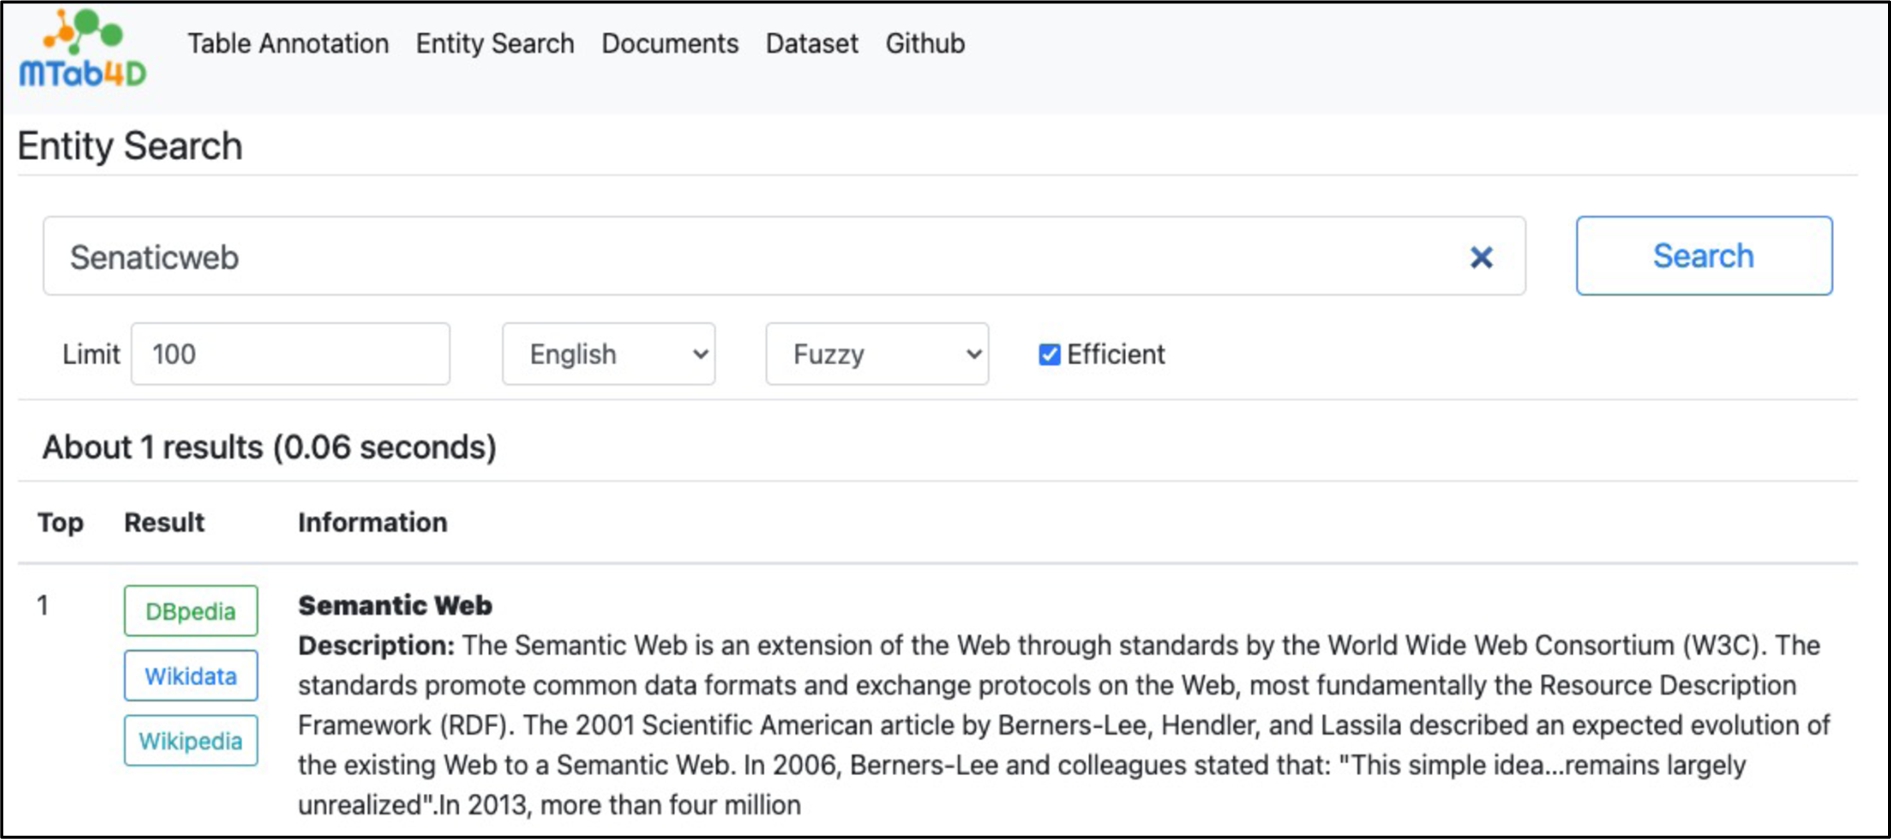
5.2.1.Entity search interface
The user can enter a query in the entity search interface then search with the three MTab4D entity search modules (i.e., keyword search, fuzzy search, and aggregation search). Figure 7 illustrates an example of the fuzzy search with the keyword of “Senaticweb”. It takes only 0.06 seconds to get the relevant “Semantic Web” entity.
Fig. 7.
MTab4D entity search interface.
5.2.2.Table annotation interface
The user can copy and paste table content expressed in any language from tabular data files (Excel, CSV, TSV) or tables on the Web in the table annotation interface. Then, the user could tap the “Annotate” button to get the annotation results.
Fig. 8.
MTab4D table annotation interface.
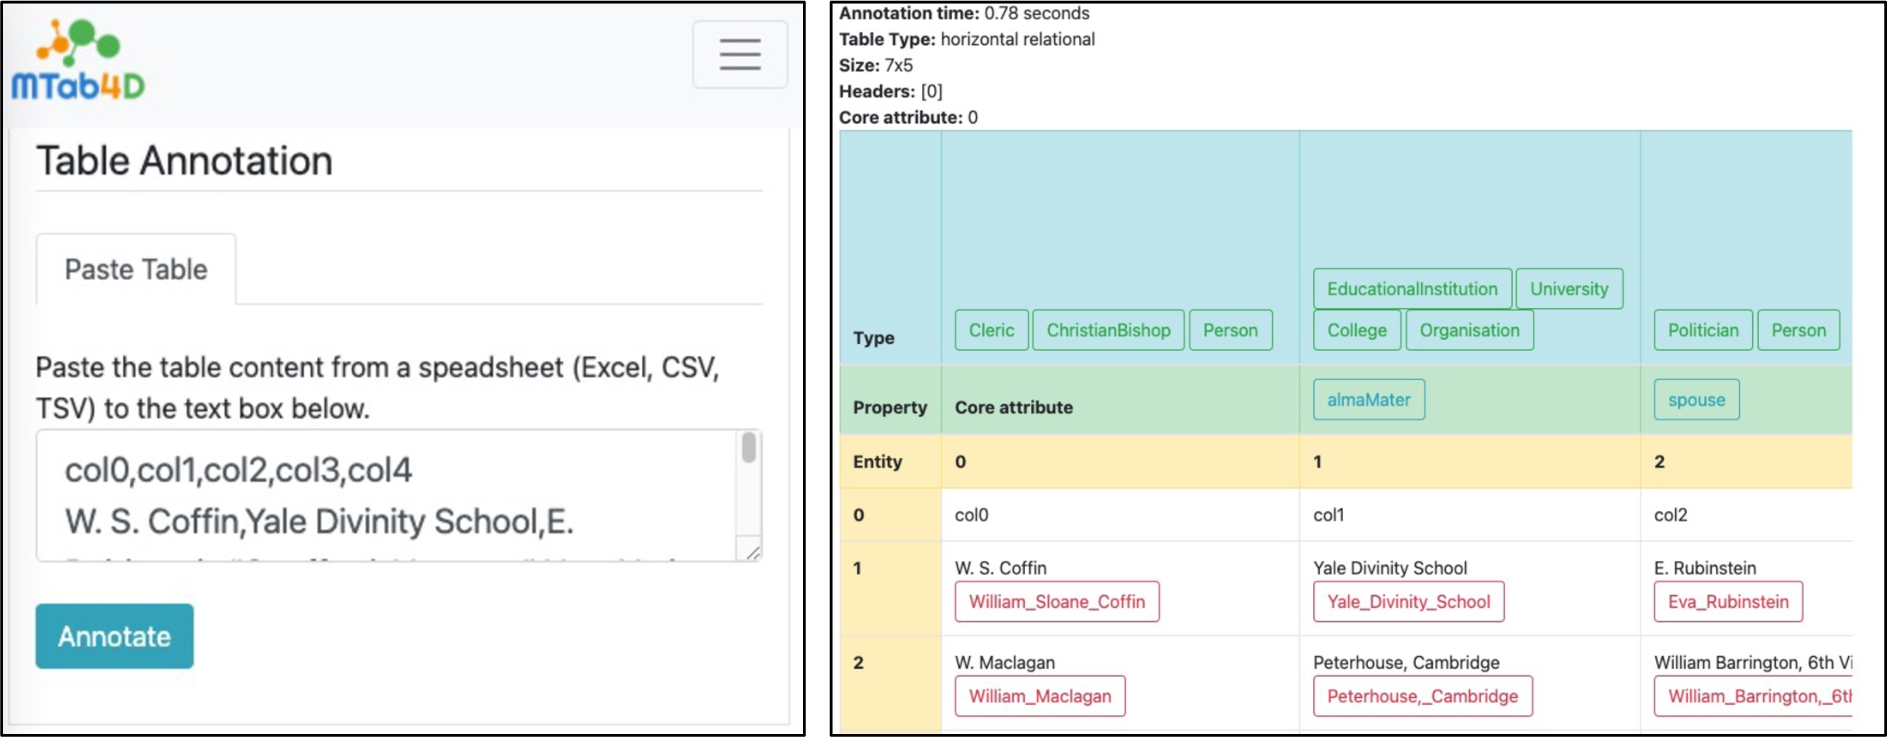
Figure 8 illustrates an example of table annotation on the “v15_1” table in Round 4 of SemTab 2019. MTab4D takes 0.78 seconds to annotate the input table, as shown in the left figure. The figure on the right shows the annotation results. The table header is in the first row, and the core attribute is in the first column. Entity annotations are in red and located below the table cell value. The type annotation is in green and located in the “Type” column. Finally, the relations between the core attribute and other columns are in blue and located in the property column.
6.Related work
In this section, we review the other systems participating in SemTab 2019. Also, we discuss related works on the tabular data annotation task.
6.1.SemTab 2019 systems
Table 17
Comparison of candidate entity generation methods of SemTab 2019 participants
| MTab4D | CSV2KG | TabularISI | MantisTable | LOD4ALL | ADOG | DAGOBAH | |
| URI heuristic* | x | ✓ | x | x | ✓ | x | x |
| DBpedia SPARQL | ✓ | x | x | ✓ | x | x | ✓ |
| DBpedia Lookup | ✓ | ✓ | x | x | x | x | x |
| DBpedia Spotlight | x | ✓ | x | x | x | x | x |
| Wikidata SPARQL | ✓ | x | ✓ | x | x | x | ✓ |
| Wikipedia (CirrusSearch) | x | x | x | x | x | x | ✓ |
| Wikipedia (Multilingual) | ✓ | x | x | x | x | x | x |
| DBpedia Elastic Search | x | x | ✓ | x | x | ✓ | x |
| Wikidata Elastic Search | x | x | ✓ | x | x | x | ✓ |
| LOD4ALL Elastic Search | x | x | x | x | ✓ | x | x |
* URI heuristic: checking whether there is an available entity that has a similar label with table cell using ASK SPARQL.
This section describes the six other frequent participants for all rounds of SemTab 2019 challenges.
The participants generate candidate entities by looking up table cell values or search values in the local index with Elastic Search in DBpedia, Wikidata. Table 17 reports the lookup services used in the participant systems because of lacking specification of information retrieval techniques, hyper-parameters, database index sources. Then, the candidate types and candidate properties are estimated using the candidate entities. Finally, the systems perform entity disambiguation to return the CEA results. The CTA and CPA annotations are generated with the CEA annotations using majority voting.
CSV2KG (IDLAB) first searches on DBpedia lookup and DBpedia Spotlight to generate candidate entities [25]. The candidate types and property annotations are estimated using majority voting approaches based on candidate entities. Then, the entity annotations are estimated using the information of candidate properties. Finally, type annotations are estimated using entity annotations.
Tabular ISI approach first generates candidate entities with Wikidata API and Elastic Search on entity labels of Wikidata, DBpedia. Second, the authors use the heuristics TF-IDF approach and machine learning (neural network ranking) model to select the best candidate for the entity annotation task [24]. The type annotations are estimated with the results from entity annotations with hierarchy searching on common classes. The property annotations are estimated by finding the relation between candidate entities of the primary and secondary columns or values matching the primary and secondary columns’ values.
Mantis Table performs column analysis, including predicting name entity columns, literal columns, and subject column, then mapping between columns into concepts in DBpedia [3]. The relationships between the subject column and other columns are estimated based on predicate context and predicate frequency of column value and candidate predicates. Finally, entity linking is performed using the results from previous steps for cell value disambiguation. The property annotations are estimated by getting the maximum frequency of candidate properties in the entity linking phase. The authors calculate the hierarchical path score of entity types from entity annotations to estimate type annotations. Then type annotations are estimated on the maximum of the path score.
DAGOBAH performs entity linking with a lookup on Wikidata, DBpedia, and voting mechanisms [1]. The authors used Wikidata entity embedding to estimate the entity candidate types, assuming that the same column’s entities should be closed in the embedding spaces as they share semantic meanings.
LOD4ALL uses a combination of direct search (SPARQL ASK on dbr:“query”), keyword search (Abbreviation of Human name), and Elastic Search to find candidate entities [12]. The candidate entities will be used to estimate type annotations with majority voting. Then, the system determines the entity annotations with the type constraints. Finally, the property annotations are estimated by a column-based majority voting with entity annotations of each table row.
ADOG focuses on entity annotation with Elastic Search on an integrated ontology (DBpedia sub-graph) using a NoSQL database named ArangoDB [18]. The system estimates entity annotation using Levenshtein distance, and the results of type and property annotations are estimated from entity annotations.
In summary, some participants adopt the online lookup services of DBpedia, Wikidata, Wikipedia. As a result, it is hard to reproduce the experimental result while the source index changes over time. Some participants built offline lookup services that lacked specification on the information retrieval techniques, hyper-parameter settings, or index sources. It is also hard to reproduce their results. To address the problem, we built a database index from dump data of the October 2016 version of DBpedia. We released many public APIs about entity search modules that enable reproducibility for future studies.
Moreover, tabular data contains many numerical attributes that help us use semantic labeling results for numerical attributes. In MTab4D, we aggregate signal from the results of semantic labeling for numerical attributes (columns) using EmbNum+ [16] (deep metric for distribution similarity calculation). Additionally, we also use novel signals from the relations of column pairs to enhance overall matching performance.
6.2.Other tabular data annotation tasks
The tabular data annotation tasks could be categorized as structure or semantic annotation.
The structural annotation contains table type prediction [17], datatype prediction, table header annotation, subject column prediction, and holistic matching across tables [10]. In SemTab 2019, most tables are represented as a horizontal relational type; headers are located at the first row of tables, and the subject column is in the first table column.
There are many previous studies on table semantic annotation, including schema-level matching, e.g., tables to classes [22], columns to properties [2,16,19,22] or classes [27], and data-level matching, e.g., rows [5,22] or cells to entities [11,27]. SemTab 2019 also has schema annotation as the CTA task, data annotation as the CEA task, and a novel CPA task as column relation annotation.
6.3.DBpedia version
Due to the different environment settings, such as the DBpedia version, it is hard to compare the annotations directly. Table 18 reports the DBpedia versions used in table annotation tasks. Quercini et al. [20] used a snippet of DBpedia in 2013. T2K [22] conducts experiments on the T2D dataset built on the 2014 version of DBpedia. Efthymiou et al. [5] introduce Wikipedia tables and an adapted version of Limaye gold standard [11] built on the October 2015 version of DBpedia. The recent work (MantisTable [4]) builds the annotation system based on the DBpedia 2017 version. In this work, we follow the SemTab 2019 to build the system based on the DBpedia October 2016 version.
7.Conclusion
This paper presents MTab4D, a table annotation system that combines multiple matching signals from different table elements to address schema heterogeneity, data ambiguity, and noisiness. This paper also provides insightful analysis and extra resources on benchmarking semantic annotation with knowledge graphs. Additionally, we also introduce MTab4D APIs and graphical interfaces for reproducibility. Experimental results on the original and adapted datasets of the Semantic Web Challenge on Tabular Data to Knowledge Graph Matching (SemTab 2019) show that our system achieves an impressive performance for the three matching tasks.
7.1.Future work
MTab4D could be improved in many dimensions, such as effectiveness, efficiency, and generality. Regarding efficiency, MTab4D could be modified in a parallel processing fashion since the lookup steps and the probability estimations in Step 2, 3, and 4 are independent. Regarding effectiveness, MTab4D performance could be improved by relaxing our assumptions:
– The closed-world assumption (Assumption 1) might not hold in practice. Improving the completeness and correctness of knowledge graphs might improve MTab4D performance.
– MTab4D assumes the input table as a horizontal relational type as in Assumption 2. To make MTab4D work for other table types, e.g., vertical relational, we need to perform further preprocessing steps to identify table types and transform table data to horizontal relational.
– Many tables could have a shared schema, e.g., tables on the Web could be divided into many web pages; therefore, we can expect an improving matching performance by stitching tables on the same web page (or domain) [10,21].
7.2.Lessons learned
This section discusses the lessons learned from SemTab 2019 challenge.
Benchmarking value From our perspective, SemTab 2019 plays a vital role in benchmarking tabular data annotation tasks. Due to the differences in benchmark settings, tabular datasets, and target matching knowledge bases in the literature, there is a need for a general benchmark for tabular data annotation tasks to promote a fair comparison of annotation systems. This challenge reflects the practical performance of matching techniques and the importance of features for tabular matching.
DBpedia as target knowledge graph The choice of DBpedia as the target matching reflects the low update knowledge graph. In real-world practice, many knowledge graphs change rapidly, such as Wikidata. We will have different challenges in matching the fast-evolving knowledge graphs.
Notes
1 SemTab 2019: http://www.cs.ox.ac.uk/isg/challenges/sem-tab/, last accessed 03/2022.
2 API documents: https://mtab4d.kgraph.jp/docs, last accessed 03/2022.
3 MTab4D Graphical Interface: https://mtab4d.kgraph.jp, last accessed 03/2022.
4 MTab4D Repository: https://github.com/phucty/mtab4dbpedia, last accessed 03/2022.
5 MTab4D Entity search: https://mtab4d.kgraph.jp/search, last accessed 03/2022.
6 https://www.elastic.co/elasticsearch/, last accessed 03/2022.
7 We used the 200 most frequently numerical attributes (numerical properties, e.g., height, weight) of DBpedia as the database.
8 The parameter
9 DBpedia URI encoding: https://wiki.dbpedia.org/uri-encoding, last accessed 03/2022.
10 Results: http://www.cs.ox.ac.uk/isg/challenges/sem-tab/2019/results.html, last accessed 03/2022.
11 MTab4D error log files: https://github.com/phucty/mtab4dbpedia/blob/master/data/errors.tar.bz2, last accessed 03/2022.
Acknowledgements
The research was partially supported by the Cross-ministerial Strategic Innovation Promotion Program (SIP) Second Phase, “Big-data and AI-enabled Cyberspace Technologies” by the New Energy and Industrial Technology Development Organization (NEDO).
We would like to thank the SemTab 2019 challenge organizers for organizing the successful challenge. We also thank IBM Research and SIRIUS for their sponsorship of the challenge.
References
[1] | Y. Chabot, T. Labbé, J. Liu and R. Troncy, DAGOBAH: An end-to-end context-free tabular data semantic annotation system, in: SemTab@ISWC 2019, CEUR Workshop Proceedings, Vol. 2553: , CEUR-WS.org, (2019) , pp. 41–48, http://ceur-ws.org/Vol-2553/paper6.pdf. |
[2] | J. Chen, E. Jiménez-Ruiz, I. Horrocks and C.A. Sutton, ColNet: Embedding the semantics of web tables for column type prediction, in: Proceedings of the Thirty-Third AAAI Conference on Artificial Intelligence, 2019, (2019) , pp. 29–36. doi:10.1609/aaai.v33i01.330129. |
[3] | M. Cremaschi, R. Avogadro and D. Chieregato, MantisTable: An automatic approach for the semantic table interpretation, in: SemTab@ISWC 2019, CEUR Workshop Proceedings, Vol. 2553: , CEUR-WS.org, (2019) , pp. 15–24, http://ceur-ws.org/Vol-2553/paper3.pdf. |
[4] | M. Cremaschi, F.D. Paoli, A. Rula and B. Spahiu, A fully automated approach to a complete semantic table interpretation, Future Generation Computer Systems 112: ((2020) ), 478–500. doi:10.1016/j.future.2020.05.019. |
[5] | V. Efthymiou, O. Hassanzadeh, M. Rodriguez-Muro and V. Christophides, Matching web tables with knowledge base entities: From entity lookups to entity embeddings, in: The Semantic Web – ISWC 2017 – 16th International Semantic Web Conference, 2017, (2017) , pp. 260–277. doi:10.1007/978-3-319-68288-4_16. |
[6] | W. Garbe, SymSpell: Symmetric Delete algorithm, GitHub, 2012, https://github.com/wolfgarbe/SymSpell. |
[7] | O. Hassanzadeh, V. Efthymiou, J. Chen, E. Jiménez-Ruiz and K. Srinivas, SemTab2019: Semantic web challenge on tabular data to knowledge graph matching – 2019 data sets, Zenodo, 2019. doi:10.5281/zenodo.3518539. |
[8] | M. Honnibal and I. Montani, spaCy 2: Natural language understanding with Bloom embeddings, convolutional neural networks and incremental parsing, 2017, https://spacy.io/. |
[9] | E. Jiménez-Ruiz, O. Hassanzadeh, V. Efthymiou, J. Chen and K. Srinivas, SemTab 2019: Resources to benchmark tabular data to knowledge graph matching systems, in: The Semantic Web – 17th International Conference, ESWC 2020, Lecture Notes in Computer Science, Vol. 12123: , Springer, (2020) , pp. 514–530. doi:10.1007/978-3-030-49461-2_30. |
[10] | O. Lehmberg and C. Bizer, Stitching web tables for improving matching quality, Proc. VLDB Endow. 10: (11) ((2017) ), 1502–1513, http://www.vldb.org/pvldb/vol10/p1502-lehmberg.pdf. doi:10.14778/3137628.3137657. |
[11] | G. Limaye, S. Sarawagi and S. Chakrabarti, Annotating and searching web tables using entities, types and relationships, Proc. VLDB Endow. 3: (1) ((2010) ), 1338–1347, http://www.vldb.org/pvldb/vldb2010/pvldb_vol3/R118.pdf. doi:10.14778/1920841.1921005. |
[12] | H. Morikawa, Semantic table interpretation using LOD4ALL, in: SemTab@ISWC 2019, CEUR Workshop Proceedings, Vol. 2553: , CEUR-WS.org, (2019) , pp. 49–56, http://ceur-ws.org/Vol-2553/paper7.pdf. |
[13] | P. Nguyen, N. Kertkeidkachorn, R. Ichise and H. Takeda, MTab: Matching tabular data to knowledge graph using probability models, in: SemTab@ISWC 2019, CEUR Workshop Proceedings, Vol. 2553: , CEUR-WS.org, (2019) , pp. 7–14, http://ceur-ws.org/Vol-2553/paper2.pdf. |
[14] | P. Nguyen, N. Kertkeidkachorn, R. Ichise and H. Takeda, Semantic annotation for tabular data with DBpedia: Adapted SemTab 2019 with DBpedia 2016-10, Zenodo, 2021. doi:10.5281/zenodo.4922769. |
[15] | P. Nguyen, N. Kertkeidkachorn, R. Ichise and H. Takeda, MTab: Matching tabular data to knowledge graph using probability models, 2019, CoRR abs/1910.00246, arXiv:1910.00246. |
[16] | P. Nguyen, K. Nguyen, R. Ichise and H. Takeda, EmbNum+: Effective, efficient, and robust semantic labeling for numerical values, New Generation Computing 37: (4) ((2019) ), 393–427. doi:10.1007/s00354-019-00076-w. |
[17] | K. Nishida, K. Sadamitsu, R. Higashinaka and Y. Matsuo, Understanding the semantic structures of tables with a hybrid deep neural network architecture, in: Proceedings of the Thirty-First AAAI Conference on Artificial Intelligence, 2017, (2017) , pp. 168–174, http://aaai.org/ocs/index.php/AAAI/AAAI17/paper/view/14396. |
[18] | D. Oliveira and M. d’Aquin, ADOG – annotating data with ontologies and graphs, in: SemTab@ISWC 2019, CEUR Workshop Proceedings, Vol. 2553: , CEUR-WS.org, (2019) , pp. 1–6, http://ceur-ws.org/Vol-2553/paper1.pdf. |
[19] | M. Pham, S. Alse, C.A. Knoblock and P.A. Szekely, Semantic labeling: A domain-independent approach, in: The Semantic Web – ISWC 2016 – 15th International Semantic Web Conference, Lecture Notes in Computer Science, Vol. 9981: , (2016) , pp. 446–462. doi:10.1007/978-3-319-46523-4_27. |
[20] | G. Quercini and C. Reynaud, Entity discovery and annotation in tables, in: Joint 2013 EDBT/ICDT Conferences, EDBT ’13 Proceedings, G. Guerrini and N.W. Paton, eds, ACM, (2013) , pp. 693–704. doi:10.1145/2452376.2452457. |
[21] | D. Ritze, Web-scale web table to knowledge base matching, PhD thesis, University of Mannheim, Germany, 2017. https://ub-madoc.bib.uni-mannheim.de/43123. |
[22] | D. Ritze, O. Lehmberg and C. Bizer, Matching HTML tables to DBpedia, in: Proceedings of the 5th International Conference on Web Intelligence, Mining and Semantics, WIMS 2015, (2015) , pp. 10–1106. doi:10.1145/2797115.2797118. |
[23] | R. Speer, ftfy, 2019, version 5.5. https://github.com/LuminosoInsight/python-ftfy. |
[24] | A. Thawani, M. Hu, E. Hu, H. Zafar, N.T. Divvala, A. Singh, E. Qasemi, P.A. Szekely and J. Pujara, Entity linking to knowledge graphs to infer column types and properties, in: SemTab@ISWC 2019, CEUR Workshop Proceedings, Vol. 2553: , CEUR-WS.org, (2019) , pp. 25–32, http://ceur-ws.org/Vol-2553/paper4.pdf. |
[25] | G. Vandewiele, B. Steenwinckel, F.D. Turck and F. Ongenae, CVS2KG: Transforming tabular data into semantic knowledge, in: SemTab@ISWC 2019, CEUR Workshop Proceedings, Vol. 2553: , (2019) , pp. 33–40, http://ceur-ws.org/Vol-2553/paper5.pdf. |
[26] | D. Wang, P. Shiralkar, C. Lockard, B. Huang, X.L. Dong and M. Jiang, TCN: Table convolutional network for web table interpretation, in: WWW ’21: The Web Conference 2021, J. Leskovec, M. Grobelnik, M. Najork, J. Tang and L. Zia, eds, ACM / IW3C2, (2021) , pp. 4020–4032. doi:10.1145/3442381.3450090. |
[27] | Z. Zhang, Effective and efficient semantic table interpretation using |


