
Analyzing the generalizability of the network-based topic emergence identification method
Abstract
Topic evolution helps the understanding of current research topics and their histories by automatically modeling and detecting the set of shared research fields in academic publications as topics. This paper provides a generalized analysis of the topic evolution method for predicting the emergence of new topics, which can operate on any dataset where the topics are defined as the relationships of their neighborhoods in the past by extrapolating to the future topics. Twenty sample topic networks were built with various fields-of-study keywords as seeds, covering domains such as business, materials, diseases, and computer science from the Microsoft Academic Graph dataset. The binary classifier was trained for each topic network using 15 structural features of emerging and existing topics and consistently resulted in accuracy and F1 over 0.91 for all twenty datasets over the periods of 2000 to 2019. Feature selection showed that the models retained most of the performance with only one-third of the tested features. Incremental learning was tested within the same topic over time and between different topics, which resulted in slight performance improvements in both cases. This indicates there is an underlying pattern to the neighbors of new topics common to research domains, likely beyond the sample topics used in the experiment. The result showed that network-based new topic prediction can be applied to various research domains with different research patterns.
1.Introduction
Scientific knowledge evolves through the contribution of researchers around the globe; discoveries are made to expand existing research topics or to contribute towards creation of new topics. Gradual expansion or transition of research topics based on the foundation of past knowledge guarantees validity and soundness of the research. This is amplified by the fact that researchers within a community can easily be unaware of research breakthroughs in other related fields [28]. Identifying and predicting emergence of new topics therefore depend on understanding a set of themes shared by related research communities, which are defined as the research topics. They can appear in various forms, including philosophical categories of research, theoretical developments of research models, applications of technology, and specific algorithms. Identifying such topics in academic publications is therefore a crucial part of research activity. Researchers understand topics by first reviewing a multitude of articles, internalizing topical evolution occurring within their fields of interest, which in turn allows them to ascertain the desirable paths current and future research can take. A better understanding of such knowledge allows more targeted research aimed at high demand topics, which is needed in both academic and industrial fields.
Traditional topic evolution methods mimic the process by utilizing text-based topic models to understand topics in each document collection and track topical changes over time. Topic modeling methods extract statistical constructs based on word co-occurrences in the given document collection, where changes in topics can only be measured by differences between the content of two topics; connections and correlations between different topics are not incorporated into traditional topic modeling methods [23]. Topic evolution methods are therefore mostly limited to identifying content transition within a given topic, not how it is correlated to other topics. Unforeseen topics in the future cannot be modeled without having access to a set of future documents yet to be written. As a result, topic evolution based on traditional topic modeling methods is not suited to predict new topics.
A previously proposed network-based approach identified emergence on topic networks where a topic is defined by its neighbors’ previous relationships. The approach required only past data, intuitively allowing extrapolations to future new topic predictions [19]. The definition allowed topics in a certain timeslot to be classified based only on structural properties available in previous timeslots, showcasing a novel functionality of predicting topic evolutions solely with topic co-occurrences using journal-specific publications as the dataset. This paper expands on this research by testing generalizability of the method, offering a better understanding of the network-based topic prediction method.
The goal of the proposed method is to capture emergence of new topics, which can be explained by their correlation to existing topics. This can be formalized as classifying subgraphs in the given topic network as to-be-neighbors of new topics in the future based on their graphical properties. The topic networks can be any pre-existing topic co-occurrence networks, or they can be built from open bibliographical datasets. Each network contains a set of research interests related to a designated domain-topic. Each network is divided yearly to generate an evolving network, where each topic in timeslot y is either new, appearing for the first time in y for a given topic network, or old. A binary machine learning algorithm is trained using neighbors of each node in the previous years, classifying the neighbor subgraphs in the past having new or old topics as their future neighbors. The semantics of publications, topics, and their relationships were not considered in this paper as the effectiveness of semantic-based processing is already proven within the research community. No textual metadata was used in the proposed method to isolate the effects of topic classification co-occurrences.
Twenty topic networks evolving over twenty years were generated from 1.8 million publications related to highly used fields-of-studies from the Microsoft Academic Graph11 dataset. The impact of different features and the number of features impactful to classification performances are analyzed. The topic co-occurrence patterns representing new topics in scientific bibliographic records are incrementally learned over time within a single dataset to capture domain-specific knowledge and their evolutions. The same process is then tested over different datasets to capture underlying common patterns throughout different domains. The experiment results showed that the proposed method retains its high classification accuracy with all 20 datasets with less than one-third of the 15 features while showing relatively small, but statistically significant, performance improvement using incremental learning.
Section 2 reviews the related work on topic evolution, previous attempts on the prediction of new topics, as well as background research for the proposed method. Sections 3 and 4 detail the proposed method and experimentation, and the experiment results are shown in Section 5.
2.Related work
2.1.Identifying the evolution of topics
Automatically identifying topical changes within the document set requires methods to extract machine-readable topics from the collection. Topic modeling provides a statistical approach to discover topics within a given corpus, where topics are modeled as the latent semantic structures in the form of word-popularity sets based on the statistical distribution and word co-occurrences.
Latent Dirichlet Allocation (LDA) [5] finds latent topics within a document collection and is one of the most widely used topic modeling methods on which many other methods are based [15,24]. Word-topic links are iteratively assigned with word co-occurrences between documents; topics, defined as word distributions over a corpus dictionary, are then assigned to each document [40]. LDA-based topic models have also been amalgamated with word embeddings to overcome the issue of large and heavy-tailed vocabulary sets [10], utilizing embedding similarities between words and topics to retain topic interpretability with a large corpus.
Topic evolution aims to identify the evolution of such topics in a sequentially ordered document collection. Document collection is first divided either uniformly or irregularly [14] into sequentially-ordered sub-collections on which topic models independent of the neighboring sub-collections are generated. Temporal topic models are then connected over time with similarity measures, and changes in the topics are sequentially analyzed to identify evolution of topics.
Dynamic topic models [4] are one of the early implementations of topic evolution, focusing on capturing changes within a set of chained topics with fixed timeslots where the Kalman filter and wavelet regression are used to approximate natural parameters of the topics found at different time slices. Evolutionary theme pattern mining has tried to capture not only changes within each topic but also sequential connections over multiple topics [26]. The Kullback–Leibler divergence is used as a distance metric between topics, and the topics on different timeslots are designated as having an evolutionary transition when their distance stays below dataset-specific thresholds. The collection of such evolutionary transitions results in detecting merge and split events over time as multiple connections are allowed between different topics. A similar approach is made by utilizing cross-citations between topic pairs’ member documents as well [18].
Topic evolution in conjunction with bibliographical dataset analysis has been tried by numerous researchers to better identify the topic evolution events. Citation contexts are used in an iterative topic evolution learning framework to increase performance of topic evolution with better topic models [16], where document collection is expanded by documents cited by its members. The inheritance topic model [11] is utilized to classify publications into autonomous parts with originalities and parts inherited from cited documents. Differentiating two parts allowed the method to overcome the topic dilution with cited publications, generating more new topics compared to LDA-based approaches.
A more recent approach to topic evolution utilizes communities of keywords in a dynamic co-occurrence network [2]. The medical subject headings dataset from PubMed22 was used to build a filtered co-occurrence network of major subjects within the medicine domain divided into five-year snapshots. Word clusters were found and linked to generate the evolution of topics over time. Topic evolution based on two-tier topic models is tried for a better merge and split detection, where topic correlations in the same timeslot are used to identify topic evolution [7]. Timeslot-specific local topics are extracted from yearly divided sub-collections of documents, while time-spanning global topics are retrieved using the whole corpus. Global topics stay static, having connected to dynamic local topics at each timeslot with cosine similarities above a given threshold. Changes in the number of local topics connected to global topics are then used to define the topic evolution events; decreased and increased numbers of local topics connected to a global topic respectively represent merging and splitting of the topic.
2.2.Identifying and predicting new topics
Topic Detection and Tracking (TDT) [12] aims to capture the appearances of new topics in continuously generated text data in real-time; a topic is defined as “a seminal event or activity along with all directly related events and activities” [12]. First story detection (FSD) is one of the parts of TDT research tasks. The goal of FSD is to search and organize new topics from multilingual news articles or identify the first article introducing the new story [1]. Topic-conditioned FSD with a supervised learning algorithm first classified news articles into a set of pre-defined topic categories before identifying novelty within each topic [38]. FSD is also used in conjunction with document clustering algorithms to identify the earliest report of a certain event in news articles [42].
Identification of emerging topic trends has led to the division of research front and intellectual base, where the latter is an established foundation of domain knowledge on which the former is built. The underlying assumption is that citation and co-citation between articles transfer existing knowledge from the intellectual base to the research front. The CiteSpace II [8] further utilized a keyword co-occurrence relationship by employing a bipartite graph of keywords and articles. Research front terms are identified by sharp frequency growth, and then used to identify research front articles, which in turn are absorbed into the intellectual base in the next time slice. Burst term detection, in conjunction with keyword co-word analysis, allows multi-dimensional exploration of the research front in question [25].
While these approaches allow detection of merging and splitting of time-spanning topics and their transitional ratio at the temporal level, the use of text-based topic models inherently limits predictive capabilities; evolutionary events such as emerge, merge, or split can only be retrospectively analyzed once topics are captured from a document set. Using author groups from a bibliographic dataset for determining topics carried over time by the evolving author groups showed that when topics defined by the authors are used instead of NLP-based topic models, topic evolution on the temporal network is possible; the topic evolution events are defined by network structures, and therefore a predictive analysis is possible [23].
On top of the emergence events detected by the appearance of topic models dissimilar to the ones in the previous timeslots, there are a number of research studies dedicated to identifying new topics with a varying definition of topic. One such field is new topic identification, where topics are defined as the entities the user is interested in during a search engine querying session; the query patterns and intervals between queries are used to identify topics [29]. A neural network (NN) is introduced to reduce the errors in new topic estimations based on misspells and typos by utilizing the character n-gram method to bypass spelling errors in the queries [13]. There are also several researches focusing on utilizing the queries’ statistical characteristics, such as search patterns, frequency of queries, and relative position in the querying sessions [30].
Technology forecasting [32] is another field of research aiming to predict the characteristics of technology in the future; the technology, or topic, is defined as a representative keyword instead of a statistical model. Various techniques from simple extrapolation to organization management [3] and fuzzy NLP [27] are used to identify and predict changes in technology indicators [6]. Multiple applications of the predictive topic evolution have been proposed. A semi-manual technology trend analysis was done to identify the roots of new technologies with their projected impact on the research field [36]. A semantically enhanced technology-topic model for interdisciplinary knowledge sharing was also proposed, integrating topic models and their similarities to calculate the likelihood of a technology being adapted to a specific research area without extensive presence in the field [28].
A previously proposed technology trend analysis approach with multiple data sources shows that while different data sources exhibit different forecast speeds, predicting the growth and shrinking in technology trends is possible extrapolating on a previously known technology growth curve [37]. A network-based approach was proposed to overcome the rigidity of trend-based forecasting where the prediction is dependent on the type and shape of the technology growth curve used. Node prediction based on preferential attachment link prediction is proposed to classify whether the nodes in citation networks have a connection to a new node in the future [21], labeling the new nodes by utilizing the metadata of their neighboring nodes [22]. This showed that predicting nodes in bibliographic networks is possible based on the structural properties of the network. More complex contexts of the new nodes in knowledge networks were extracted by identifying the neighbors of the new node in the past timeslot to formulate the context of the new node solely based on the metadata of its to-be-neighbors [20].
The predictive power of evolutionary topic networks is also validated through the use of community detection algorithms, where the Advanced Clique Percolation Method (ACPM) classification algorithm [34] was proposed to identify surging topic correlations. Topic clusters with notable recent collaborations are regarded as the ancestors of a novel topic at its embryonic stage [33], which are found on the semantic-enhanced topic evolutionary networks and represented with the core publications and author information.
Network-based topic emergence identification is an attempt to detect underlying patterns in networks for node emergence, providing a general foundation towards a more advanced topic evolution research. The proposed method is not tied to a specific clustering algorithm and hence is adaptable to new research contributions in the field without modifications, and tackles the scalability issue on large dense networks by focusing on node-wise calculations. The patterns are found solely using the topics and their relationships without accessing additional bibliographic data such as authoring or citations. The patterns are then used to automatically identify the early topic emergence with only topic network data, which are achieved by utilizing machine-learning approaches. The emergence of new topics was identified by capturing the relationships between their neighborhoods in the previous years, and predictions based on the existing clustering algorithms were made to validate the possibility of proactive topic emergence predictions with the proposed method. This paper aims to show the generalizability of the proposed method using various datasets with different focus and interests, capturing the shared knowledge between different domains with an incremental learning method to improve the performance.
3.Network-based new topic identification and prediction
3.1.Generating topic networks
NLP-based topic modeling can be used on the document collection dataset to retrospectively identify topics already present in the research field but has limited capability to prospectively predict the appearance of previously unused topics in the future without the documents to extract topics from. The proposed method utilizes a topic network instead, where new topics in a bibliographic dataset equate to new nodes in the topic network. Textual metadata is not considered for analysis, and only graphical structures are used.
The topic network
3.2.Extracting gold standards from the common neighbors
The proposed method aims to identify new topics, which are represented in the form of newly added nodes within topic network, using structural features to classify their projected common future neighbor. The nodes in the topic network
More prominent topics are likely to co-occur with more topics, and therefore the top 100 topics with the largest neighborhoods in
Evolution of existing topics such as merge and split is not targeted, and hence there is no need to train classifiers for the gradual evolution events within existing topics. Temporal features are therefore not analyzed; only static features are used in the experiment. Table 1 shows the list of 15 structural features of neighbor subgraphs used to train the binary classifiers. These features characterize the subgraph quality in several aspects and are grouped by components they are used to measure, including six properties related to the whole subgraphs, four average values of member node properties, two properties related to the edges, and three properties weighted by the topic co-occurrence frequencies.
Table 1
Structural features used in the experiment
| Category | Features used | Description |
| Subgraph | Node Count | Number of nodes |
| Cohesion | Number of internal/external edges | |
| Density | Number of observed/possible edges | |
| Transitivity | Number of observed/possible triangles | |
| Normalized Triangles | Number of triangles/nodes | |
| Mean Shortest Path | Mean of all node pairs’ shortest paths | |
| Nodes | Mean PageRank | Mean PageRank for subgraph nodes |
| Mean Degree Centrality | Mean degree centrality for subgraph nodes | |
| Mean Betweenness Centrality | Mean betweenness centrality for subgraph nodes | |
| Mean Node Age | Mean age for subgraph nodes | |
| Edges | Edge Count | Number of edges in the subgraph |
| Mean Degree | Mean degree in the subgraph | |
| Weighted | Mean Degree Weighted | Mean degree with edge weights |
| Mean Edge Weighted | Mean edge weights | |
| Mean Clustering Coefficient | Mean weighted clustering coefficient |
3.3.Classifying new topics with incremental learning
The emergence of new topics is the only event being searched; therefore the binary classification on year y is trained by neighbor subgraphs in previous years. Sets of open neighborhoods
The proposed method trains a machine learning algorithm to classify new topics within a domain by past interactions within their neighborhoods. Generalizability of the proposed method is analyzed by implementing an incremental learning approach, with the default proposed method as the baseline for performance comparison. The trained model is retained for each of the incremental learning processes instead of being re-initialized. Within-domain learning is done over incrementing y within each of the domains to incrementally adapt to continuous topical interactions over time. The number of trainings is calculated as the number of domains times number of years. Between-domain learning is done between domain pairs to test the possibilities of incremental learning between different domains. Long chains would result in an exponentially large number of trainings required; therefore, incremental training is only done at the same y with chain length of two, resulting in a total of
4.Experiments
4.1.Dataset preprocessing
Multiple topic networks were generated from bibliographic records extracted from the Microsoft Academic Graph (MAG) [41], which is a heterogeneous bibliographic dataset [39]. The MAG is selected as the source dataset for two reasons. Firstly, it was deemed competitive with major bibliographic search engines such as Google Scholar or Scopus, even with relatively recent creation [17]. Secondly, the MAG has a built-in ontology called fields-of-study (FoS) representing each publication with different hierarchical concepts [38]. A six-level hierarchy of concept (FoS) is generated each month using knowledge base type prediction with Wikipedia articles, employing graph link analysis and convolutional neural network methods. The publications are then tagged with the hierarchical concepts using a large-scale multi-level text classification method on pre-trained word embedding vectors. The tagging is done weekly to keep up-to-date concept assignments. Identifying dataset-wide topics in a large-scale dataset is by itself a huge task; therefore the tagged concepts are defined as the topics in this paper. While author-assigned keywords in research publications or semantic, ontological document topic assignments [35] often produce better quality topics, they are often domain specific and therefore were disregarded in this research to retain generalizability of the proposed method. High classification accuracy with the pre-defined topics would indicate the proposed method performs even when non-goal oriented and non-domain specialized topic sets were used.
The MAG dataset snapshot in February 2020 is downloaded for preprocessing through Microsoft Azure Databricks, containing 197,642,464 publications, 709,934 FoS, 48,829 journals, more than 1.5 billion citation links, and 1.3 billion publication-FoS links. Analyzing the whole graph would be too complex to compute, and therefore data subsets, or domains, are extracted as the bibliographic records related to selected FoS, or domain-topics. Each selected domain-topic represents the specific research fields that the extracted domain is focused on.
Topics with a similar degree of popularity were selected to be used as the domain-topics for domains to be represented by topic networks with adequate sizes. The size and activity of the domains are modulated by selecting domain-topic with 100,000 < related publication count < 120,000 and 1,000,000 < combined citation count < 1,500,000, counting duplicates for both. FoS without the main type data are filtered out to ensure that each dataset’s parent domain is known, selecting two FoS from each main type with the highest ranking. The selected domains also shared only a small ratio of common publications and other FoS between them. Out of possible 190 pairs, only three have shown more than 1% of publication overlap with 0.06% as an average: 3.04% for
A Dataset is generated for each domain-topic by extracting all related topics and their co-occurrences into the SQL databases, using a high-performance computing service by Alabama Supercomputer Authority33. The raw MAG dataset files contain two relevant tables called FieldsOfStudy and PaperFieldsOfStudy. The PaperFieldsOfStudy table contains FoS assignments to publications. All data rows in the table containing id (FieldOfStudyId) of the selected domain-topic are first retrieved to get all publications related to it. The table is then searched again to extract all FoS assigned to the retrieved publications. Finally, the extracted rows in the PaperFieldsOfStudy and matching FoS metadata in the FieldsOfStudy tables are retrieved to be used to generate topic networks in the experiment. The dataset is uploaded to a Zenodo repository44 for open access.
Table 2
Twenty FoS in the February 2020 MAG dataset used as the domain-topics
| Rank | DisplayName | MainType | Lv | # of papers | # of FoS | Avg. Paper overlap |
| 9863 | usability | business.industry | 2 | 93,762 | 36,859 | 0.03% |
| 9299 | software development | business.industry | 3 | 88,510 | 23,615 | 0.03% |
| 8335 | polysaccharide | chemistry.chemical_classification | 2 | 89,531 | 26,968 | 0.03% |
| 8494 | hydrogen peroxide | chemistry.chemical_compound | 2 | 98,278 | 28,533 | 0.14% |
| 8442 | ozone | chemistry.chemical_compound | 2 | 85,775 | 23,537 | 0.29% |
| 8868 | palladium | chemistry.chemical_element | 3 | 108,698 | 17,079 | 0.06% |
| 8480 | cadmium | chemistry.chemical_element | 3 | 86,220 | 28,369 | 0.05% |
| 9749 | diamond | engineering.material | 2 | 97,743 | 23,982 | 0.01% |
| 9216 | drainage basin | geography.geographical_feature_category | 2 | 97,829 | 24,308 | 0.01% |
| 9961 | calcination | law.invention | 3 | 100,643 | 14,192 | 0.06% |
| 8177 | fertility | media_common.quotation_subject | 3 | 94,294 | 28,185 | 0.02% |
| 9058 | unemployment | media_common.quotation_subject | 2 | 88,418 | 19,287 | 0.01% |
| 9964 | physical examination | medicine.diagnostic_test | 3 | 86,363 | 41,097 | 0.03% |
| 8153 | malaria | medicine.disease | 3 | 92,456 | 23,499 | 0.01% |
| 8349 | thrombosis | medicine.disease | 3 | 90,431 | 23,625 | 0.12% |
| 7579 | air pollution | medicine.disease_cause | 2 | 89,059 | 24,914 | 0.19% |
| 9171 | activated carbon | medicine.drug | 3 | 85,150 | 18,377 | 0.14% |
| 12641 | saline | medicine.medical_treatment | 3 | 92,560 | 40,057 | 0.03% |
| 9418 | stent | medicine.medical_treatment | 3 | 86,037 | 20,000 | 0.10% |
| 12338 | Gaussian | symbols.namesake | 2 | 97,147 | 32,848 | 0.01% |
4.2.Generating topic networks
After the dataset preprocessing is done, the topic network
4.3.Extracting gold standards from the common neighbors
Data downsampling is done on each dataset with
Training size t is set to 9 as the increase in classification performance diminishes with large t values. Initial experiments showed the Logistic Regression (LR) was one of the best performing algorithms without showing anomalous classification patterns over combinations of classification variables. The L-BFGS algorithm [43] is used as an optimization function for the ML model, with a maximum training iteration of 100.
4.4.Classifying new topics with incremental learning
Feature selection is done for all feature counts
Table 3
Descriptions of four score functions used in classification
| Score function | Description |
| f_classif | ANOVA F-value between labels |
| f_regression | F-value for univariate regression |
| mutual_info_classif | Estimated mutual information between labels |
| mutual_info_regression | Estimated mutual information for continuous target |
Incremental learning is implemented in two different ways, named after the function names they are based on. The warm approach retains the coefficients of the trained model which are used as initial coefficients in the subsequent training, while the partial approach incrementally trains the model with additional data. Sklearn Python library’s warm_start attribute and partial_fit function are used respectively. Both approaches have limitations; the warm approach risks overwriting the initial training result when there are major shifts in new training data, while the partial approach would suffer performance losses in such cases as it would try to search for the solution covering both datasets. These are compared against the non-incremental cold approach, where the training occurs within an individual dataset without retaining the result. This is used as a baseline to compare incremental learning results from both warm and partial approaches.
To analyze the possible differences between different classification algorithms, a linear support vector machine (SVM) algorithm is used in addition to the logistic regression used in the previous section. Different epoch values are tested to show the effect of epoch sizes. The partial_fit function only trains the model one generation at a time while the model with warm_start attribute is trained over multiple epochs; hence it is repeated epoch number of times to mimic the incremental learning with multiple epochs. The number of data rows affects the incremental learning performances; hence a different number of topics is also tested.
Within-domain learning is done over y from 2000 to 2019 for each domain, testing the incremental adaptation to the continuous topical interactions over time. Between-domain learning is done between each of the domain pairs at the same y, instead. This results in a total of 380 domain pairs used in the experiment; only
5.Results
5.1.Classifying new topics within each domain
The classification results were measured excluding
The model successfully captured the formation of new topics in various fields. A few cases were manually found in the year 2010 to showcase the examples of new topics. Application of polysaccharide (domain) as the skin barrier (new topic) agent was supported by topics such as nanotechnology, green algae, human growth hormone, and materials science (neighboring topics). Application of being used as metamaterial (new topic) was shown for diamond (domain) in the form of aqueous solution or nanocomposite, with possible invisibility using its photoluminescence properties (neighboring topics). Sometimes, topics with contrasting interests are joined to produce new topics. In the ozone (domain) topic network, enhanced coal bed methane recovery (new topic) became known as topics such as casing string and petroleum engineering were used with waste management and environmental science (neighboring topics).
Table 4
Summary of new topic classification results, using standardized data and original data during the training
| Data used | Standardized | Original |
| Acc | 0.9287 | 0.9240 |
| AUC | 0.9815 | 0.9792 |
| F1 | 0.9287 | 0.9243 |
| Precision | 0.9522 | 0.9452 |
| Recall | 0.9114 | 0.9098 |
The classification performance for all 20 datasets showed slightly higher performance compared to the result based on journals in the previous research which had an average accuracy of 0.9053 and average AUC score of 0.9809 [19]. Table 4 shows that the same holds even when the original data without standardization are used during training. This shows that the proposed method is capable of generating highly accurate results with bibliographic datasets built with different criteria and the performance improves when datasets with more focused research interest are used.
Table 5
Average
| Dependent variable | Greedy | Fluid |
| NewTopicCount | 0.0363 | 0.4757 |
| NewTopicFreq | 0.0353 | 0.4777 |
| AncestorCount | 0.1775 | 0.5421 |
| AncestorRatio | 0.0270 | 0.0243 |
Linear regression analysis was done on communities found with clustering algorithms to analyze the differences between the existing and the proposed method. One-to-one connections between the sub-graphs and new topics are not guaranteed; hence predictions were done for the following properties: the number of new topics connected to each community (NewTopicCount), the frequency of connection to the new topics (NewTopicFreq), the number of direct ancestors (AncestorCount), and the ratio between the ancestors and the community members (AncestorRatio). Table 5 shows the result for two clustering algorithms with low scalability problems: an unweighted variant of the Clauset–Newman–Moore algorithm maximizing the modularity of clusters (Greedy) [9] and a density-stable propagation mimicking the fluid interactions (Fluid) [31]. The modularity-based Greedy algorithm was unable to find an adequate number of communities in densely connected topic networks and resulted in a very poor result. The Fluid algorithm was able to predict the number of new topics and their ancestors with more precision, but its scores were not high enough to be comparable with the proposed method’s accuracy of over 0.9.
Fig. 1.
Binary classification accuracy of logistic regression with
![Binary classification accuracy of logistic regression with y=[2000,2019] over 20 domains.](https://ip.ios.semcs.net:443/media/sw/2022/13-3/sw-13-3-sw212951/sw-13-sw212951-g001.jpg)
The overall performance metrics do not show significant changes in the trend over the years. Accuracy, AUC, and F1 in Fig. 1 all share the same pattern over the years, with AUC having a higher average. The sudden drop in
The precision and recall intersect around
Table 6
Changes in the average TP, FP, FN, precision, and recall of the classification results before and after
| Year | TP | FP | FN | Precision | Recall |
| <2016 | 91.21 | 7.27 | 8.79 | 0.9588 | 0.9028 |
| 2016 | 95.13 | 11.25 | 4.87 | 0.9371 | 0.9480 |
| >2016 | 89.04 | 12.75 | 4.98 | 0.9221 | 0.9450 |
Experimenting on a different number of features showed that four feature selection functions are statistically similar. ANOVA test was run on the Acc, AUC, precision, recall, and F1 of the classification results with
Fig. 2.
Changes in the F1 of the classification results using mutual_info_classif as the scoring function with
![Changes in the F1 of the classification results using mutual_info_classif as the scoring function with f=[1,…,15] in the x-axis, with the results of classifications using the excluded features shown in the second y-axis.](https://ip.ios.semcs.net:443/media/sw/2022/13-3/sw-13-3-sw212951/sw-13-sw212951-g002.jpg)
Figure 2 shows the performance changes with varying number of features selected f as bars, while training done on the features excluded by the feature selection process are shown as an line. The number of features used during the training improves the classification performance by a small margin while providing F1 over 0.91 using only one feature. The most significant features are Mean PageRank and Node Count, which were selected for 49% and 50.5% of the 400 classification runs in the experiment. These two features were selected for runs with
The classification results also showed that the result is not dependent on the features. F1 remained at 0.9289 with using only one feature during the training, and F1 only reaches below 0.9 when 9 out of 15 most significant features were excluded during the training. This indicates that majority of the topic subgraph features are closely correlated to the emergence of a new topic among them, and significant dimension reduction can be done without performance loss.
The PCA results also indicate the possibility of dimension reduction; with 2-dimensional PCA on all 15 features, the first component was able to explain 49.25% of the result while 27.19% were explained by the second component alone. PCA results of all 20 domains showed more horizontal separations with the first component as the x-axis, with ten randomly selected topics from various fields shown in Fig. 3 where each topic is shaded by its classification result. Clusters of binary labels can be seen in all ten scatterplots. 23.56% of the result remains unexplained by either component, which is likely due to the inclusion of the features with weaker classification strengths. This is shown by the PCA results in Table 7 with feature selections, where lower f results in more variance explanations.
Fig. 3.
Ten sample visualizations for the 2-dimensional PCA results with
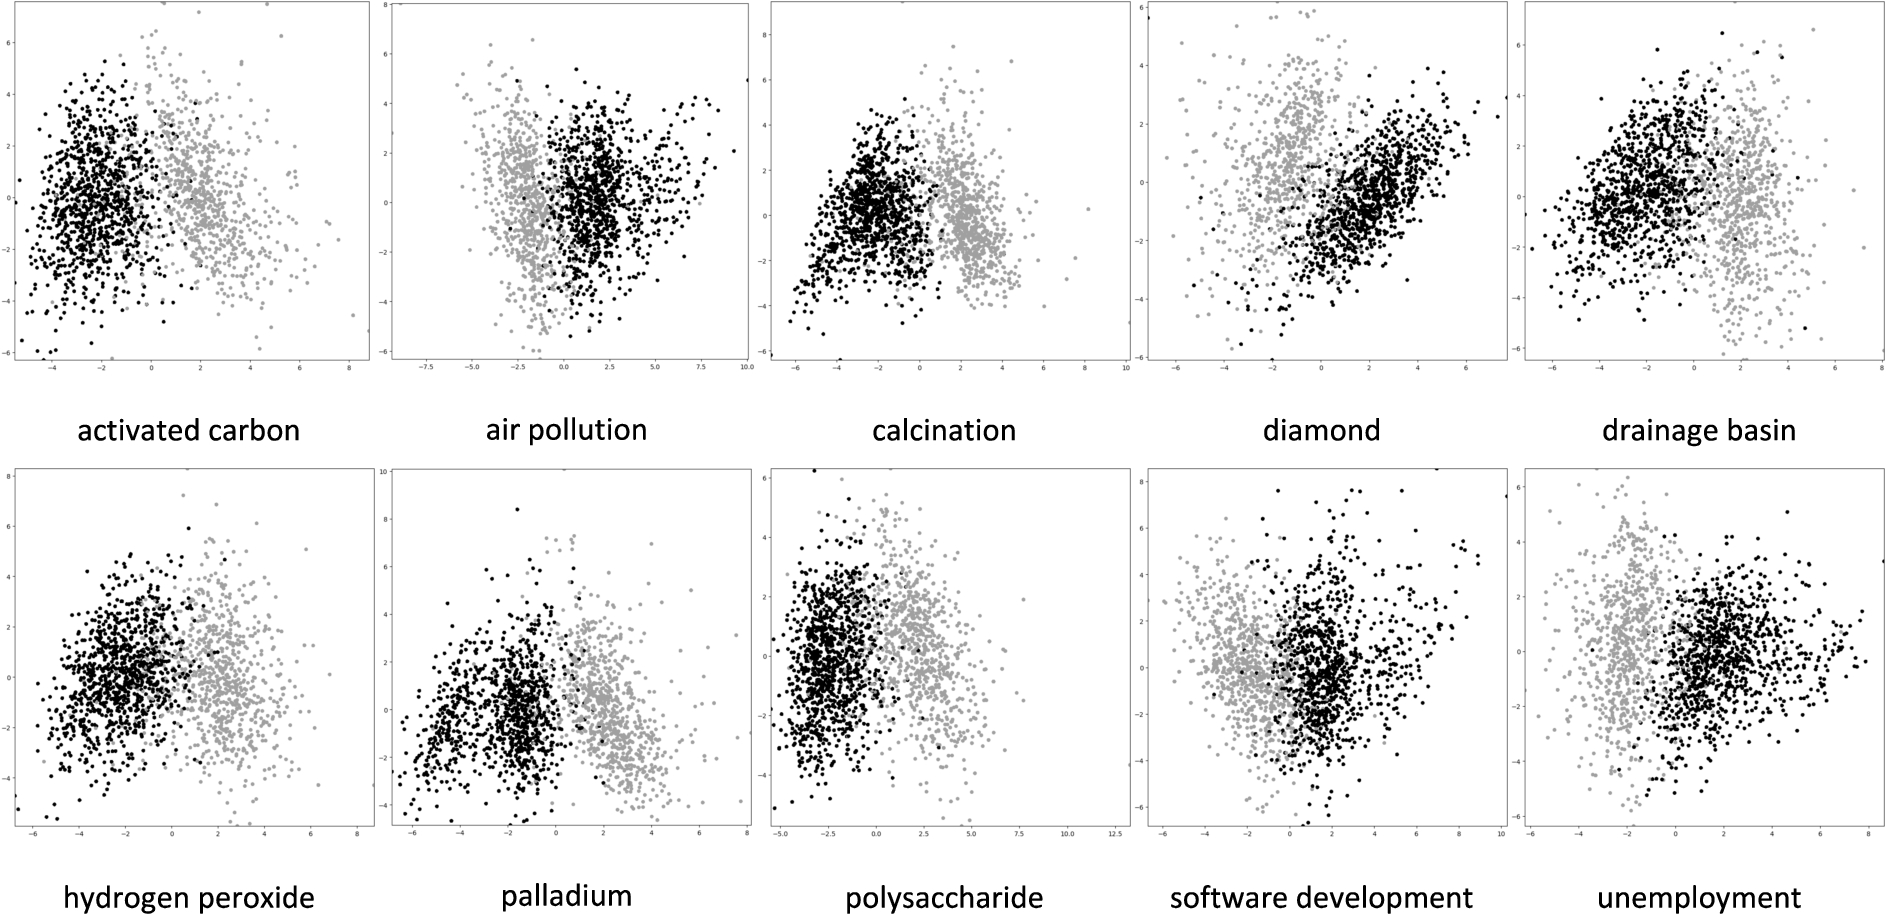
Table 7
Ratio of variance explained by 2-dimensional PCA with different f selected using mutual_info_classif
| f | 5 | 10 | 15 |
| Explained by 1st component | 0.8696 | 0.6613 | 0.4925 |
| Explained by 2nd component | 0.0742 | 0.2104 | 0.2719 |
| Variance Unexplained | 0.0562 | 0.1283 | 0.2356 |
5.2.Classifying new topics with incremental learning
Fig. 4.
F1 of classification results for within-domain incremental learning over the years.
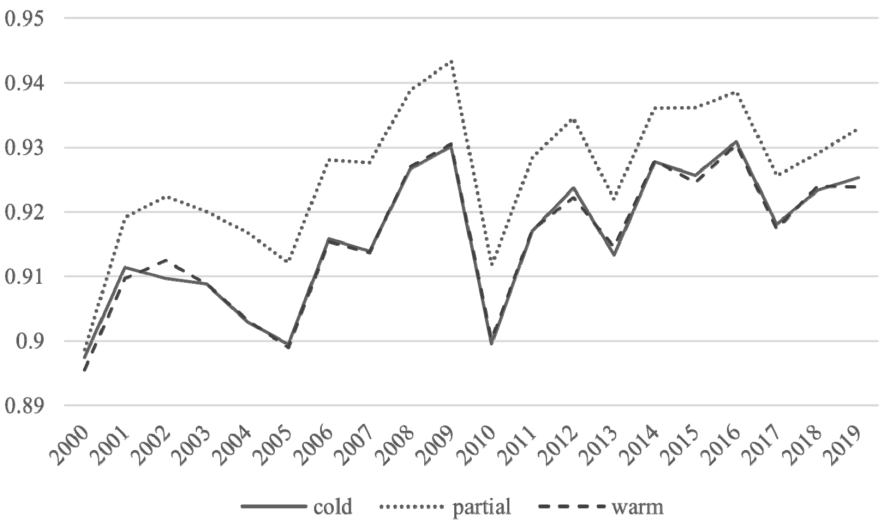
Figure 4 shows that one of the within-domain incremental learning models resulted in consistently better results compared to the baseline cold approach with the LR algorithm, where the model is re-initialized each year. The partial approach resulted in an average of 0.0101 higher F1, showing that there is a temporal consistency over the topic networks for new topic identification. The performance gain increases rapidly during the first 2 years of incremental learning from 0.0078 in
The warm approach showed very similar results to the cold approach, on the other hand. No apparent performance increase can be attributed to the evolving nature of topic networks; the connections between predefined topic subsets change every year. The initial training results were overwritten when the ML model is re-trained with such datasets with major shifts, losing any previous training in the process. Using SVM instead of LR resulted in the same outcome, with partial with 0.0114 higher F1 and warm showing similar values to the baseline, showing statistically insignificant differences for other metrics as well, as shown in Table 8. The warm approach is statistically identical to the non-incremental learning and hence was removed from further analysis.
Table 8
P-values between within-domain incremental learning approach and the baseline
| LR | SVM | |||
| Pairs | Cold/Partial | Cold/Warm | Cold/Partial | Cold/Warm |
| F1 | 1.76E-09 | 6.92E-01 | 2.37E-11 | 7.37E-01 |
| Acc | 2.76E-08 | 6.84E-01 | 5.98E-09 | 7.11E-01 |
| Precision | 1.80E-05 | 7.43E-01 | 7.46E-10 | 7.44E-01 |
| Recall | 3.02E-02 | 7.09E-01 | 9.56E-03 | 6.50E-01 |
Fig. 5.
Changes in the F1 between partial and cold for different combinations of epochs and num_topics with the averaged F1 for partial as the bar graph in the second axis.
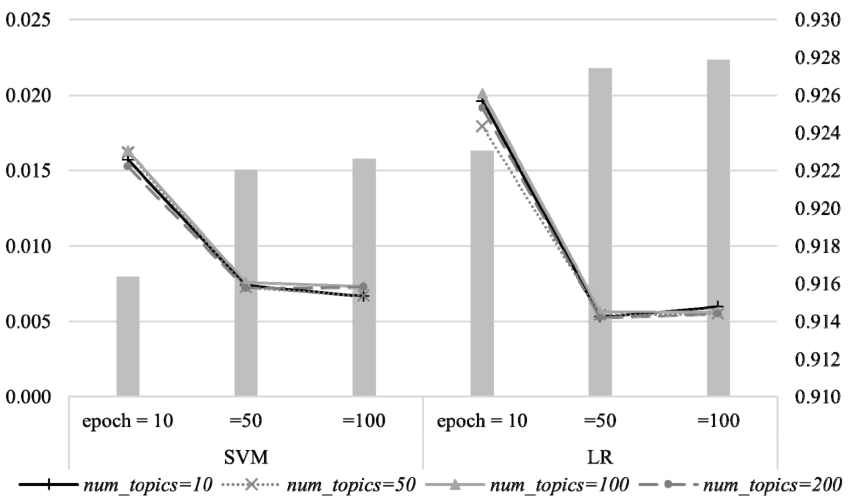
Analysis of the different combinations of epochs and num_topics in Eq. (5) showed the incremental learning can be done with sample sizes smaller than 200. num_topics as low as 10 resulted in similar performance improvements with 5 true and 5 false data rows with both classification algorithms as shown by Fig. 5, indicating the method can be used even with domains with sparse topic correlations. The differences were more pronounced with smaller epochs, showing higher improvement with lower epochs. This can be attributed to the fact that inadequately trained models have more performance enhancement available to them. More epochs resulted in higher absolute performance scores including accuracies and F1, indicating it is still beneficial to train with a larger number of epochs.
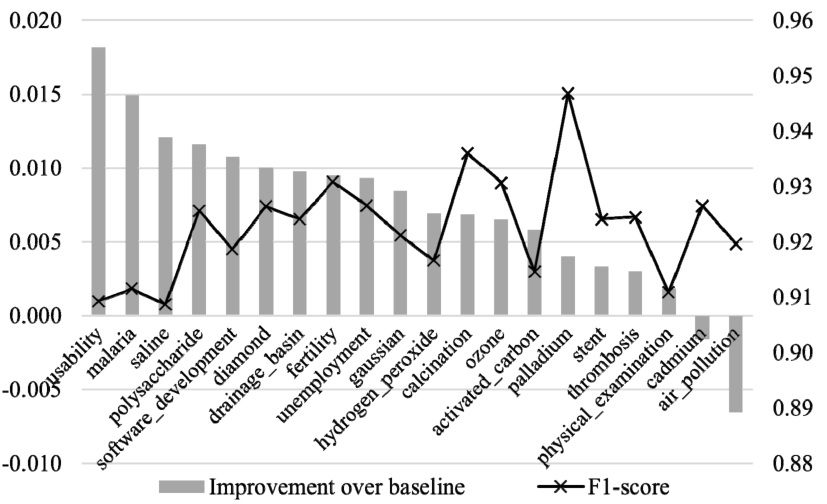
Different domains resulted in different incremental learning performances. Figure 6 and Fig. 7 show the relative F1 improvement of partial approach using
Fig. 6.
F1 improvements over the cold baseline for individual domains trained using LR, with F1 in the second axis.
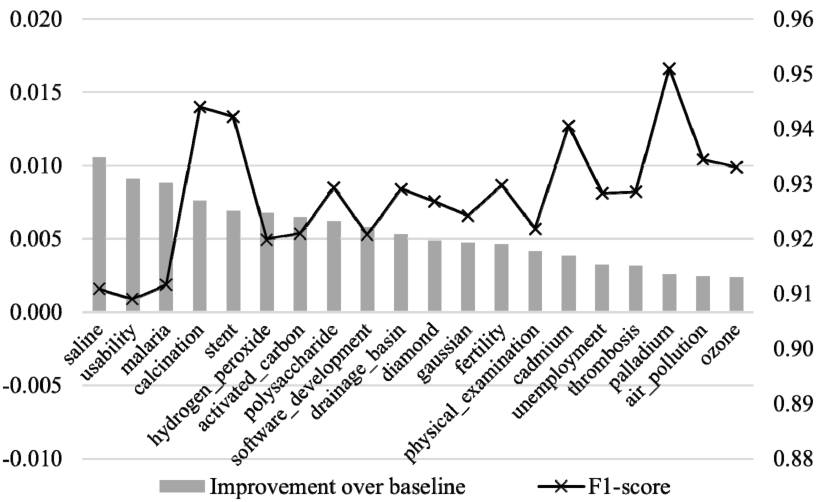
Fig. 7.
F1 improvements over the cold baseline for individual domains trained using SVM, with F1 in the second axis.
The between-domain showed that incremental learning can be done over different topics as well. F1 differences in Table 9 show the performance gain from between-domain learning is smaller than that of within-domain learning, with one negative value for 48 of the experiment iterations. The performance improvement is also not as statistically significant because of the larger variance in F1 between 380 domain pairs. The t-test for between domain F1 results showed an average p-value of 0.6623 for all experiment iterations with baseline cold approach (
Table 9
Differences in F1 of between-domain incremental learning approach and the baseline
| Within the same MainType | Between different MainTypes | ||||||||
| Alg | Epochs | ||||||||
| SVM | 10 | 0.0018 | 0.0033 | 0.0022 | 0.0006 | 0.0055 | 0.0003 | 0.0017 | 0.0028 |
| 50 | 0.0023 | 0.0026 | 0.0012 | 0.0018 | 0.0029 | 0.0013 | 0.0000 | 0.0027 | |
| 100 | 0.0054 | 0.0037 | 0.0035 | 0.0039 | 0.0059 | 0.0027 | 0.0029 | 0.0057 | |
| LR | 10 | 0.0047 | 0.0041 | 0.0016 | 0.0028 | 0.0029 | 0.0105 | 0.0011 | −0.0006 |
| 50 | 0.0037 | 0.0030 | 0.0028 | 0.0020 | 0.0040 | 0.0029 | 0.0038 | 0.0012 | |
| 100 | 0.0058 | 0.0052 | 0.0046 | 0.0025 | 0.0020 | 0.0045 | 0.0035 | 0.0031 | |
The statistical significance diminished with larger epochs, with
5.3.Limitations of the proposed approach
The fields of study are retrospectively updated within the MAG dataset and therefore are prone to be identified after the fact. This leads to a small portion of topics seemingly appearing far earlier than they did in the actual research communities due to some archaic publications. The pan-domain topic assignment tends to result in less domain-specific topics to be found as well, resulting in poor performances on time-sensitive topics. Quality of the emerging topics such as expected popularity and lifespan are not measured hence outlier topics are not distinguished from genuine topics that are introduced to the field.
6.Conclusion
Topic models derived from processing unstructured documents can capture the number of topics shared throughout a given document collection and can be used to detect and track changes in such topics over time. The text-based approaches however have an innate limitation of requiring textual data for modeling topics, inhibiting the effective prediction of topic evolutions where such data are nonexistent. The network-based topic emergence identification is an alternative approach utilizing the network structure to model topics, validating the assumption that new topics can be distinguished by the structural properties of their neighborhoods in the past with classification accuracy up to 0.9.
Binary classification on 20 domains showed that the proposed method can be applied to bibliographic datasets representing a specific subset of the domains. The proposed method performed better on topic-specific publications compared to the publications with varying topics of interest. The proposed method is independent of the dataset, and scheduled retirement of the MAG at the end of 2021 would not affect this approach. Topic assignment to document is a well-studied field, and the method can be applied to any form of dataset containing topic-assigned publications. Series of feature selections showed that the proposed method retained F1 over 0.9 with only 6 features; the majority of 15 topic subgraph features were found to be closely correlated to the emergence of a new topic within them. Analysis of temporal changes in the classification results showed an underlying topic co-occurrence pattern across diverse research domains; the neighborhoods of existing topics become more structurally similar to those of new topics in more recent years.
Incremental learning is shown to positively affect results of the proposed method. Consistent performance improvements were observed for incremental learning within each of the 20 domains over time, showing the method can adapt to various domains, such as business, chemistry, law, and medicine. Iterations of the experiment also revealed that the proposed method can be used even with sparsely correlated domains, retaining similar performance and performance improvements with 10 data instances. The knowledge between different datasets was also found to be transferable with incremental learning between different datasets, albeit to a smaller degree. The common knowledge spanning across different research domains was captured in the early stages of the training, resulting in significant performance improvements only with a smaller number of epochs run during the training.
Future work will include the validation of the method’s generalizability with incremental learning results. The gradual shifts in structural patterns over time can be captured to add explainability to the results, and underlying common structural properties of new topics’ neighborhoods will be identified to be incorporated into the prospective new topic prediction, along with the feature selection results. Different definitions of new topics will be used to test if the proposed method works with not only any novel topics but also long-lasting topics or topics with rapid growth. A set of approaches will be made to generate likely neighborhood candidates for the new topic in the future, including community detections and deep neural network optimizations conscious of the properties correlated to the new topic prediction. Amalgamation with semantic detection methods would allow a more accurately tagged document set, resulting in a higher quality topic network generation
Notes
5 200 for between-domain.
References
[1] | J. Allan, J.G. Carbonell, G. Doddington, J. Yamron and Y. Yang, Topic Detection and Tracking Pilot Study Final Report, (1998) . doi:10.1184/R1/6626252.v1. |
[2] | C. Balili, A. Segev and U. Lee, Tracking and predicting the evolution of research topics in scientific literature, in: 2017 IEEE International Conference on Big Data (Big Data), (2017) , pp. 1694–1697. doi:10.1109/BigData.2017.8258108. |
[3] | C. Battistella, The organisation of Corporate Foresight: A multiple case study in the telecommunication industry, Technological Forecasting and Social Change. 87: ((2014) ), 60–79. doi:10.1016/j.techfore.2013.10.022. |
[4] | D.M. Blei and J.D. Lafferty, Dynamic topic models, in: Proceedings of the 23rd International Conference on Machine Learning, ACM, New York, NY, USA, (2006) , pp. 113–120. doi:10.1145/1143844.1143859. |
[5] | D.M. Blei, A.Y. Ng and M.I. Jordan, Latent Dirichlet allocation, J. Mach. Learn. Res. 3: ((2003) ), 993–1022. |
[6] | A. Bongers and J.L. Torres, Measuring technological trends: A comparison between U.S. and U.S.S.R./Russian jet fighter aircraft, Technological Forecasting and Social Change. 87: ((2014) ), 125–134. doi:10.1016/j.techfore.2013.12.007. |
[7] | B. Chen, S. Tsutsui, Y. Ding and F. Ma, Understanding the topic evolution in a scientific domain: An exploratory study for the field of information retrieval, Journal of Informetrics. 11: ((2017) ), 1175–1189. doi:10.1016/j.joi.2017.10.003. |
[8] | C. Chen, CiteSpace II: Detecting and visualizing emerging trends and transient patterns in scientific literature, Journal of the American Society for Information Science and Technology. 57: ((2006) ), 359–377. doi:10.1002/asi.20317. |
[9] | A. Clauset, M.E.J. Newman and C. Moore, Finding community structure in very large networks, Phys. Rev. E. 70: ((2004) ), 066111. doi:10.1103/PhysRevE.70.066111. |
[10] | A.B. Dieng, F.J.R. Ruiz and D.M. Blei, Topic modeling in embedding spaces, Transactions of the Association for Computational Linguistics. 8: ((2020) ), 439–453. doi:10.1162/tacl_a_00325. |
[11] | L. Dietz, S. Bickel and T. Scheffer, Unsupervised prediction of citation influences, in: Proceedings of the 24th International Conference on Machine Learning, ACM, New York, NY, USA, (2007) , pp. 233–240. doi:10.1145/1273496.1273526. |
[12] | J.G. Fiscus and G.R. Doddington, Topic detection and tracking evaluation overview, in: Topic Detection and Tracking, Springer, Boston, MA, (2002) , pp. 17–31. doi:10.1007/978-1-4615-0933-2_2. |
[13] | B.C. Gencosman, H.C. Ozmutlu and S. Ozmutlu, Character n-gram application for automatic new topic identification, Information Processing & Management. 50: ((2014) ), 821–856. doi:10.1016/j.ipm.2014.06.005. |
[14] | A. Gohr, A. Hinneburg, R. Schult and M. Spiliopoulou, Topic evolution in a stream of documents, in: Proceedings of the 2009 SIAM International Conference on Data Mining, Society for Industrial and Applied Mathematics, (2009) , pp. 859–870. doi:10.1137/1.9781611972795.74. |
[15] | Z. Guo, Z.M. Zhang, S. Zhu, Y. Chi and Y. Gong, A two-level topic model towards knowledge discovery from citation networks, IEEE Transactions on Knowledge and Data Engineering. 26: ((2014) ), 780–794. doi:10.1109/TKDE.2013.56. |
[16] | Q. He, B. Chen, J. Pei, B. Qiu, P. Mitra and L. Giles, Detecting topic evolution in scientific literature: How can citations help?, in: Proceedings of the 18th ACM Conference on Information and Knowledge Management, ACM, New York, NY, USA, (2009) , pp. 957–966. doi:10.1145/1645953.1646076. |
[17] | S.E. Hug, M. Ochsner and M.P. Brändle, Citation Analysis with Microsoft Academic, Scientometrics. 111: ((2017) ), 371–378. doi:10.1007/s11192-017-2247-8. |
[18] | Y. Jo, J.E. Hopcroft and C. Lagoze, The web of topics: Discovering the topology of topic evolution in a corpus, in: Proceedings of the 20th International Conference on World Wide Web, ACM, New York, NY, USA, (2011) , pp. 257–266. doi:10.1145/1963405.1963444. |
[19] | S. Jung, R. Datta and A. Segev, Identification and prediction of emerging topics through their relationships to existing topics, in: 2020 IEEE International Conference on Big Data (Big Data), (2020) , pp. 5078–5087. doi:10.1109/BigData50022.2020.9378277. |
[20] | S. Jung, T.M. Lai and A. Segev, Analyzing future nodes in a knowledge network, in: 2016 IEEE International Congress on Big Data (BigData Congress), (2016) , pp. 357–360. doi:10.1109/BigDataCongress.2016.57. |
[21] | S. Jung and A. Segev, Analyzing future communities in growing citation networks, in: Proceedings of ACM International Conference on Information and Knowledge Management (CIKM 2013) International Workshop on Mining Unstructured Big Data Using Natural Language Processing, ACM, New York, NY, USA, (2013) , pp. 15–22. doi:10.1145/2513549.2513553. |
[22] | S. Jung and A. Segev, Analyzing future communities in growing citation networks, Knowledge-Based Systems. 69: ((2014) ), 34–44. doi:10.1016/j.knosys.2014.04.036. |
[23] | S. Jung and W.C. Yoon, An alternative topic model based on common interest authors for topic evolution analysis, Journal of Informetrics. 14: ((2020) ), 101040. doi:10.1016/j.joi.2020.101040. |
[24] | L. Kay, N. Newman, J. Youtie, A.L. Porter and I. Rafols, Patent overlay mapping: Visualizing technological distance, J Assn Inf Sci Tec. 65: ((2014) ), 2432–2443. doi:10.1002/asi.23146. |
[25] | M. Li and Y. Chu, Explore the research front of a specific research theme based on a novel technique of enhanced co-word analysis, Journal of Information Science. 43: ((2017) ), 725–741. doi:10.1177/0165551516661914. |
[26] | Q. Mei and C. Zhai, Discovering evolutionary theme patterns from text: An exploration of temporal text mining, in: Proceedings of the Eleventh ACM SIGKDD International Conference on Knowledge Discovery in Data Mining, ACM, New York, NY, USA, (2005) , pp. 198–207. doi:10.1145/1081870.1081895. |
[27] | N.C. Newman, A.L. Porter, D. Newman, C.C. Trumbach and S.D. Bolan, Comparing methods to extract technical content for technological intelligence, Journal of Engineering and Technology Management. 32: ((2014) ), 97–109. doi:10.1016/j.jengtecman.2013.09.001. |
[28] | F. Osborne, A. Mannocci and E. Motta, Forecasting the spreading of technologies in research communities, in: Proceedings of the Knowledge Capture Conference, Association for Computing Machinery, New York, NY, USA, (2017) , pp. 1–8. doi:10.1145/3148011.3148030. |
[29] | H.C. Ozmutlu and F. Çavdur, Application of automatic topic identification on Excite Web search engine data logs, Information Processing & Management. 41: ((2005) ), 1243–1262. doi:10.1016/j.ipm.2004.04.018. |
[30] | S. Ozmutlu, Automatic new topic identification using multiple linear regression, Information Processing & Management. 42: ((2006) ), 934–950. doi:10.1016/j.ipm.2005.10.002. |
[31] | F. Parés, D.G. Gasulla, A. Vilalta, J. Moreno, E. Ayguadé, J. Labarta, U. Cortés and T. Suzumura, Fluid communities: A competitive, in: Scalable and Diverse Community Detection Algorithm, C. Cherifi, H. Cherifi, M. Karsai and M. Musolesi, eds, Complex Networks & Their Applications VI, Springer International Publishing, Cham, (2018) , pp. 229–240. doi:10.1007/978-3-319-72150-7_19. |
[32] | A.L. Porter and M.J. Detampel, Technology opportunities analysis, Technological Forecasting and Social Change. 49: ((1995) ), 237–255. doi:10.1016/0040-1625(95)00022-3. |
[33] | A.A. Salatino, F. Osborne and E. Motta, How are topics born? Understanding the research dynamics preceding the emergence of new areas, PeerJ Comput. Sci. 3: ((2017) ), e119. doi:10.7717/peerj-cs.119. |
[34] | A.A. Salatino, F. Osborne and E. Motta, AUGUR: Forecasting the emergence of new research topics, in: Proceedings of the 18th ACM/IEEE on Joint Conference on Digital Libraries, Association for Computing Machinery, New York, NY, USA, (2018) , pp. 303–312. doi:10.1145/3197026.3197052. |
[35] | A.A. Salatino, F. Osborne, T. Thanapalasingam and E. Motta, The CSO classifier: Ontology-driven detection of research topics in scholarly articles, in: Digital Libraries for Open Knowledge, A. Doucet, A. Isaac, K. Golub, T. Aalberg and A. Jatowt, eds, Springer International Publishing, Cham, (2019) , pp. 296–311. doi:10.1007/978-3-030-30760-8_26. |
[36] | A. Segev, C. Jung and S. Jung, Analysis of technology trends based on big data, in: 2013 IEEE International Congress on Big Data (BigData Congress), (2013) , pp. 419–420. doi:10.1109/BigData.Congress.2013.65. |
[37] | A. Segev, S. Jung and S. Choi, Analysis of technology trends based on diverse data sources, IEEE Transactions on Services Computing. 2015: (8) ((2015) ), 903–915. doi:10.1109/TSC.2014.2338855. |
[38] | Z. Shen, H. Ma and K. Wang, A Web-scale system for scientific knowledge exploration, 2018, http://arxiv.org/abs/1805.12216. |
[39] | A. Sinha, Z. Shen, Y. Song, H. Ma, D. Eide, B.-J. (Paul) Hsu and K. Wang, An overview of Microsoft academic service (MAS) and applications, in: Proceedings of the 24th International Conference on World Wide Web, Association for Computing Machinery, Florence, Italy, (2015) , pp. 243–246. doi:10.1145/2740908.2742839. |
[40] | M. Steyvers and T. Griffiths, Probabilistic topic models, in: Handbook of Latent Semantic Analysis, Lawrence Erlbaum Associates Publishers, Mahwah, NJ, US, (2007) , pp. 427–448. |
[41] | K. Wang, Z. Shen, C. Huang, C.-H. Wu, D. Eide, Y. Dong, J. Qian, A. Kanakia, A. Chen and R. Rogahn, A review of Microsoft academic services for science of science studies, Front. Big Data. 2: ((2019) ). doi:10.3389/fdata.2019.00045. |
[42] | J. Zhang, Z. Ghahramani and Y. Yang, A probabilistic model for online document clustering with application to novelty detection, in: Proceedings of the 17th International Conference on Neural Information Processing Systems, MIT Press, Vancouver, British Columbia, Canada, (2004) , pp. 1617–1624. |
[43] | C. Zhu, R.H. Byrd, P. Lu and J. Nocedal, Algorithm 778: L-BFGS-B: Fortran subroutines for large-scale bound-constrained optimization, ACM Trans. Math. Softw. 23: ((1997) ), 550–560. doi:10.1145/279232.279236. |


