
Pioneering easy-to-use forestry data with Forest Explorer
Abstract
Forest Explorer is a web tool that can be used to easily browse the contents of the Cross-Forest dataset, a Linked Open Data resource containing the forestry inventory and land cover map from Spain. The tool is purposed for domain experts and lay users to facilitate the exploration of forestry data. Since these two groups are not knowledgable on Semantic Web, the user interface is designed to hide the complexity of RDF, OWL or SPARQL. An interactive map is provided for this purpose, allowing users to navigate to the area of interest and presenting forestry data with different levels of detail according to the zoom level. Forest Explorer offers different filter controls and is localized to English and Spanish. All the data is retrieved from the Cross-Forest and DBpedia endpoints through the Data manager. This component feeds the different Feature managers with the data needed to be displayed in the map. The Data manager uses a reduced set of SPARQL templates to accommodate any data request of the Feature managers. Caching and smart geographic querying are employed to limit data exchanges with the endpoint. A live version of the tool is freely available for everybody that wants to try it – any device with a modern browser should be sufficient to test it. Since December 2019, more than 3,200 users have employed Forest Explorer and it has appeared 12 times in the Spanish media. Results from a user study with 28 participants (mainly domain experts) show that Forest Explorer can be used to easily navigate the contents of the Cross-Forest dataset. No important limitations were found, only feature requests such as the integration of new datasets from other countries that are part of our future work.
1.Introduction
Forest science and forestry rely on the use of large-scale datasets that cover lengthy periods of time [21]. This is because trees are long-lived organisms that require continuous monitoring to obtain sound and accurate information. Similarly, large-scale monitoring systems are used to capture the complexity and structure of forests in their full extend. Permanent and extensive data recording systems, particularly land cover maps and forest inventories [31], are needed to implement sound sustainable forest management [3,24,25] to ensure a constant flow of ecosystem services such as habitat conservation and raw materials (timber, resin, cork…).
Due to long-term scale of forestry actions, the private sector has no incentives to conduct this type of data collection and curation. As a result, the public sector is the main responsible for monitoring forests and providing this information to society. Such information is consumed for different purposes by diverse end users, including forest stakeholders (governments at different levels, environmental NGOs and other lobby groups), operational foresters, data and environmental journalists, interested citizens, and start-up promoters.
However, exploiting forest inventories and land cover maps is a non-trivial task that requires both domain expertise and technical skills. Forestry datasets are typically isolated, described with disparate data schemas, and using unfamiliar (sometimes even proprietary) formats. Given these limitations, Linked Open Data and Semantic Web technologies can help to facilitate the integration and accessibility of forestry data. Towards this goal, the EU project Cross-Forest11 publishes as Linked Open Data a set of national forestry data sources from Spain – the Cross-Forest dataset from now on. This resource has been released through the creation of a suite of ontologies to represent forestry data, the transformation of their forest inventories and land cover datasets, and the connection among them and with relevant external datasets.
The Cross-Forest dataset is available as Linked Data through the SPARQL endpoint at https://forestexplorer.gsic.uva.es/sparql/. This dataset is a complex resource that integrates spatial features corresponding to plots, trees, and land cover patches. Target users from the forestry domain need to explore and analyze this dataset in order to fulfill their goals. This is especially challenging as this user group is not fluent in Semantic Web languages. While there are some Linked Data browsers for lay users [8,9,14], most of them have limited support for geospatial data. Moreover, visualization tools of geospatial Linked Data are very scarce and typically require knowledge of SPARQL, e.g. Sextant [18].
In this paper we present Forest Explorer, a web tool for easily accessing the contents of the Cross-Forest dataset. Forest Explorer is designed for non-Semantic Web experts, so the user interface is based on an interactive map that completely hides the manipulation of RDF data and exchange of SPARQL queries behind the scenes. The rest of the paper is organized as follows: Section 2 reviews exploration tools of geospatial Linked Data, as well as existing approaches for visualizing forestry data. Section 3 presents the functional requirements of Forest Explorer. Section 4 describes the design and implementation of the tool. In Section 5 we give evidence of the impact of Forest Explorer, including the results of a user study. The paper ends with a discussion and future work lines in Section 6.
2.Background
Since the earlier years of the Semantic Web, the challenge of exploring RDF data was evident [13]. Preliminary projects in this area were targeted to either Semantic Web experts or technology enthusiasts willing to put in the time to learn. More recent works [9] have stressed the importance of supporting both lay users and domain experts, e.g forest managers. Such users may not have any knowledge of SPARQL, OWL, or RDF and require appropriate tools to work with Linked Open Data.
There are some Linked Data browsers, visual query builders, and exploration tools that do not require expert knowledge of Semantic Web technologies [8,9,14]. A recent example is RDF Surveyor [33], a lightweight exploration tool targeted to lay users that is part of our previous work. Unfortunately, most of the exploration tools available have limited support for geospatial Linked Data if any, e.g. the visualization of an entity in RDF Surveyor includes a geo widget with a marker if a point location annotated with the Basic Geo Vocabulary22 is found.
Some systems have been designed to support the visualization of geospatial Linked Data. Again, many proposals are targeted to Semantic Web experts: GeoYASGUI [1] is a SPARQL editor that natively supports GeoSPARQL and provides a result set visualizer; Sgvizler [28] is a JavaScript library that can produce different charts – including maps – with the results of SPARQL queries; and Sextant [18] is an advanced visualization tool that can combine spatial data from several endpoints and represent the temporal dimension, although it still requires knowledge of SPARQL in order to use it. There are seldom visualizers of geospatial Linked Data for non-Semantic Web experts: LinkedGeoData browser [29] is a dedicated visualization tool for OpenStreetMap; and Map4RDF [10] is a browsing tool of geospatial RDF datasets that uses a faceted interface to control the information to display.
In the forestry domain, we can find several initiatives at national or regional level focused on the delivery of raw data, but not using Linked Data and Semantic Web technologies. A remarkable example at pan-European level is the EFISCEN database portal [27] that offers forestry datasets from 32 countries, but using disparate schemata and data formats. National data portals are common, although the typical case is downloadable raw data in proprietary format (e.g. Spanish forest inventory33) or just aggregated results (e.g. the first edition of the Spanish forest inventory44).
Visualization of forestry data is commonly achieved through a Geographical Information System (GIS). For example, Global Forest Watch55 is a web application that provides information about forest status and land use management at global scale. GISs do not rely on Linked Data technologies and use instead their own formats, typically standardized by the Open Geospatial Consortium.66 As a result, geospatial data is syntactically interoperable, but the integration of external datasets into a GIS is time-consuming and complex [16].
Other forestry tools focus on the analysis of data. This is the case of BASIFOR77 [4,22], a flexible and powerful forestry analysis tool that can process data from the Spanish forest inventory. Initially designed as a tool for forestry research, BASIFOR is also used for management and planning purposes as it calculates timber stocks, density, forest structure, specific composition and other forestry variables in a geographical region defined by the user. BASIFOR holds strong capabilities in terms of data manipulation, but is not based on Semantic Web technologies and is thus tied to the schemata of the Spanish forest inventory.
3.Requirements
The Spanish forest inventory [2] is a continuous dataset that is updated every 10 years. A plot is an homogeneous and small area of the territory that constitutes the sampling unit. Forest technicians survey plots to gather tree data (location, species, diameter, and height). The current version of this inventory accrues 1.4M trees, 91.9K plots, and 4.3M positions. The Spanish land cover map88 contains patches of terrain with similar characteristics, described using polygons over the territory. Patch data includes soil use and dominant tree species. The current version of this dataset accrues 680.2K patches. Spanish provinces are employed to aggregate data in both cases.
Table 1
Feature types and feature data of the Cross-Forest dataset
| Feature type | Feature data |
| Province | Number of trees |
| Basal area (m2) | |
| Volume with bark (m3) | |
| Patch | Province |
| Polygon | |
| Area (m2) | |
| Soil use | |
| Canopy cover | |
| Tree species | |
| Plot | Province |
| Coordinates | |
| Number of trees/ha | |
| Basal area (m2/ha) | |
| Volume with bark (m3/ha) | |
| Tree | Plot |
| Coordinates | |
| Height (m) | |
| Diameter (mm) | |
| Tree species |
The Cross-Forest dataset integrates the latest versions of the Spanish forest inventory and land cover map in Linked Data format, thus fulfilling one of the main goals of the Cross-Forest project. Provinces, patches, plots and trees are modeled as spatial features with a geometry and a set of measures extracted from the corresponding source. The details of the main features of each dataset are shown in Table 1. Their positions are represented using a simple ontology that indicates the Coordinate Reference System and the coordinates of the position. This ontology makes safe reuse [7] of relevant geographical ontologies, including GeoSPARQL [20], the W3C Basic Geo Vocabulary [5], and the ISA Programme Location Core Vocabulary [19].
The original datasets includes features with absolute positions using UTM coordinates, but some features, namely trees, are only annotated with relative positions, using plot centers as reference. When making the conversion into RDF we have enriched the original data with the inclusion of WGS84 positions for every feature, including trees. UTM coordinates and relative positions are still available in the Linked Open Data version of the datasets, so there is no impact for users of the original data sources. We used Proj4js99 and Mapshaper1010 to transform coordinates from one coordinate system to another. When developing a map application it is quite convenient to use WGS84 coordinates as they are supported in the majority of GISs.
The transformation of the land cover map into RDF includes the creation of a new layer of patches in a lower resolution in order to make efficient the drawing of polygons on top of a Web map (see Best Practice 4 in [30]). The taxonomical structure of trees and bushes (including class, genus, family, and species) is linked to relevant datasets in forestry and biology fields: the NCBI taxonomy [12] and the CrossNature dataset.1111 They are also linked to other well-known cross-domain knowledge graphs: DBpedia [17] and Wikidata [11]. Links to DBpedia and CrossNature datasets are made using owl:sameAs and schema:sameAs, since they involve individuals. In the case of Wikidata and NCBI, we interlinked classes by means of rdfs:subClassOf. The original sources were transformed into RDF using SPARQL generate [15]. The resulting Cross-Forest dataset is currently published in a SPARQL endpoint1212 using Openlink Virtuoso v07.20.3230. Table 2 provides some statistics of the dataset that were computed in October 2020.
Table 2
Statistics of the Cross-Forest dataset
| Item | Inventory | Land cover | Total |
| Distinct classes | 89 | 204 | 325 |
| Distinct properties | 49 | 23 | 210 |
| Distinct individuals | 19.4M | 39.1M | 58.5M |
| Distinct subjects | 10.4M | 20.6M | 31.0M |
| Distinct objects | 12.9M | 30.2M | 41.2M |
| Distinct literals | 4.0M | 10.0M | 12.9M |
| Geometries (polygons) | – | 922.3K | 922.3K |
| Size of TTL files (GB) | 2.7 | 7.5 | 10.8 |
| Triples | 55.1M | 142.4M | 197.8M |
We identified a target group interested in the resulting integrated dataset: domain experts such as forest managers and operational foresters that have to invest a lot of time with manual integrations or using forest analysis tools like BASIFOR [4] due to strong coupling to schemata, legacy formats, or limited tool scope. For instance, [23] reports a significant effort integrating the data of three provinces of the Spanish forest inventory (this dataset is sliced in 50 files, one per province) – note that this is a simple integration case as the database schema is the same for the three provinces and no other data sources were required. Moreover, analyzing forestry data from different countries is a time-consuming and difficult task, requiring schema harmonization and data conversions. Another target group corresponds to lay users such as data journalists or citizens interested in forestry. These two groups are not knowledgeable about Semantic Web technologies, so they need a tool that shows the data while hiding the complexities of its representation. As a result of a collaborative design effort among two forestry experts and two Semantic Web practitioners (the authors of this paper), we identified the following requirements:
R1 | Portable. The tool should run in different devices ranging from desktop computers to mobile phones. Moreover, the installation process should be as simple as possible to facilitate the adoption of the tool. |
R2 | Effective hiding of RDF/OWL/SPARQL. The end user does not need to know about RDF, OWL, SPARQL, or any other Semantic Web language. Instead, the user interface has to offer appropriate visualizations that present the information in an appropriate way to the users’ needs. |
R3 | Interactive map. Since lay users have embraced map applications [32] and the target dataset is about spatial data, an interactive map seems a suitable visualization for this case. Typical map navigation controls like panning or zooming can be added to easily explore the zone of interest. |
R4 | Adaptable to different zoom levels. The tool should serve to explore large or small areas. In the former case, lower resolution of geometries should be served. When zooming in to a small area, a high level of detail of geometries is appropriate and tree markers should be drawn. |
R5 | Filtering capabilities. The user needs to control the information at display. In particular, they should be able to set filters of tree species and land uses, as well as controlling which elements of the view to show, e.g. choosing between province or landscape visualizations. |
R6 | Multilingual. The tool should be localized to English and Spanish. |
4.Design and implementation
In this section we present the tool devised to easily access the contents of the Cross-Forest dataset. The proposed tool is Forest Explorer and satisfies the requirements described in Section 3. The following subsections dive deep into the design and implementation of Forest Explorer.
4.1.Logical architecture
The logical architecture of Forest Explorer is depicted in Fig. 1. The Map generator is in charge of displaying the view for the end user. This component employs a base map obtained from the Map server and listens to the requests made from the different Feature managers for showing markers, polygons, popups, or tooltips on top of the map. More specifically, the Province manager gathers province geometries and forest inventory data aggregated by province and prepares a suitable display request to the Map generator. Patch, Plot, and Tree managers work in a similar way, obtaining first the information about the corresponding features (see Table 1) located in the geographical bounds of the current map view, and then sending display requests to the Map generator.
Fig. 1.
Logical architecture of Forest Explorer.
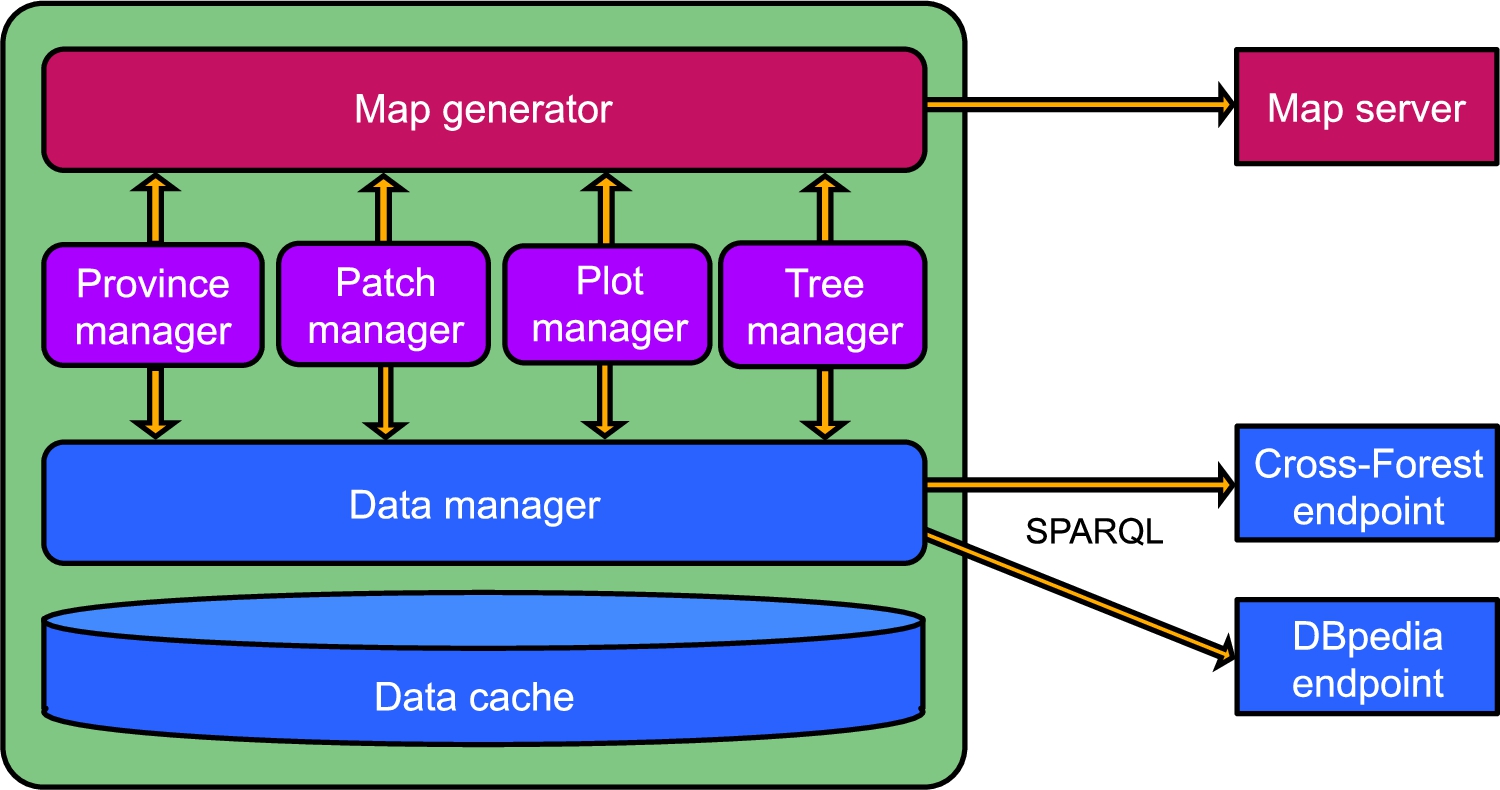
In order to comply with requirement R4, the different Feature managers are activated depending on the zoom level. In case of large areas, the user can choose between province or patch views (R5). In the former case, the Province manager takes control and requests the presentation of inventory data aggregated by provinces. In the latter case, the Patch manager is activated and requests the lowest resolution layer available of the land cover map. With intermediate zoom levels, the Patch and Plot managers are both enabled to present the plots on top of a land cover map of the visible area. With high zoom levels, the Patch and Tree managers are activated – the highest resolution layer available of the land cover map is employed in this case, while the Tree manager requests the presentation of tree markers to the Map generator based on the inventory data for the target area. Note that this design is compliant with Best Practice 4 in [30], recommending to provide multiple resolution versions of features at different zoom levels.
The Data manager handles all the data requests from the Feature managers. This component is able to communicate via SPARQL and is configured to use the Cross-Forest and DBpedia endpoints. As described in Section 3, the Cross-Forest dataset contains a Linked Open Data version of the Spanish forest inventory and land cover map. DBpedia is employed as a source of tree species information, providing images and multilingual descriptions (R6). Upon receipt of a request, the Data manager first checks if the result is already available in the Data cache. In case of a miss, the Data manager sends one or more SPARQL queries to the endpoints. Section 4.2 gives further details of the functioning of the Data manager.
4.2.Data gathering
As depicted in Section 4.1, the Data manager is in charge of all data gathering operations in Forest Explorer. The design of this component is challenging due to a number of reasons: (1) requests look quite varied, referring to different types of features (provinces, patches, plots, and trees) and all their associated data; (2) the size of the Cross-Forest dataset is not small – 4.3GB corresponding to 73.7M triples; and (3) requests can be very numerous since any change in the interactive map will trigger data requests by one or more Feature managers.
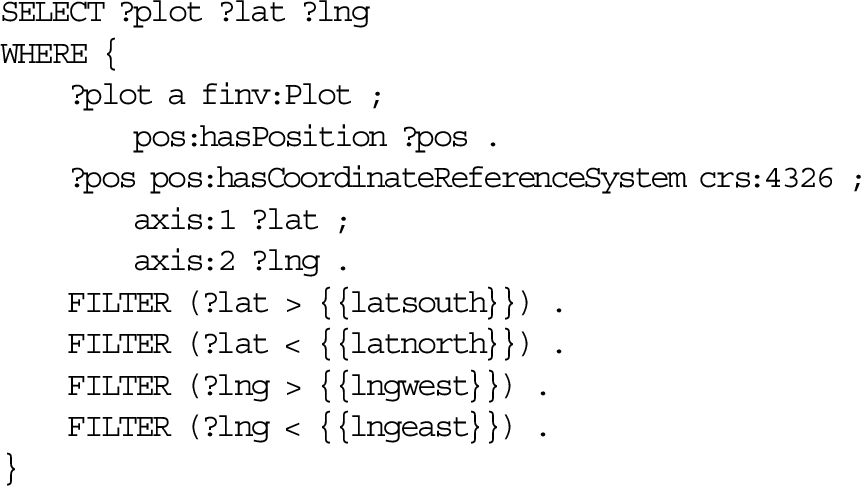
Fortunately, the different request types can be abstracted to the identification of features localized in a specific area and then obtaining their corresponding feature data. The Data manager uses SPARQL template queries for retrieving the features localized in the map view. Since plots and trees have points as geometries, a suitable query basically has to check which points are included in a bounding box. Listing 1 shows the template used for plots in which {{latnorth}}, {{latsouth}}, {{lngwest}}, {{lngeast}} are placeholders for the map view bounds.
Listing 1.
SPARQL query template for retrieving plots in the map view
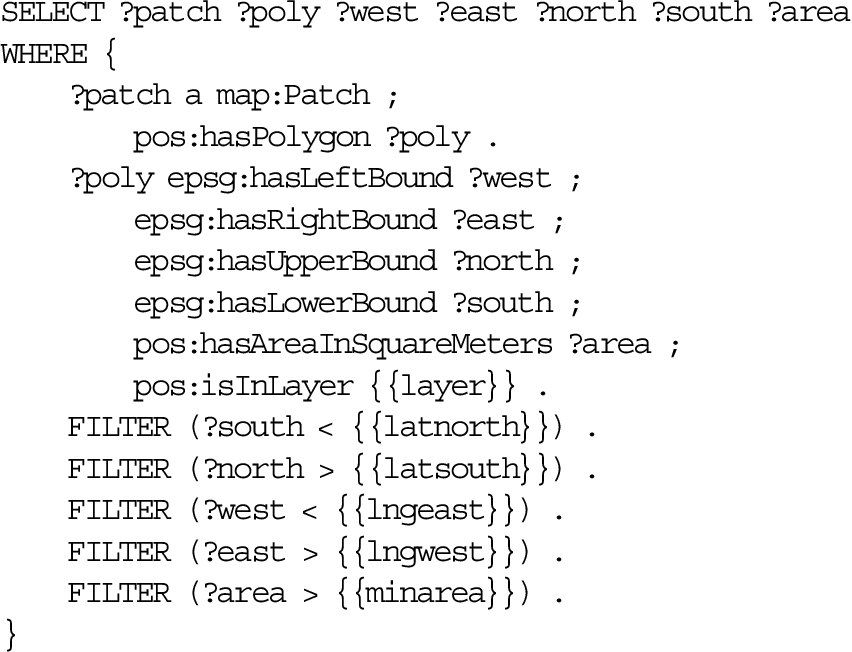
As patches and provinces have polygons as geometries, queries have to be adapted to find the polygons intersecting with the map view. The template used for patches is included in Listing 2. Note that we use the bounding box of the polygon (included for all polygons in the dataset) to simplify the detection of patches in the map view. In order to comply with requirement R4, the template is parametrized to select a specific {{layer}} and to define a minimum threshold for the area of polygons, i.e. {{minarea}}. The Data manager chooses the most appropriate layer based on the zoom level of the map view, while it sets the minimum area to 10 pixels in the user device.1313
Listing 2.
SPARQL query template for retrieving patches in the map view
Once the Data manager obtains the set of features in the area of interest, it retrieves the corresponding data in a next step. Listing 3 shows the query template used for this purpose; it is extremely generic and easily adaptable to each feature type. For example, obtaining the height of a collection of trees just requires setting their IRIs and the height property IRI defined in the Cross-Forest ontology. As a result, gathering feature data is just a matter of selecting the set of properties to extract for each feature type (see Table 1). Class membership is required in some cases – for example to obtain tree species – so we have included another generic template for retrieving the classes of a set of individuals.
Listing 3.
SPARQL query template for obtaining the values of a property for a set of individuals
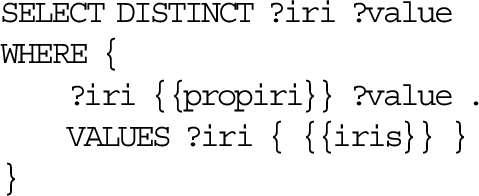
Fig. 2.
The Data manager limits query exchanges with the endpoint by keeping track of the map regions with localized features. The map is initially unknown to the Data manager (a), so a feature location request for region
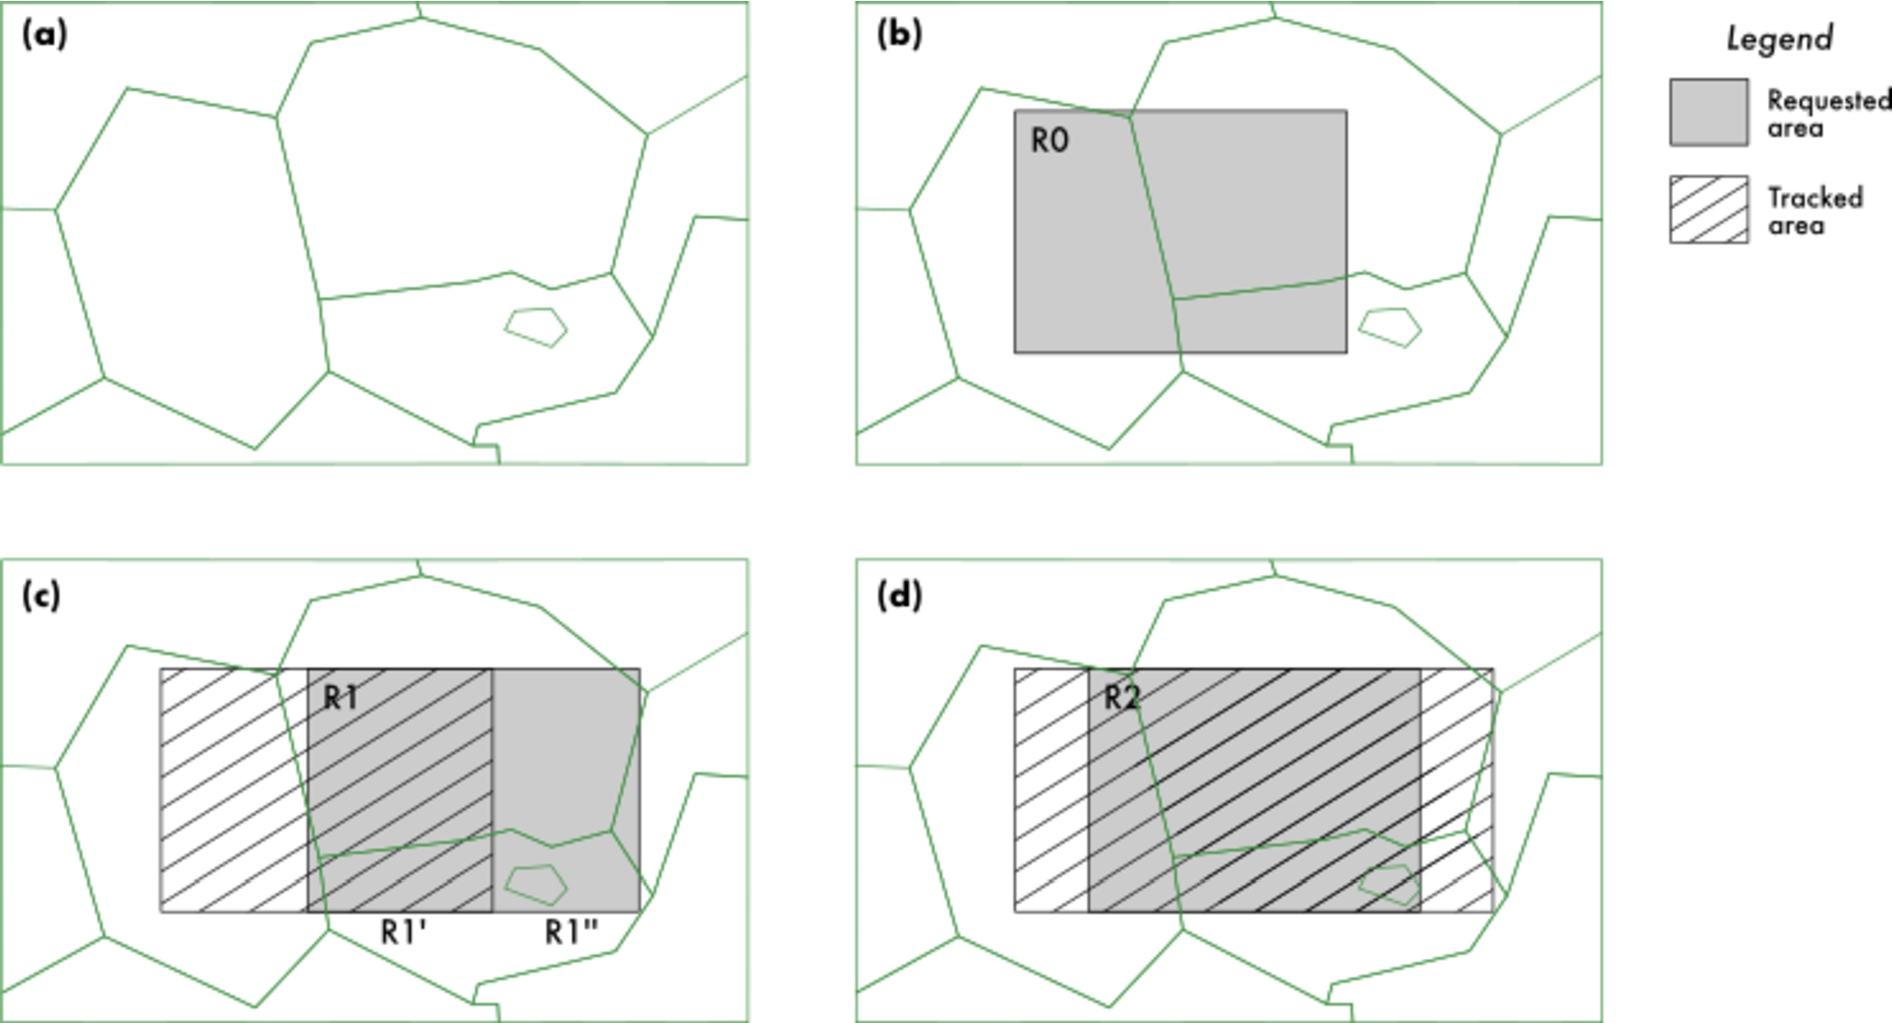
The Data manager stores all retrieved data in a Cache so as to reduce exchanges with the endpoint. This is quite effective with feature data, since the template query in Listing 3 can be easily parametrized to avoid requests of feature data already available in the Cache. With respect to feature locations, a similar approach consists on caching the results for every map view bounds request, i.e. queries built with Listing 1 for plots, Listing 2 for patches, and so on. However, this solution is too naive as the cache will only get a hit in case of a request with exactly the same map boundaries as a previous one. Instead, the Data manager keeps track of the map regions with localized features and exploits this information to restrict queries to unknown areas. Figure 2 illustrates the idea:
(a) At the beginning the Data manager has no information of any part of the map.
(b) Upon receiving a feature location request for region
(c) A request about region
(d) A request about region
4.3.User interface
In order to comply with requirement R3, the user interface of Forest Explorer exposes an interactive map as its main component. Figure 3 shows some snapshots that illustrate the design of the user interface. Since the tool has to work with a diversity of devices (R1), the map is set in fullscreen mode to easily adapt to different screen sizes. Similar to other map applications, panning and zooming are naturally supported for both point-and-click and touch interfaces. In this regard, zoom buttons are included in the lower-right corner; the extra button with a person icon is used to navigate to the user location – this latter functionality is especially useful when employing Forest Explorer with a mobile device in a field trip.
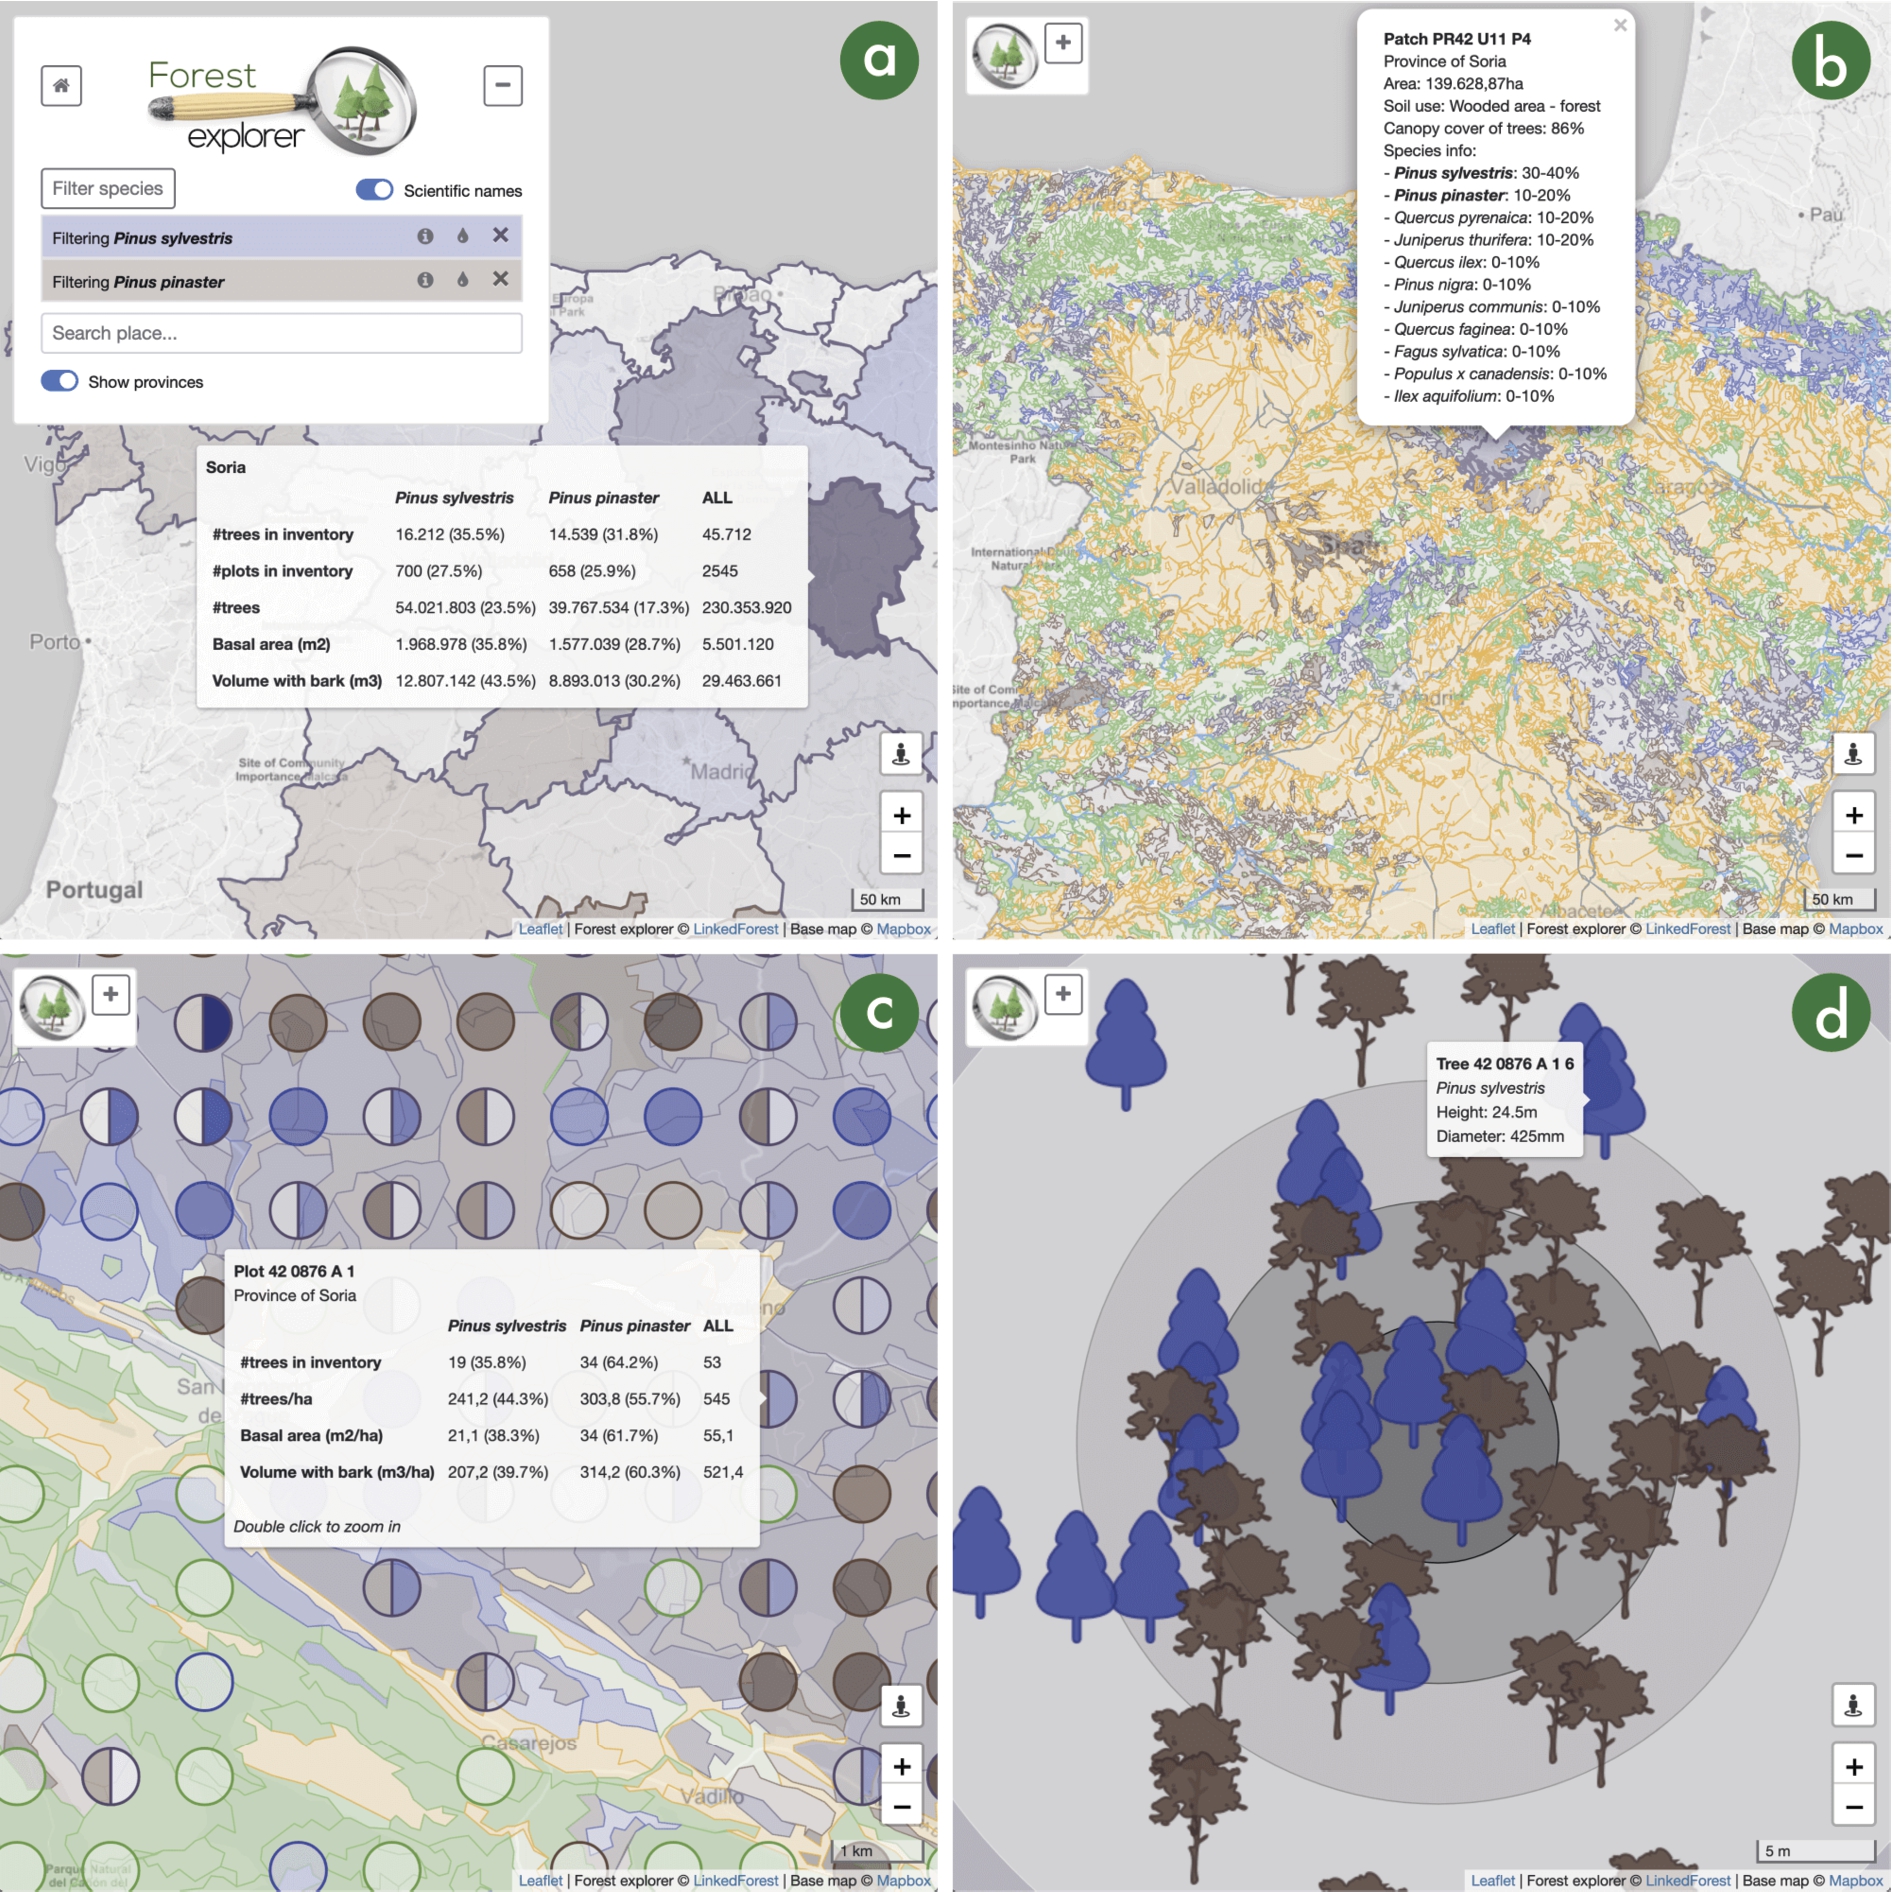
Fig. 3.
Snapshots of the user interface of Forest Explorer. (a) View of the Spanish provinces in a large area (see the map scale in the lower-right corner) with the form in the upper-left part expanded and showing two species filters, Pinus sylvestris in indigo color and Pinus pinaster in brown; inventory tree data for the province of Soria is displayed in a tooltip. (b) View of the patches in a large area of Spain with the form in the upper-left part collapsed; patches are plotted in different colors depending on their use (farms in orange, water in blue, artificial in grey, and forests in green); forest patches containing a filtered species use the color filter (indigo and brown in this running example); a pop-up shows the data of a forest patch in the province of Soria. (c) View of a small forest area (see the map scale in the lower-right corner) in the province of Soria; plots are displayed as circles on top of the patches; plots and patches employ the same color code as before; a tooltip shows inventory data for a plot. (d) View of a tiny small forest area corresponding to the center of a plot in Soria; tree markers are shown in their actual positions using taxa-dependent icons and corresponding filter colors; a tooltip shows the species, height, and diameter of a specific tree.
As the user navigates with the map, a Feature manager takes control by obtaining feature information from the Data manager and then sending display requests to the Map generator (see Section 4.1). For example, the Province manager controls the view of Fig. 3(a); the Patch manager is activated in Fig. 3(b); the Patch and the Plot managers collaborate to build the view in Fig. 3(c); and the Tree manager is active in Fig. 3(d).
Beyond map navigation, the user interface needs to include controls to allow the user to adjust the information to display (R5). For this purpose, Forest Explorer includes a form in the upper-left part – see Fig. 3(a). This form can take a significant part of the screen in mobile devices, so it can be collapsed by pushing the ‘-’ button – the collapsed form is shown in Fig. 3(b)(c)(d).
A key characteristic of the dataset is the tree species of land cover map and forestry inventory. Thus, the form includes a ‘Filter species’ button that can be pushed to easily browse the taxonomy of tree species (obtained from the Cross-Forest ontology) and then select one or more filters. The form in Fig. 3(a) includes two species filters, Pinus sylvestris in indigo color and Pinus pinaster in brown. Each filter includes buttons for removal (‘x’ icon), color change (‘tint’ icon), and more info (‘info’ icon) – the latter one displays a popup with additional information about a tree species such as an image and a localized description obtained from DBpedia. Species filters have a significant impact in the map view: the color code of species filters is applied to the different features, while species data is also displayed in the different tooltips and popovers – see the snapshots in Fig. 3.
In addition, the form includes a textbox for searching places (obtained from the GeoNames dataset1414) that sets the view of the map to the location of the selected place. Unsurprisingly, the ‘Scientific names’ switch allows the user to choose between scientific and vulgar names of tree species. Other controls are dependent on the zoom level: the ‘Show provinces’ switch is displayed with low zoom levels so as to choose between the province – Fig. 3(a) – and patch – Fig. 3(b) – visualizations. With intermediate zoom levels, the user can hide or show the plots in the map – this applies to Fig. 3(c), although the form is collapsed in this snapshot. Color saturation for plots can also be adjusted with a range input. Finally, it is possible to highlight patches by land use, e.g. to find plantation forests, dehesas, thickets, and so on.
4.4.Implementation
Forest Explorer is coded in JavaScript to facilitate its deployment as a web application. As a result, the tool can be used in any device with a modern web browser.1515
The code is organized in several files that reflect the logical architecture in Fig. 1. The implementation effort has been considerably reduced by the integration of a number of JavaScript libraries. We use Leaflet1616 for the interactive map, thus fulfilling the role of the Map generator component (see Section 4.1). This library offers almost all the mapping functionality needed for Forest Explorer: vector layers for plotting features, markers, popups, tooltips, map controls, and interaction capabilities. We use two additional Leaflet plug-ins: Leaflet.Locate1717 to geolocate the user, and Leaflet.Circle-sector1818 for drawing pie-shaped plots when filtering multiple tree species – see Fig. 3(c). We use the custom Mapbox Light map1919 as a background for displaying forestry data on top – this is the Map server component in Section 4.1.
The form of the user interface is built with Bootstrap2020 to simplify front-end development across different browsers and devices. We use jQuery2121 for event handling and manipulating the Document Object Model [34]. We also employ the utility functions of Underscore2222 for handling collections. We use Mustache2323 for templating SPARQL queries (see Section 4.2). Lastly, Google Analytics2424 is included to keep track of the usage of Forest Explorer.
As for the Data manager component, all the queries are included in a separate file using templating parameters as necessary, e.g. Listings 1, 2, and 3. We also use a mapping file that assigns keys to ontology IRIs; the Data manager only references the keys and this level of indirection decouples the implementation from the Cross-Forest ontology as a result.
Since the tool needs to be localized to English and Spanish (requirement R6), the Cross-Forest dataset is localized to these languages and all the labels employed in the user interface are included in a multilingual strings file. When the tool starts, it gets the browser language preferences in order to select the session language that is then applied to every text shown.
The source code of Forest Explorer is available on GitHub.2525 We have also set up a live version of the tool2626 for anybody who wants to use it. All in all, Forest Explorer can be used with different devices (R1), the user interface hides the intricacies of Semantic Web languages from the user (R2), an interactive map (R3) is employed to present the data adapted to different zoom levels (R4), with a number of filtering capabilities (R5), and localized to English and Spanish (R6), as elaborated above.
5.Impact
We submitted a preliminary prototype of Forest Explorer to Desafío Aporta 2019,2727 an open data challenge on agrofood, forestry and rural areas that was sponsored by the Spanish Ministry of Economy. This challenge received 40 proposals and ours was shortlisted to a final panel, although we did not get an award. The communication board of Universidad de Valladolid prepared a press release about Forest Explorer2828 reaching the final round of Desafío Aporta 2019 in December 2019. At that time the live site of Forest Explorer was openly available and we shared the website link with our contacts. Spanish local media published several articles about the tool.2929 In addition, two newspapers published long interviews with us covering Forest explorer.3030
In January 2020 we used our social networks to announce the release of Forest Explorer. Specifically, we sent 8 tweets in Twitter that received over 6,500 impressions, more than 100 likes, and about 30 retweets. We also prepared three short posts in Facebook and one more in Twitter, receiving over 1,000 and 375 impressions, respectively.
Beyond media coverage and social networks, we used Google Analytics to assess the uptake of Forest Explorer. Tracked data was obtained from the live site in October 2020. About usage, more than 3,200 users have accessed the tool and have carried out over 5,500 sessions with an average session time of 4 minutes and 11 seconds. 85% of the traffic comes from Spain and the preferred language was Spanish in 82% of the sessions – this is not surprising, as the dataset only covers Spanish forests. Google Analytics gives also information about the employed devices: 43% were Windows computers, 38% Android mobiles or tablets, 12% iOS devices, 6% Mac computers, and 1% Linux computers.
5.1.User study
We have carried out a user study of Forest Explorer that was promoted by the Cross-Forest consortium – we participated in the preparation of the questionnaire, but we did not reach potential respondents. The invitation to take part in this user study included a link to Forest Explorer to test it, as well as the link to the questionnaire. This was divided in four parts: (1) User profile, (2) Dataset assessment, (3) Usability through the standardized System Usability Score (SUS) [6], and (4) User feedback.
Table 3
Profiles of the participants in the user study (first part of the questionnaire)
| Way of contact | # | % |
| 18 | 64 | |
| Colleagues | 8 | 29 |
| Project website | 2 | 7 |
| Country | # | % |
| Spain | 15 | 54 |
| Portugal | 12 | 43 |
| France | 1 | 4 |
| Group sector | # | % |
| Public Administration | 17 | 61 |
| Academics | 5 | 18 |
| Forest professionals | 4 | 14 |
| Citizens | 2 | 7 |
| Rolea | # | % |
| Data consumer | 17 | 61 |
| Data provider | 11 | 39 |
| Service provider | 4 | 14 |
| Expertise level (1–5) | avg | std |
| Using forestry data | 3.1 | 1.3 |
| Using geodatabases | 3.7 | 0.9 |
a It was possible to select multiple options to this question; 86% of the participants chose one of the three options given and 14% marked two.
28 participants have answered the questionnaire so far – information about their user profiles is summarized in Table 3. Note that most of them can be classified as forestry domain experts (93%), while the remaining 7% correspond to the user group of lay users. Moving to the data assessment section, participants rated the usefulness of the data exposed with an average figure of 3.9 and a standard deviation of 0.8 in a scale from 1 (not useful) to 5 (very useful). They were also asked about the understandability of the data exposed (from 1, not understandable, to 5, very understandable): the average was 3.9 and the standard deviation 0.9. Participants were also asked to optionally propose new datasets to be integrated: four suggested the inclusion of orthophotos as base map; three proposed the inclusion of additional forestry data (combustibility, biomass, carbon sequestration); two proposed the inclusion of altimetry data; and another proposed the inclusion of previous editions of forest inventories.
Regarding usability, the computed SUS score was 75 in average with a standard deviation of 16. This figure is good, given that SUS scores range from 0 to 100. According to the grading scale interpretation of SUS scores in [26, ch. 8], Forest Explorer was graded with a B. Interestingly, the group of Spanish respondents gave higher scores (81 in average and an A in the aforementioned grading scale) than the participants from other countries, mainly Portugal, with a SUS score of 69 in average.
The fourth part of the questionnaire began with a question about the likeliness of recommending Forest Explorer to a friend or colleague (from 1, not likely at all, to 5, very likely); the average was 4.0 with a standard deviation of 0.9. This block also contained two open-ended questions about what liked most and liked least of Forest Explorer. We analyzed the results by identifying several themes and categorizing the answers. The main findings are included in Table 4 with their level of support and a sample comment for each finding – note that we only include a point if supported by at least two participants, so as to avoid irrelevant or spurious judgments.
Table 4
Strengths and weaknesses of Forest Explorer (fourth part of the questionnaire)
| Point | Support | Sample comment | |
| + | Easy to use | 12/28 | Easy access to heavy detailed databases [P27] |
| + | Good usability | 6/28 | Interface (simple and visually attractive) and optimization (fast data loading) [P6] |
| + | Fast | 6/28 | Fast loading of information layers [P3] |
| + | Data integration | 4/28 | Unified presentation of all data in MFE and IFN at national level, with fast and exhaustive search. The possibility of filtering one, two, three species, with a very visual search of plots and patches [P15] |
| + | Search capabilities | 3/28 | Compound search of several species [P16] |
| − | Portuguese data missing | 5/28 | Not having information about Portugal [P1] |
| − | Data not downloadable | 4/28 | Not possible to download data [P18] |
| − | Lack of background maps | 3/28 | There are no different maps, you cannot know the coordinates, download data in another format (Excel, pdf) [P7] |
| − | Provide more info | 3/28 | I miss a user manual [P4] |
| − | Somewhat slow | 3/28 | Sometimes it takes time until filters are applied [P28] |
| − | Aesthetics | 2/28 | Color of maps [P23] |
With respect to the tool strengths, 43% of the respondents stressed its ease of use and 21% its usability – connected to requirement R2 and one of the main goals of Forest Explorer. 21% considered the tool fast – a good sign given the effort on efficient data gathering (see Section 3.2). Four participants included positive comments about the integration of forest databases through Forest Explorer. Three liked the search capabilities of the tool – connected to requirement R5. On the negative side, we obtained very useful feedback for improving Forest Explorer. 18% of the respondents missed Portuguese data – this limitation may partially explain the lower SUS scores of Portuguese participants, identified above. New feature requests include a downloading data functionality, providing background maps (see also the analysis of the second part of the questionnaire above), and additional information like a user manual or provenance data. Besides, some participants reported speed problems and minor aesthetics modifications.
All in all, these results are generally positive, supporting the design goals of Forest Explorer. Participants mainly correspond to the group of forest domain experts. They were able to use the tool for exploring a complex semantic dataset integrating forest inventories and land cover maps, and considered Forest Explorer easy to use. Usability was ranked good – this is consistent with SUS scores and answers to open-ended questions. No important limitations were found, they were mostly feature requests that are quite useful to guide the development of new versions of Forest Explorer.
6.Discussion
Forest Explorer is designed to work with the Cross-Forest dataset, thus benefitting from the use of Semantic Web technologies for data integration. Indeed, this advantage was identified in the user study (see Table 4), although participants still demanded additional sources to be included – it looks data integration is much needed in the forestry domain. In this regard, we are currently working on the conversion of the Portuguese forest inventory and land cover map into Linked Open Data. Once included in the Cross-Forest dataset, they will be automatically browsable through Forest Explorer. Despite the schemata of the original Portuguese and Spanish sources are different, the overarching ontology homogenizes the terminology, so no further changes will be required in Forest Explorer.
Moving on to the technical design of Forest Explorer, the Data manager is the component in charge of gathering data from the Cross-Forest and DBpedia endpoints (see Fig. 1). The solution devised relies on the use of SPARQL query templates to facilitate the extensibility of Forest Explorer. As an example, the template query in Listing 3 is employed for gathering every type of feature data and also for obtaining images and tree species descriptions from DBpedia. Similarly, the Data manager uses a query template for obtaining the taxonomy of subclasses of a target class; this is employed with species and soil uses. Furthermore, Section 4.2 already describes the query templates used for retrieving plots and patches, as well as the Cache proposed for reducing query exchanges with the Cross-Forest endpoint. Such query templates can be abstracted away to retrieve arbitrary features in order to extend the applicability of Forest Explorer to other contexts.
Geospatial queries in Forest Explorer are handled with the SPARQL templates in Listings 1–2. They are simple interval queries that run quite fast and provide the necessary expressiveness for the retrieval of features in a bounding box. Alternatively, GeoSPARQL functions such as sfWithin could be employed for this purpose – this approach was discarded because the Cross-Forest triplestore provides custom geospatial functions, but GeoSPARQL functions are not supported. We acknowledge that GeoSPARQL is quite powerful and convenient for conducting geospatial operations, and for this reason the Cross-Forest dataset provides geometries expressed in Well Known Text. We envision the use of GeoSPARQL for new forest scenarios in the near future.
The different Feature managers in Forest Explorer are bound to the corresponding feature types, i.e. province, patch, plot, and tree. They can be easily modified so as to prepare new labels for tooltips, to request different markers to be rendered by the Map generator, etc. Moreover, new Feature managers can be added to the system; the recommended way is (1) to use an existing Feature manager as a base and (2) to update the Data manager for gathering feature data – existing query templates should be sufficient in most cases.
To wrap up, Forest Explorer is a novel exploration tool of forestry Linked Open Data designed for non-Semantic Web experts. Users can interact with a map to navigate to the area of interest and to control the information to display. To limit data exchanges with the SPARQL endpoint, Forest explorer uses a cache and smart geographic querying. So far, we have attracted the attention of the forestry community, not very familiar with Semantic Web technologies. Our future work includes the integration of new data sources from other countries in the Cross-Forest dataset, beginning with Portugal. Other geolocated data can be integrated such as cadastral parcel information, digital terrain models, land use maps, remote sensing layers and hazard occurrence or vulnerability (forest fires, pests and diseases, or blown down damages). We also plan to introduce data analysis capabilities to support forest management and planning scenarios. In this way, Forest Explorer could provide similar functionalities as BASIFOR, but with strong visualizations and taking advantage of Linked Open Data for forestry data integration.
Notes
13 The assumption here is that patches of less than 10 pixels are barely visible so it is better to not waste time and computation resources with them. The area of a pixel changes with the zoom level, so a patch discarded for being too small can be later displayed in case of zooming in.
15 We have tested Forest Explorer with the latest versions of Mozilla Firefox and Google Chrome in a variety of mobile phones, tablets, and desktop computers.
Acknowledgements
This work has been partially funded by the European Commission through Cross-Forest (2017-EU-IA-0140) and Spanish Ministry of Science and Innovation through REFORM (PCIN-2017-027, ERANET SUMFOREST) projects. The authors would like to thank the reviewers for their constructive and insightful comments that helped to improve this paper.
References
[1] | W. Beek, E. Folmer, L. Rietveld and J. Walker, GeoYASGUI: The GeoSPARQL query editor and result set visualizer, The International Archives of Photogrammetry, Remote Sensing and Spatial Information Sciences 42: ((2017) ), 39–42. doi:10.5194/isprs-archives-XLII-4-W2-39-2017. |
[2] | F. Bravo, M. del Río and C. del Peso, (eds), El Inventario Forestal Nacional. Elemento clave para la gestión forestal sostenible, 2002. |
[3] | F. Bravo, M. Fabrika, C. Ammer, S. Barreiro, K. Bielak, L. Coll, T. Fonseca, A. Kangur, M. Lof, K. Merganicova, M. Pach, H. Pretzsch, D. Stojanovic, L. Schuler, S. Peric, T. Rotzer, M. del Río, M. Dodan and A. Bravo-Oviedo, Modelling approaches for mixed forests dynamics prognosis. Research gaps and opportunities, Forest Systems 28(1) (2019). doi:10.5424/fs/2019281-14342. |
[4] | F. Bravo, J.C. Rivas, J.A. Monreal-Núñez and C. Ordóñez, BASIFOR 2.0: Aplicación informática para el manejo de las bases de datos del inventario forestal nacional, in: Cuadernos de la Sociedad Española de Ciencias Forestales, (2004) , pp. 243–247. doi:10.31167/csef.v0i18.9466. |
[5] | D. Brickley, Basic Geo (WGS84 lat/long) Vocabulary, Technical Report, World Wide Web Consortium, 2006, https://www.w3.org/2003/01/geo/, last visited January 2021. |
[6] | J. Brooke, SUS – a quick and dirty usability scale, in: Usability Evaluation in Industry, P.W. Jordan, B. Thomas, I.L. McClelland and B. Weerdmeester, eds, Taylor & Francis, London, UK, (1996) . |
[7] | S. Corlosquet, R. Delbru, T. Clark, A. Polleres and S. Decker, Produce and consume linked data with drupal! in: Proceedings of the 10th International Semantic Web Conference (ISWC 2011), L. Aroyo, C. Welty, H. Alani, J. Taylor, A. Bernstein, L. Kagal, N. Noy and E. Blomqvist, eds, LNCS, Vol. 7031: , Springer, Cham, Switzerland, (2011) , pp. 763–778. |
[8] | A.-S. Dadzie and E. Pietriga, Visualisation of linked data – reprise, Semantic Web 8: (1) ((2017) ), 1–21. doi:10.3233/SW-160249. |
[9] | A.-S. Dadzie and M. Rowe, Approaches to visualising linked data: A survey, Semantic Web 2: (2) ((2011) ), 89–124. doi:10.3233/SW-2011-0037. |
[10] | A. de León, F. Wisniewki, B. Villazón-Terrazas and O. Corcho, Map4rdf – Faceted browser for geospatial datasets, in: Proceedings of the First International Workshop on Open Data (WOD’12), G. Raschia and M. Theobald, eds, Association for Computing Machinery, New York, NY, USA, (2012) . |
[11] | F. Erxleben, M. Günther, M. Krötzsch, J. Mendez and D. Vrandecic, Introducing wikidata to the linked data web, in: Proceedings of the 13th International Semantic Web Conference (ISWC 2014), P. Mika, T. Tudorache, A. Bernstein, C. Welty, C. Knoblock, D. Vrandecic, P. Groth, N. Noy, K. Janowicz and C. Goble, eds, LNCS, Vol. 8796: , Springer, Cham, Switzerland, (2014) , pp. 50–65. |
[12] | S. Federhen, The NCBI taxonomy database, Nucleic Acids Research 40: (D1) ((2012) ), 136–143. doi:10.1093/nar/gkr1178. |
[13] | T. Heath, J. Domingue and P. Shabajee, User interaction and uptake challenges to successfully deploying Semantic Web technologies, in: Proceedings of the 3rd International Semantic Web User Interaction Workshop (SWUI2006), (2006) , co-located with the 5th International Semantic Web Conference. |
[14] | J. Klímek, P. Škoda and M. Nečaský, Survey of tools for linked data consumption, Semantic Web 10: (4) ((2019) ), 665–720. doi:10.3233/SW-180316. |
[15] | M. Lefrançois, A. Zimmermann and N. Bakerally, A SPARQL extension for generating RDF from heterogeneous formats, in: Proceedings of the 14th European Semantic Web Conference (ESWC 2017), E. Blomqvist, D. Maynard, A. Gangemi, R. Hoekstra, P. Hitzler and O. Hartig, eds, LNCS, Vol. 10249: , Springer, Cham, Switzerland, (2017) , pp. 35–50. |
[16] | J. Lehmann, S. Athanasiou, A. Both, A. García-Rojas, G. Giannopoulos, D. Hladky, J.J. Le Grange, A.-C.N. Ngomo, M.A. Sherif, C. Stadler et al., Managing geospatial linked data in the GeoKnow project, in: The semantic web in Earth and space science, in: Current Status and Future Directions, T. Narock and P. Fox, eds, IOS Press, (2015) , pp. 51–77, Chap. 4. |
[17] | J. Lehmann, R. Isele, M. Jakob, A. Jentzsch, D. Kontokostas, P.N. Mendes, S. Hellmann, M. Morsey, P. Van Kleef, S. Auer et al., DBpedia – a large-scale, multilingual knowledge base extracted from Wikipedia, Semantic Web 6: (2) ((2015) ), 167–195. doi:10.3233/SW-140134. |
[18] | C. Nikolaou, K. Dogani, K. Bereta, G. Garbis, M. Karpathiotakis, K. Kyzirakos and M. Koubarakis, Sextant: Visualizing time-evolving linked geospatial data, Journal of Web Semantics 35: ((2015) ), 35–52. doi:10.1016/j.websem.2015.09.004. |
[19] | A. Perego and M. Lutz, ISA Programme Location Core Vocabulary, Technical Report, World Wide Web Consortium, 2015, URL: https://www.w3.org/ns/locn/, last visited January 2021. |
[20] | M. Perry and J. Herring, OGC GeoSPARQL – A Geographic Query Language for RDF Data, OGC Implementation Standard, Open Geospatial Consortium, 2012, URL: http://www.opengis.net/doc/IS/geosparql/1.0, last visited January 2021. |
[21] | H. Pretzsch, Forest Dynamics, Growth and Yield, Springer, Cham, Switzerland, (2009) . |
[22] | M.d. Río, J.C. Rivas, S. Condes, J. Martínez-Millán, G. Montero, I. Cañellas, A.C. Ordóñez, V. Pando, R. San-Martín and F. Bravo, in: BASIFOR: Aplicación informática para el manejo de bases de datos del Segundo Inventario Forestal Nacional, F. Bravo, M. del Río and C. del Peso, eds, (2002) , pp. 181–191. |
[23] | J. Riofrío, M. del Río and F. Bravo, Mixing effects on growth efficiency in mixed pine forests, Forestry: An International Journal of Forest Research 90: (3) ((2017) ), 381–392. doi:10.1093/forestry/cpw056. |
[24] | R. Ruiz-Peinado, A. Bravo-Oviedo, E. López-Senespleda, F. Bravo and M. del Río, Forest management and carbon sequestration in the Mediterranean region: A review, Forest Systems 26(2) (2017). doi:10.5424/fs/2017262-11205. |
[25] | R. Ruiz-Peinado, M. Heym, L. Drossler, P. Corona, S. Condes, F. Bravo, H. Pretzsch, A. Bravo-Oviedo and M. del Río, Data platforms for mixed forest research: Contributions from the EuMIXFOR network, in: Dynamics, Silviculture and Management of Mixed Forests, A. Bravo-Oviedo, H. Pretzsch and M. del Río, eds, Springer, Cham, Switzerland, (2018) , pp. 73–101. doi:10.1007/978-3-319-91953-9_3. |
[26] | J. Sauro and J.R. Lewis, Quantifying the User Experience: Practical Statistics for User Research, Morgan-Kaufmann, Amsterdam, Netherlands, (2012) . |
[27] | M.J. Schelhaas, S. Varis, A. Schuck and G.J. Nabuurs, EFISCEN Inventory Database, 2006, http://www.efi.int/portal/virtual_library/databases/efiscen/, last visited January 2021. |
[28] | M.G. Skjæveland, Sgvizler: A javascript wrapper for easy visualization of SPARQL result sets, in: Proceedings of the 9th Extended Semantic Web Conference (ESWC 2012) Satellite Events, E. Simperl, B. Norton, D. Mladenic, E. Della Valle, I. Fundulaki, A. Passant and R. Troncy, eds, Springer, Berlin, Heidelberg, (2012) , pp. 361–365. doi:10.1007/978-3-662-46641-4_27. |
[29] | C. Stadler, J. Lehmann, K. Höffner and S. Auer, LinkedGeoData: A core for a web of spatial open data, Semantic Web 3: (4) ((2012) ), 333–354. doi:10.3233/SW-2011-0052. |
[30] | J. Tandy, L. van den Brink and P. Barnaghi, Spatial data on the Web best practices, W3C Working Group Note, OGC 15-107, OGC & W3C, 2017, URL, last visited January 2021, https://www.w3.org/TR/sdw-bp/. |
[31] | E. Tomppo, T. Gschwantner, M. Lawrence and R.E. McRoberts (eds), National Forest Inventories: Pathways for Common Reporting, Springer, Cham, Switzerland, (2010) . |
[32] | B. Veenendaal, M.A. Brovelli and S. Li, Review of web mapping: Eras, trends and directions, ISPRS International Journal of Geo-Information 6: (10) ((2017) ), 317. doi:10.3390/ijgi6100317. |
[33] | G. Vega-Gorgojo, L. Slaughter, B.M. Von Zernichow, N. Nikolov and D. Roman, Linked data exploration with RDF surveyor, IEEE Access 7: ((2019) ), 172199–172213. doi:10.1109/ACCESS.2019.2956345. |
[34] | WHATWG (Apple, Google, Mozilla, Microsoft), DOM, Living Standard, WHATWG, 2021, URL: https://dom.spec.whatwg.org/, last visited January 2021. |


