
Observational/hydrographic data of the South Atlantic Ocean published as LOD
Abstract
This article describes the publication of occurrences of Southern Elephant Seals Mirounga leonina (Linnaeus, 1758) as Linked Open Data in two environments (marine and coastal). The data constitutes hydrographic measurements of instrumented animals and observation data collected during censuses between 1990 and 2017. The data scheme is based on the previously developed ontology BiGe-Onto and the new version of the Semantic Sensor Network ontology (SSN). We introduce the network of ontologies used to organize the data and the transformation process to publish the dataset. In the use case, we develop an application to access and analyze the dataset. The linked open dataset and the related visualization tool turned data into a resource that can be located by the international community and thus increase the commitment to its sustainability. The data, coming from Península Valdés (UNESCO World Heritage), is available for interdisciplinary studies of management and conservation of marine and coastal protected areas which demand reliable and updated data.
1.Introduction
In the ecology domain, research teams collect and store biological and environmental information over the years/decades in database systems to answer their own queries. However, this information is isolated from other datasets for interoperating with and, in addition, is not ready to be accessed by machines. Particularly, in marine science the data collection is a process of cumulative logistic complexity, which makes it important to work on the curation and sustainability of the database, in both the short and long term. It is of great benefit for scientific institutions to publish their datasets following the Linked Data principles [7] not only for interlinking and easy cross-referencing but also for other purposes that are not foreseen at the moment of publication. The state of the art in the last decade shows that together with technology to collect data, semantic interoperability has further grown in importance [20]. To meet Linked Data requirements, datasets must be described with rich metadata such as controlled vocabularies in a particular form – RDF – and published as a findable resource with a unique identifier.
This paper integrates observational and hydrographic datasets based on the SOSA/SSN ontology [6,10] and BiGe-Onto ontology11 [23]. As far as we know, this work is the first to publish linked open data occurrences of a species in two geographical environments (coastal and marine) collected over two decades. Data comes from a research program focused on Southern Elephant Seals (SES) in Patagonia Argentina “Temporal and spatial distribution of the southern elephant seal colony in Península Valdés, Argentina” [15]. The program started in 1990 to study ecology and life history strategies of SES, together with the research of foraging areas and dive behavior, and to contribute to understanding the effects on the species from changes in the ecosystem of SW Atlantic Ocean. The research site is in Península Valdés (PV), which has been a UNESCO World Natural Heritage since 1999 [21].
During the annual cycle, the SES come ashore to breed and molt. The rest of the year they are at sea, traveling long distances throughout its extensive migration (up to 8 months and 12000 km. of round trip), and diving continuously to a depth of 1500 meters or more. During their terrestrial phase they frequently revisit previous years’ sites [13,14]. The behavior during the marine phase shows that SES are ideal carriers of devices, providing physical profiles, (i.e. hydrographic of the water column). For tracking the SES at sea, researchers make use of miniaturized animal-attached tags for relaying data, known as biologging domain [19], and cover animal migration and oceanographic measurements [1]. The instruments deployed on the seal return, at a low cost, large volumes of hydrographic data in regions never studied directly by buoys or oceanographic vessels and collecting large amounts of information associated with the key habitats in the South Atlantic Ocean.
This paper is organized as follows: Section 2 describes the SES database. Section 3 briefly presents the network of ontologies. Section 4 shows examples of how the data are organized. Section 5, describes the populating processes and the links to other datasets. Section 6 shows the application developed to access and analyze the dataset. Finally, we conclude by presenting an analysis of our work and perspectives.
2.SES database
Data are recorded from measurements of physical variables and locations obtained in two different stages. First stage involves an annual census, which takes place during the breeding season of SES. The second stage starts at the end of the breeding season, when SES go back at sea for foraging purposes. Below we briefly describe how data are generated and recorded in each stage. During the breeding season, the SES haul out to the beach to breed. Annual census on foot along the coast of the colony is an arduous but indispensable work to know distribution and trend of the population. The objective is to count each of the harems scattered on the beaches of the PV to determine the number of offspring born in a season. Counts carried out during 2–3 days at peak of the breeding season (October 3–7), when most of the population is ashore. All the breeding groups were counted and located along 200 km of coastline, divided into sections and each census taker is assigned to a route. The census taker must count for the number of animals and classify them by sex and age males, females, and pups. Hereinafter, we will call the procedure of counting individuals in a certain place Occurrence. Each occurrence was georeferenced (latitude and longitude) and demographic data included date and time, group size and substrate where the SES is located. All information about these censuses is recorded in a field book and then uploaded into a MySQL database. Table 1 summarizes the most relevant fields for the conducted censuses.
Table 1
Main fields registered during a census
| Field | Description |
| Observer | Person in charge |
| Date | Date of observations |
| Start time | Census’ starting hour |
| End time | Census’ finalizing hour |
| Location | Latitude and longitude of the occurrence |
| Weather | Cloudy, windy, rainy, clear |
| Tide | High/low |
| Category | Seals’ stage (adult, yeraling, pups, etc.) |
| Sex | Female, male, not determined |
| Count | Amount of SES observed |
At the end of breeding, SES go back at sea for foraging. The trip is monitored by small computers designed and built by Wildlife Computers Inc.22 with sensors to take measurements about their location and immediate environment. The instrument is deployed when the seal is on land before the migration into the sea begins. Time Depth Recorder (TDR) records, time, depth, and temperature every 30 minutes during round foraging trip. The position is also registered when the seal ascends to the surface. Table 2 summarizes the fields that are most relevant in diving.
Table 2
Main fields registered during SES diving
| Field | Description |
| SES identifier | 4-character identifier (e.g. ABVM) |
| Dive number | Total dives in one journey |
| Start time | Dive starting time and date |
| End time | Dive finalizing time and date |
| Dive depth | Average (in meters) |
| Temperature | Average (in Celsius degrees) |
| Location | Latitude and longitude recorded |
The census and the deployments of the instruments are carried out by the research team belonging to Centre for the Study of Marine Systems hosted in Puerto Madryn, Patagonia Argentina (CESIMAR-CENPAT-CONICET).33 The institute is engaged in oceanographic and marine research activities, monitoring information management and data acquisition activities on different platforms.
3.Ontologies used to model observations and hydrographic profiles
In this section, we briefly summarize these ontologies used for the publication of our dataset, indicating the reuse of concepts.
The core of our ontologies network is composed by SOSA/SSN [6] and BiGe-Onto [23], which can be jointly used for both hydrographic profiles and observational data. These ontologies are linked to other ones describing different sub-domains, and thus creating such network. Therefore, the resulting network is composed mainly by the following:
– an ontology to describe the sensors used to measure hydrographic profiles
– an ontology to describe SES occurrences made during censuses
– an ontology to describe the associated measures
– an ontology to describe the locations and places of interest
– an ontology to describe temporality of events
– an ontology to describe scientific publications
A list of prefixes and their corresponding URIs are listed in Table 3.
Table 3
Reused vocabularies and ontologies
| Ontology/Vocabulary name | Prefix | URI |
| BiGe-Onto ontology | bigeonto | http://www.w3id.org/cenpat-gilia/bigeonto/ |
| Semantic Sensor Network Ontology | ssn | http://www.w3.org/ns/ssn/ |
| Sensor, Observation, Sample, and Actuator Ontology | sosa | http://www.w3.org/ns/sosa/ |
| Darwin Core (literal values) | dwc | http://rs.tdwg.org/dwc/terms/ |
| Darwin Core (IRI values) | dwciri | http://rs.tdwg.org/dwc/iri/ |
| GeoSPARQL ontology | geosparql | http://www.opengis.net/ont/geosparql# |
| W3C Time Ontology | time | http://www.w3.org/2006/time# |
| FRBR-aligned Bibliographic Ontology | fabio | http://purl.org/spar/fabio# |
| NERC vocabulary server (measured phenomena) | P01 | http://vocab.nerc.ac.uk/collection/P01/current/ |
| NERC vocabulary server (biological entity sex) | S10 | http://vocab.nerc.ac.uk/collection/S10/current/ |
| Quantities, Units, Dimensions and Types Ontology (v1.1) vocabulary | qudt | http://qudt.org/1.1/vocab/unit |
| Quantities, Units, Dimensions and Types Ontology (version 1.1) schema | qudts | http://qudt.org/1.1/schema/qudt |
| GoodRelations (v1.0) | gr | http://purl.org/goodrelations/v1# |
| Simple Knowledge Organization System | skos | http://www.w3.org/2004/02/skos/core# |
Semantic Sensor Network (SSN) ontology The Semantic Sensor Network (SSN) is a generic ontology related to sensor observations. This ontology has been updated to become a W3C recommendation, and currently it is a lightweight one dedicated to sensor and actuator descriptions. It has been called Sensor, Observation, Sample, and Actuator (SOSA) pattern. The link between SSN and SOSA is described in [6]. The classes we have reused from SOSA/SSN ontology are:
– sosa:Observation: to describe the measurements context.
– sosa:FeatureOfInterest to specify the observed phenomena. In our case, the sample of water column registered by the SES during diving.
– sosa:ObservableProperty to specify the measured property of the observed phenomena (average temperature, average depth and location).
– sosa:Platform to represent the platform hosting a sensor. In our cases, the platform is always the SES.
– sosa:Sensor to describe sensors hosted by platform (e.g. TDR).
– sosa:Result to represent the measurement values from the sensors.
BiGe-Onto ontology BiGe-Onto is an ontology designed for modeling biodiversity and marine biogeography data [23]. Its main concept is an occurrence. Given that each census is a set of occurrences of SES at a specific time and place, we consider BiGe-Onto fits the nature of our data. At the same time, it reuses different vocabularies such as Darwin Core (DwC) [22], which is the core one in BiGe-Onto. Main reused classes are dwc:Occurrence, dwc:Taxon, dwc:Organism, and dwc:Event. Moreover, BiGe-Onto reuses foaf:Person void:Dataset and dc:Location, among others.
Since BiGe-Onto mainly describes occurrences, which depend on other concepts to exist, we also outline below some of the most important properties defined for relating such occurrences:
– bigeonto:associated: each occurrence is described based on the existence of an organism at a particular place and at a particular time. Organisms are related to a taxon by means of bigeonto:belongsTo.
– bigeonto:has_event: occurrences happen during a sampling event at a location given by bigeonto:has_location, which is also characterized with bigeonto:caracterizes by a specific environment. The relations between bigeonto:Environment and EnvO classes are primarily controlled by the Relations Ontology (RO)44 respectively.
– dwciri:recordedBy: this property provides information about people, groups, or organizations, who have recorded the occurrence. It is also reused from the DwC URI namespace and enables non-literal ranges for its analogous with DwC, dwc:recordedBy.
– dwciri:inDataset: This object property is provided to link a subject dataset record to the dataset which contains it.
The Quantity, Unit, Dimension and Type (QUDT) ontologies QUDT is a collection of OWL ontologies and vocabularies [9]. The QUDT schema defines the base classes, properties, and restrictions used for modeling physical quantities, units of measure, and their dimensions in various measurement systems. QUDT also contains a set of vocabularies to define units for different domains. We have reused the unit vocabulary that categorizes units in different classes. This vocabulary also provides individuals to identify units such as qudt:M for meter and qudt:DEG_C for Celsius degree.
GeoSPARQL ontology GeoSPARQL [18] is an Open Geospatial Consortium (OGC) standard for supporting the representation and querying of geospatial data on the Semantic Web. As such, it is based on the OGC’s Simple Features model, with some adaptations for RDF. GeoSPARQL designates a vocabulary for representing geospatial data in RDF, and it defines an extension to the SPARQL query language55 for processing them, together with both a small ontology for representing features66 and geometries,77 and a number of SPARQL query predicates and functions. All these definitions are derived from other OGC standards so that they are well grounded and documented. Using the new standard should ensure two things: (1) if a data provider uses the spatial ontology in combination with an ontology of their domain, these data can be properly indexed and queried in spatial RDF stores; and (2) RDF-compliant triple stores should be able to properly process the majority of spatial RDF data. This ontology is used to describe the location of each occurrence, and the beaches involved. We reuse the classes geo:Feature and geo:Geometry, and the associated properties, like geo:hasGeometry and geo:asWKT.
The W3C time ontology The W3C Time ontology [2] enables the description of time instants and intervals. Hence it may be useful when we need to describe the timestamp, or the time associated with the measurements made by the observers of the SES. We reuse the classes time:Interval and time:Instant, and their associated properties, such as time:hasBeginning, time:hasEnd, and time:inXSDDateTimeStamp.
FRBR-aligned Bibliographic Ontology (FaBiO) The aim of FaBiO [16] is recording and publishing descriptions of entities that are published or potentially publisable, and that contain or are referred to by bibligraphic references. Its classes are structured according to the FRBR schema of Works, Expressions, Manifestations and Items. Additional properties have been added to extends the FRBR data model by linking works and manifestations. Considering that both census observations and measurements of physical variables have been used to publish results in diverse scientific journals, we have chosen the ontology FaBIO for modeling the relationships between platforms and such publications. Our choice is based on the fact that FaBIO is one of the ontologies involved in the OpenCitations88 initiative, which promotes the use of open bibliographic data by the use of Semantic Web technologies. We reuse several classes to identify the kind of published document, for example fabio:JournalArticle, fabio:Book, fabio:BookChapter and fabio:Dataset. We also reuse some of their associated properties, like prism:doi and prism:publicationDate.
NERC and GoodRelations ontologies Additionally, we reuse the vocabulary for Oceanography known as Natural Environment Research Council (NERC) Vocabulary Server [12] developed by the British Oceanographic Data Center (BODC),99 which provides access to lists of standardized terms that cover a broad spectrum of disciplines relevant to Oceanography. In particular, we use the category P01 whose terms are used to describe individual measured phenomena and S10 category to describe the sex of biological entities. We also reuse the GoodRelations ontology [8] to model sensor brands, serial numbers and models.
It is important to highlight that the previous ontologies were chosen because many of them are W3C standards (such as SOSA/SSN and OWL Time) or standards of the Open Geospatial Consortium (OGC) such as GeoSPARQL and vocabularies that are widely used by the user community involved in the domain. (e.g. Darwin Core or NERC). In the absence of a standard ontology for a specific domain, we decided to use those that according to our knowledge, are the ones that are currently under development, provide support and the documentation is adequate, such as FaBIO and GoodRelations.
4.Data model and URIs
Based on the network of ontologies described in the previous section, we are now able to create a dataset containing all the individuals describing hydrographic profiles and occurrences taken during the censuses. Now we explain the decisions taken to create resource URIs and we provide examples of resource descriptions.
4.1.Resource URIs for hydrographic profiles
This subsection presents the main URI design decisions and conventions used. Table 4 provides a summary of the main types of URIs that we generate. The first column presents the type of resources. The second column indicates the associated class which types the resources. The last column contains the name pattern used to generate the resource URIs. The base URI for our dataset is http://linkeddata.cenpat-conicet.gob.ar/resource/. Its prefix is base. Our generic name pattern to produce URIs for each object is baseURI +“/”+ nameOfClass +“/”+ objectIdentifier.
Table 4
URI generation templates for resources. First part of the table describes the patterns of URIs related to hydrographic profiles, while the second describes those related to occurrence data. Longitud and latitude numbers are expressed in decimal
| Object | Class | URI pattern |
| SES Platform | sosa:Platform | base:platform/{sesID} |
| TDR | sosa:Sensor | base:sensor/{Sensor type}/id-{serialNumber} |
| Feature of Interest | sosa:FeatureOfInterest | base:featureOfInterest/sampleOfWaterColum/id-{DiveID} |
| Observable property | sosa:ObservableProperty | base:observableProperty/id-{DiveID}/avg_temp |
| | avg_depth | location | ||
| Instant | time:Instant | base:instant/{beginDive}T{beginTime} |
| Duration | time:Duration | base:duration/sampleID-{DiveID} |
| Interval | time:Interval | base:interval/sampleID-{DiveID} |
| Observation | sosa:Observation | base:observation/id-{DiveID}/avg_temp | avg_depth |
| | location | ||
| Result value | sosa:Result | base:result//id-{DiveID}/avg_temp | avg_depth |
| | location | ||
| Dive location | geo:Geometry | base:geometry/point_{logitude}_{latitude} |
| Census observation | dwc:Occurrence | base:occurrence/ID-{ObservationID} |
| Observation event | bigeonto:BioEvent | base:bioevent/ID-{ObservationID} |
| Location | dc:Location | base:geometry/{geometryType}_{longitude}_{latitude} |
| Observer | foaf:Person | base:person/{personID} |
| SES category | vocab:Category | base:category/{categoryCode} |
| Taxon | dwc:Taxon | base:taxon/{mirounga_leonina} |
| Related paper | fabio:Expression | base:paper/ID-{paperID} |
Fig. 1.
SES platform and TDR sensor description.
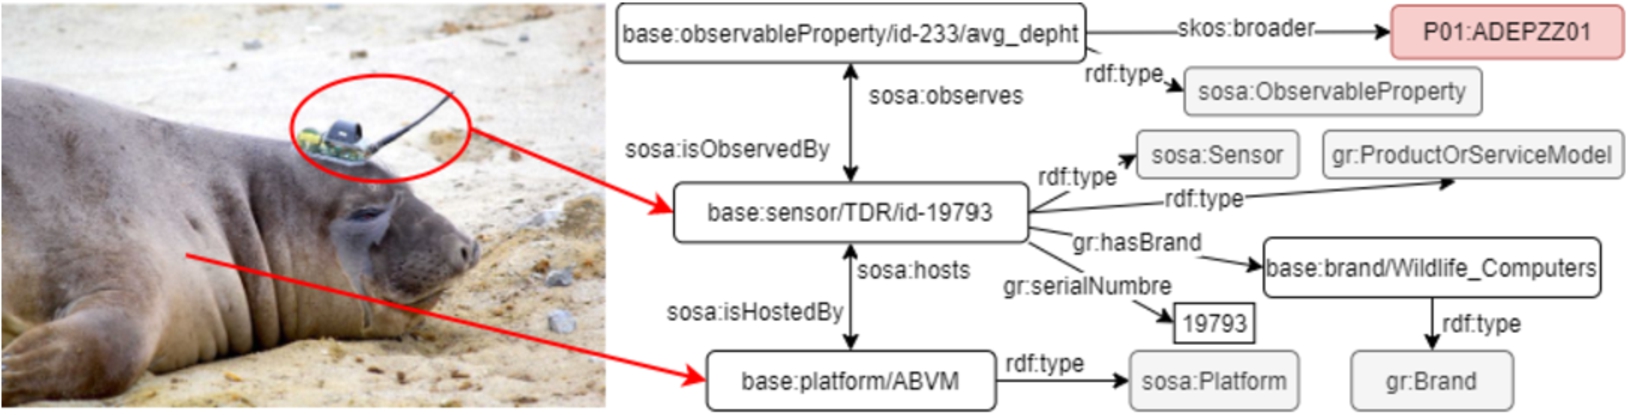
4.1.1.Platform and sensor
We consider SES as an oceanographic sampling platform. The individual that represents the platform is an instance of the sosa:Platform class. Each sensor hosted by the SES is represented by an instance of the class sosa:Sensor. Figure 1 presents the description of the TDR sensor. The TDR is identified by an URI generated using the sensor type, e.g. TDR plus the manufacturing number 19793. This URI is typed by the class sosa:Sensor. The sosa:host property links the sosa:Platform instance to the TDR URI. The sosa:observes property links the TDR URI to an instance of sosa:ObservableProperty; in this case it corresponds to depth. Additionally, the gr:ProductOrServiceModel class is used to model the sensor, and the gr:hasBrand property relates the sensor to its manufacturer, which is an instance of the gr:Brand class. Other properties such as gr:serialNumber and gr:category were reused to describe the type of sensor and its serial number. The link http://linkeddata.cenpat-conicet.gob.ar/resource/sensor/TDR/id-19793 can be used to explore visually the sensor URI.
4.1.2.Observation
An observation describes the context of a measurement made by a sensor. In the case of TDRs, the measurements are location, time, depth and temperature. Properties sosa:hasFeatureOfInterest, sosa:hasResult, sosa:observedProperty and sosa:madeBySensor link our specific observation with its corresponding observed property, location, sensor, and measurement value. We create an instance of sosa:FeatureOfInterest class that represents the sample of water column during dive. GeoSPARQL is used to describe the precise location of the SES during the dive. As shown in Fig. 2, the geometry of the trip made by the SES is a set of points expressed by a WKT string. This string is linked to a geo:Geometry instance by the geo:asWKT property. The geo:hasGeometry property links the sosa:Result instance to an instance of the geo:Geometry class. Visually exploring the obervation URI can be done through http://linkeddata.cenpat-conicet.gob.ar/page/observation/id-233/location.
Fig. 2.
Example of observation made by TDR on location of the sea.
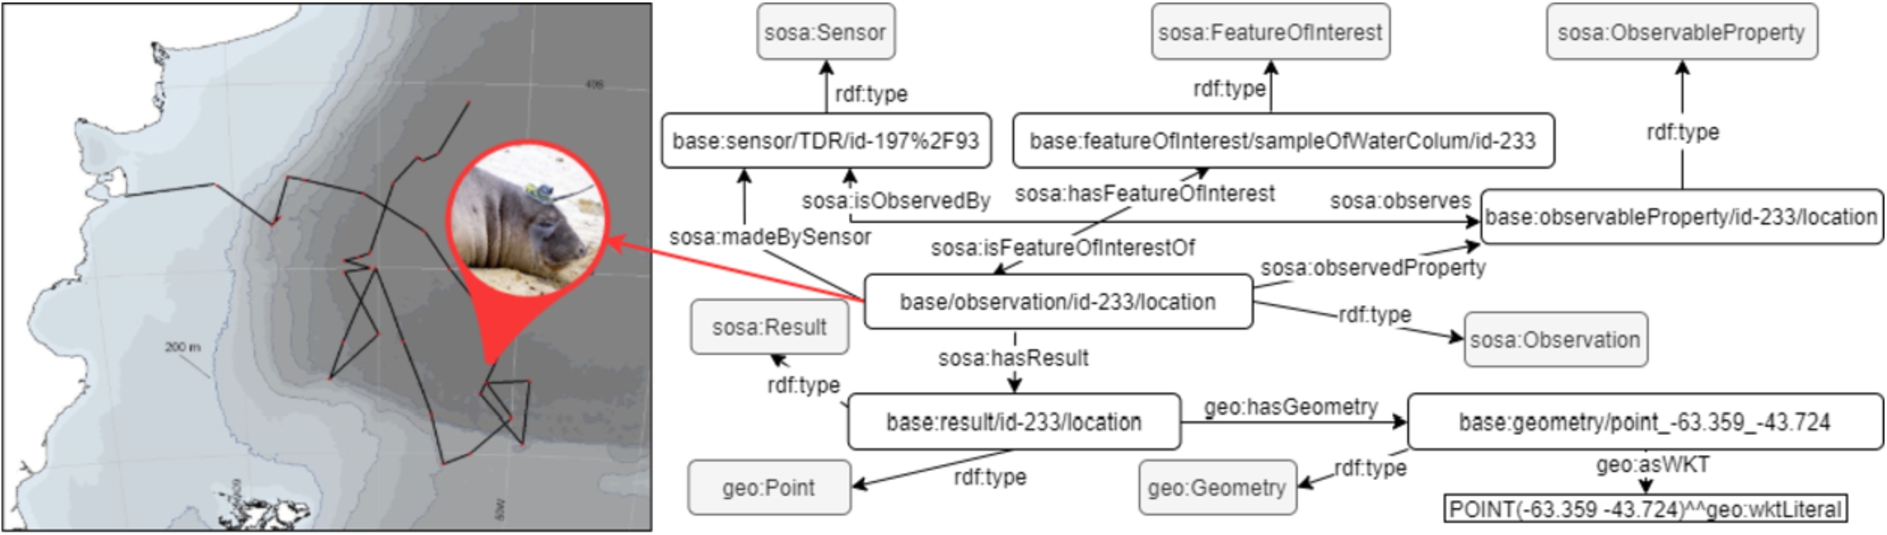
Fig. 3.
Example of an interval representing a dive of 10.94 seconds duration.
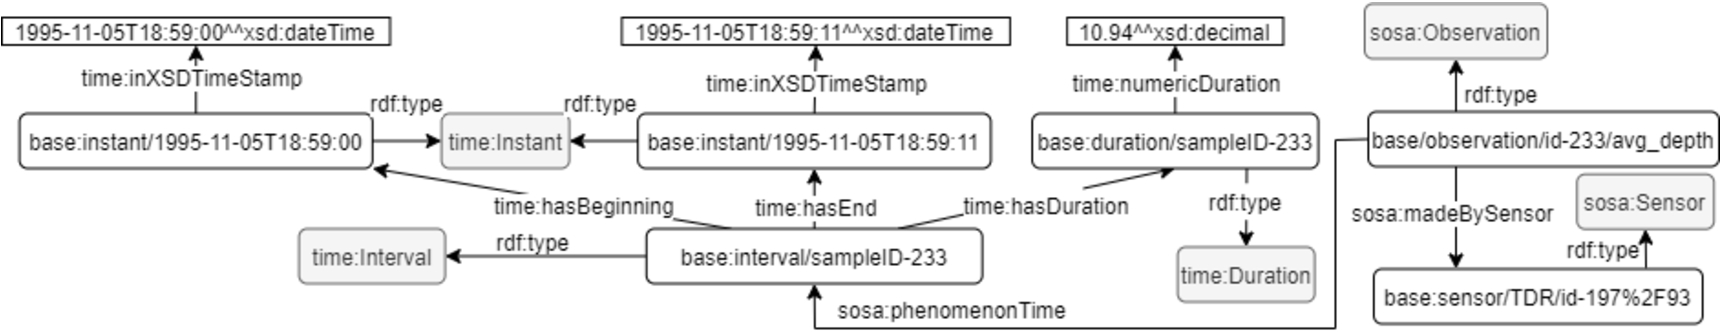
4.1.3.Phenomenon time
Figure 3 presents an observation produced by the TDR. Sometimes a measurement is related to a period of time. For example, the TDR measures the duration of a dive during a immersion. The property sosa:phenomenonTime links an instance of sosa:Observation to an instance of the class time:Interval. The properties time:hasEnd and time:hasBeginning point to an instance of the class time:Interval. To connect an instance of time:Instant with a xsd:dateTime value we use the time:inXSDDateTimeStamp property. The duration of the interval is described as instances of the class time:Duration. To explore the phenomenon time URI visually use the link http://linkeddata.cenpat-conicet.gob.ar/page/interval/sampleID-233
Fig. 4.
Representation of an observation (dwc:occurrence) made during a census. The occurrence of an SES is performed by a person at a location and time. Links to Geonames, DBPedia, Wikidata, and ORCID are shown highlighted.
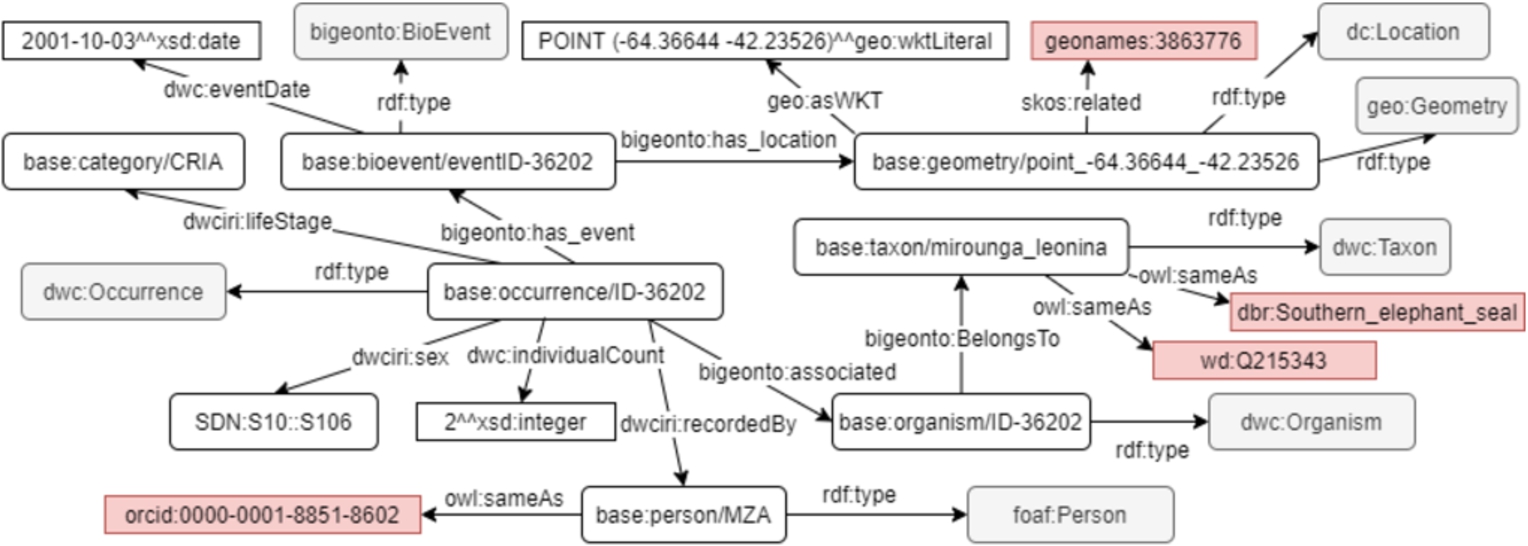
4.1.4.Occurrence
It is true that we can model the SES census using SOSA/SSN because sosa:Sensor can be an observation made by a human instead of an electronic equipment. Thus, we decided not to use SOSA/SSN, and instead we used BiGe-Onto since it was created to model species occurrences by means of the DwC. We believe that if we want to share the results in an interdisciplinary way, it is necessary to respect the standard adopted by biodiversity community. Using DwC will also allow the reuse of this part of the dataset to perform more complex analyzes such as marine spatial planning. We use the class dwc:Occurrence to represent the SES observations made during a census. In Fig. 4 you can see the observation of two female pups on October 3, 2001. To represent gender we use the nerc’s URI (S10:S106). The property bigeonto:has_event connects the instance of occurrence with the instance of the event bigeonto:BioEvent. In the same way, each event instance is related to an instance of the geo:Geometry class through the bigeonto:has_location relationship. On the other hand, the dwciri:recordedBy property relates the instance of the occurrence to instances of the foaf:person class that perform the observation. Finally, the occurrence is associated with an instance of the class dwc:Organism through the bigeonto:associated property and the organism belongs to a specific taxon (dwc:Taxon) whose scientific name is Mirounga leonina. The red rectangles represent the links generated for the taxon in DBPedia and Wikidata, as well as the identifier of the person in ORCID. The link http://linkeddata.cenpat-conicet.gob.ar/page/occurrence/ID-36202 can be used to explore visually the occurence URI.
4.1.5.Publication
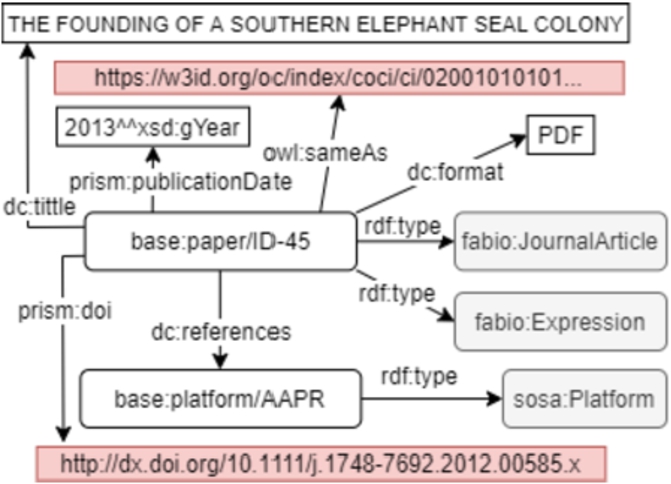
Each publication is represented as an instance of fabio:Expression. These expressions are also split by type of publication, thus using the respective subclasses of fabio:Expression. For instance, published books are represented with the class fabio:Book and so on. The shared properties for all the publications include date of publication (prism:publicationDate), title (dc:title), doi (prism:doi), authors (dc:creator), abstract (dc:abstract) and file format (dc:format). Finally, documents reference through dc:references to the respective platforms (sosa:platforms), which have been involved in the results reported in those documents. Figure 5 shows the modeling of a publication associated with a platform. To explore the publication URI visually use the link http://linkeddata.cenpat-conicet.gob.ar/page/paper/ID-45
Fig. 5.
Representation of a publication associated with the AAPR platform, the DOI is described using prism:doi and the external link (owl:sameAs) to OpenCitations was shortened for simplicity.
5.Data transformation process
To create Linked Open Data, a conversion needs to take place from the data contained in SES database into RDF. As explained in Section 2, measurements produced by sensors, and census data are stored in MySQL server. Fields that are no longer used or that contain confidential data are excluded, for example data that is still being processed. Transformation process is done by D2RQ Platform,1010 which consists of the D2RQ Mapping Language, used to write mappings between database tables and RDF vocabularies or OWL ontologies; the D2RQ Engine, a SPARQL-to-SQL rewriter that can evaluate SPARQL queries over your mapped database; and the D2R Server, a web application that provides access to the database via the SPARQL protocol, as Linked Data, and via a simple HTML interface. In order to see the complete mapping, one can use the link https://bitbucket.org/arglod/southern-elephant-seals/src/master/mappings/buceos.ttl to the project repository.
D2RQ runs at http://linkeddata.cenpat-conicet.gob.ar in back-end to browse structured data. It also has a SPARQL endpoint to be accessed from other applications, and a SPARQL explorer to query our own database in a friendly manner. One of the advantages that D2RQ provides is that after mapping, if the database is updated, it is not necessary to rewrite the mapping. Key statistics are presented in Table 5, and were computed in December 2020.
Table 5
Dataset key statistics
| Category | Resource |
| Total Nr. of Triples | 742k |
| Nr. of classes | 22 |
| Nr. of properties | 50 |
| Nr. of platforms | 9 |
| Nr. of sensors | 9 |
| Nr. of observations | 9.543 |
| Nr. links to DBPedia | 1 |
| Nr. links to Wikidata | 1 |
| Nr. links to GeoNames | 10 |
| Nr. links to NERC | 2 |
| Nr. links to ORCID | 7 |
| Nr. links to OpenCitations | 13 |
5.1.Interlinking
The external links were generated manually, using a MySQL table specifically created for this purpose, which is then mapped using D2RQ. This table has in one column the URI of some concept belonging to our data set, and in another column the equivalent URI that references the external dataset. For example, http://linkeddata.cenpat-conicet.gob.ar/resource/person/MZA in one column, and in the other the equivalent URI (https://orcid.org/0000-0001-8851-8602) that represents the same person in Open Researcher and Contributor Identifiers (ORCiD).
When possible, in the case of publications, the instances of fabio:Expression class were linked to OpenCitation dataset [17] as Fig. 5 shows. The relationship between these URIs is done using owl:sameAs property. The instances of observable properties were linked to their corresponding URI in NERC through the skos:broader property. For example, average depth is related to http://vocab.nerc.ac.uk/collection/P01/current/ADEPZZ01, as shown in Fig. 1.
We use Geonames,1111 a geographical database that contains over 11.8 million geographical names, as a source of external links for places. The structure behind the data is the Geonames ontology v3.2 ,1212 which closely resembles the flat-file structure. An individual in the database is an instance of type Feature and has a Feature Class (administrative divisions, populated places, etc.), a Feature Code (subcategories of Feature Class) along with latitude, longitude, etc. associated with it. For censuses where locations are recorded, for example a beach (instances of geo:Feature and dc:Location) the link to Geonanes is generated through skos:related property. An example of this can be seen in Fig. 4, the location corresponds to a beach located in the PV called Punta Buenos Aires whose identifier is https://www.geonames.org/3863776.
To link instances of people (foaf:person) we use links to ORCiD [5]. They are intended to uniquely identify researchers so that those individuals can be correctly credited for their research work, and links can be provided to express their professional affiliations, as shown in Fig. 4. By September 2020, 34 external links to different datasets have been created.
5.2.Dataset availability
The SES dataset can be downloaded, navigated and queried using a SPARQL endpoint, and they are published under Creative Commons Universal Public Domain Dedication (CC0 1.0)1313 License. All the criteria for five star Linked Data as defined in [11] are met. There is a description of the data online, the data is available in RDF, there are many links to structured vocabularies, and metadata about the collection is made available. Our dataset characteristics are listed in Table 6.
Table 6
Technical details
To explore the dataset using the SPARQL endpoint, we have developed a set of queries to answer the most common questions that researchers need to answer. For example, number of dives, trips, and values of certain environmental variables. Table 7 shows the developed queries and their corresponding links to the endpoint.
Table 7
Predefined queries to explore the data set
| Query | Link |
| Sensors associated with each platform | Query 1 |
| Number of dives made by each platform | Query 2 |
| Temperatures sampled by the ABVM platform | Query 3 |
| Locations, depths and dates registered by ABVM | Query 4 |
| Papers associated with each platform | Query 5 |
| 1990 census grouped by SES categories | Query 6 |
6.Use case: Accessing and analyzing data from dives and censuses
One crucial aspect is how to access and analyze data, and especially how to get only that part of data which is of interest for a given research question. To show the exploitation of the dataset, we developed a dashboard 1414 that allows querying the statistics of the dives and the taken routes. We use the R flexdashboard1515 package that allows generating web pages based on an R Markdown1616 document. To query our endpoint we use the SPARQL Package1717 that allows to import directly results of SPARQL SELECT queries into the statistical environment of R as a data frame. The following describes each module of the dashboard.
Diving statistics | This module summarizes the diving statistics (maximum depths recorded, number of dives, maximum temperatures and number of platforms). The information for each of the sensors used is also detailed. For bar charts, the ggplot1818 library was used. |
Dive Analysis | this module allows you to see by platform the most important variables registered during dives. Temperatures and depths, as well as duration can be displayed. The line chart was built using the plot_ly library.1919 |
Platforms trips | This module retrieve the trips made by each platform and displays them on a map generated with the leaflet library,2020 a filter can be made for each one if necessary. A spatial cluster analysis using the dbscan2121 algorithm is also provided to understand the distribution of SES at sea. The parameters can be configured by the user for their best adjustment. |
Census statistics | This module allows analyzing the data of the census carried out during 1990 to 2017. Two charts were developed with ggplot, the first shows the annual population of SES grouped by category, while the second shows the trend of the SES breeding population. |
7.Discussion
This paper presents the publication as LOD of a biological and physical dataset, collected for more than 20 years, and stored with early objective of studying the environment influence on the foraging, reproductive performance, and population trend of the SES. This dataset was initially available for a small research group, and the aim is to make it available to a global community. Our development improves the discoverability of the content of the database and could be applied at new knowledge-building and cross-disciplinary research. For example, we expect the hydrographic profiles become a useful tool together with physical samples resulting from other science programs, to assess ocean changes associated with the climate change.
The dataset comes from PV a geographic region under conservation regulations by UNESCO and there is a continue demand of the governmental authorities to develop spatial planning. This requirement helps the sustainability of the database, because it needs a high level of accuracy for SES data, and access at other databases in a user-friendly manner. Coastal management Planning and Marine Spatial Planning (MSP) are concerned with the management of the distribution of human activities in space and time in and around seas and oceans to achieve ecological, economic and societal objectives and outcomes [3]. The next steps will be to promote the use vocabulary terms for discovery databases purposes of the institute CESIMAR, to allow the availability and suitability of data, to be used at regular review cycles of the MSP process. In addition, it would be desirable to access to the physical dataset collected by tourist and commercial vessels that overlap the same range in the southwest Atlantic Ocean. These hydrographic profiles could cover changes of the environment in all influence area of the SES distribution.
Particularly, this work shows the feasibility of using the SSN/SOSA ontology for modeling hydrographic measurements of instrumented animals and observation data collected during censuses. SSN/SOSA ontology is already a W3C standard, then we find this analysis as a valuable step towards the definition of the precise semantics of the ocean biodiversity systems, which requires of a collaborative effort.
The research also provides us useful insights into the process of developing and publishing data as LOD. First of all, valuable raw data can be highly heterogeneous and, as it was in this case, stored in relational databases developed by third parties, and even no longer maintained. Therefore, understanding how these data have been structured is one of the first barriers. Automated processes for bootstrapping SPARQL-to-SQL mappings, as those provided by the very same D2RQ or related technologies, fail in their attempts to automatically generate such mappings based on the content of data sources. Thus, much of this work have to done manually.
Ontology reusing is another challenging task, particularly in the context where standard ontologies have not been developed yet. Thus, our process required of a trade-off between the needed conceptualization (concerning the domain) and the availability of reused ontologies. As defined in [4], the strategy to reuse ontologies is another important obstacle, reusing concepts or properties from external ontologies (soft reuse) seems to be a good strategy to bootstrap LOD datasets from scratch, but it is limited for reasoning purposes. As a consequence and looking toward the future works, other strategies must be considered to increase the expressiveness of model without introducing unnecessary complexity.
Notes
6 A feature is simply any entity in the real world with some spatial location.
7 A geometry is any geometric shape, such as a point, polygon, or line, and is used as a representation of a feature’s spatial location.
Acknowledgements
This work could not have been possible if it were not for the immense task of digitizing and ordering the data carried out by the Computer Scientist Maria Rosa Marin (recently retired). We grateful to PhD Claudio Campagna founder of the program for his vision of long lasting studies that allowed to keep the collection of records.
References
[1] | C. Campagna, A.R. Piola, M.R. Marin, M. Lewis and T. Fernández, Southern elephant seal trajectories, fronts and eddies in the Brazil/Malvinas Confluence, Deep Sea Research Part I, Oceanographic Research Papers 53: (12) ((2006) ), 1907–1924. doi:10.1016/j.dsr.2006.08.015. |
[2] | S. Cox and C. Little, Time Ontology in OWL, W3C Candidate Recommendation 26, (2020) , [Online; accessed 01-Sep-2020]. https://www.w3.org/TR/owl-time/. |
[3] | C. Ehler and F. Douvere, Marine Spatial Planning: A Step-by-Step Approach Toward Ecosystem-Based Management, Intergovernmental Oceanographic Commission and Man and the Biosphere Programme, (2009) . |
[4] | M. Fernández-López, M. Poveda-Villalón, M.C. Suárez-Figueroa and A. Gómez-Pérez, Why are ontologies not reused across the same domain?, J. Web Semant. 57: ((2019) ). doi:10.1016/j.websem.2018.12.010. |
[5] | L.L. Haak, M. Fenner, L. Paglione, E. Pentz and H. Ratner, ORCID: a system to uniquely identify researchers, Learn. Publ. 25: (4) ((2012) ), 259–264. doi:10.1087/20120404. |
[6] | A. Haller, K. Janowicz, S. Cox, D.L. Phuoc, K. Taylor and M. Lefrançois, Semantic Sensor Network Ontology, 2017, W3C Recommendation, [Online; accessed 01-Sep-2020]. https://www.w3.org/TR/2017/REC-vocab-ssn-20171019/. |
[7] | T. Heath and C. Bizer, Linked data: Evolving the web into a global data space, Synthesis lectures on the semantic web: theory and technology 1: (1) ((2011) ), 1–136. |
[8] | M. Hepp, GoodRelations: An ontology for describing products and services offers on the web, in: Knowledge Engineering: Practice and Patterns, 16th International Conference, EKAW 2008, Acitrezza, Italy, September 29 – October 2, 2008. Proceedings, A. Gangemi and J. Euzenat, eds, Lecture Notes in Computer Science, Vol. 5268: , Springer, (2008) , pp. 329–346. doi:10.1007/978-3-540-87696-0_29. |
[9] | R. Hodgson, P.J. Keller, J. Hodges and J. Spivak, QUDT-quantities, units, dimensions and data types ontologies, 2014, [Online; accessed 04-Sep-2020]. http://qudt.org/. |
[10] | K. Janowicz, A. Haller, S.J.D. Cox, D. Le Phuoc and M. Lefrançois, SOSA: A lightweight ontology for sensors, observations, samples, and actuators, Journal of Web Semantics 56: ((2019) ), 1–10. http://www.sciencedirect.com/science/article/pii/S1570826818300295. doi:10.1016/j.websem.2018.06.003. |
[11] | K. Janowicz, P. Hitzler, B. Adams, D. Kolas and C. Vardeman, Five stars of linked data vocabulary use, Semantic Web 5: (3) ((2014) ), 173–176. doi:10.3233/SW-140135. |
[12] | A. Leadbetter, R. Lowry and D. Clements, The NERC vocabulary server: Version 2.0, in: Geophysical Research Abstracts, Vol. 14: , (2012) . |
[13] | M. Lewis, C. Campagna and F. Quintana, Site fidelity and dispersion of southern elephant seals from Patagonia, Marine Mammal Science 12: (1) ((1996) ), 138–147. doi:10.1111/j.1748-7692.1996.tb00312.x. |
[14] | M. Lewis, C. Campagna and J. Zavatti, Annual cycle and inter-annual variation in the haul-out pattern of an increasing southern elephant seal colony, Antarctic Science 16: (3) ((2004) ), 219–226. doi:10.1017/S0954102004002020. |
[15] | M.N. Lewis and C. Campagna, Los elefantes marinos de Península Valdés, Ciencia Hoy 1: ((2014) ), 187–194. |
[16] | S. Peroni and D. Shotton, FaBiO and CiTO: Ontologies for describing bibliographic resources and citations, Journal of Web Semantics 17: ((2012) ), 33–43. http://www.sciencedirect.com/science/article/pii/S1570826812000790. doi:10.1016/j.websem.2012.08.001. |
[17] | S. Peroni and D.M. Shotton, OpenCitations, an infrastructure organization for open scholarship, Quant. Sci. Stud. 1: (1) ((2020) ), 428–444. doi:10.1162/qss_a_00023. |
[18] | M. Perry and J. Herring, OGC GeoSPARQL-A Geographic Query Language for RDF Data, OGC Implementation Standard, (2012) . http://www.opengis.net/doc/IS/geosparql/1.0. |
[19] | C. Rutz and G.C. Hays, New frontiers in biologging science, Biology Letters 5: (3) ((2009) ), 289–292. http://rsbl.royalsocietypublishing.org/content/5/3/289. doi:10.1098/rsbl.2009.0089. |
[20] | T. Tanhua, S. Pouliquen, J. Hausman, K. O’Brien, P. Bricher, T. de Bruin, J.J.H. Buck, E.F. Burger, T. Carval, K.S. Casey, S. Diggs, A. Giorgetti, H. Glaves, V. Harscoat, D. Kinkade, J.H. Muelbert, A. Novellino, B. Pfeil, P.L. Pulsifer, A. Van de Putte, E. Robinson, D. Schaap, A. Smirnov, N. Smith, D. Snowden, T. Spears, S. Stall, M. Tacoma, P. Thijsse, S. Tronstad, T. Vandenberghe, M. Wengren, L. Wyborn and Z. Zhao, Ocean FAIR Data Services, Frontiers in Marine Science 6: ((2019) ), 440. doi:10.3389/fmars.2019.00440. |
[21] | UNESCO, Península Valdés World Heritage, 1999, [Online; accessed 17-Apr-2020]. https://whc.unesco.org/en/list/937. |
[22] | J. Wieczorek, D. Bloom, R. Guralnick, S. Blum, M. Döring, R. Giovanni, T. Robertson and D. Vieglais, Darwin core: An evolving community-developed biodiversity data standard, PLoS ONE ((2012) ). ISBN 1932-6203 (Linking). doi:10.1371/journal.pone.0029715. |
[23] | M. Zárate, G. Braun, P.R. Fillottrani, C. Delrieux and M. Lewis, BiGe-Onto: An ontology-based system for managing biodiversity and biogeography data, Applied Ontology journal ((2019) ). doi:10.3233/AO-200228. |


