
Effect of task factors on the heart rate recovery time in a lifting task
Abstract
BACKGROUND:
There is an extensive body of research reviewing the effect of task factors on the Maximum Acceptable Weight of Lift (MAWL) or heart beats elevation as a result of a manual material handling task. However, there are now studies that investigate the effect of task factors on the heart rate recovery time (HRR).
OBJECTIVE:
The purpose of the study was twofold: (1) to determine the HRR for a series of lifting tasks based on the activity heart rate and by using a set of task variables, (2) to compare the effect of three task factors on the HRR following a lifting task.
METHODS:
This research was constituted of capturing the duration that heart rate needs to get to a steady state following a lifting task, along with conducting the survey of perceived exertion (Borg). Three independent variables of this study (task-factors) were weight of the lift (10 and 20 kg), frequency of the lift (6 and 9 lifts per minute), and the duration of the lift (5 and 10 minutes). Given the possible treatment combinations, a total of 8 treatments was obtained. Twenty-four university male students performed the lifting tasks in a between-subject design. Each participant performed one treatment by lifting a box from knuckle to shoulder height at a certain frequency, duration and weight. All eight treatments were equally replicated with three observations per treatment group.
RESULTS:
Increasing weight and frequency of the lift significantly increased the HRR (respectively by 37% and 34%), while the HRR had a slight decrease when duration was doubled (approximately
CONCLUSIONS:
Among main factors, frequency and weight of the lift had a significant effect on the HRR (p-values
1.Introduction
Musculoskeletal disorders (MSDs) are injuries of muscles, tendons, ligaments, joints, and nerves which can affect almost all tissues and most often involve the arms and back [1, 2]. Work-related musculoskeletal disorders (WMSDs) are conditions in which the work environment or performance contribute to MSD [3]. According to OSHA [4], WMSDs are a leading cause of pain, suffering, and disability in American workplaces. In 2014, MSDs accounted for 32% of all injury and illness cases at the workplace [5]. According to the same article, in 2014 there were 365,580 cases of musculoskeletal disorders with an incident rate of 33.8 cases per 10,000 full-time workers which resulted in a median of 13 days away from work per person.
Some professions sustain higher rates of injury than others. For example, laborers and freight, stock, and material movers; nursing assistants, and heavy truck and tractor-trailer drivers incurred a higher number of MSDs in 2015 than any other profession [6]. In addition to causing acute and chronic health problems to workers, MSDs result to high costs. Annual costs for MSD related workers’ compensation is estimated to be about $20 billion a year for direct costs and $100 billion for indirect costs [4]. Direct costs are related to the actual cost of treatment and clinical cost and indirect costs are related to the impact of injury, lost earnings, the cost of time off work, and the burden on the economy [7, 8]. In addition to physical injuries, research shows that workers who have prolonged absence from work as a result of MSD, are prone to suffer from psychological distress and disorders [9].
Manual material handling (MMH) tasks are inseparable parts of many industries and in many cases human physical input is needed in performing such tasks. MMH can be defined as moving objects from an origin to a destination by using body parts especially the hands. Generally speaking, there are two main types of manual material handling tasks: individual tasks and combined tasks [10]. Examples of individual tasks are pushing, holding, pulling, lowering and lifting, whereas combined tasks can be a mixture of two or more individual tasks [11]. According to Verbeek et al. [12], MMH tasks, especially lifting, are associated with a high risk of lower back pain (LBP). Research shows that 70–85% of the population experience back pain at some point in their lives and about 2% of the US workforce are compensated for back injuries each year [13].
Repetition and overexertion in a physical activity can cause muscle fatigue and are major risk factors leading to MSD [14]. Janaro and Bechtold [15] state that workplace fatigue, regardless of type (physical or psychological), can affect worker’s capacity and productivity. It is a known fact that fatigue can deteriorate productivity and work quality, increase the number of work errors and lead to workplace injury [16, 17]. Bhatia and Murrell [18] discuss the effectiveness of proper rest breaks on worker productivity and fatigue reduction. Considering that there is an association between muscle fatigue and task performed [19] and that excessive fatigue at workplace can affect workers’ health, productivity and safety [20], serious efforts need to be made in finding proper rest schedules that not only ensures workers well-beings, but also helps with lowering the economic burden of MSDs on society.
Several MMH studies have investigated task factors that significantly affect response variables such as Maximum Acceptable Weight of Lift (MAW), or heart rate elevation. However, no research has focused on studying the effect of task factors on the recovery time in an MMH task. This research intended to study the effects of three task-factors on the heart rate recovery time (HRR). The first objective was to determine the HRR by conducting a series of lifting experiment, and the secondary objective was to determine the effect of each factor on the HRR.
2.Methods
2.1Participants
Twenty-four male students from Louisiana State University (LSU) between the ages 20–37 participated in this study. Participants were selected on a volunteer basis. Due to the use of human subjects, a permission from LSU institutional review board (IRB) was obtained and each participant had to read and sign the consent form before performing the experiment. The full demographic data for participants is presented in Table 1.
Table 1
Participant data summary
| Data | Average | S.D | Data | Average | S.D |
|---|---|---|---|---|---|
| Age | 22.5 | 3.2 | Shoulder height (cm) | 147.6 | 5.7 |
| Height (cm) | 177.9 | 5.8 | BMI | 25 | 3.2 |
| Weight (kg) | 79.4 | 12.4 | Grip strength (kg) | 45 | 9.2 |
| Knuckle height (cm) | 77.8 | 4.2 | Static strength (kg) | 26.7 | 6.8 |
2.2Apparatus
A wooden platform with adjustable shelves was used for the lifting task. The bottom shelf was adjusted to the average knuckle height (77.8 cm) and the top shelf was adjusted to the average shoulder height (147.6 cm) of test participants.
A wooden crate was used to hold various weights. The crate measures 45.5 cm
A variety of weights were used to fill the crate as part of the experiment for each participant to perform a lifting task with a certain weight (10 or 20 kg).
In order to alert a participant of the cycles (frequencies) of a lifting task, an iPhone application named Gymboss Interval Timer was used.
A Bluetooth heart rate monitor (Polar H7, USA) was worn by each participant throughout the experiment (attached to the chest). This device transmits data to a smartphone interface (Polar app) and the collected data (participant’s heart beats) can be transferred to Microsoft Excel.
Table 2
Treatment combinations
| Treatment # | Frequency (lifts/minute) | Duration (min) | Weight (kg) |
| 1 | 6 | 5 | 10 |
| 2 | 9 | 5 | 10 |
| 3 | 6 | 5 | 20 |
| 4 | 9 | 5 | 20 |
| 5 | 6 | 10 | 10 |
| 6 | 9 | 10 | 10 |
| 7 | 6 | 10 | 20 |
| 8 | 9 | 10 | 20 |
2.3Experimental design
A 2
The main response variable of this study was the HRR which was the duration following a lifting task that the heart needs to reach a steady state.
The secondary response variable was the perceived level of exertion. A common method in rating the perceived difficulty of a manual task is the use of Borg scale [22]. The original Borg Scale ranges from 6 to 20 points. A modified version of Borg Scale called Borg CR10 was used in this study, which employs a response format that ranges from a value of 0 (no exertion at all) to 10 (maximal exertion). After each lifting task participants were asked to rate the difficulty of the task from 0 to 10. A copy of the Borg CR10 is presented in Appendix A.
2.4The lifting task
The task consisted of repetitive freestyle lifting of a box from knuckle to the shoulder height, while no lowering was required. A helper lowered the box from the other side of the lifting apparatus throughout the experiment. Lifting was chosen due to the fact that is pervasively used in material handling despite advancements in work mechanization [23]. Each person performed the lifting for a predetermined amount of weight, with a specific frequency, and over a certain amount of time (for example, “lift 10 kg for 10 minutes at 6 lifts per minute”). The participant began the lifting with the activation of the interval timer. Two responses were captured as a result of the lifting task: HRR and Borg scale. Upon completion of a lifting task, the participant was asked to sit and relax with no distraction (cell phone use, eating, taking, etc.) for 10 minutes. The heart rate activity of each participant was monitored before, during, and after a lifting task by the heart rate monitor.
2.5Heart rate data processing
Pulat [24] explains in a sub-maximal physical activity, the heart rate is at a stable range before the activity and will reach to a steady high level while the activity is in progress. Upon finishing the activity, the heart rate will reach to some steady state (Fig. 1). However, based on the nature of the task and individual characteristics, the heart rate might not return to the same steady state as in the pre-activity phase and remains at a range above the resting level for some time [25]. Discovering the duration reaching a steady state after the completion of a lifting task was of the interest of this experiment. The steady state was defined as a phase on the heartbeat graph that the heartbeats form a semi-horizontal line while fluctuating withina 10% range. The minimum length (time) for a phase to be considered “steady”, was decided to be 2 minutes. The heart rate monitor used in this study captured a reading (data point) for every second. In order to find the HRR, the graph of heart rate against time was drawn in Excel and a smoothing algorithm with moving average of 30 seconds was applied to the graph. Then, the recovery duration was determined using the Excel gridlines.
Figure 1.
Heart rate in a sub-maximal physical activity (adopted from Pulat, 1997).
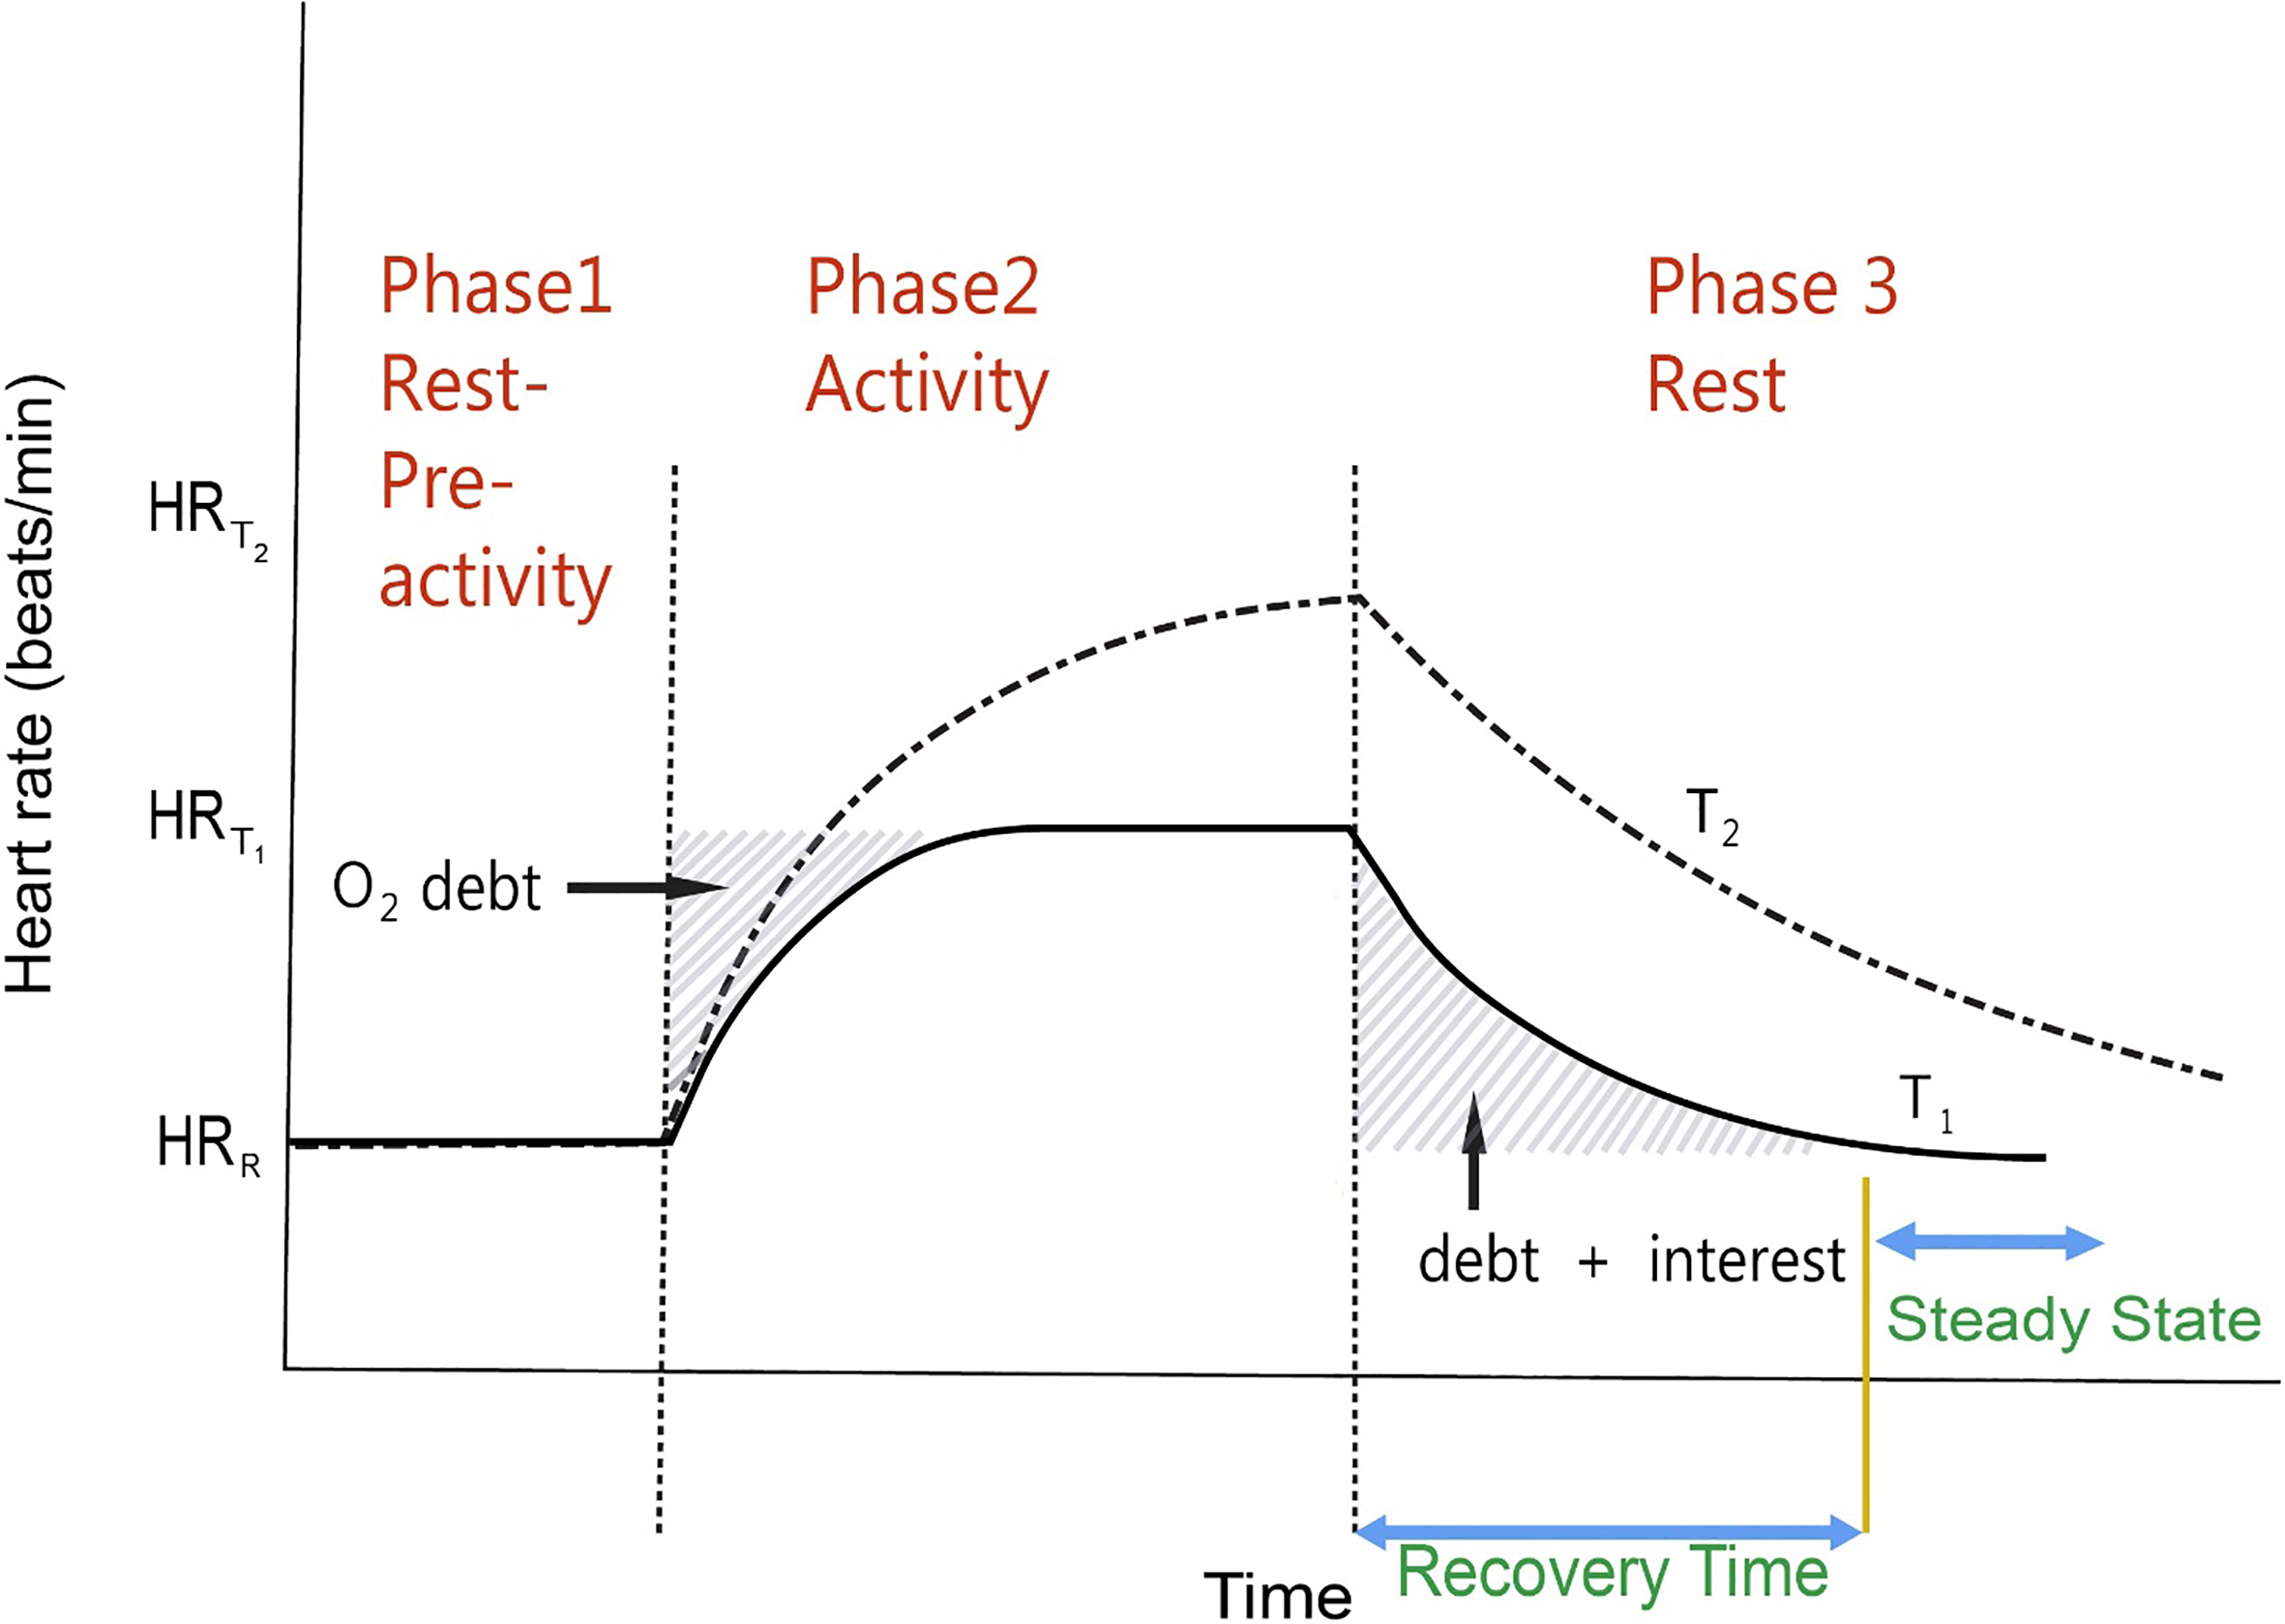
Table 3
Participant data summary
| ID | Day | Lift weight | Lift frequency | Lift duration | Treatment | Recovery | Borg |
| (kg) | (lifts/minute) | (min) | # | time (min) | rating | ||
| 1 | 1 | 10 | 9 | 10 | 6 | 3 | 7 |
| 2 | 1 | 20 | 9 | 5 | 4 | 2.42 | 7 |
| 3 | 1 | 10 | 6 | 10 | 5 | 1.08 | 5 |
| 4 | 1 | 20 | 9 | 10 | 8 | 2.25 | 8 |
| 5 | 1 | 10 | 6 | 5 | 1 | 2.25 | 3 |
| 6 | 1 | 20 | 6 | 10 | 7 | 1.25 | 3 |
| 7 | 1 | 10 | 9 | 5 | 2 | 1.50 | 6 |
| 8 | 1 | 20 | 6 | 5 | 3 | 1 | 7 |
| 9 | 2 | 20 | 9 | 5 | 4 | 2.63 | 7 |
| 10 | 2 | 10 | 6 | 5 | 1 | 1.50 | 7 |
| 11 | 2 | 10 | 9 | 5 | 2 | 1.50 | 7 |
| 12 | 2 | 10 | 6 | 10 | 5 | 1.50 | 6 |
| 13 | 2 | 20 | 6 | 10 | 7 | 2 | 10 |
| 14 | 2 | 20 | 9 | 10 | 8 | 3 | 6 |
| 15 | 2 | 20 | 6 | 5 | 3 | 3 | 8 |
| 16 | 2 | 10 | 9 | 10 | 6 | 1.50 | 5 |
| 17 | 3 | 20 | 9 | 5 | 4 | 3.50 | 6 |
| 18 | 3 | 10 | 9 | 10 | 6 | 3 | 7 |
| 19 | 3 | 20 | 9 | 10 | 8 | 3.50 | 7 |
| 20 | 3 | 20 | 6 | 10 | 7 | 2.50 | 8 |
| 21 | 3 | 10 | 6 | 10 | 5 | 1 | 6 |
| 22 | 3 | 10 | 9 | 5 | 2 | 2 | 7 |
| 23 | 3 | 20 | 6 | 5 | 3 | 3 | 8 |
| 24 | 3 | 10 | 6 | 5 | 1 | 2 | 5 |
3.Results
Table 3 shows the acquired raw data for the two independent (HRR and Borg scale). In order to assess the effects of main factors (frequency, duration, weight) and their interactions on the HRR and Borg scale, a Mixed Model ANOVA was performed in SAS Enterprise Guidesoftware. The significance level (
3.1HRR
First, the average recovery time among the two levels of each factor along with their percentage change was calculated (Table 4). Based on the results of this table, by doubling the weight of the lift from 10 kg to 20 kg, the average HRR increased by 37.4%, and by increasing the frequency from 6 lifts/minute to 9 lifts/minute the average HRR increased by 34.8%. On the other hand, we observe a 2.7 decrease in the HRR when lift duration increased from 5 minutes to 10 minutes.
Table 4
Average recovery time among different levels of each factor
| Factor | Level | HRR (min) | Percentage change |
|---|---|---|---|
| Weight | 10 | 1.82 | |
| 20 | 2.50 | ||
| Frequency (lpm) | 6 | 1.84 | |
| 9 | 2.48 | ||
| Duration (min) | 5 | 2.19 | |
| 10 | 2.13 |
A mixed model ANOVA for HRR values was conducted (Table 5). At 10% significance level, weight (F-value
Table 5
Mixed model ANOVA for the HRR (initial model)
| Type 3 Tests of Fixed Effects | ||||
| Effect | Num DF | Den DF | F Value | Pr |
| Weight | 1 | 14 | 8.11 | 0.0129 |
| Freq | 1 | 14 | 7.15 | 0.0181 |
| Dur | 1 | 14 | 0.06 | 0.8066 |
| Weight*Freq | 1 | 14 | 0.23 | 0.6399 |
| Weight*Dur | 1 | 14 | 0.23 | 0.6399 |
| Freq*Dur | 1 | 14 | 4.50 | 0.0523 |
| Weight*Freq*Dur | 1 | 14 | 1.24 | 0.2834 |
To further analyze the main effect of each lifting factor, the grand average of the HRR with respect to each individual lifting parameter (at two levels) was calculated and three linear graphs were drawn (Figs 2–4). The best-fit equations for each graph were obtained as follows:
Figure 2.
Effect of weight on HRR.
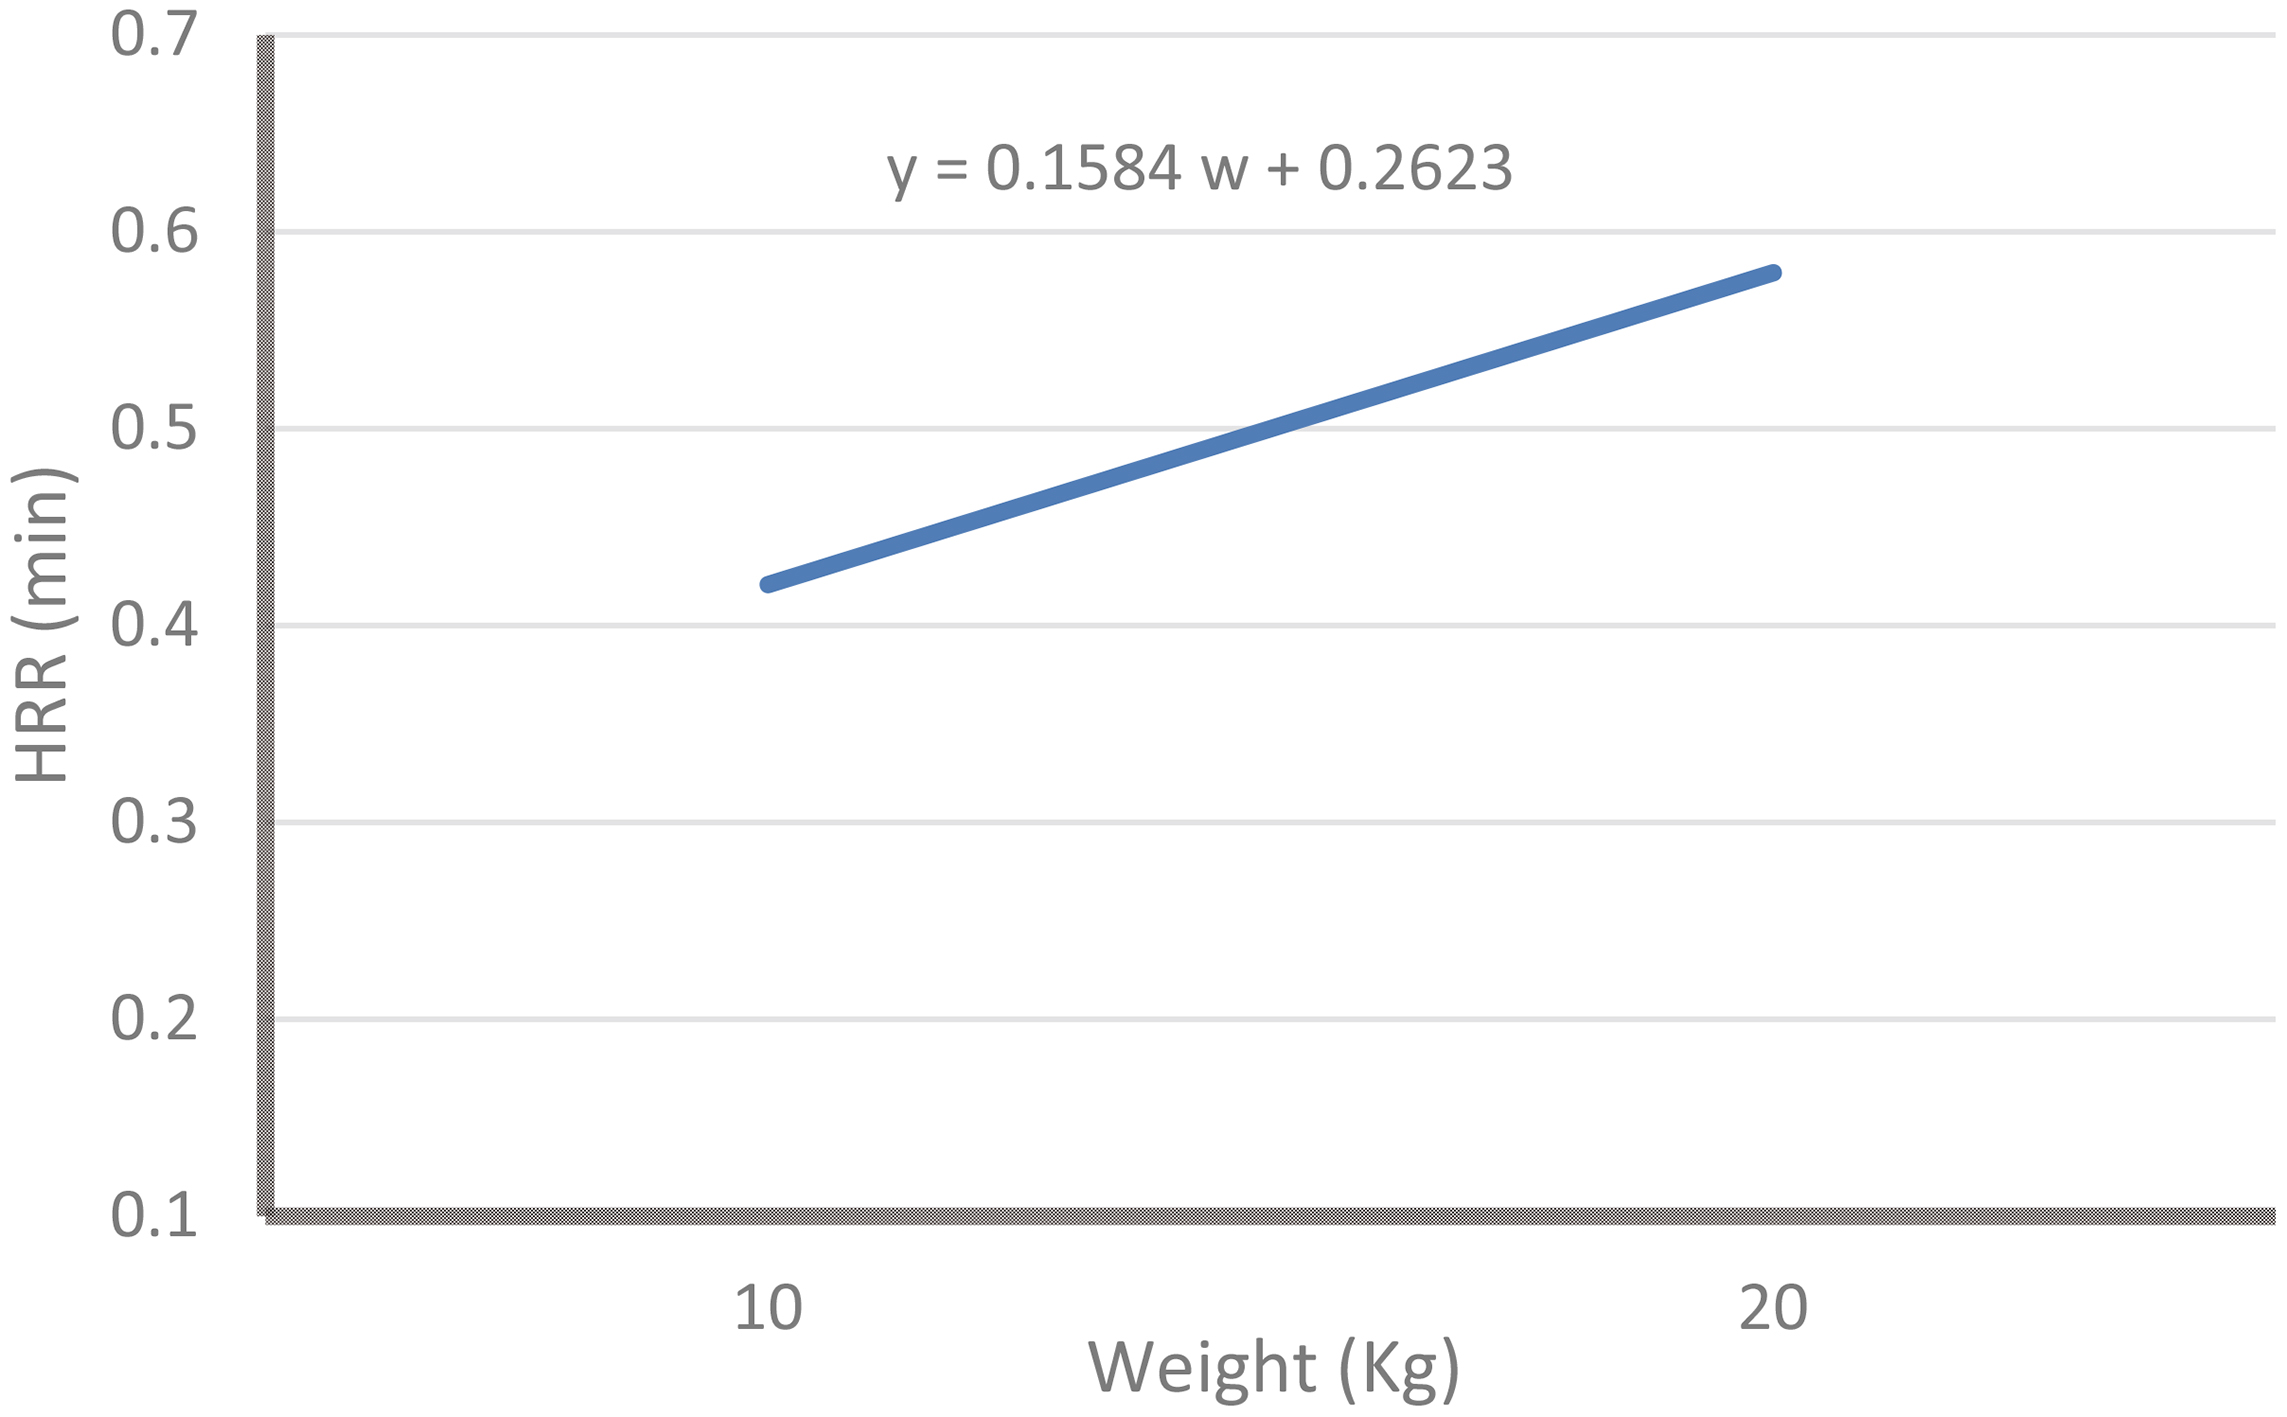
The best-fit equation of Fig. 2 for the average HRR based on two levels of weight is as follows:
HRR for weight response:
(1)
The best-fit equation of Fig. 3 for the average HRR based on two levels of frequency is as follows:
Figure 3.
Effect of frequency on HRR.
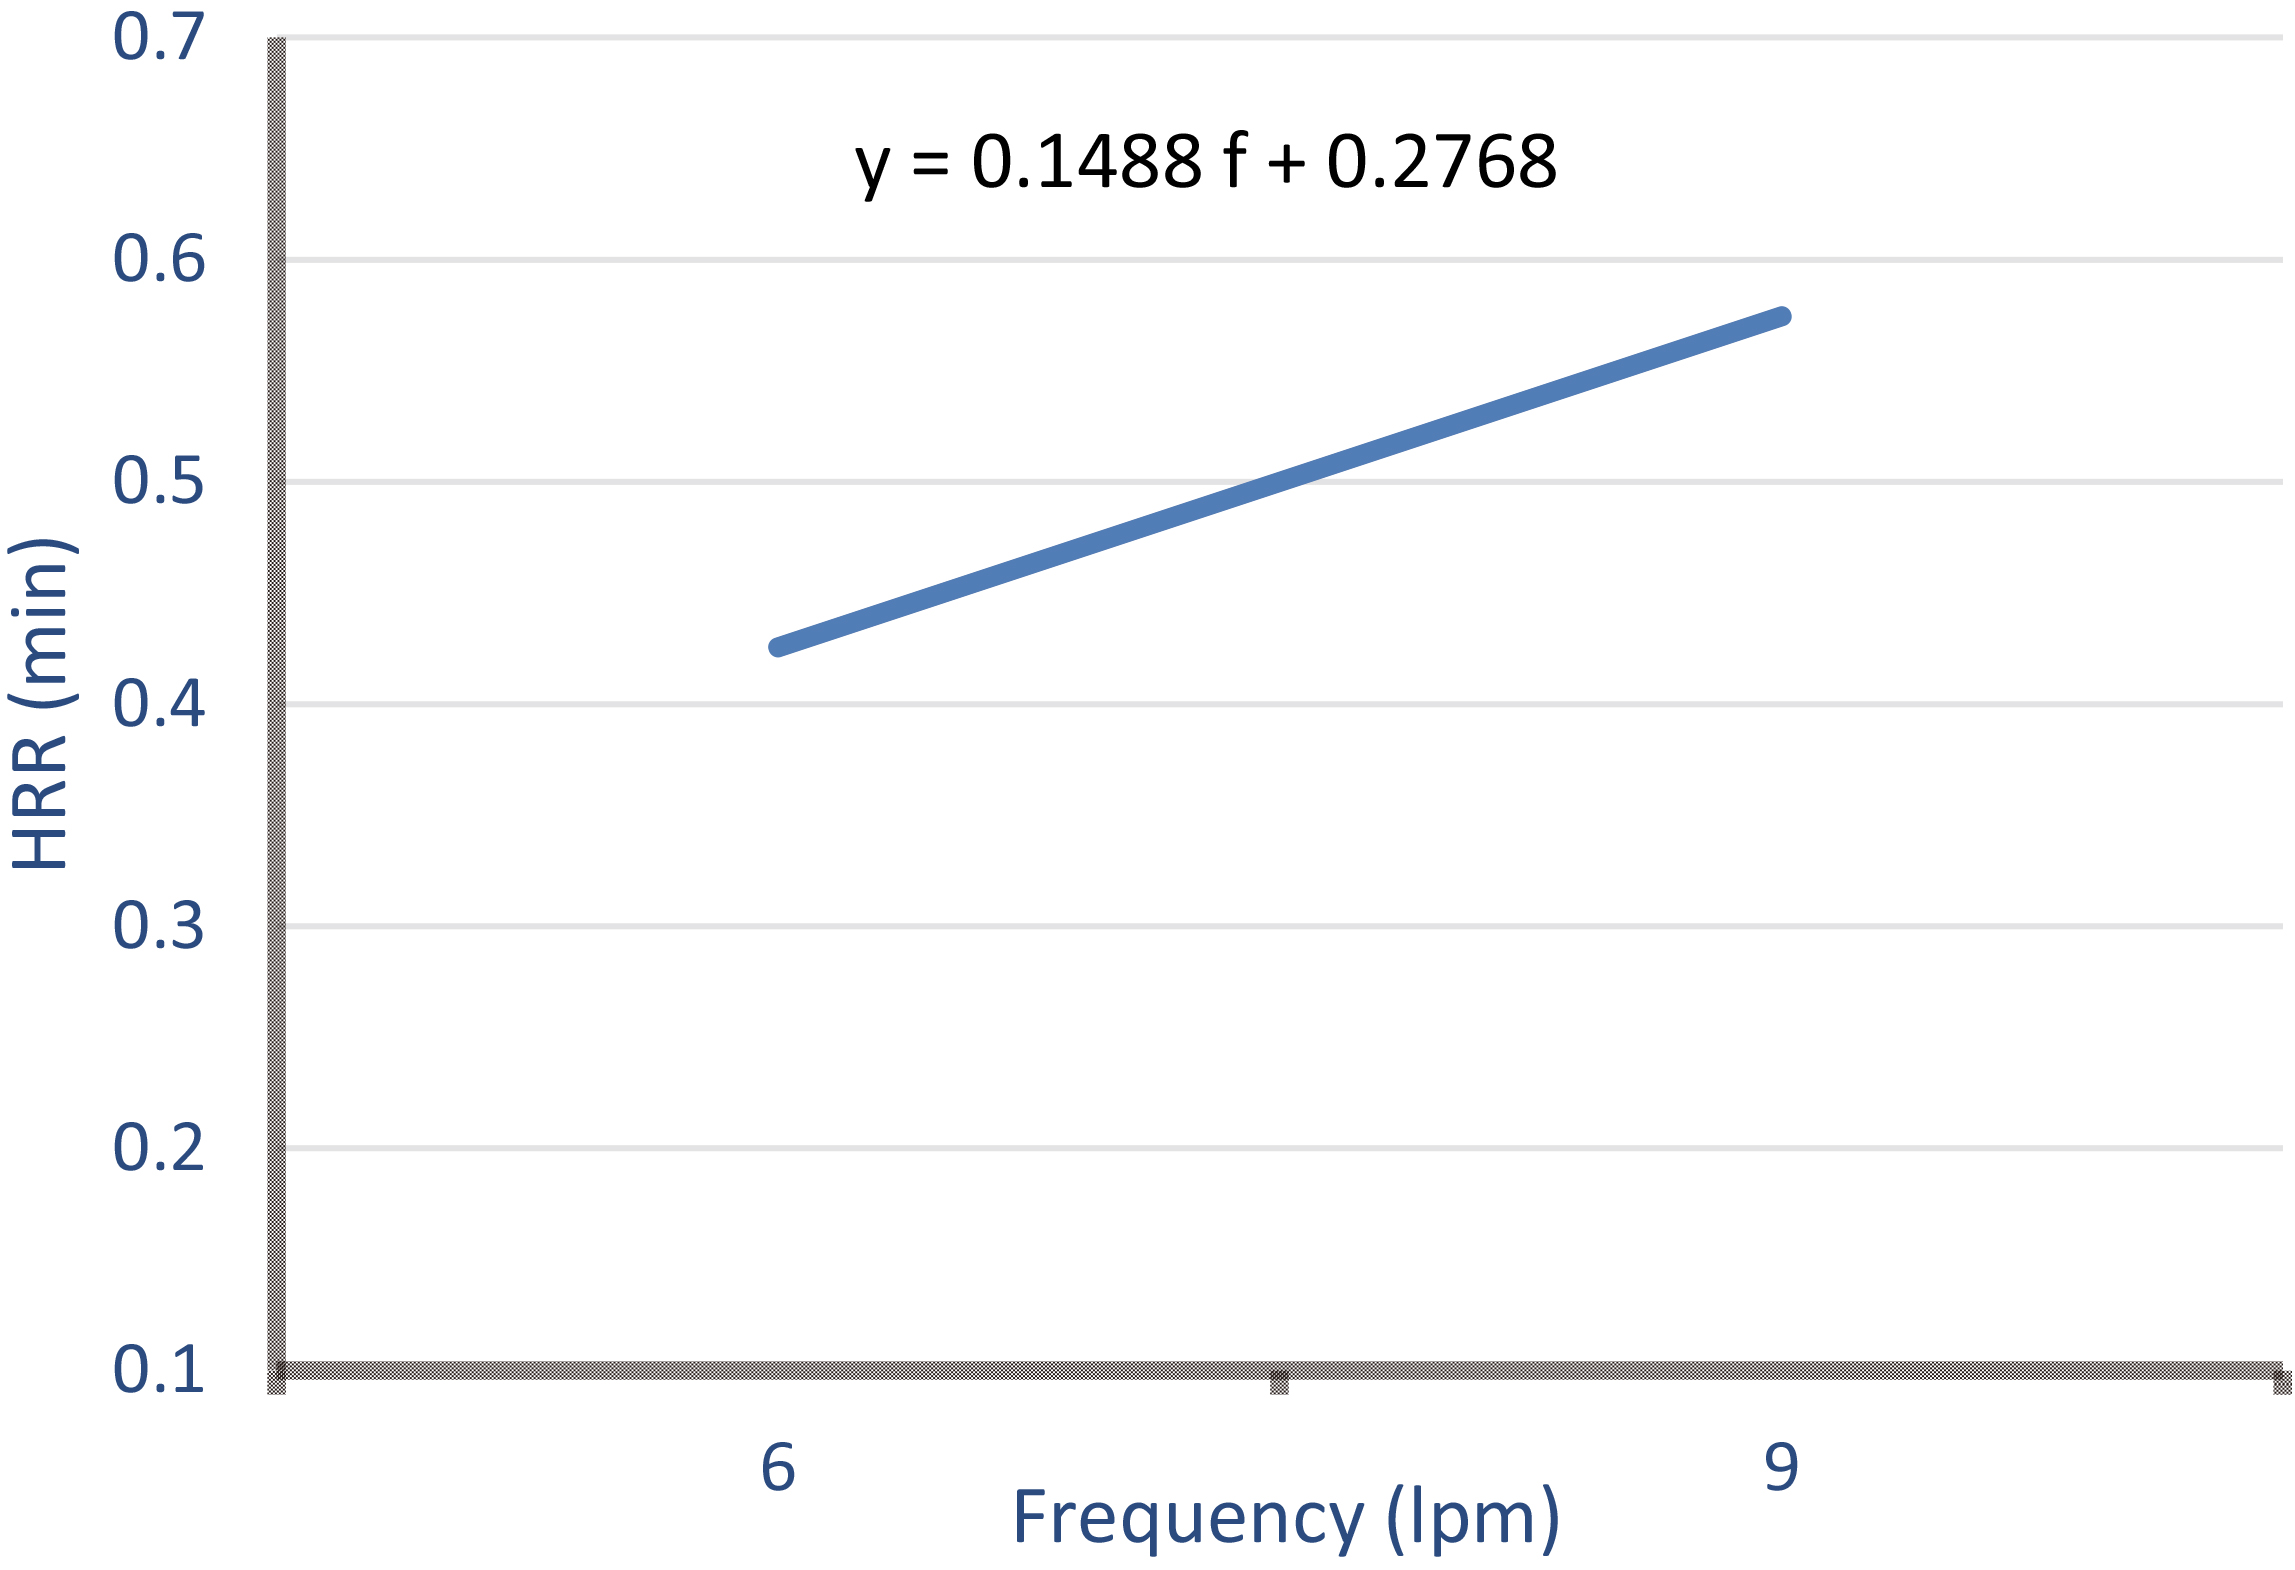
HRR for frequency response:
(2)
Figure 4.
Effect of duration on HRR.
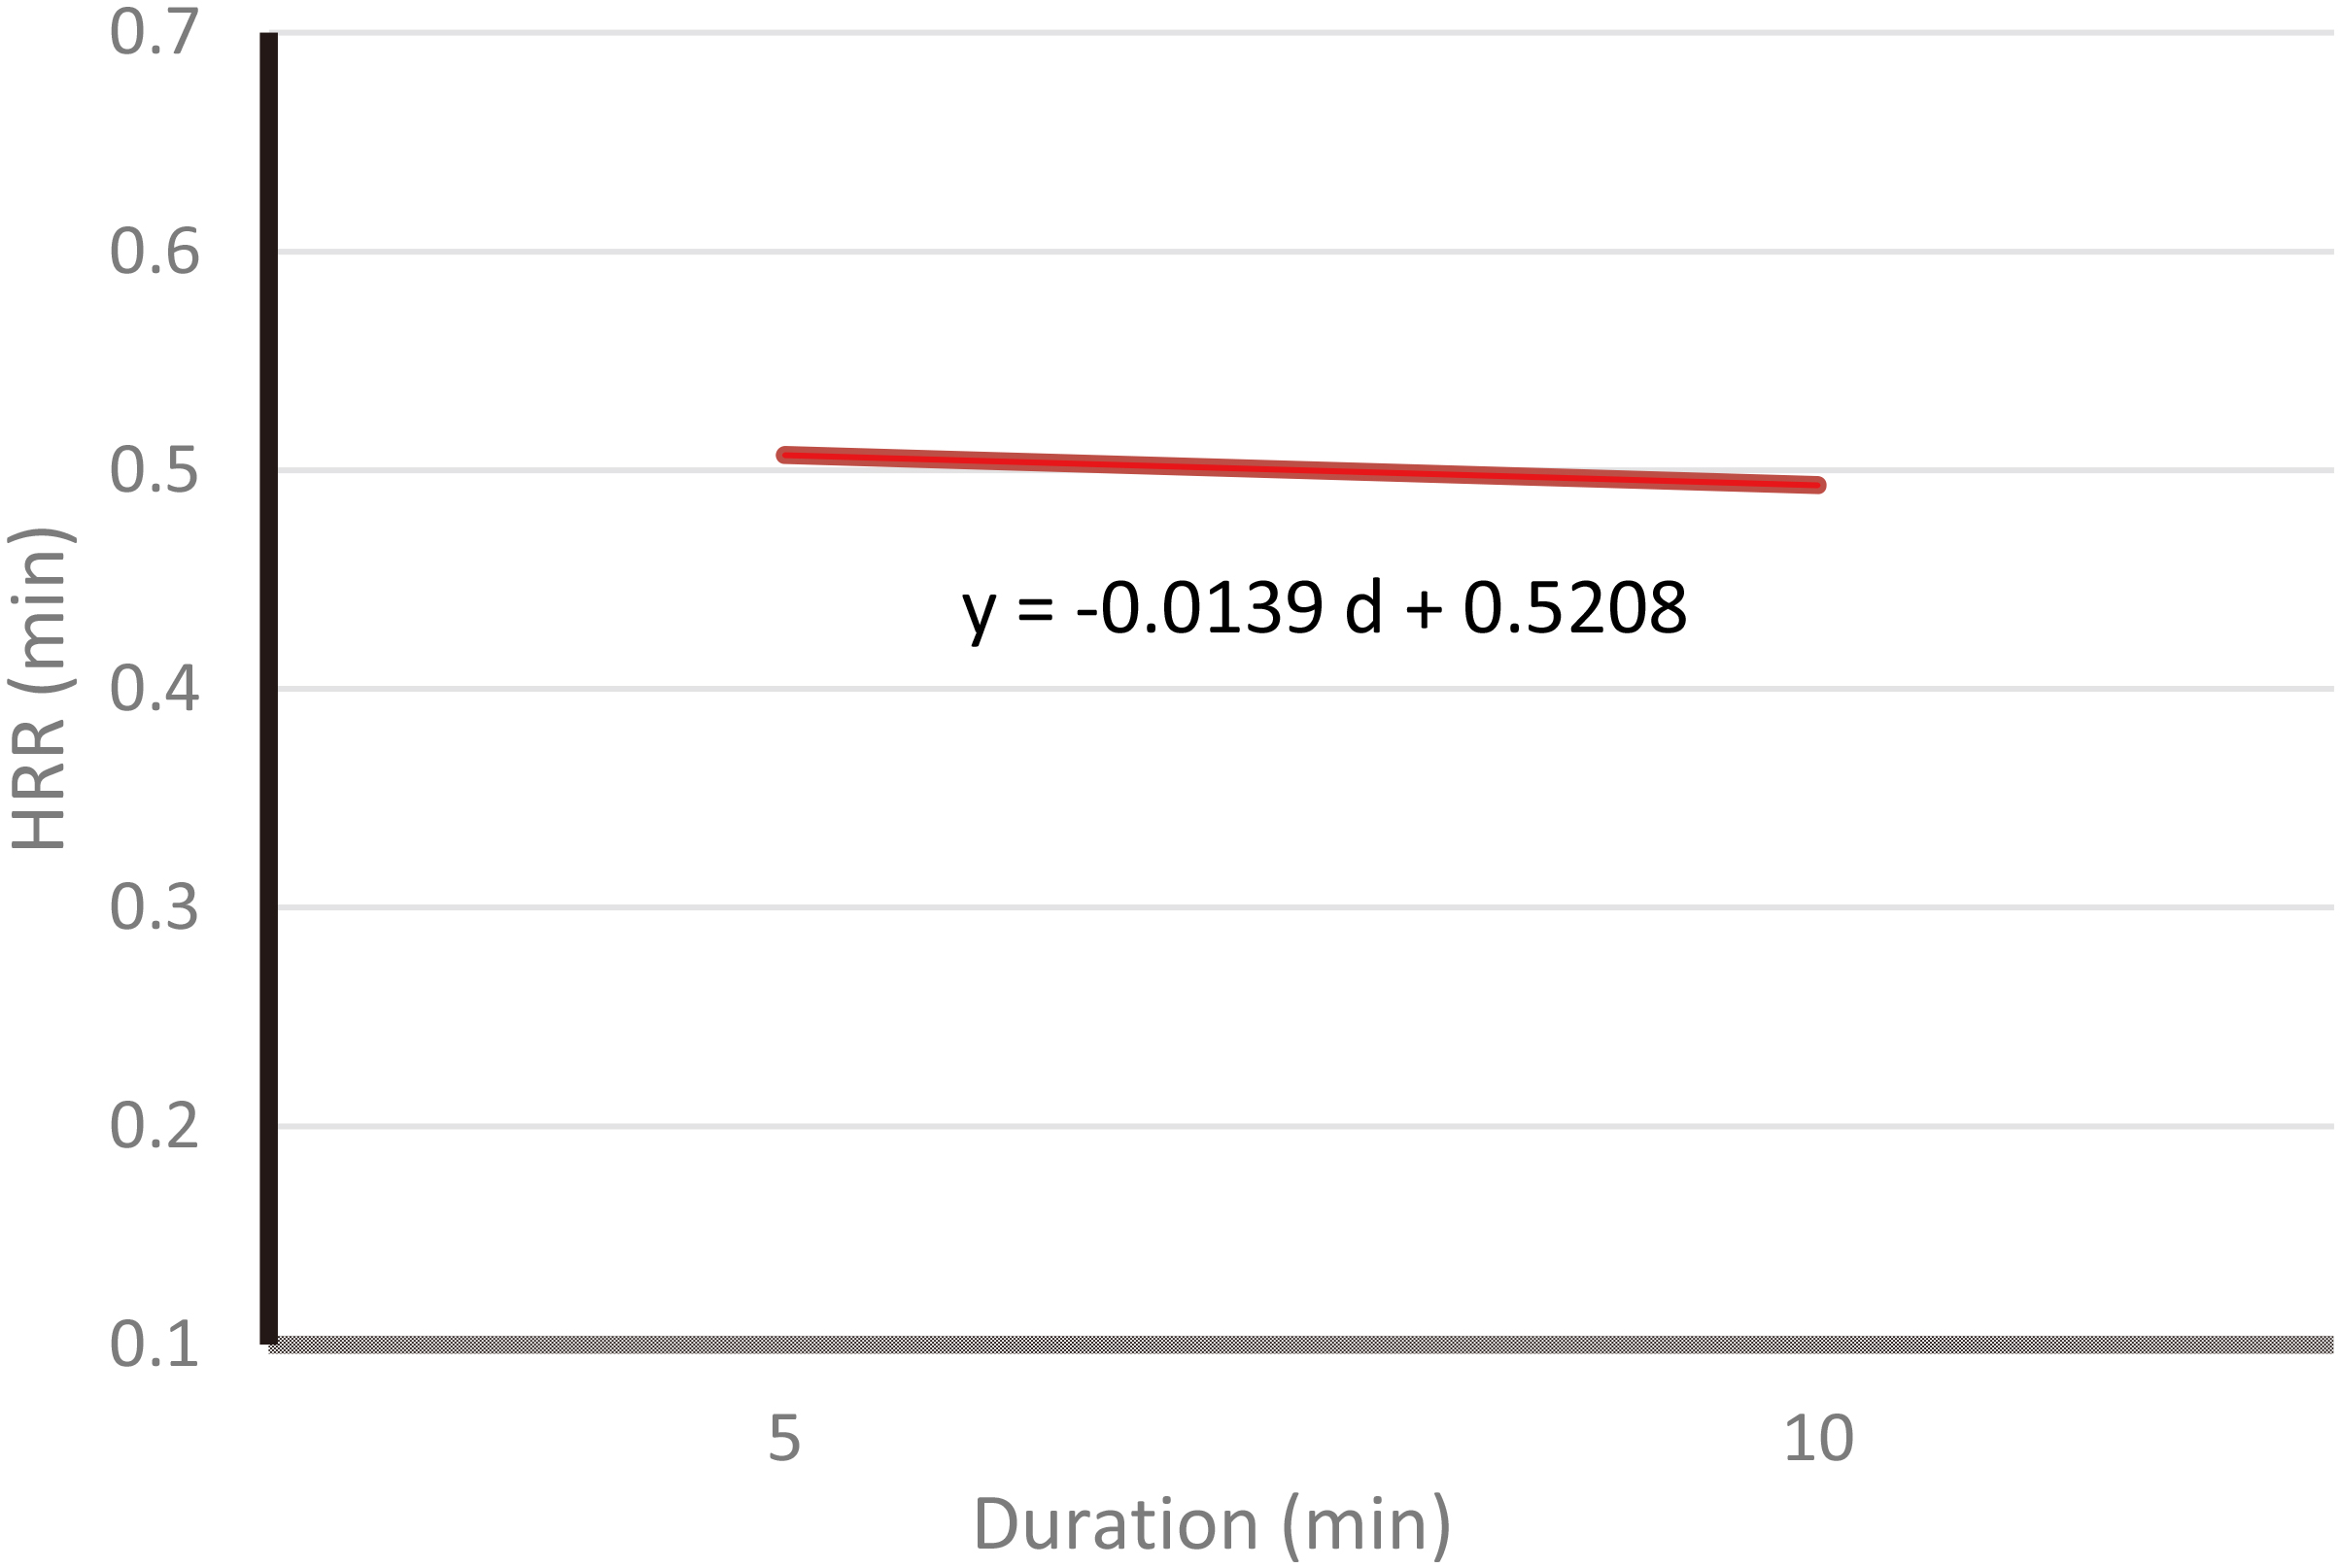
The best-fit equation of Fig. 4 for the average HRR based on two levels of duration is as follows:
HRR for duration response:
(3)
3.2Borg-rating
Table 6
Average Borg score among different levels of each factor
| Factor | Level | Avg. Borg score | Percentage change |
|---|---|---|---|
| Weight (kg) | 10 | 5.9 | 20.1% |
| 20 | 7.1 | ||
| Frequency (lpm) | 6 | 6.3 | 6.3% |
| 9 | 6.7 | ||
| Duration (min) | 5 | 6.5 | 0% |
| 10 | 6.5 |
The average Borg-rating among different levels of each factor along with their percentage change was calculated (Table 6). By increasing the weight from 10 kg to 20 kg, a 20.1% increase in the average perceived level of exertion is observed. On the other hand, increasing the weight and duration of the lift did not result in a significant increase in the average Borg-rating among test participants.
Table 7
Mixed model ANOVA for Borg
| Type 3 Tests of Fixed Effects | ||||
| Effect | Num DF | Den DF | F Value | Pr |
| Weight | 1 | 14 | 3.33 | 0.0894 |
| Freq | 1 | 14 | 0.27 | 0.6102 |
| Dur | 1 | 14 | 0.00 | 1.0000 |
| Weight*Freq | 1 | 14 | 1.70 | 0.2134 |
| Weight*Dur | 1 | 14 | 0.07 | 0.7981 |
| Freq*Dur | 1 | 14 | 0.00 | 1.0000 |
| Weight*Freq*Dur | 1 | 14 | 0.61 | 0.4472 |
A mixed model ANOVA for Borg-rating values was conducted (Table 7). Based on this result, at 10% significance level, just weight of the lift had a significant effect on the Borg-rating. (F-value
4.Research limitations
One major limitation was the relatively small sample size. In future studies, a larger sample size which is more representative of the general population may be used to support the findings with a higher accuracy. For instance, choosing the test participants based on a large array of BMI can be suggested (e.g. based on 50
Each independent factor of this study had only two levels. Using three or more levels of each factor (e.g. frequencies of 2, 6, 5, and 9), would enable us to conduct post hoc analysis and determine which level of a certain factor is more significant compared to other levels.
This study investigated the effects of three task factors on the recovery time. Future studies may incorporate more factors such as lifting height, lifting angle, and the box size. Adding more factors will add to the value of the study.
Only one physiological response (heart rate recovery time) was studied. Future studies may incorporate more response variables such as VO
5.Conclusions
As lifting frequency increased from 6 to 9 lifts per minute, the time needed for heart rate to recover after a lifting task increased by 35%, while its effect was also significant. This supports findings of Garg and Bannag [26], Wu [27], Maiti and Bagchi [28], and Abadi et al. [29], that frequency of the lift has a significant effect on the average heart rate values.
As lifting weight increased from 10 to 20 kilograms, the recovery time increased by 37%, while its effect was also significant. This supports the finding of Maiti and Bagchi [28] experiment, in which they concluded weight of the lift has a significant effect on the normalized heart rate values. Duration as a main factor negatively impacted the recovery time, however, its effect was insignificant. The only interaction effect that significantly affected the recovery time was the interaction between frequency and duration of the lift.
The load weight was the only factor that had a significant effect on the self-reported Borg rating and led to a 20% increase in fatigue rating when weight was doubled.
6.Concluding remarks
With regard to the ergonomic intervention in the design of manual material handling tasks, due consideration should be given to key task factors that affect workers fatigue and have a significant effect on recovery time. Based on the results of this study two factors of weight and frequency of the lift has significant effects on recovery time following a lifting task. Designing tasks with appropriate rest periods based on these two factors can help with alleviating workers fatigue and prevention of MSD injuries.
Conflict of interest
None to report.
References
[1] | Occupational Safety and Health Administration [OSHA]. ((2000) ). Ergonomics: The Study of Work. Retrieved from https://www.osha.gov/Publications/osha3125.pdf. |
[2] | Gatchel, R. J., and Schultz, I. Z. ((2014) ). Handbook of musculoskeletal pain and disability disorders in the workplace: New York, NY: Springer, 2014. |
[3] | Centers for Disease Control and Prevention(CDC), ((2016) ). Work-Related Musculoskeletal Disorders (WMSDs) Evaluation Measures. Retrieved from https://www.cdc.gov/workplacehealthpromotion/health-strategies/musculoskeletal-disorders/evaluation-measures/index.html. |
[4] | Occupational Safety and Health Administration [OSHA]. ((2015) ). 2014. Prevention Of Work-Related Musculoskeletal Disorders [Fact sheet]. Retrieved from https://www.osha.gov/pls/oshaweb/owadisp.show_document?p_table=UNIFIED_AGENDA&p_id=%204481. |
[5] | U.S. Bureau of Labor Statistics (BLS) ((2015) .) Nonfatal Occupational Injuries And Illnesses Requiring Days Away From Work, 2014 [Fact sheet]. Retrieved from https://www.bls.gov/news.release/archives/osh2_11192015.pdf. |
[6] | U.S. Bureau of Labor Statistics (BLS) ((2016) .) Nonfatal Occupational Injuries and Illnesses Requiring Days Away from Work, 2015 [Fact sheet]. Retrieved from https://www.bls.gov/news.release/osh2.nr0.htm. |
[7] | Dias, J. J., and Garcia-Elias, M. ((2006) ). Hand injury costs. Injury, 37: , 1071-1077. doi: 10.1016/j.injury.2006.07.023. |
[8] | Sadeghniiat-Haghighi, K., and Yazdi, Z. ((2015) ). Fatigue management in the workplace. Industrial Psychiatry Journal, 24: (1), 12-17, doi: 10.4103/0972-6748.160915. |
[9] | Loisel, P., and Anema, J. R. ((2013) ). Handbook of work disability. [electronic resource]: prevention and management. New York, NY: Springer, c2013. |
[10] | Iridiastadi, H., and Aghazadeh, F. ((2005) ). Physiological fatigue limit of combined manual materials handling tasks. Occupational Ergonomics, 5: (3), 141-148. |
[11] | Snook, S. H., and Ciriello, V. M. ((1991) ). The design of manual handling tasks: revised tables of maximum acceptable weights and forces. Ergonomics, 34: (9), 1197-1213. doi: 10.1080/00140139108964855. |
[12] | Verbeek, J. H., Martimo, K., Kuijer, P. M., Karppinen, J., Viikari-Juntura, E., and Takala, E. ((2012) ). Proper manual handling techniques to prevent low back pain, a Cochrane systematic review. Work (Reading, Mass.), 41: Suppl 12299-2301. doi: 10.3233/WOR-2012-0455-2299. |
[13] | Andersson, G. B. J. ((1999) ). Epidemiological features of chronic low-back pain. Lancet, 354: (9178), 581-585. |
[14] | Powell, R. I., and Copping, A. G. ((2016) ). Measuring fatigue-related impairment in the workplace. Journal of Engineering, Design and Technology, 14: (3), 507-525. doi: 10.1108/JEDT-09-2014-0063. |
[15] | Janaro, R. E., and Bechtold, S. E. ((1985) ). A study of the reduction of fatigue impact on productivity through optimal rest break scheduling. Human Factors, 27: (4), 459-466. |
[16] | Katic, I., Ivanisevic, A., Lalic, G., Tasic, N., and Penezic, N. ((2013) ). Effects of fatigue to operational productivity with employees. Metalurgia International, 18: , 170-176. |
[17] | Belenky, G., Lamp, A., Hemp, A., and Zaslona, J. L. ((2014) ). Fatigue in the workplace, in: Sleep deprivation and disease: Effects on the body, brain and behavior. M. T. Bianchi and M. T. Bianchi, Eds, New York, NY, US: Springer Science |
[18] | Bhatia, N., and Murrell, K. F. ((1969) ). An industrial experiment in organized rest pauses. Human Factors, 11: (2), 167-174. |
[19] | Enoka, R. M., and Duchateau, J. ((2008) ). Muscle fatigue: what, why and how it influences muscle function. Journal of Physiology (Oxford), 586: (1), 11-23. |
[20] | Lerman, S. E., Eskin, E., Flower, D. J., George, E. C., Gerson, B., Hartenbaum, N., Moore-Ede, M. et al. ((2012) ). Fatigue risk management in the workplace. Journal of Occupational and Environmental Medicine/American College of Occupational and Environmental Medicine, 54: (2), 231-258. doi: 10.1097/JOM.0b013e318247a3b0. |
[21] | Aghazadeh, F. ((1986) ). Dynamic strength models for manual handling of different containers. Journal of Human Ergology, 15: (2), 131-138. |
[22] | Borg, G. A. ((1982) ). Psychophysical bases of perceived exertion. Medicine and Science in Sports and Exercise, 14: (5), 377-381. |
[23] | Aghazadeh, F., Waly, S. M., and Santoso, D. S. ((1998) ). Models for lifting load capacity of Indonesian population. Occupational Ergonomics, 1: (1), 67-74. |
[24] | Pulat, B. M. ((1997) ). Fundamentals of industrial ergonomics. Prospect Heights, IL: Waveland. |
[25] | Brouha, L. ((1967) ). Physiology in industry; evaluation of industrial stresses by the physiological reactions of the worker: Oxford, New York, Pergamon Press [1967, c1960] 2d ed. |
[26] | Garg, A., and Banaag, J. ((1988) ). Maximum acceptable weights, heart rates and RPEs for one hour’s repetitive asymmetric lifting. Ergonomics, 31: (1), 77-96. doi: 10.1080/00140138808966650. |
[27] | Wu, S. P. ((1997) ). Maximum acceptable weight of lift by Chinese experienced male manual handlers. Applied Ergonomics, 28: (4), 237-244. |
[28] | Maiti, R., and Bagchi, T. P. ((2006) ). Effect of different multipliers and their interactions during manual lifting operations. International Journal of Industrial Ergonomics, 36: (11), 991-1004. doi: http://dx.doi.org/10.1016/j.ergon.2006.08.00. |
[29] | Abadi, A. S. S., Mazlomi A., Saraji, G. N., Zeraati, H., Hadian, M. R., and Jafari, A. H. ((2015) ). Effects of box size, frequency of lifting, and height of lift on maximum acceptable weight of lift and heart rate for male university students in Iran. Electronic Physician, 7: (6), 1365-1371. doi: 10.14661/2015.1365. |
Appendices
Appendix A: CR-10 Borg scale survey
| Rating | Definition |
|---|---|
| 0 | Nothing at all |
| 0.5 | Very, very easy |
| 1 | Very easy |
| 2 | Easy |
| 3 | Moderate |
| 4 | Somewhat hard |
| 5 | Hard |
| 6 | |
| 7 | Very hard |
| 8 | |
| 9 | Very, very hard |
| 10 | Impossible |


