
Ergonomic assessment of working postures for the design of university computer workstations
Abstract
BACKGROUND:
There is an extensive body of research reviewing the ergonomics needs of industrial office workers. However, very few studies have considered evaluating the working postures of students or professors in universities who are exposed to prolonged sitting while working at a computer workstation.
OBJECTIVE:
The purpose of the study was threefold: (1) to determine the major ergonomic issues university employees encounter while working at computer workstations, (2) to compare the two ergonomic assessment tools (RULA and REBA) to see how similarly or differently they assess the risks present in the same working condition and (3) to develop a model that correlates working condition, work posture and computer workstation design with their negative effects on musculoskeletal system.
METHODS:
This research was constituted of a comprehensive survey (5 minutes) and a quantitative risk assessment session (20 minutes) conducted over 72 university personnel and their workstations in a university workplace. Along with a pre-assessment questionnaire; the Cornell Musculoskeletal Discomfort Questionnaire (CMDQ) and two ergonomic assessment tools namely Rapid Entire Body Assessment (REBA) and Rapid Upper Limb Assessment (RULA) were used to quantify the ergonomic risk factors. To evaluate the computer workstations “OSHA Computer Workstations eTool-Evaluation Checklist” was used.
RESULTS:
The upper limbs of computer workstation users seem to be more prone to Work-related Musculoskeletal Disorders (WMSD) and Repetitive Stress Injuries (RSI) symptoms. In 85.5% of cases, RULA scores were the same or more than that of REBA, which indicates work of office employees may cause a disorder more in the upper limbs than the lower limbs.
CONCLUSIONS:
Alignment of the monitor was found to be the most significant design parameter. Among different body parts, trunk was the most affected one, as a result of poor posture and/or workplace design followed by shoulder and upper arm, and forearm and wrist.
1.Introduction
While the ever-increasing usage of computers in workplace has enhanced the speed and accuracy of data processing, its impact on workers’ health due to over-usage cannot be ignored. Major health problems like WMSD and RSI have become common phenomenon. Since, in universities today, most of the activities are done with the aid of computers, the students, employees and professors are exposed to the risks associated with the usage of computers over large span of time on a daily basis. While the working hours vary from professors to administrative employees, from freshmen to masters to PhD students, the time spent at computer workstations is significant for any of them.
Work-related musculoskeletal disorders are a common health concern and a major source of occupational illness throughout the world. Along with the health risks associated, the monetary loss due to such disorders affects not only the individual but also the organization and the society as a whole [1]. Musculoskeletal disorders come along with high costs to employers, for instance absenteeism, lost productivity due to increased health issues, disability, and workers’ compensation costs. According to the United States Department of Labor [2], musculoskeletal disorder cases per 10,000 fulltime workers were 45.3, 52.7 and 33.5 cases for state government, local government and private sectors, respectively. In 2013, 35.8 days-away-from-work cases were reported per 10,000 full-time workers due to musculoskeletal disorders which was one-third of all the reported cases of days-away-from-work [2]. Annual report on WMSD by United States Department of Labor in 2014 revealed that WMSD incidents cost was about $20 billion in 2013 as direct cost and five times that amount as indirect cost [2]. All these statistics are alarming and signifies the necessity of assessment of design of computer workstations and the work postures of users to determine the root-causes of growing number of cases of WMSDs. This has become a priority goal to prevent WMSDs in many countries [3].
Acute and chronic musculoskeletal incidents and work-related injuries are on the upsurge. One prime reason is two out of every three Americans sit for all or most part of their work day at a computer workstation [4]. Lack of proper intervention or training in appropriate posture is also an unavoidable reason. This exposes workers to repetitive motions of the upper extremities as well as sustained awkward lower back postures. Carpal tunnel syndrome, trigger finger, golfer’s or tennis elbow, along with cervical and lumbar disorders are examples of WMSDs that can be alleviated through appropriate ergonomics and proper training. A prospective study by Hlobil et al. [5] shows a positive relationship between prolonged sitting at Video Display Terminal (VDT) workstation and neck pain; a similar study also observed a positive relation between extended neck flexion and neck pain [6]. Studies show that many cases of shoulder and neck pain are caused by inappropriate design or use of furniture [7]. In a study by Ekman et al. [8], in which the objective was to investigate possible disparities between women and men in the reporting of musculoskeletal symptoms among Video Display Unit (VDU) users in the Swedish workforce, the estimated odds ratio for gender (women/men) was 11.9 (95% confidence interval).
While most of the ergonomics assessment studies to date have been conducted on industrial workers; very few studies have considered evaluating the working postures of staff or professors in universities who are exposed to prolonged sitting, while working at computer workstations. A study by Yaghobee et al. [9] was conducted to assess and correct the posture of 69 dental students using REBA before and after the intervention through the “Ergonomic principles in dentistry” course. Results show that the postures of 94.2% of students were in moderate and high risk level which needed to be corrected. The worst working positions were during surgery, endodontic and pediatric dentistry procedures. Although the REBA scores before and after training course were statistically different (
REBA [13] and RULA [14] are two quick postural targeting methods for assessing workers postures and determining the risk factor index. There are several studies which compare REBA and/or RULA with other postural assessment methods. In a study by Dockrell [15], RULA was used to assess postural risk factors in pediatric population of two age groups where the purpose was to investigate the inter-rater and intra-rater reliability of RULA. The results indicate that RULA was more reliable while assessing the older age group of children, but its level of reliability necessitates caution for its lone use while assessing younger children [15]. A cross-sectional questionnaire based study by Sen and Richardson [16] investigated users’ awareness of ergonomic design of computer workstation among 136 computer users from a sample population of university students and office staff. The study sought to see the prevalence of WMSD symptoms due to overuse of computers. RULA was used for postural assessment. It was found that around 50% of those who reported low back pain did not have an adjustable backrest. Many users had higher RULA scores for wrist and neck, suggesting overuse syndromes from overuse of computers. It was concluded that further onsite studies are needed to follow up this survey to decrease the risks amongst young computer users [16]. Another study by Kee and Karwowski [17] aimed to compare RULA and REBA based on the evaluation results generated using 301 working postures. All postures were sampled from the iron and steel, electronics, and chemical industries, and a general hospital. While only about 21% of the 301 postures were classified as the action category level 3 or 4 by REBA, about 56% of the postures were classified as action level 3 or 4 by RULA. The inter-method reliability for postural load category between RULA and REBA was 48.2%. These results show that compared to RULA, REBA generally underestimated postural loads for the analyzed postures, irrespective of industry and type of work [17].
A review of the literature concerning the ergonomic assessment of computer workstations shows several studies have been conducted to assess the ergonomic deficiencies and analyze the effect of an ergonomics awareness program on dental school faculty and students. Since dental faculty and students are required to have dental training in real time clinical environment and are exposed to the extreme postures of examining and handling patients, they are very susceptible to WMSDs [9].
Also, a number of research concentrates on the ergonomic deficiencies among staff in nursing homes [11]. Some research have been undertaken to identify the cause, incidence, and response to occupational musculoskeletal injuries reported by physical therapists, physical therapist assistants and athletic trainer. In view of the fact that their work is labor intensive and they are susceptible to occupational musculoskeletal injuries [12].
Although extensive research has been conducted on how the design of VDT workstation and the postural, environmental and psychosocial factors affect the musculoskeletal system of the users in the office environment, there has not been any research that solely addresses the ergonomic concern of professors and employees of a university who are exposed to prolonged hours of computer work in their VDT workstations for education and research purpose. As a result, there is a need to conduct the ergonomic evaluation of university staff.
This research intended to study and identify ergonomic deficiencies in the design of computer workstations and their effects on the musculoskeletal system of the users and suggest strategies to reduce or eliminate these deficiencies to improve health and safety performance, productivity and job satisfaction of employees. General objectives of this study are:
1. Identifying the key ergonomic issues in university staff.
2. Comparing two ergonomic assessment tools RULA and REBA to check their inter-variability.
3. Assessing how postural factors affect the musculoskeletal system of a VDT user in university workspace.
4. Assessing how workstation design factors affect the musculoskeletal system of a user exposed to prolonged work at computer workstation.
5. Providing necessary suggestions to correct poor postures and inappropriate workstation setup.
2.Methods
Seventy-two participants of the School of Business and the College of Arts and Design at Louisiana State University participated in this study. Participants were selected on a volunteer basis. All subjects regularly used desktop or laptop computers and worked at least an average of 4 hours a day at their computer workstation. The participants were randomly selected and were emailed for their appointment. Data was collected during the observation day and analyzed later on. Each observation session with the participants consisted of three sessions namely, (1) the survey session, (2) participants’ posture observation session and (3) workstation observation session. On the appointed day, participants were first handed the survey questionnaire and CMDQ questionnaire to fill out. CMDQ is a subjective rating scale for user’s perceived discomfort from work [18]. After that they were asked to work at their computer with the regular setup. While they were working on their computer workstation, their pictures were taken from lateral angles at the 5
Three hypotheses were tested in the study. First, the risk assessment result would be the same for both RULA and REBA, second, VDT user’s posture would have no effect on user’s musculoskeletal system and third, the design of VDT workstation would have no effect on user’s musculoskeletal system.
3.Results
The data was analyzed using Proportional-odds cumulative logit model, which is the most popular model for ordinal data. The users’ response in this study was ordinal data varying from “slightly uncomfortable” to “moderately uncomfortable” to “very uncomfortable”. The purpose of the analysis was to see how well these responses can be predicted by the responses to other questions, i.e. for the current study the purpose of the analysis was to predict the probability of a user having different level of RSI or WMSD symptoms (slight, moderate or very uncomfortable pain) by finding the deficiencies of user’s work posture and workstation design. We ran a one-way ANOVA to study the variability of the RULA and RULA scores for the same subjects under the same working condition. The odds ratio was also calculated for studying how one significant factor may affect the responses, while keeping all other factors constant. The significance level (
3.1RULA and REBA analyses
An alarming number of 75.71% participants reported to suffer from the upper and lower back pain. Furthermore, 45.71% reported suffering from shoulder and upper arm pain. In addition, 42.85% of the observed employees reported considerable and frequent pain in their forearm and wrist. The percentage of participants suffering from neck pain is 37.09% and that of knee and thigh is 21.42%.
Table 1
Most frequent recurring factors attributed to the symptoms of MSDs in different body region
| Body parts | Part of workstation | Percentage | Body part affected |
|---|---|---|---|
| with incorrect posture | with inappropriate setup | of participants suffering | |
| Torso | Seating | 64% | Lower back |
| Wrist and hands | Input devices | 80.95% | Wrist (left right) |
| Forearm and elbow | Seating | 69.23% | Forearm |
| Head and neck | Monitor | 78.94% | Neck and upper back |
| Head and neck | Monitor | 84.21% | Right and left shoulder |
| Shoulder and upper arm | Monitor | 88.76% | Right and left shoulder |
It was observed (Table 1) that 64% of people who had incorrect trunk posture, also had adverse seating arrangement in their computer workstation, and reported to have moderately or very uncomfortable pain in their lower back. Similarly, a combination of awkward posture of wrists and hands and design deficiencies of input devices attributed to 80.95% of people reporting wrist pain. Approximately 69.23% of people who placed their forearm and elbows in wrong manner and also had faulty seating arrangement reported to have moderate or heavy pain in their forearms. A large percentage, 78.94% and 84.21%, of people who had wrong head and neck posture and had incorrect arrangement of VDT monitor, reported to have neck, upper back and shoulder pain. In addition, 88.76% of people having a combination of incorrect monitor arrangement and awkward posture of shoulder and upper arm, reported to have shoulder pain. The male population reported more pain in their head and trunk, while the female population had more pain in their upper and lower backs, shoulders and upper arms, forearms and elbows and wrists and hands (Table 2). Almost half the population, both male and female, reported to be suffering from back pain.
Table 2
Percentage of male and female reporting MSD symptoms in different body regions
| Body region affected | |||||
|---|---|---|---|---|---|
| Head and neck | Trunk | Shoulder and upper arm | Forearm and elbows | Wrist and hands | |
| Male | 42.10% | 47.36% | 21.05% | 15.78% | 15.70% |
| Female | 37.20% | 58.13% | 32.55% | 18.60% | 30.23% |
It was observed that the average RULA score for males was 5 and for that of REBA was 4. The scores were same for the female participants. Both scores interpret as the average population to be at medium risk and need further investigation for any changes that need to be made in the future.
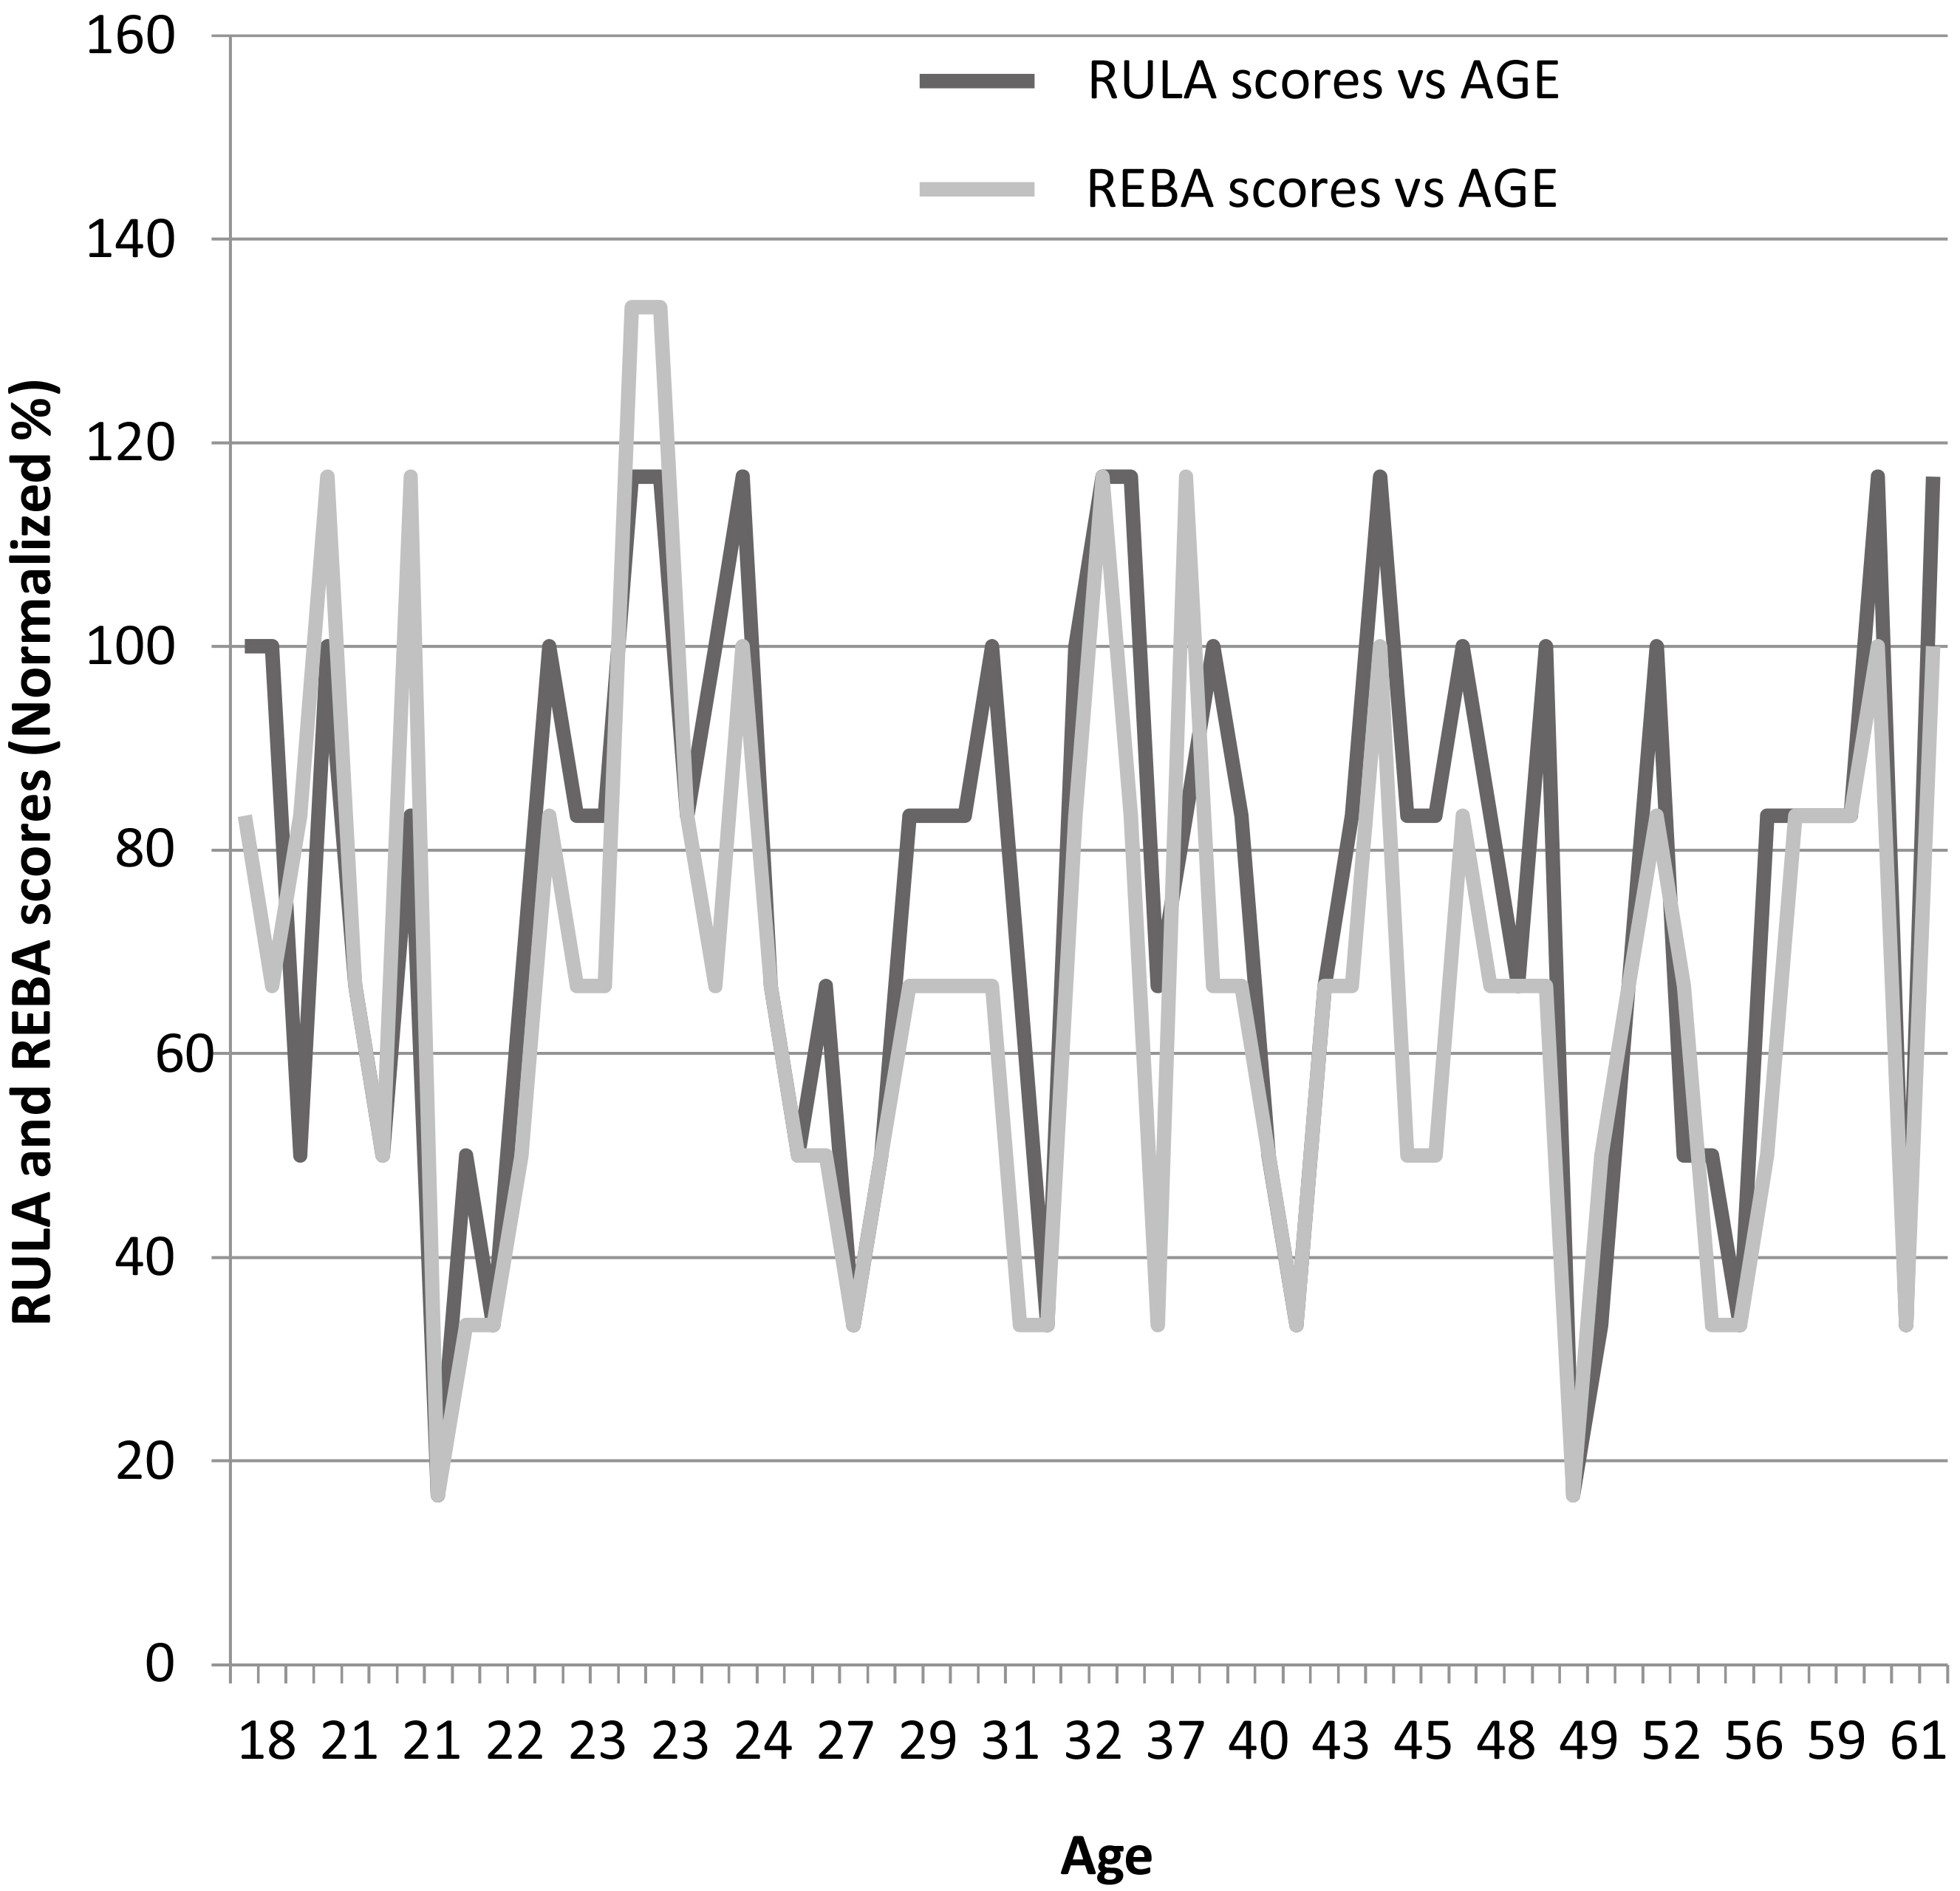
Both RULA and REBA scores were normalized as a percentage of their highest score and were plotted against age (Fig. 1). As it can be seen from the graph, for the younger age, REBA scores were found to be higher than RULA scores. While for the older population, RULA scores were higher than the REBA scores. It was observed that for the same person RULA and REBA scores were the same in 33.87% of time. Approximately 51.61% of time RULA score was higher than REBA score and only 12.92% of time REBA score was higher than RULA score for the same person. Consequently, RULA assessment tool has presented a better sensibility to detect prompt and critical action levels. During the analysis using both methods, RULA detected a bigger proportion of postures in the risky categories than the proportion detected by REBA. It can be explained by the fact that the professors and employees working at computer workstations spend a larger amount of time, using the upper limb of their body, which exactly is the evaluation focus of RULA.
3.2Analysis of maximum likelihood estimates
Figure 1.
RULA and REBA scores versus age.
From the ordinal regression analysis of Maximum Likelihood Estimates (Table 3), we calculated the degrees of freedom, coefficients, their standard errors, the Wald chi-square test, and associated p-values. The four variables which had significant effects on users’ musculoskeletal system were forearm and elbows, trunks, shoulder and upper arm and monitors. The variable wrist and hand posture was marginally significant. So for monitor, we can say that as the variable changes from 0 to 1, we expect a
Table 3
Analysis of maximum likelihood estimates
| Parameter | DF | Estimate | Standard | Wald | Pr | |
| error | Chi-Square | |||||
| Intercept | 1 | 1 | 1.9783 | 0.1616 | 149.8304 | |
| Intercept | 2 | 1 | 4.2635 | 0.2480 | 295.66 | |
| Monitors | 1 | 0.1619 | 6.4435 | 0.0111 | ||
| Trunks | 1 | 0.5768 | 0.18 | 10.2725 | 0.0014 | |
| Shoulder-upper arm | 1 | 0.1674 | 11.1360 | 0.0008 | ||
| Forearm and elbows | 1 | 0.1930 | 5.0242 | 0.0250 | ||
| Wrist and hand | 1 | 0.1812 | 3.1762 | 0.0747 |
Table 4
Odds ratio estimates
| Effect | Point estimate | 95% Wald confidence limits | |
|---|---|---|---|
| Monitors | 0.663 | 0.483 | 0.911 |
| Trunks | 1.780 | 1.251 | 2.533 |
| Shoulder and upper arm | 0.572 | 0.412 | 0.794 |
| Forearm and elbows | 0.649 | 0.444 | 0.947 |
| Wrist and hand | 0.724 | 0.508 | 1.033 |
3.3Odds ratio estimates
In Table 4 we see the results presented as proportional odds ratios (the coefficient exponentiated) and the 95% confidence intervals for the proportional odds ratios. For monitor, we can see that for a one unit change in monitor parameter, i.e., going from 0 (absence of design problems) to 1 (presence of design problem), the odds of having lower pain versus the higher pain are 0.663 greater, given that all of the other variables in the model are held constant. Or we can say for one-unit increase in monitor the odds of having higher pain versus the lower pain increases by (1/.663
3.4Linear predictor functions
We calculated the correlation coefficients for all the significant independent variables including weight and height of the participants and the responses obtained. As seen from Table 5, no strong correlation was found.
Table 5
Correlation coefficients
| Most significant parameters (Independent variables) | ||||||||
| Body parts | Monitor | Input | Trunk | Shoulder and | Forearm and | Wrist | Weight | Height |
| device | upper arm | elbows | ||||||
| Neck | 0.04 | 0.34 | 0.14 | 0.11 | 0.33 | |||
| Shoulder (right) | 0.23 | 0.06 | 0.23 | 0.28 | ||||
| Shoulder (left) | 0.01 | 0.11 | 0.19 | 0.02 | 0.21 | 0.19 | 0.21 | |
| Upper back | 0.00 | 0.07 | 0.07 | 0.14 | 0.14 | 0.07 | ||
| Upper arm (right) | 0.11 | 0.14 | ||||||
| Upper arm (left) | 0.11 | 0.07 | 0.05 | |||||
| Lower back | 0.05 | 0.10 | 0.28 | 0.06 | 0.35 | |||
| Forearm (right) | 0.07 | 0.10 | 0.04 | 0.09 | 0.03 | 0.04 | 0.06 | 0.03 |
| Forearm (left) | 0.03 | 0.25 | 0.02 | 0.12 | 0.02 | |||
| Wrist (right) | 0.12 | 0.16 | 0.20 | 0.12 | 0.15 | 0.34 | ||
| Wrist (left) | 0.05 | 0.06 | 0.02 | 0.03 | 0.02 | |||
From the definition of cumulative logit model we obtained the linear predictor functions in Eqs (1) and (2).
(1)
(2)
The values of the parameters can either be 0 or 1 depending on their absence or presence in the workstation or user posture being analyzed. Now using the linear predictor functions
(3)
(4)
(5)
4.Research limitations
Several limitations were noticed before and during the conduct of this research. The WMSD symptoms were recorded subjectively through CMDQ questionnaire. More accurate results can be obtained by measuring the WMSD symptoms directly using Goniometers, Electro-goniometers or Electromyography (EMGs). Also, the WMSD symptoms were recorded, if they had occurred in the previous week of the participant’s task. The results might be more reliable with the data recorded for a longer period of time. The study was conducted using 72 participants out of which 29 were male and the rest were female. The risk factors for females were found to be higher than those for males. Therefore, results might have changed if the study had more male participants. RULA and REBA tools assess postural loading at a specific moment in the work cycle. Selecting the appropriate stage of the work cycle for assessment requires long observation. For the current study the participants were observed for 20 minutes to be photographed for their worst posture. It is possible that during the 20 minutes of observation, the worst posture might not have been adopted by the individual.
5.Conclusions
The results of proportional odds ordinal regression model suggest that the four most significant postural parameters to contribute to the WMSD symptoms in university personnel were trunk, shoulder and upper arm, forearm and elbows and wrist. The most number of participants (75.71%) reported to suffer from upper and lower back pain. Next to it was shoulder and upper arm (45.71%) and then forearm and wrist (42.85%) discomfort. According to the same analysis, monitor alignment was found to be the most significant design parameter. Average RULA score (5) was more than that of REBA (4) making RULA an assessment tool with better consistency while evaluating activities of upper limb, in working at computer workstations. Three equations for predictive probabilities were obtained for the three levels of response variables. Further field intervention research is needed to support these findings and to replicate them with different office workplace design. These findings would contribute to a knowledge base on how to ergonomically design computer workstation and arrange for interventions to help create injury-free environments for the users especially in a university environment.
6.Concluding remarks
For the ergonomic intervention or the design of computer workstations due consideration should be given to established anthropometric dimensions of desk/table; chair including seat, backrest and armrest; video display terminal (VDT) and keyboard positioning. This will contribute towards alleviating health problems, such as, work-related musculoskeletal disorders (WMSDs) and repetitive stress injuries (RSIs).
Conflict of interest
None to report.
References
[1] | Lee, Y.K., and Park, H.S. ((2007) ). Workers’ perception of the changes of work environment and its relation to the occurrence of work-related musculoskeletal disorders. Journal of Occupational Health, 49: (2), 152-154. |
[2] | Bureau of Labor Statistics, U.S. Department of Labor, 2014–2015 Occupational Outlook Handbook [date accessed] [http://www.bls.gov/ooh/]. |
[3] | da Costa, B.R., and Vieira, E.R. ((2010) ). Risk factors for work-related musculoskeletal disorders: a systematic review of recent longitudinal studies. American Journal of Industrial Medicine, 53: (3), 285-323. |
[4] | Robertson, M.M., Huang, Y.H., O’Neill, M.J., and Schleifer, L.M. ((2008) ). Flexible workspace design and ergonomics training: Impacts on the psychosocial work environment, musculoskeletal health, and work effectiveness among knowledge workers. Applied Ergonomics, 39: (4), 482-494. |
[5] | Hlobil, H., Staal, J.B., Twisk, J., Köke, A., Ariëns, G., Smid, T., and Van Mechelen, W. ((2005) ). The effects of a graded activity intervention for low back pain in occupational health on sick leave, functional status and pain: 12-month results of a randomized controlled trial. Journal of Occupational Rehabilitation, 15: (4), 569-580. |
[6] | Wahlström, J. ((2005) ). Ergonomics, musculoskeletal disorders and computer work. Occupational Medicine, 55: (3), 168-176. |
[7] | Shikdar, A.A., and Al-Kindi, M.A. ((2007) ). Office ergonomics: deficiencies in computer workstation design. International Journal of Occupational Safety and Ergonomics, 13: (2), 215-223. |
[8] | Ekman, A., Andersson, A., Hagberg, M., and Hjelm, E.W. ((2000) ). Gender differences in musculoskeletal health of computer and mouse users in the Swedish workforce. Occupational Medicine, 50: (8), 608-613. |
[9] | Yaghobee, S., Khorsand, A., and Paknejad, M. ((2013) ). Comparison of interleukin-1 β levels in gingival crevicular fluid and peri-implant crevicular fluid and its relationship with clinical indexes. Journal of Dentistry (Tehran, Iran), 10: (1), 1. |
[10] | Gandavadi, A., Ramsay, J.R.E., and Burke, F.J.T. ((2007) ). Assessment of dental student posture in two seating conditions using RULA methodology – a pilot study. British Dental Journal, 203: (10), 601-605. |
[11] | Retsas, A., and Pinikahana, J. ((2000) ), Manual handling activities and injuries among nurses: An Australian hospital study. Journal of Advanced Nursing, 31: : 875–883. doi: 10.1046/j.1365-2648.2000.01362. |
[12] | Darragh, A.R., Huddleston, W., and King, P. ((2009) ). Work-related musculoskeletal injuries and disorders among occupational and physical therapists. American Journal of Occupational Therapy, 63: (3), 351-362. |
[13] | Hignett, S., and McAtamney, L. ((2000) ). Rapid entire body assessment (REBA). Applied Ergonomics, 31: (2), 201-205. |
[14] | McAtamney, L., and Corlett, E.N. ((1993) ). RULA: a survey method for the investigation of work-related upper limb disorders. Applied Ergonomics, 24: (2), 91-99. |
[15] | Dockrell, S., O’Grady, E., Bennett, K., Mullarkey, C., Mc Connell, R., Ruddy, R., Twomey, S., and Flannery, C. (2012). An investigation of the reliability of Rapid Upper Limb Assessment (RULA) as a method of assessment of children’s computing posture. Applied Ergonomics, 43: (3): 632-636. |
[16] | Sen, A., and Richardson, S. ((2007) ). A study of computer-related upper limb discomfort and computer vision syndrome. Journal of Human Ergology, 36: (2), 45-50. |
[17] | Kee, D., and Karwowski, W. ((2007) ). A comparison of three observational techniques for assessing postural loads in industry. International Journal of Occupational Safety and Ergonomics, 13: (1), 3-14. |
[18] | Hedge, A., Morimoto, S., and Mccrobie, D. ((1999) ). Effects of keyboard tray geometry on upper body posture and comfort. Ergonomics, 42: (10), 1333-1349. |


