
Evaluation of postural, psychosocial stress and driver behaviour of motorbike riders in India
Abstract
BACKGROUND:
Motorbikes are a cost effective and fuel efficient mode of transport but at the same time they account for huge number of Road Traffic Accidents (RTA). Bike riders are exposed to postural, psychosocial stress which may lead to accidents.
OBJECTIVES:
Objectives of the study are to: (1) quantify postural and psychosocial stress which may be contributory factors to accident and injury; (2) record the magnitude of aggression, sensation level and risky behaviour to employ behaviour based safety (BBS).
METHODS:
Healthy male motor bike riders (
RESULTS:
Result showed drivers experienced pain in low back (84%), thigh (82.67%), hand (81.33%), neck (68.67%) and shoulder (63.33%). Riders (62.67%) perceived the exertion as ‘hard and heavy’, 24.67% as ‘very hard’ and 12.67% as ‘somewhat hard’. Majority of the riders preferred looks and style, neglecting physiological comfort and safety. Magnitude of aggression, sensation and risky behaviour among bike riders were notably high.
CONCLUSIONS:
Quantification of these stressors is essential to implement engineering revision and behaviour based safety.
1.Introduction
The utility aspects of motorbike along with cost effectivity and fuel efficiency are the major causes for its immense popularity in India. At the same time, as per National Crime Records Bureau (NCRB) of India, in the year 2014, the road and driving related accidents claimed death of 13,787 motor bike riders [1]. Behaviour of the motorcyclist varies with the incident personal and social pressure at a particular moment. Similarly the perceptions regarding ‘risk’ and ‘safety’ is also variable. Prolonged awkward posture assumed during bike riding results in driving related musculoskeletal disorders (DMSDs), low back pain (LBP) and spinal injury [2, 3, 4, 5]. Psychological pressures like fulfilling deadlines, immense work targets, and achieving excessive incentives are also detrimental. Additionally, survey has been conducted to find out the factors influencing consumer buying behaviour of bike among Indian youths [6]. Advertisements are generally ‘stunt based’ [7] reflecting mainly an aggressive act, which play a key role in modulating choices. In the Indian scenario, the huge number of road traffic accident (RTA) involving bike riders requires a proper monitoring and preventive step. The ergonomic intervention aiming to reduce road traffic accidents involving bike must be based on both engineering revision of the bike and behaviour based safety. Aggression depicted in drivers’ behaviour may be a prominent causative factor for accidents. Behavioural management may bring significant ameliorative change in driver safety. Thus it is necessary to quantify postural and psychosocial stressors which may lead to accidents and injury. An attempt to grade the level of aggression among drivers while driving is important to employ the required behaviour based safety (BBS) program. Thus the magnitude of risky, aggressive and sensation seeking behaviour should be recorded and compared with the drivers’ self-analysis of risk.
2.Methods
2.1Ethical clearance
Ethical clearance was obtained from Institution Ethical Committee (Human) and all the data collection was done following the ‘Declaration of Helsinki’.
2.2Selection of subjects
Healthy adult male motorbike riders (
2.3Evaluation of postural stress
Videography and photography methods were employed to assess postural stress. Stick diagrams were prepared from frozen frame videos and they were analysed by rapid upper limb assessment (RULA) and rapid entire body assessment (REBA) to find out the magnitude of risk of MSDs [8, 9].
2.4Assessment of body part discomfort
Body part discomfort was assessed using Modified Nordic questionnaire [10].
2.5Evaluation of rate of perceived exertion
Rate of perceived exertion was evaluated by Borg 15 point rate of perceived exertion (RPE) scale [11].
2.6Questionnaire study
The subjects were asked about the most behavioural factor influencing purchase of bikes. They were given three options: i. Looks and style, ii. Mileage iii. Physiological comfort and safety [6].
2.7Assessment of driver behaviour
Motor cycle rider questionnaire was employed (
2.7.1Self identity as a safe rider
Two items assessed on a 7-point Likert scale – Strongly Disagree to Strongly Agree.
• I am the sort of rider who rides safely at every opportunity
• I am the sort of rider who takes risks at every opportunity
2.7.2Propensity for aggression scale
Six items [Cronbach’s
Participants were asked to think about their riding on public roads in the last 12 months and asked how often they:
• Felt frustrated by other road users;
• Felt angry and aggressive towards another road user;
• Indicated your hostility towards another road user by whatever means you could;
• Gave chase when angered by another rider or road user;
• Physically attacked another vehicle or rider/driver when angered;
• Ridden especially close to the car in front as a signal to its driver to go faster or get out of the way.
2.7.3Sensation seeking scale
Seven items [Cronbach’s
• I would enjoy riding a motorcycle on a road with no speed limit
• I enjoy the sensation of accelerating rapidly;
• I enjoy taking risks on my motorcycle;
• I get a real thrill out of riding fast;
• I enjoy cornering at high speed;
• I would like to be a professional motorcycle racer;
• I sometimes like to frighten myself a little while riding.
2.7.4Risky driving behaviour
Ten items questionnaire [with a Cronbach’s
• Pulled out on to a main road in front of a vehicle that you had not noticed or whose speed you misjudged;
• Failed to notice another vehicle pulling out in front of you and then had difficulty stopping;
• Attempted to overtake someone that you had not noticed to be signalling a right turn;
• Failed to notice a pedestrian who was crossing in front of you or stepping out from behind a parked car until it was nearly too late;
• Needed to brake urgently to avoid rear ending of the vehicle stopping in front of you;
• Ridden when you were or might have been over the legal blood alcohol limit;
• Ridden when you were too tired;
• Ridden in between two lanes of fast moving traffic;
• Ridden between two lanes of stationary traffic;
• Frequently changed lane to get ahead of traffic.
2.8Statistics
Descriptive statistics e.g., Mean, Standard Deviation (SD), percentage of different parameters were calculated. Cronbach’s alpha was determined to assess the internal consistency of test items. All the statistical analyses were done by using MS Excel 2010.
3.Results
Table 1 shows mean and SD of demographic variables i.e., age of the bike riders and their experience of bike riding.
Table 1
Mean (SD) of demographic variable
| Variable | Mean | SD |
|---|---|---|
| Age (years) | 25.9 | 2.64 |
| Years of experience (years) | 3.7 | 1.67 |
Figure 1.
Analysis of frequently adopted postures of motorbike riders.
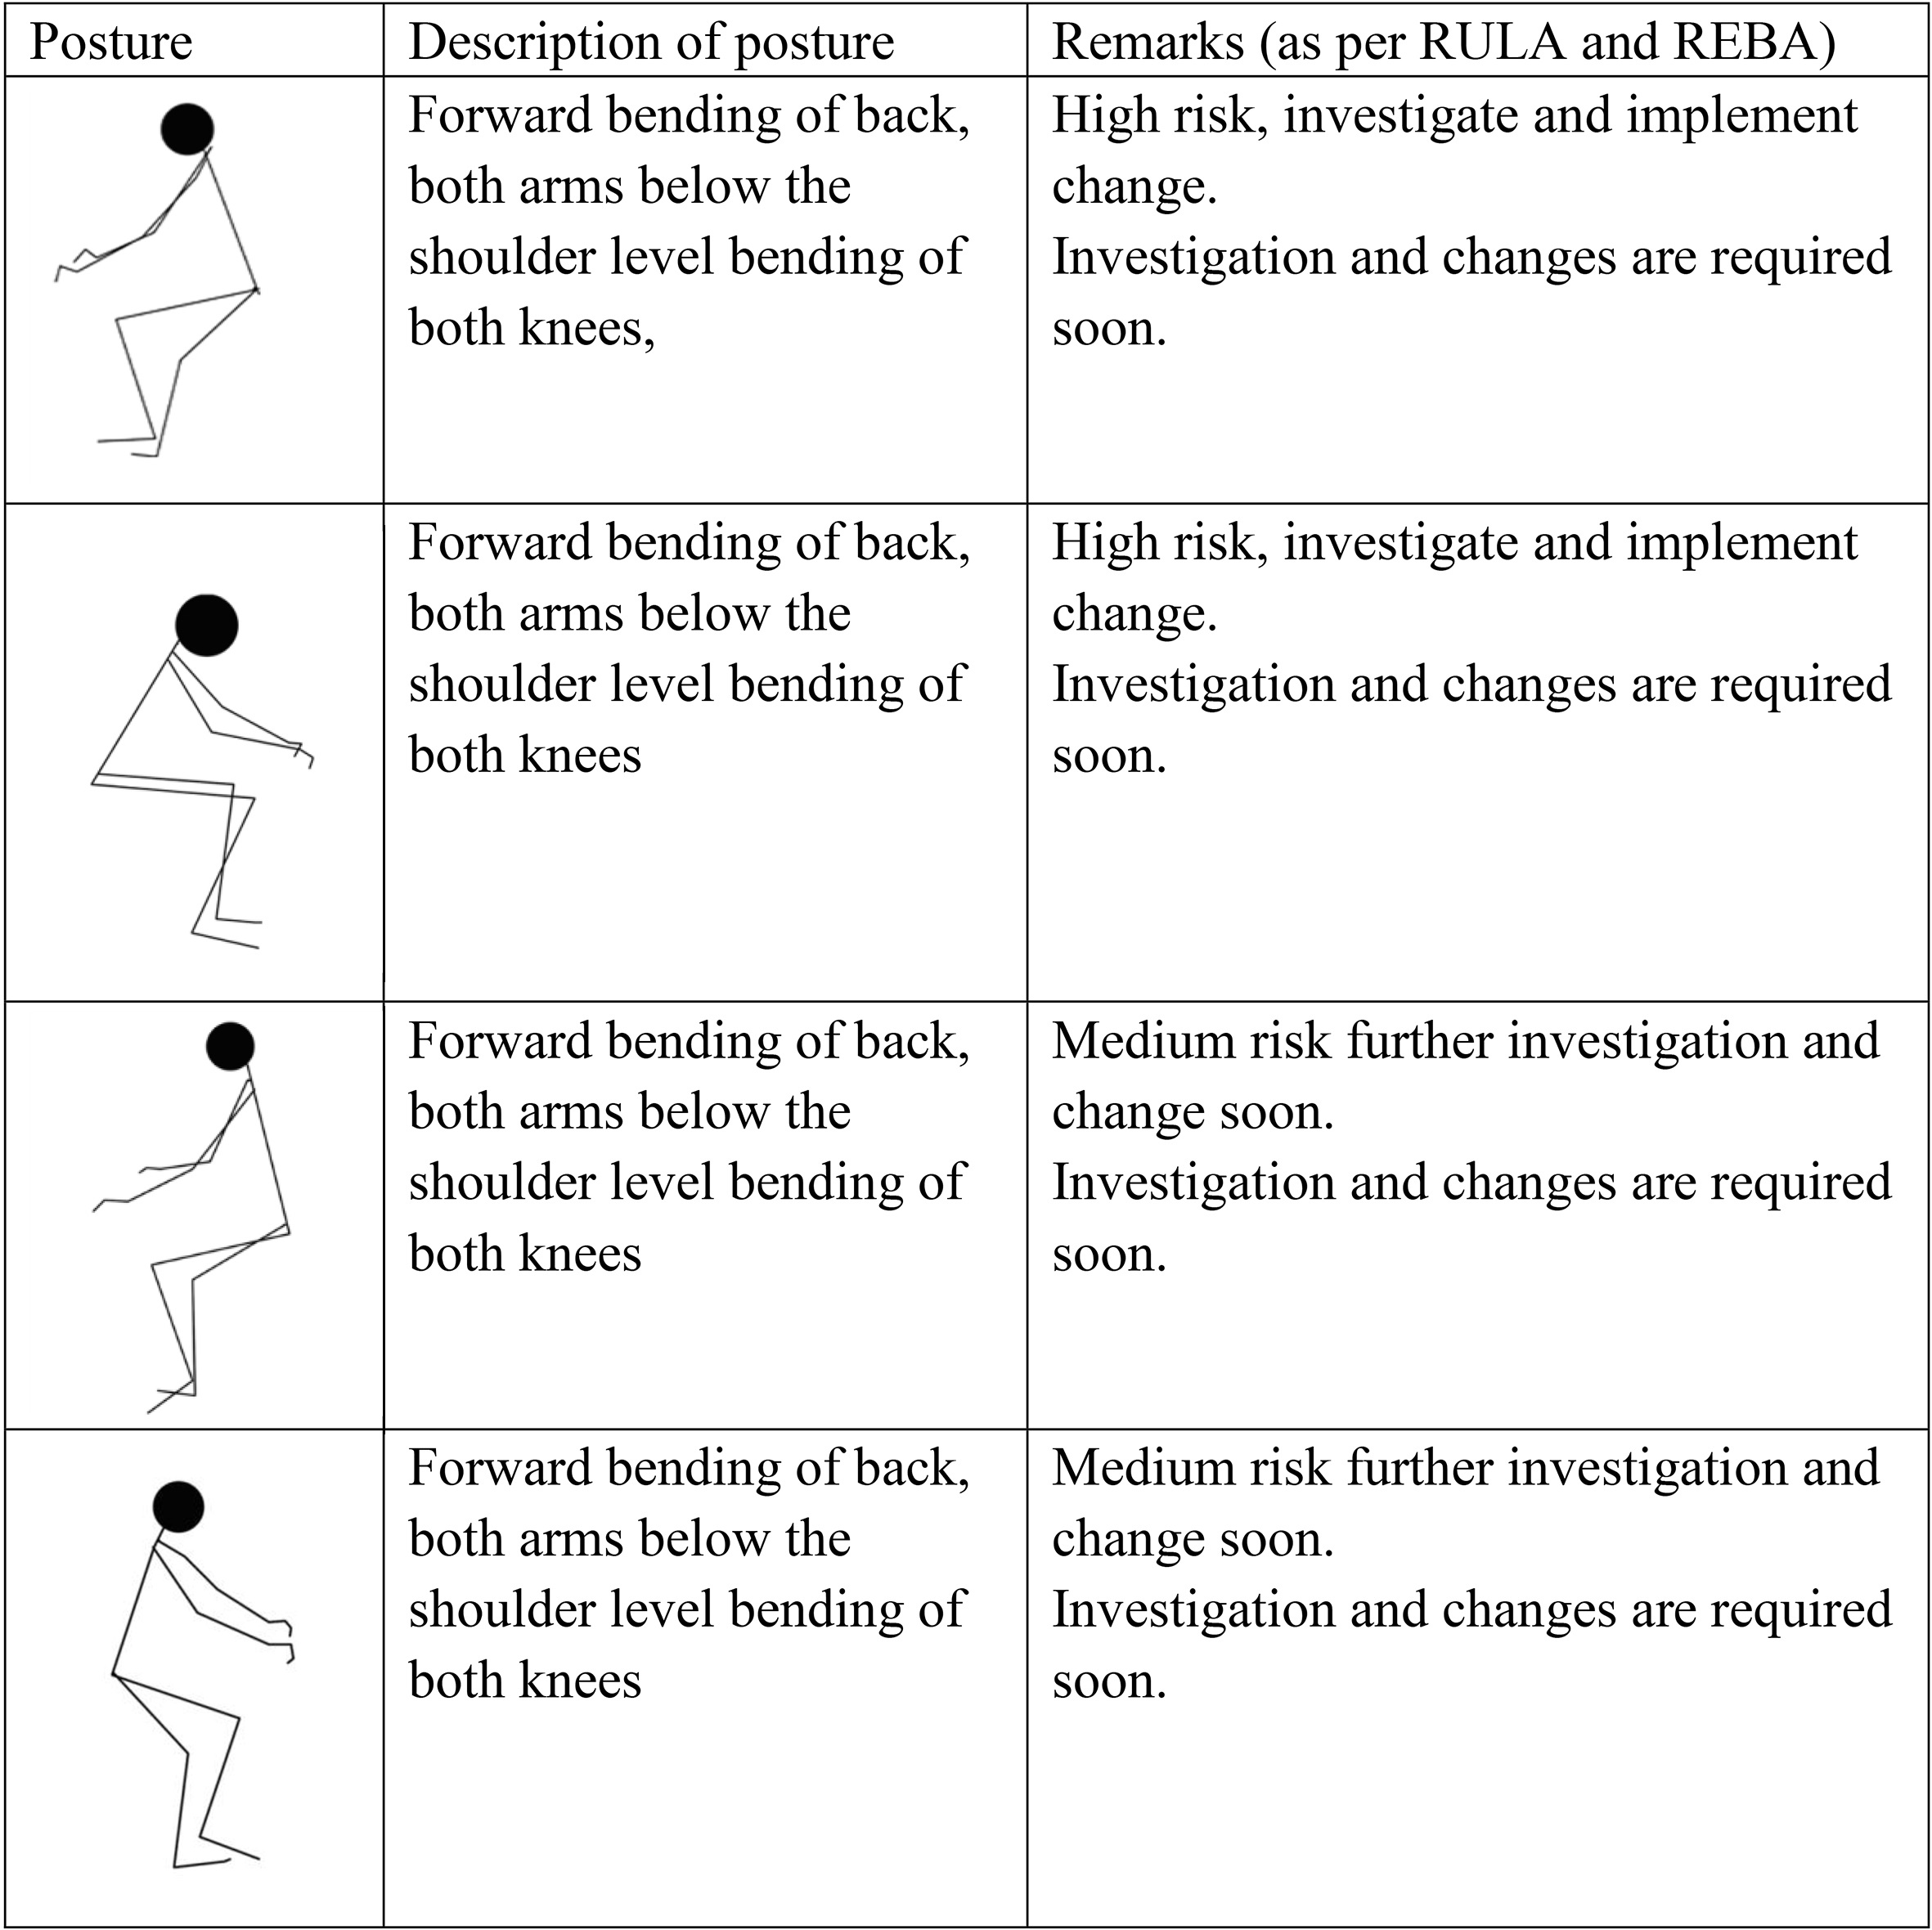
Figure 2.
Percentage of motorbike riders experienced pain in different body parts (adapted from Nordic questionnaire).
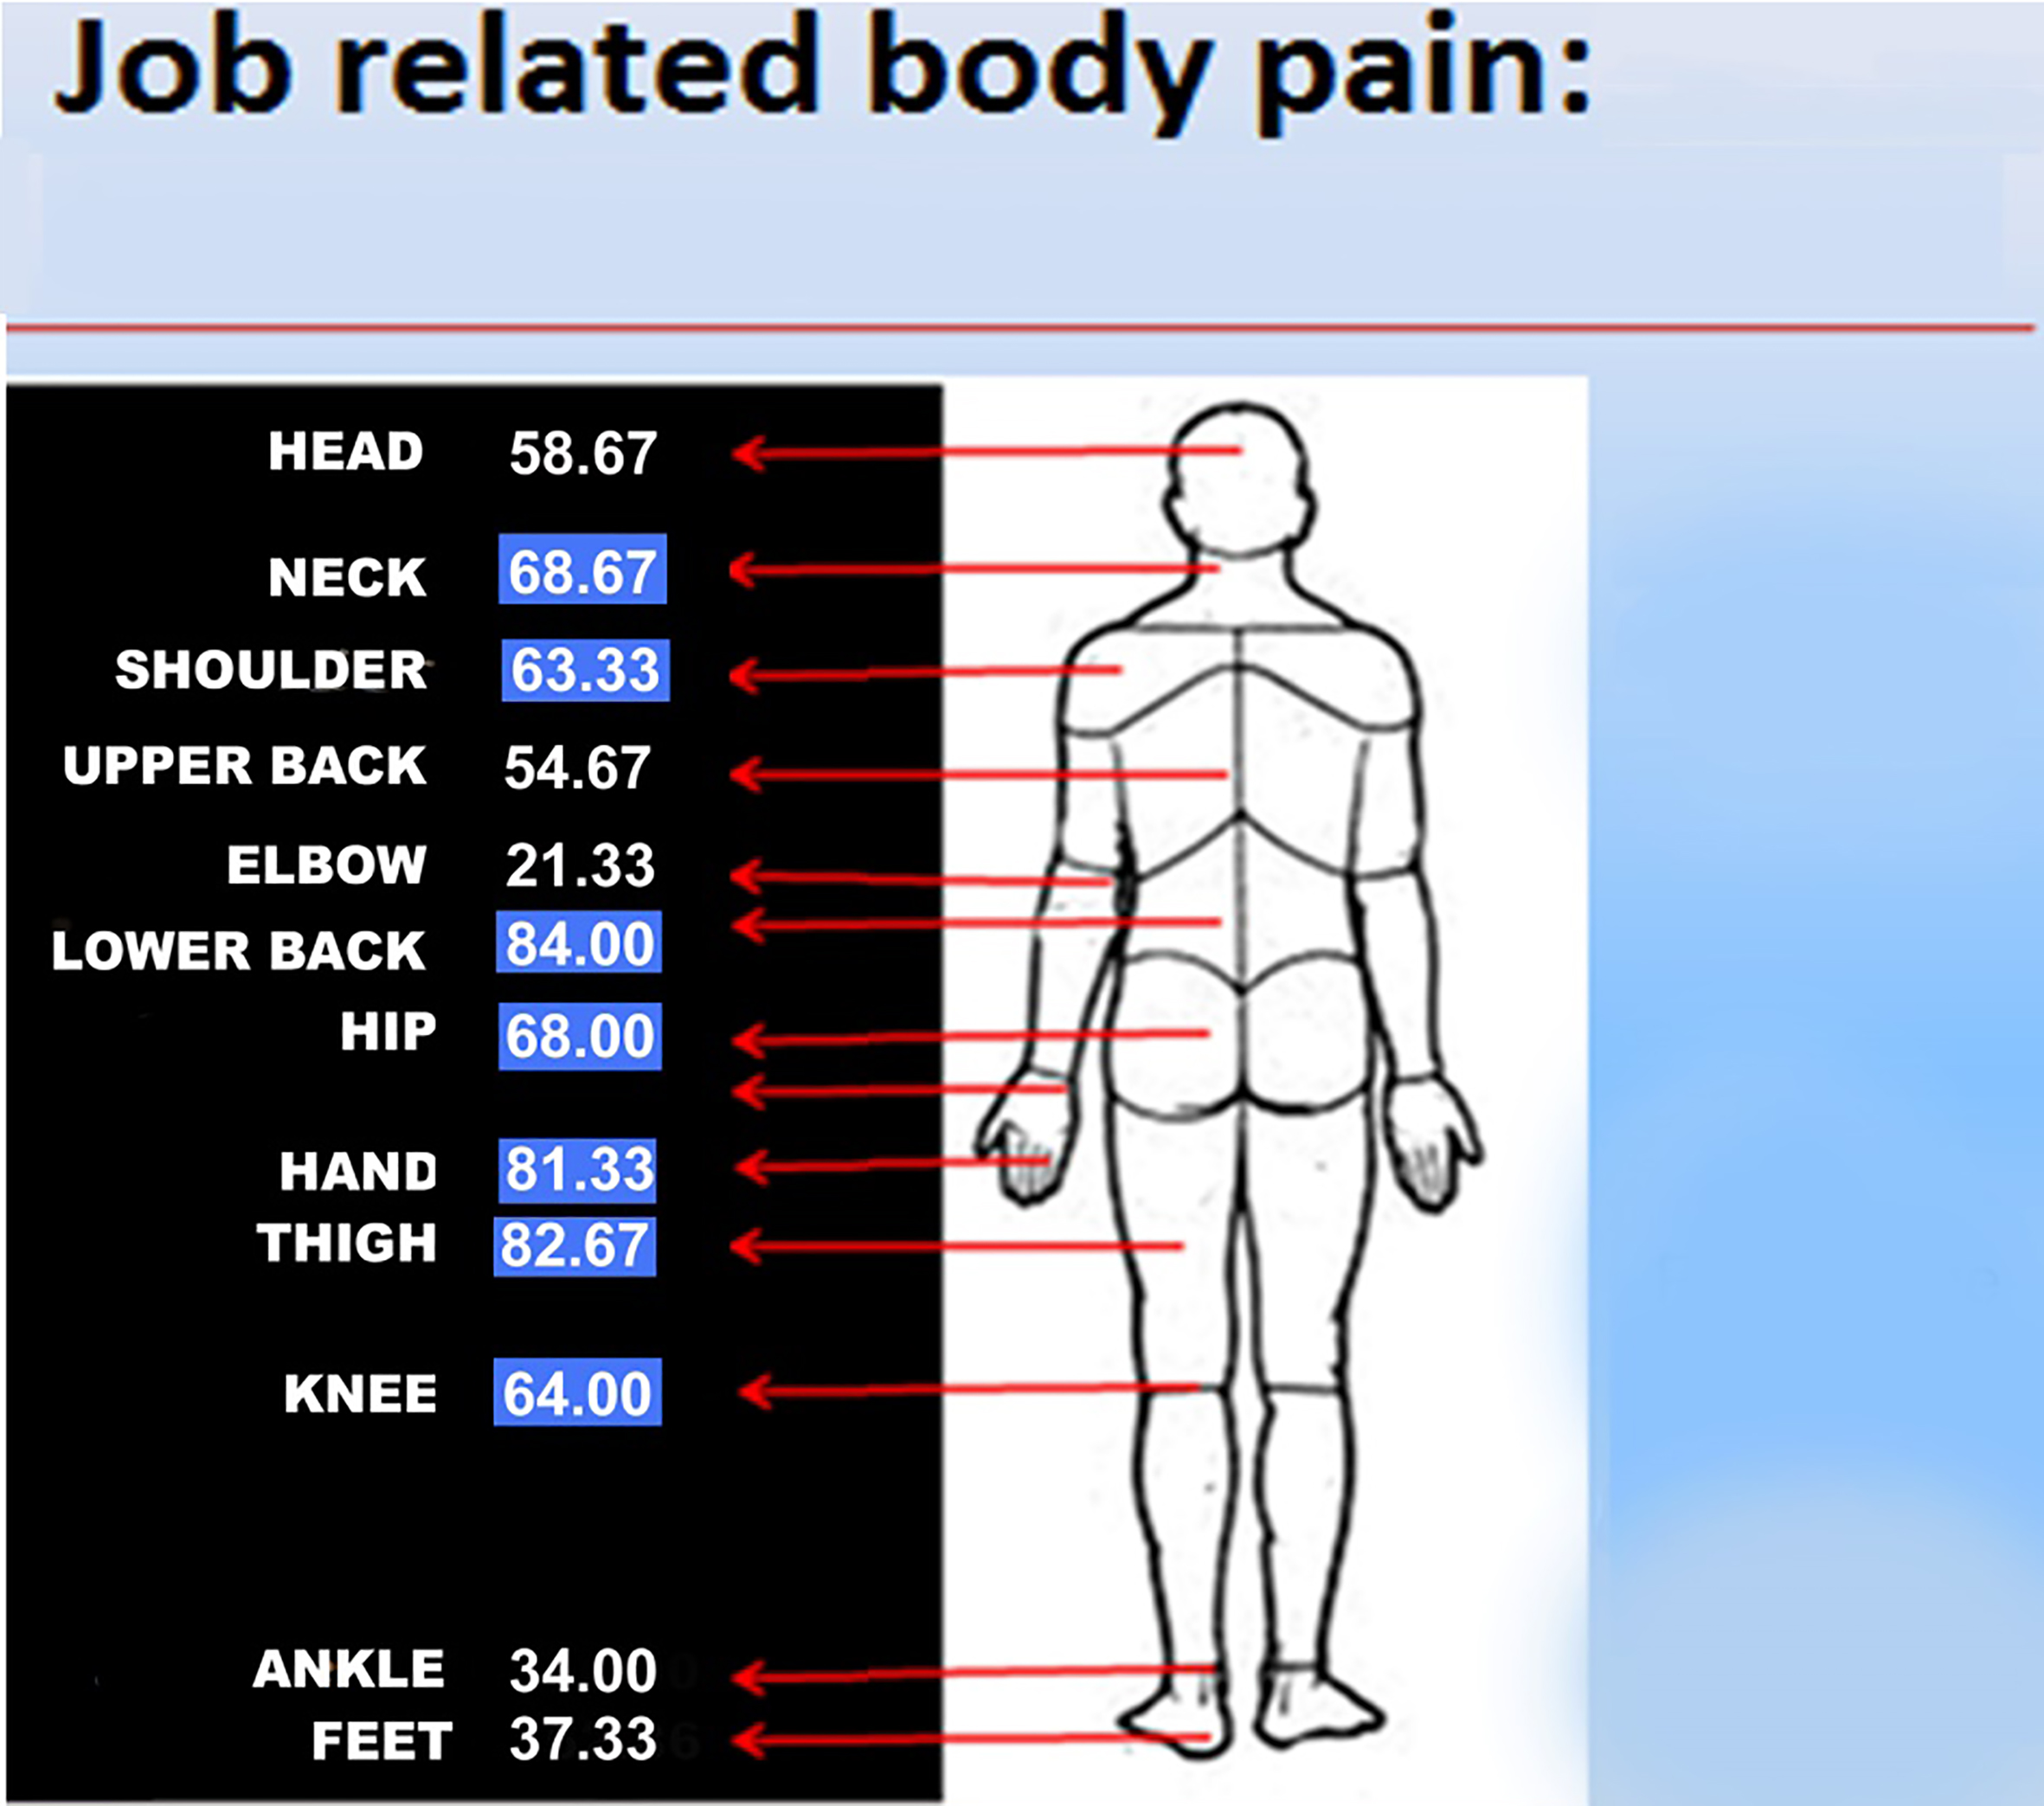
Figure 1 shows analysis of frequently adopted postures of motorbike riders. RULA and REBA postural stress evaluation of the bike riders was performed with questionnaire and photographic transformation into stick diagram. RULA and REBA analyses revealed high and medium risks were associated with the postures adopted during riding and changes were required soon.
Figure 2 shows low back pain was highest among riders (84%) followed by pain in thigh (82.67%), hand (81.33%), neck (68.67%) and shoulder (63.33%).
Table 2 shows among the bike riders 62.67% perceived the exertion due to riding as ‘hard and heavy’, 24.67% as ‘very hard’ and 12.67% as ‘somewhat hard’.
Figure 3 shows percentage of consumers as per preference of purchase of bike. This study showed that most of the consumers preferred ‘looks and style’ while purchasing bike.
Table 3 shows mean (SD) of perception of riders (in 7 point Likert scale) with respect to their safety as per self perception of as a safe rider, it was observed that mean (SD) of first question was 5.8 (1.17) and second question was 2.4 (1.29). This indicates that the drivers perceived themselves as safe riders.
Figure 4 shows mean score and grade of aggression of individual question. Figure 5 shows percentage of bike riders according to grade of aggression. Propensity for aggression among the drivers was determined with a set of six questions. The internal consistency of the questions was verified with the Chronbach’s
Table 2
Percentage of motorbike riders perceived exertion due to riding
| Activity | Somewhat hard (%) | Hard (%) | Very hard (%) |
|---|---|---|---|
| Bike riding | 12.67 | 62.67 | 24.67 |
Table 3
Mean (SD) of perception of motorbike riders with respect to their safety
| Question (7 point Likert scale) | Mean (SD) |
|---|---|
| I am the sort of rider who rides safely at every opportunity | 5.8 (1.17) |
| I am the sort of rider who takes risks at every opportunity | 2.4 (1.29) |
Figure 3.
Percentage of consumers as per preference of purchase of bike.
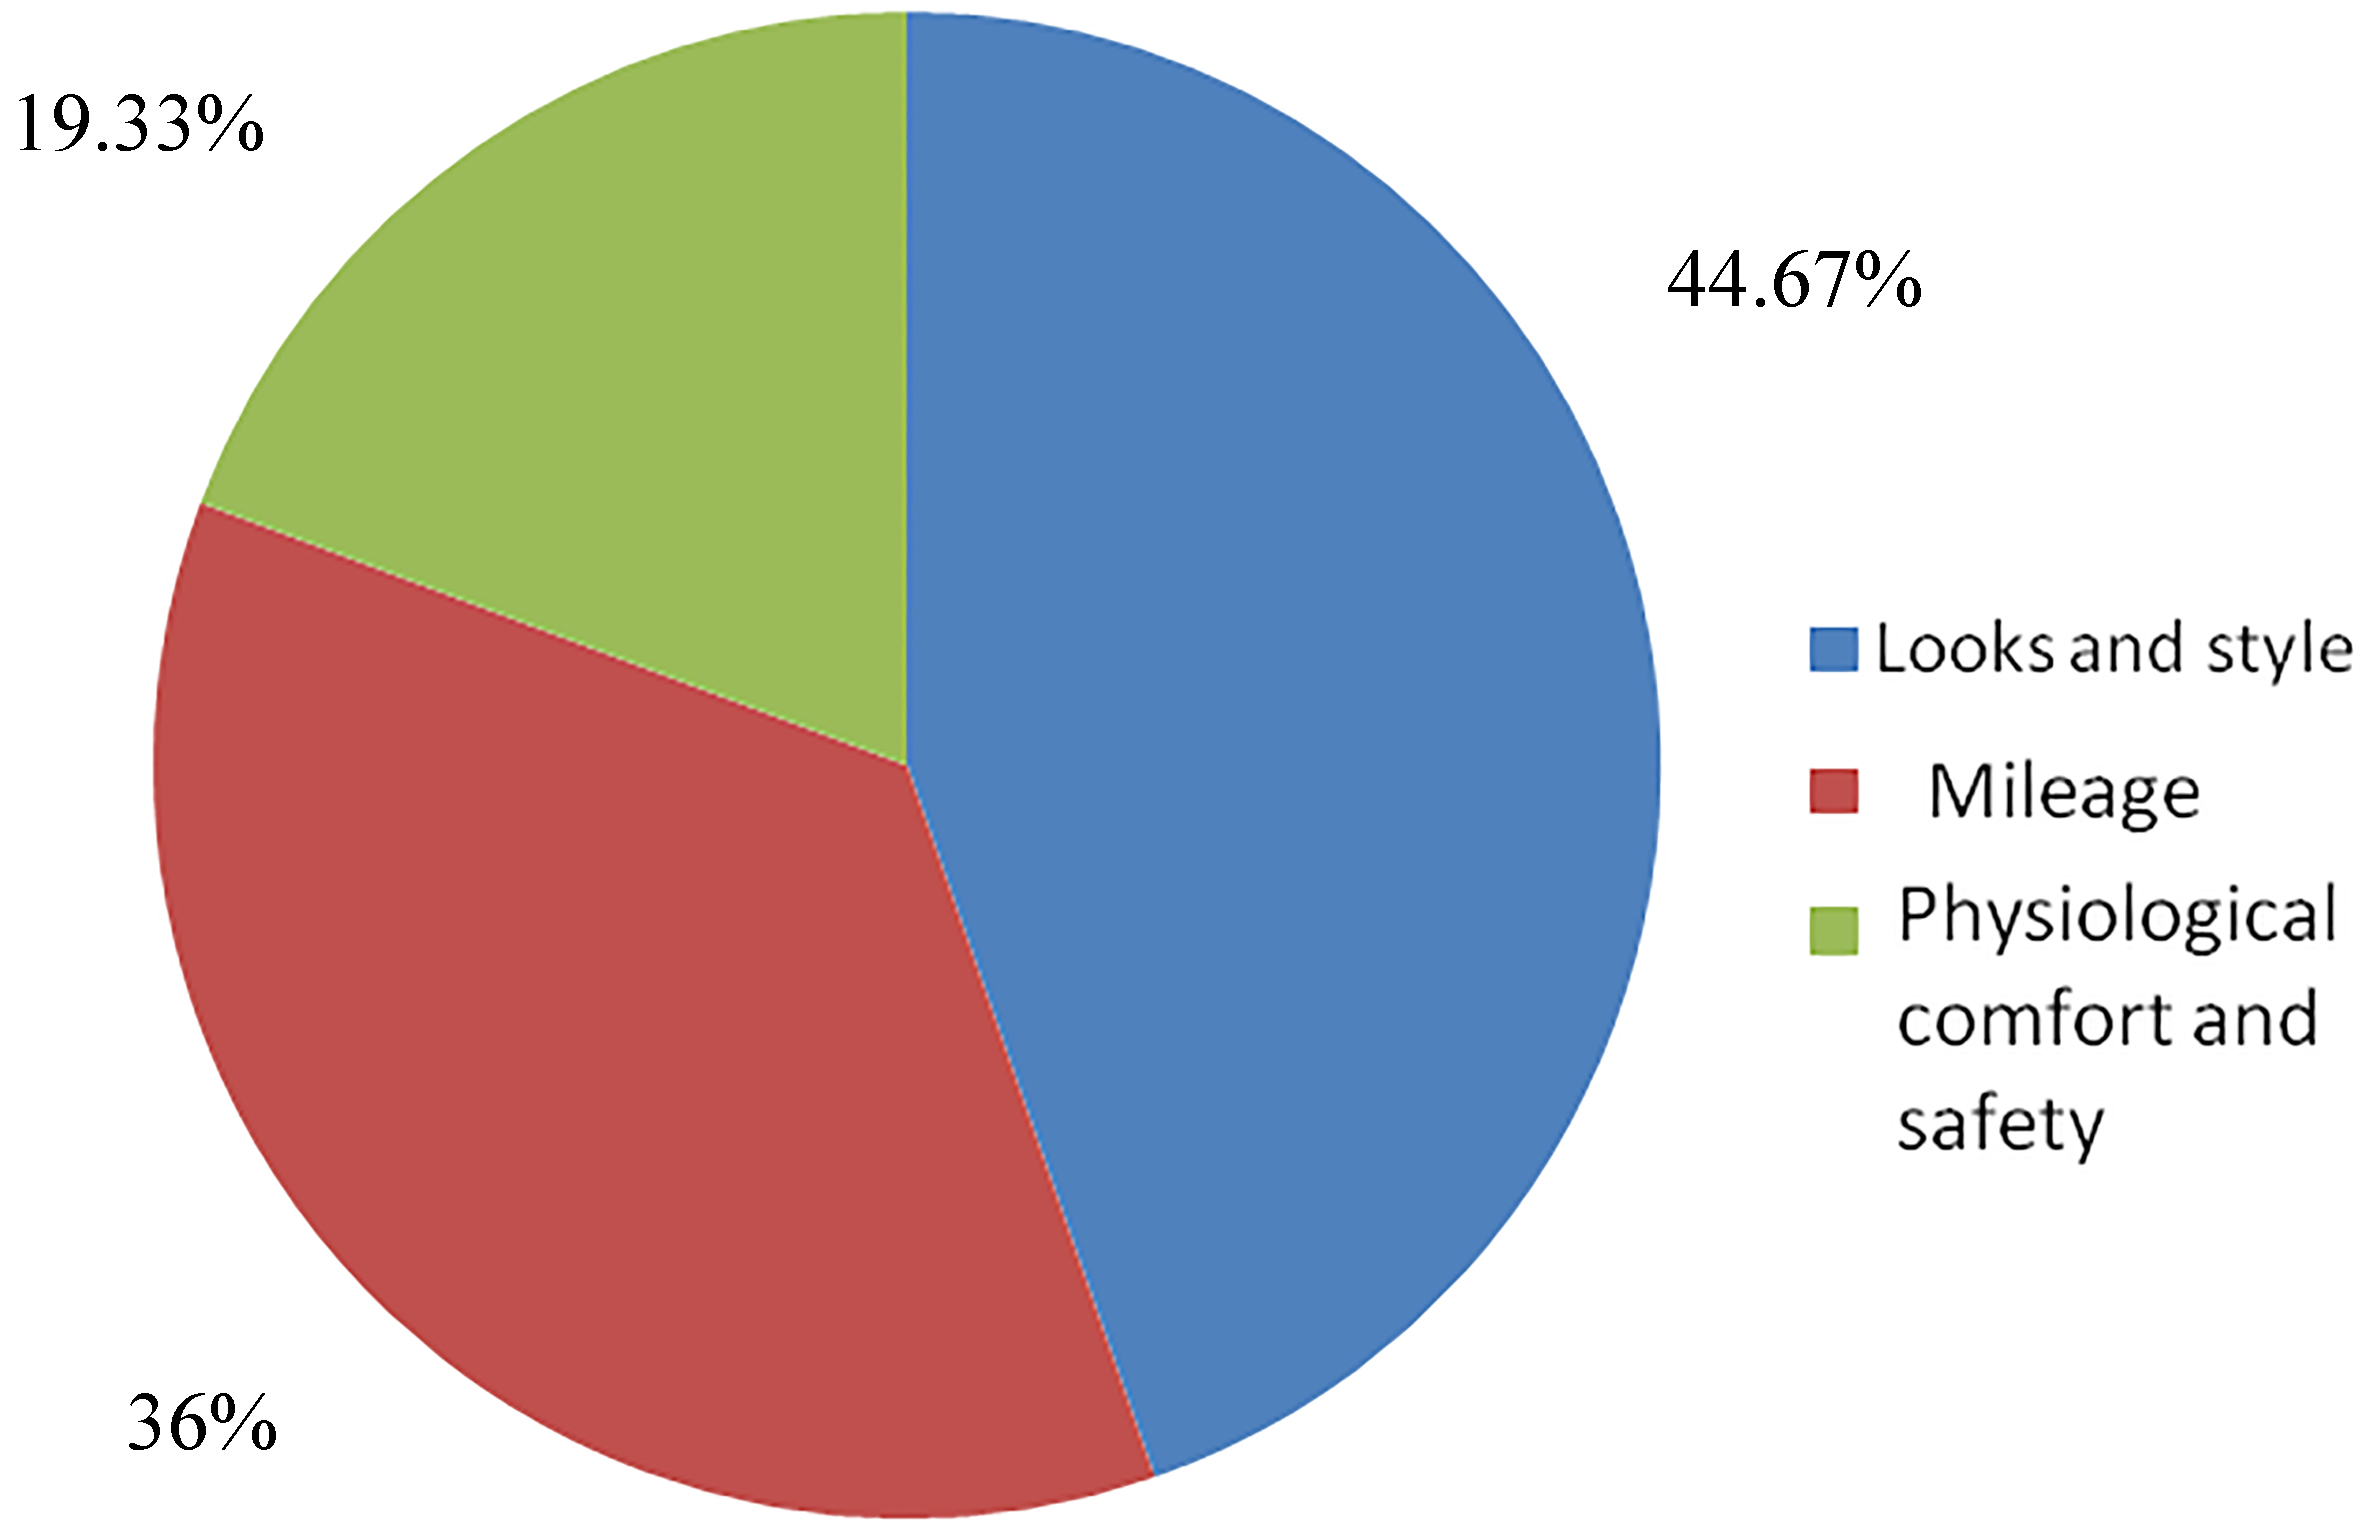
Figure 4.
Mean score and grade of aggression.
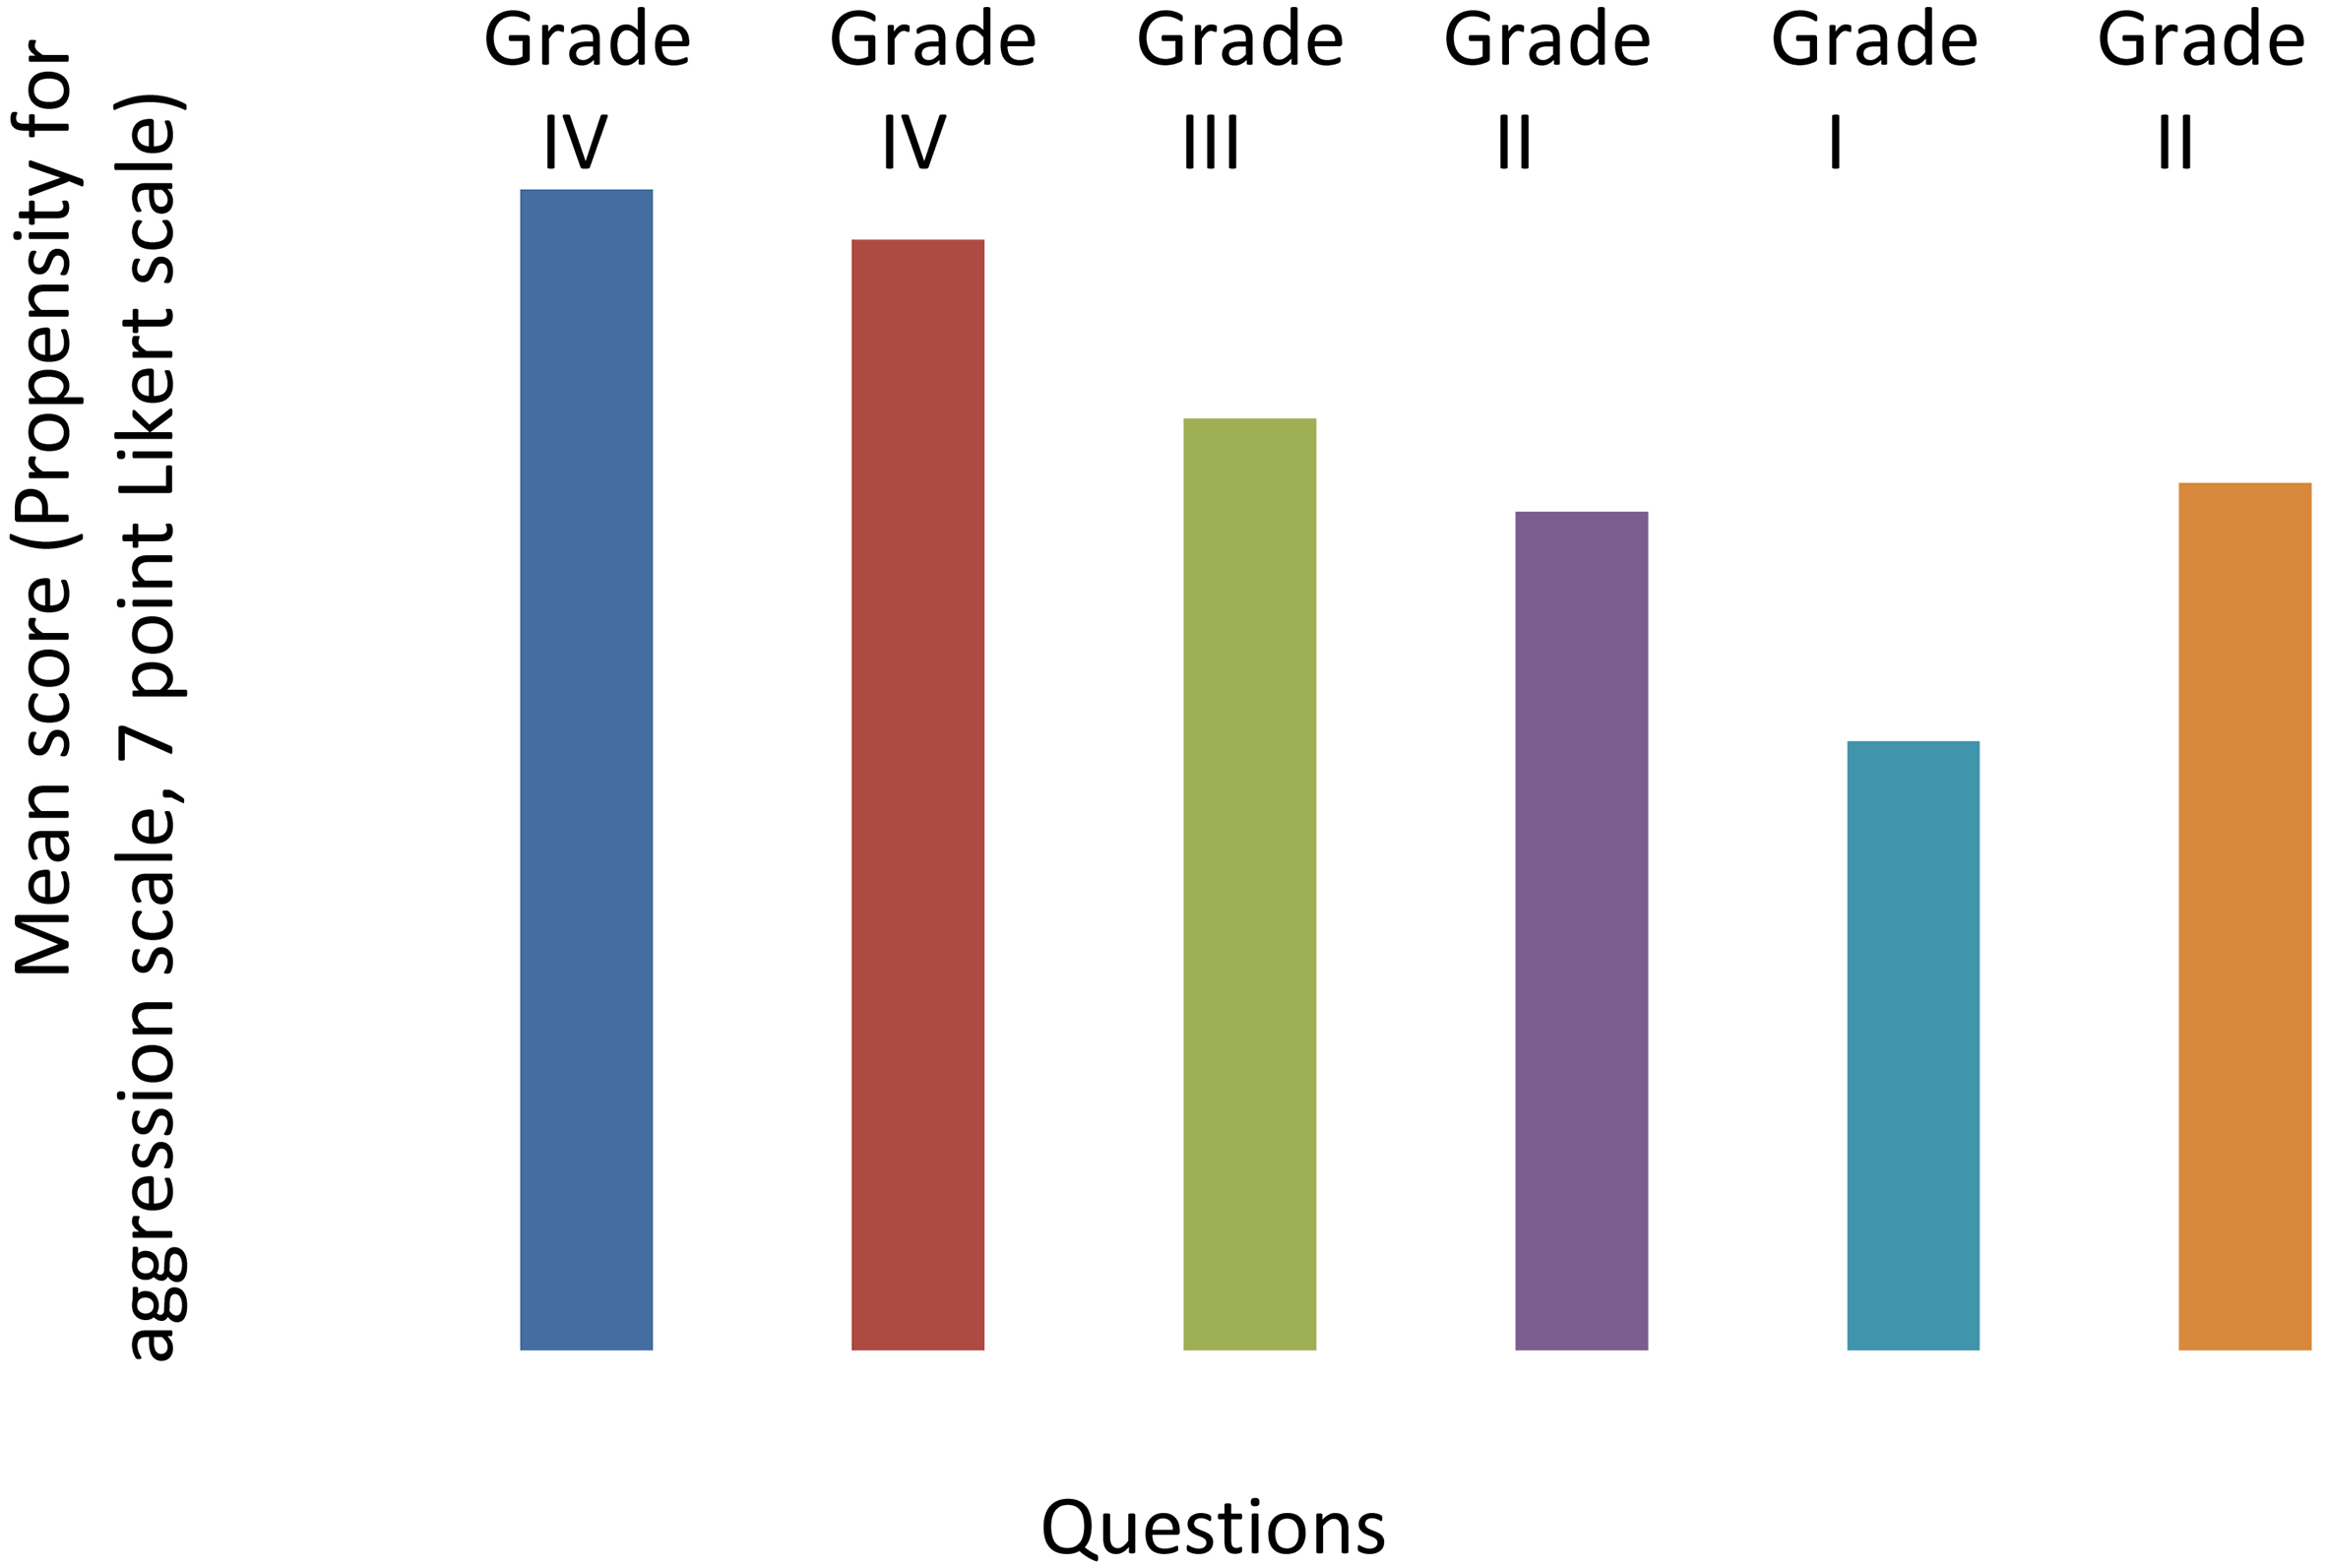
Figure 5.
Percentage of motorbike riders according to grade of aggression.
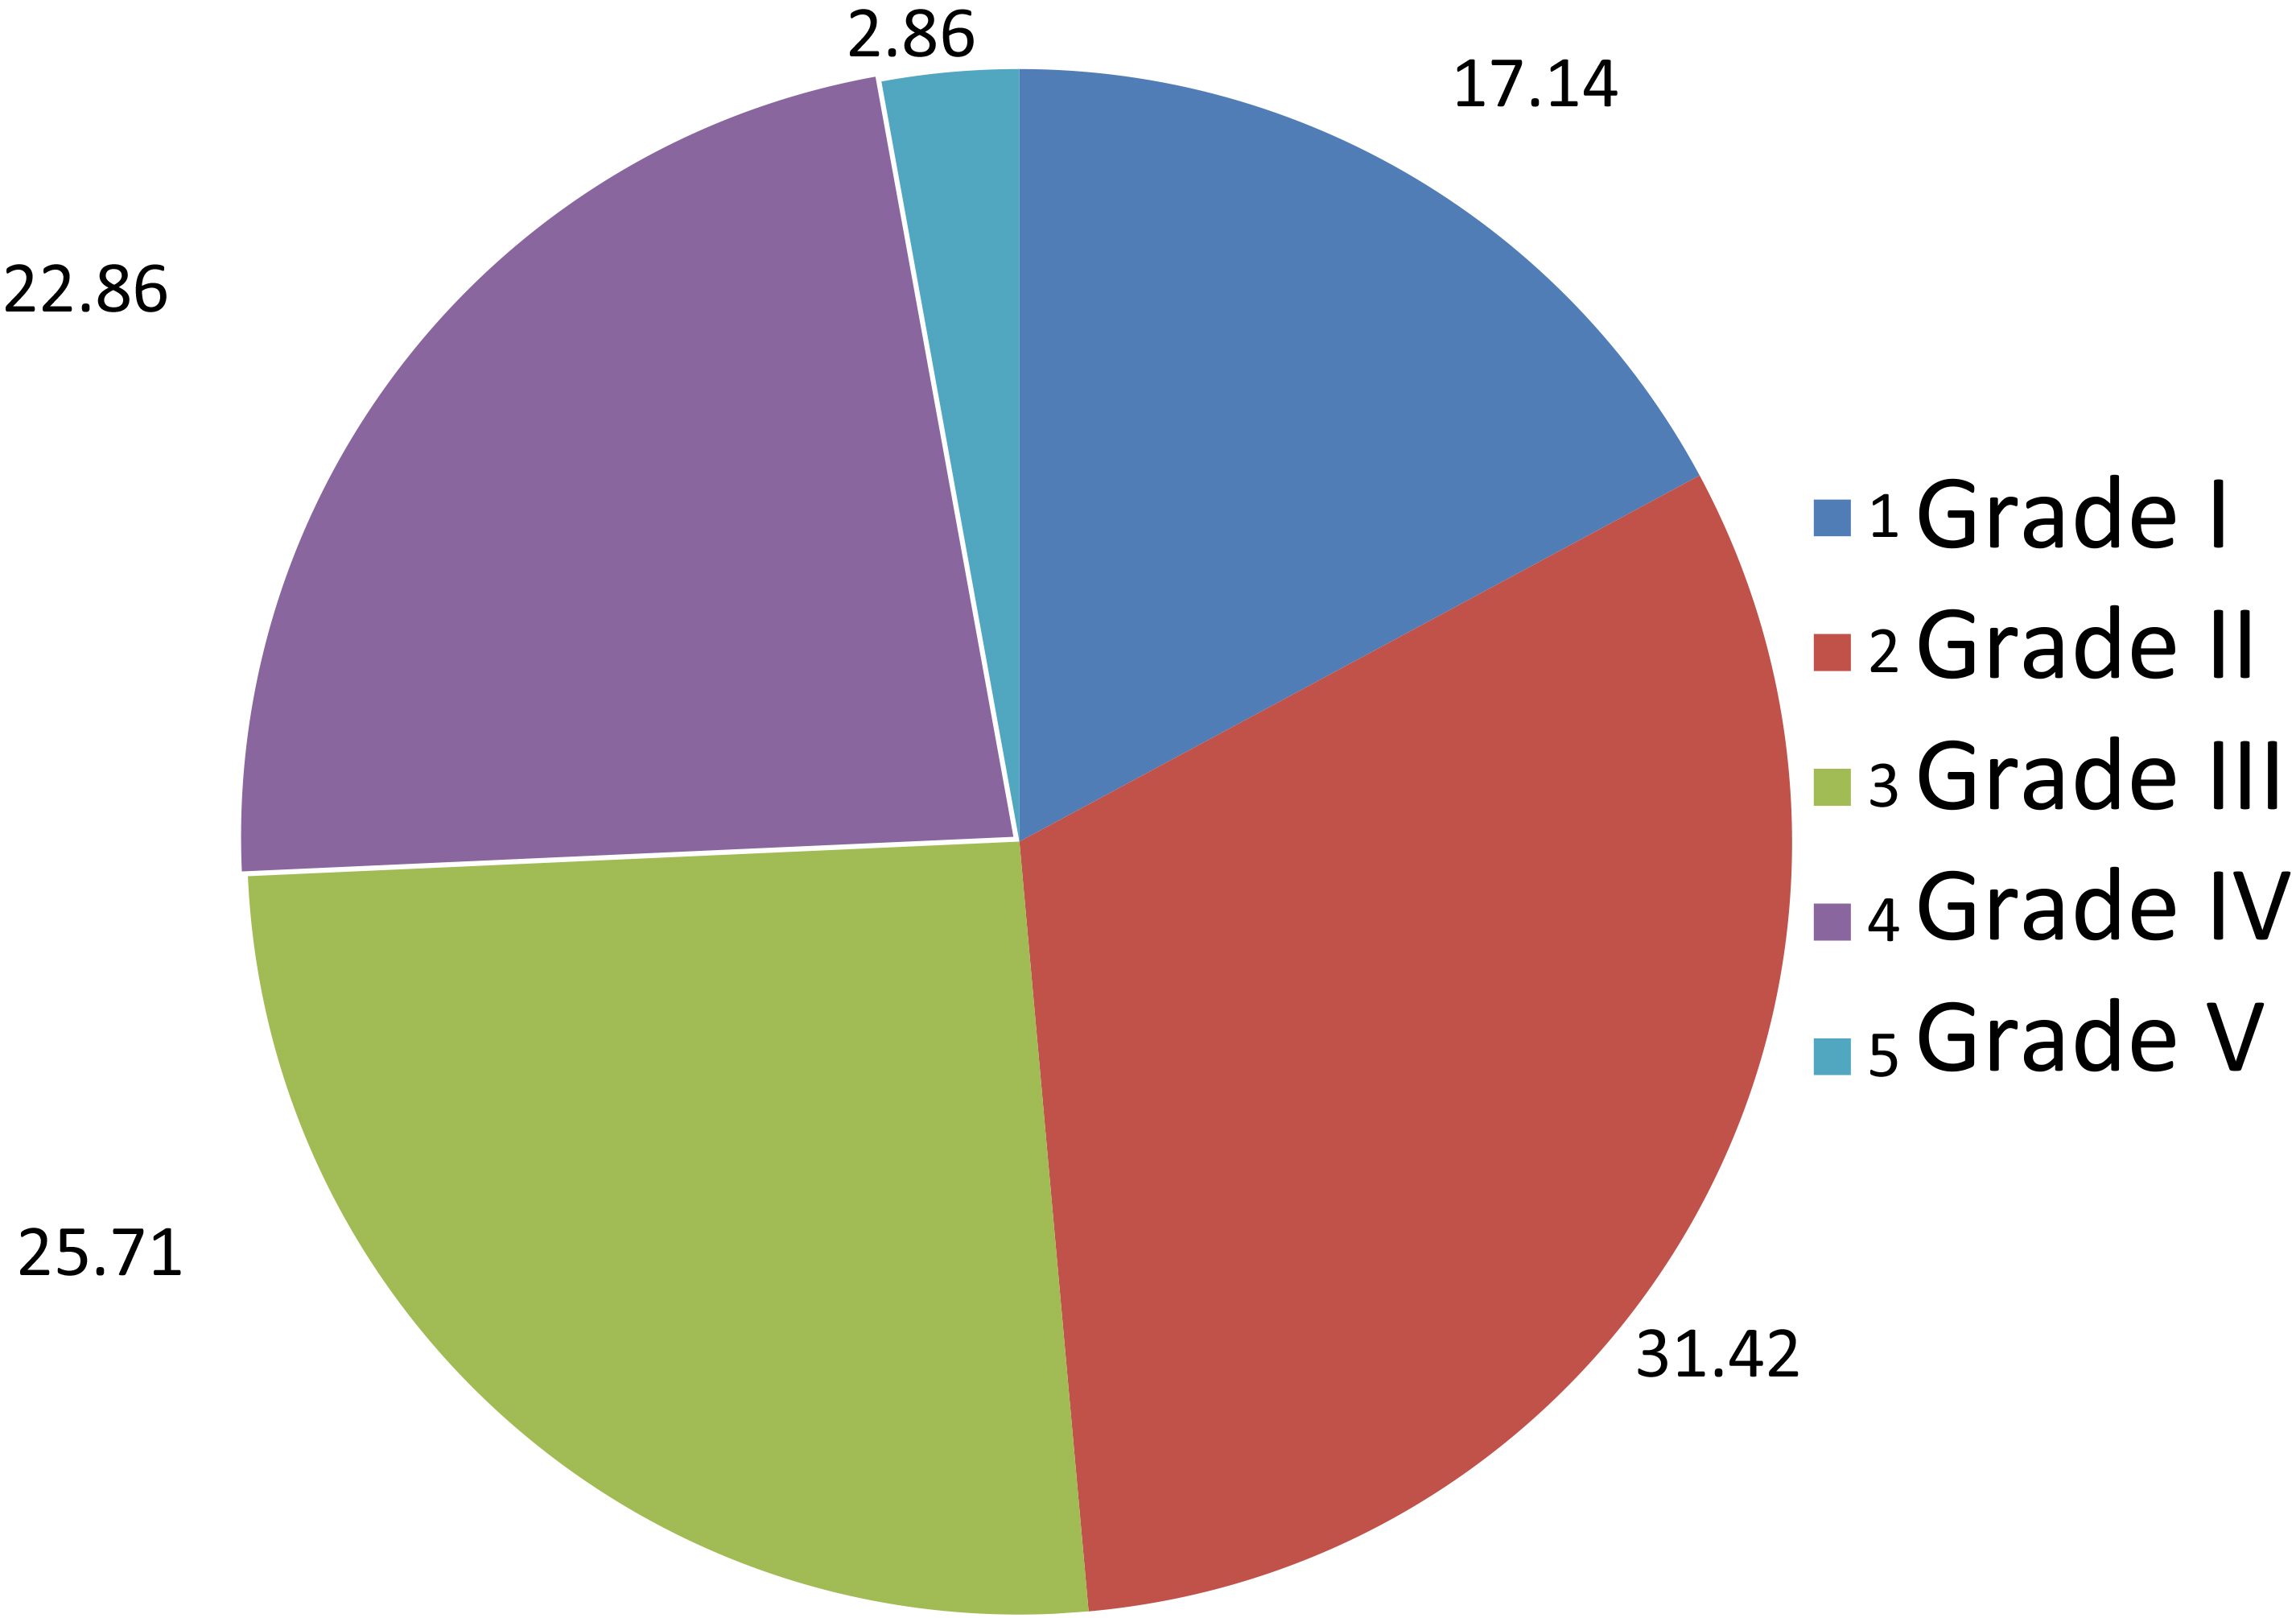
Figure 6.
Mean score and grade of sensation.
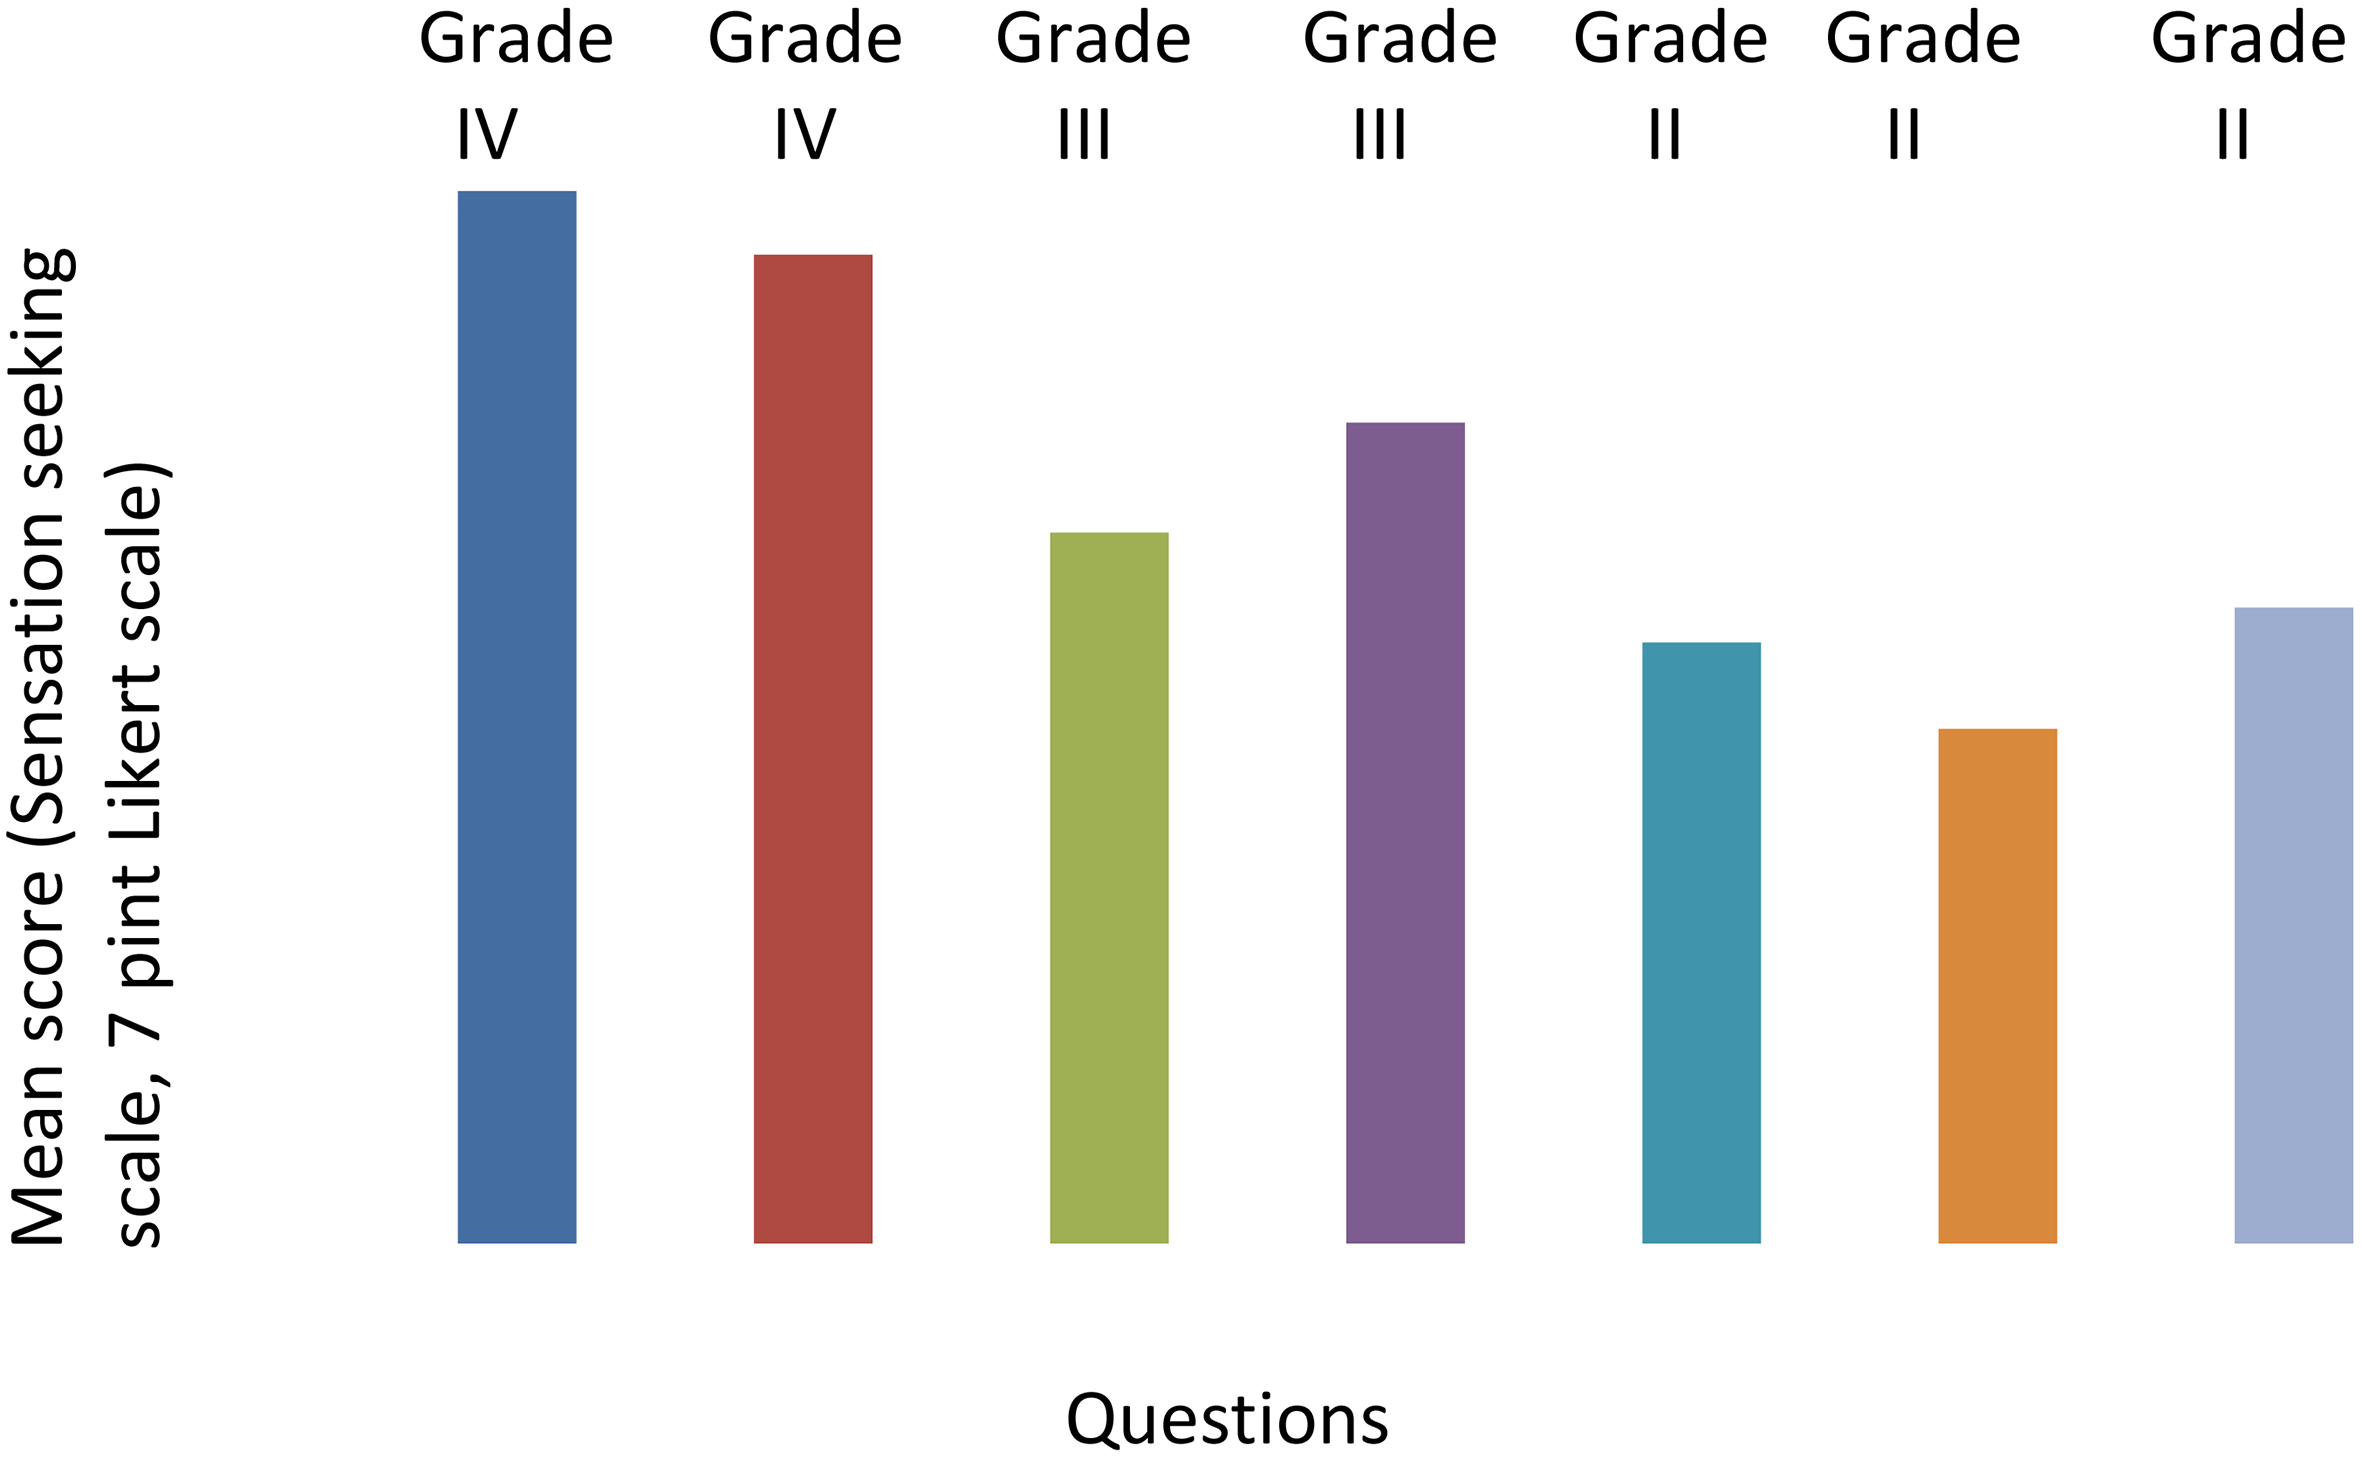
Figure 7.
Percentage of motorbike riders according to grade of sensation.
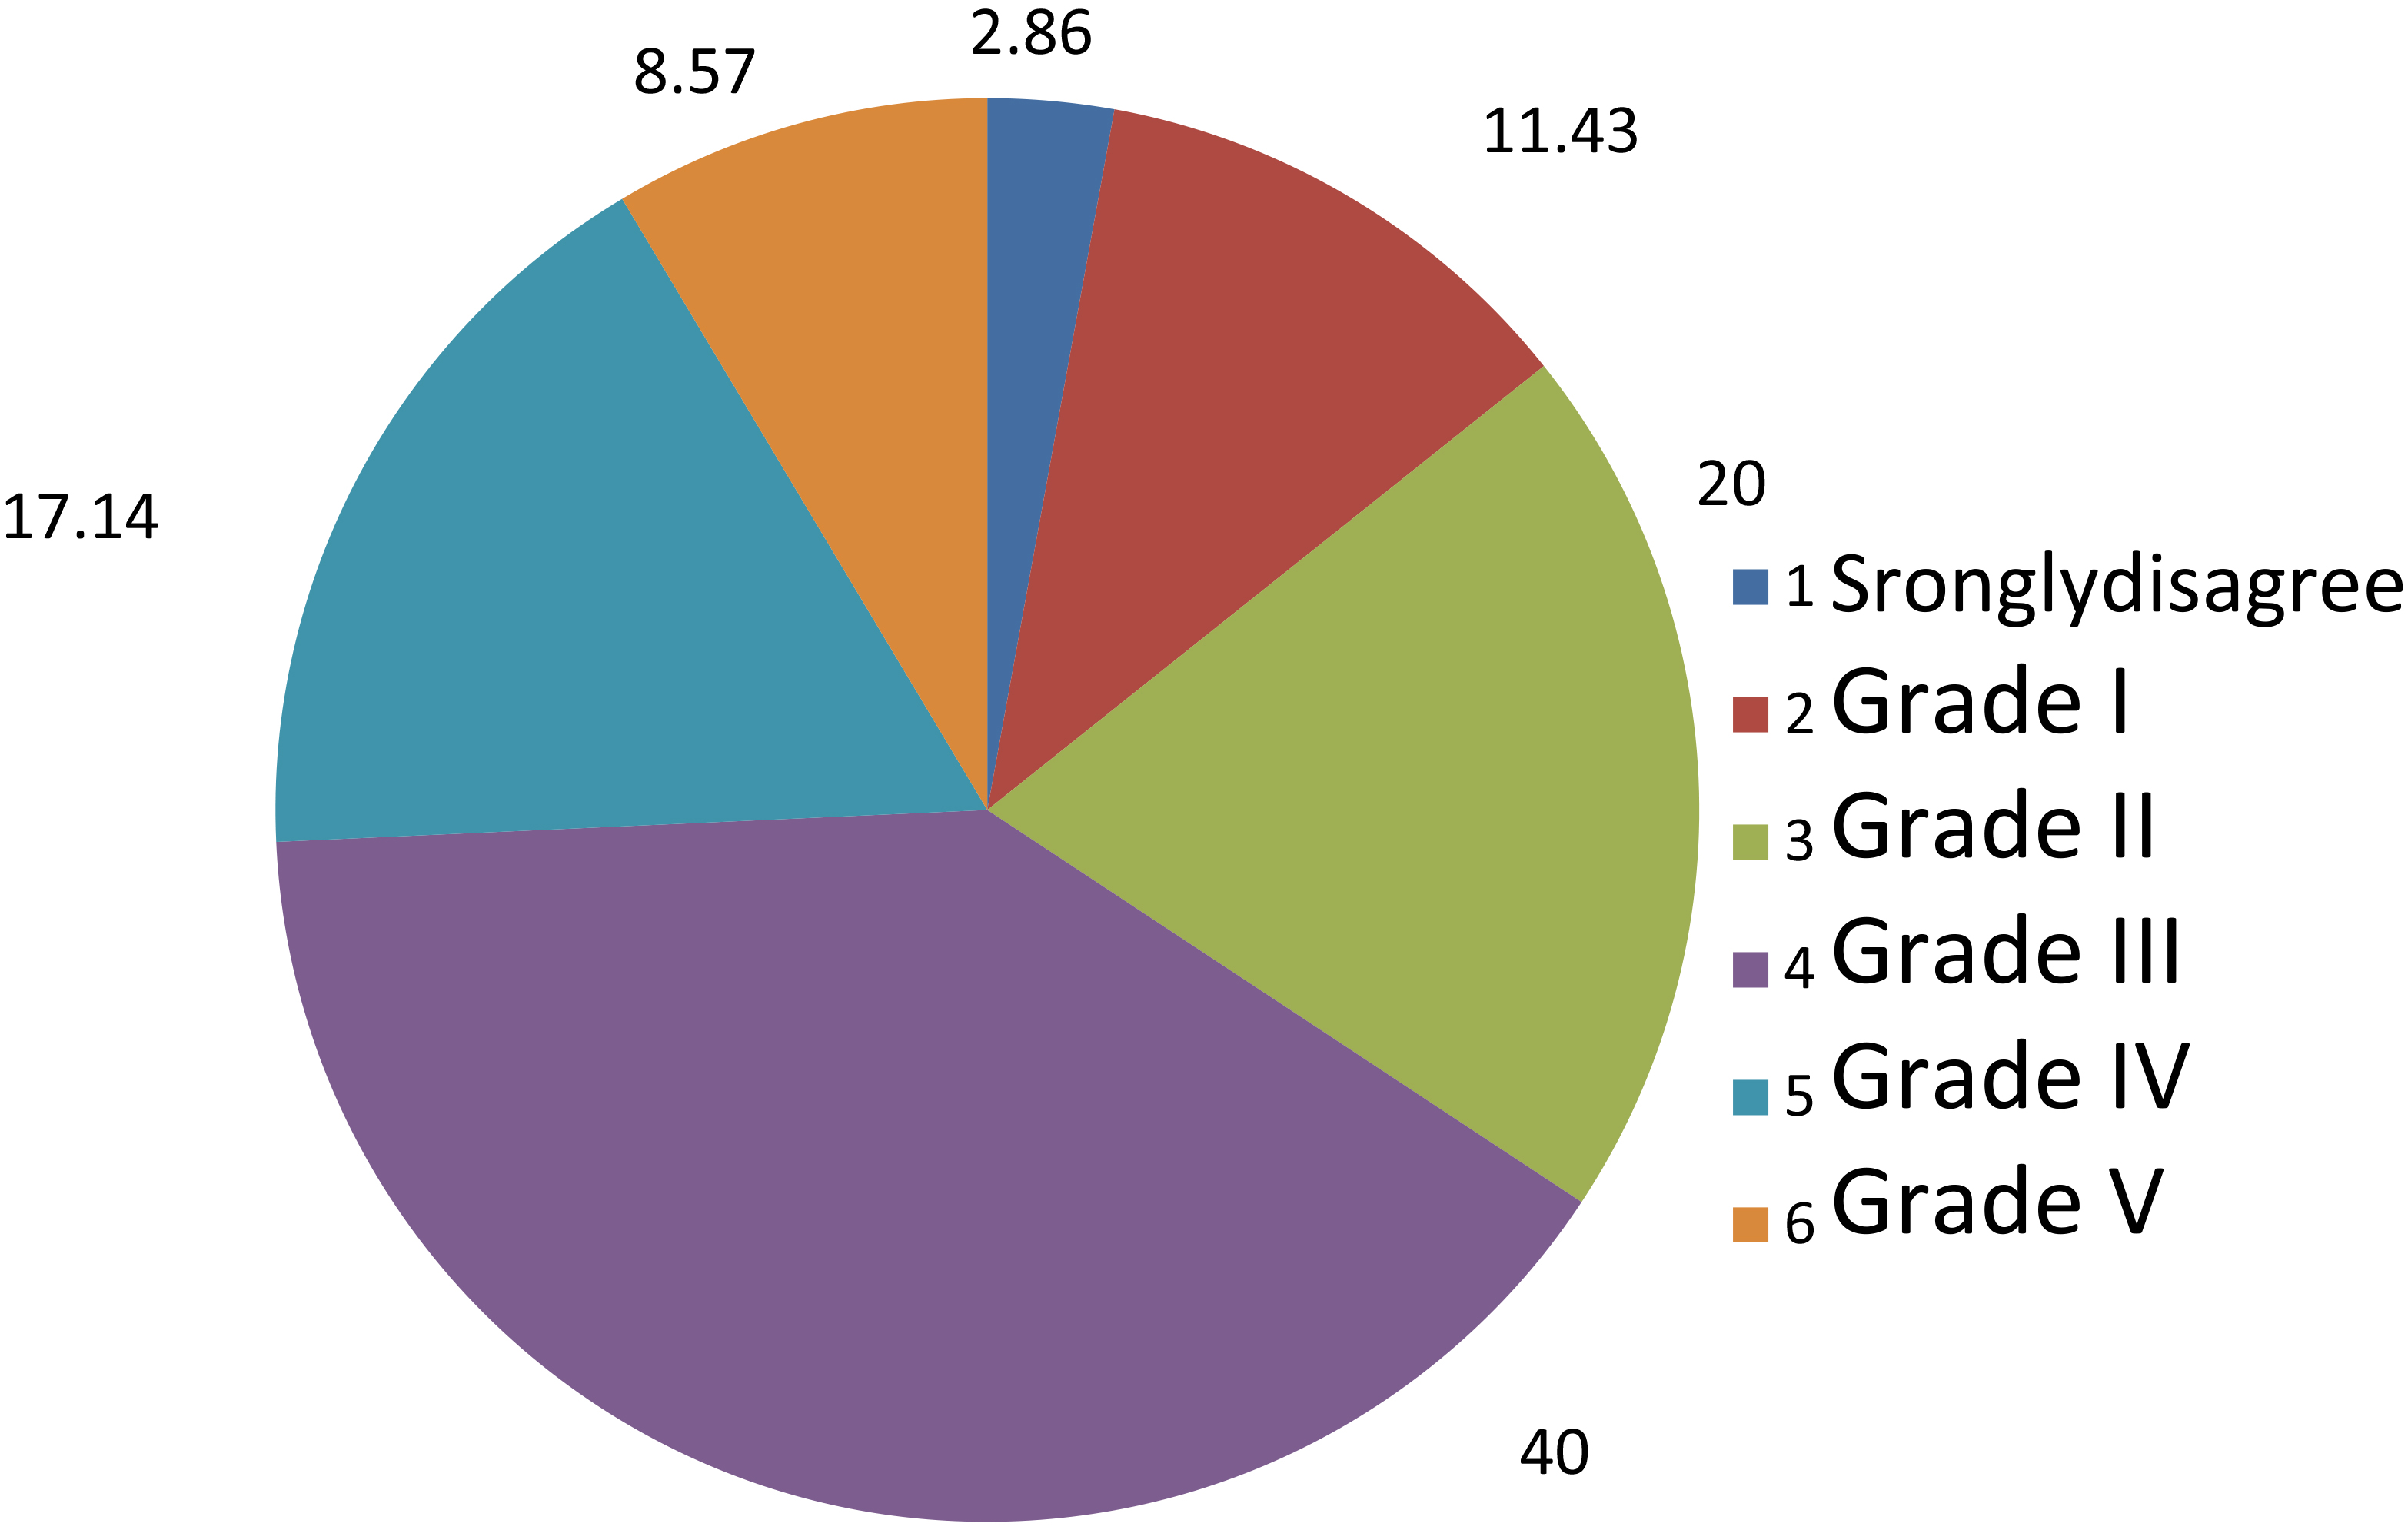
Figure 8.
Mean score and grade of risky behaviours.
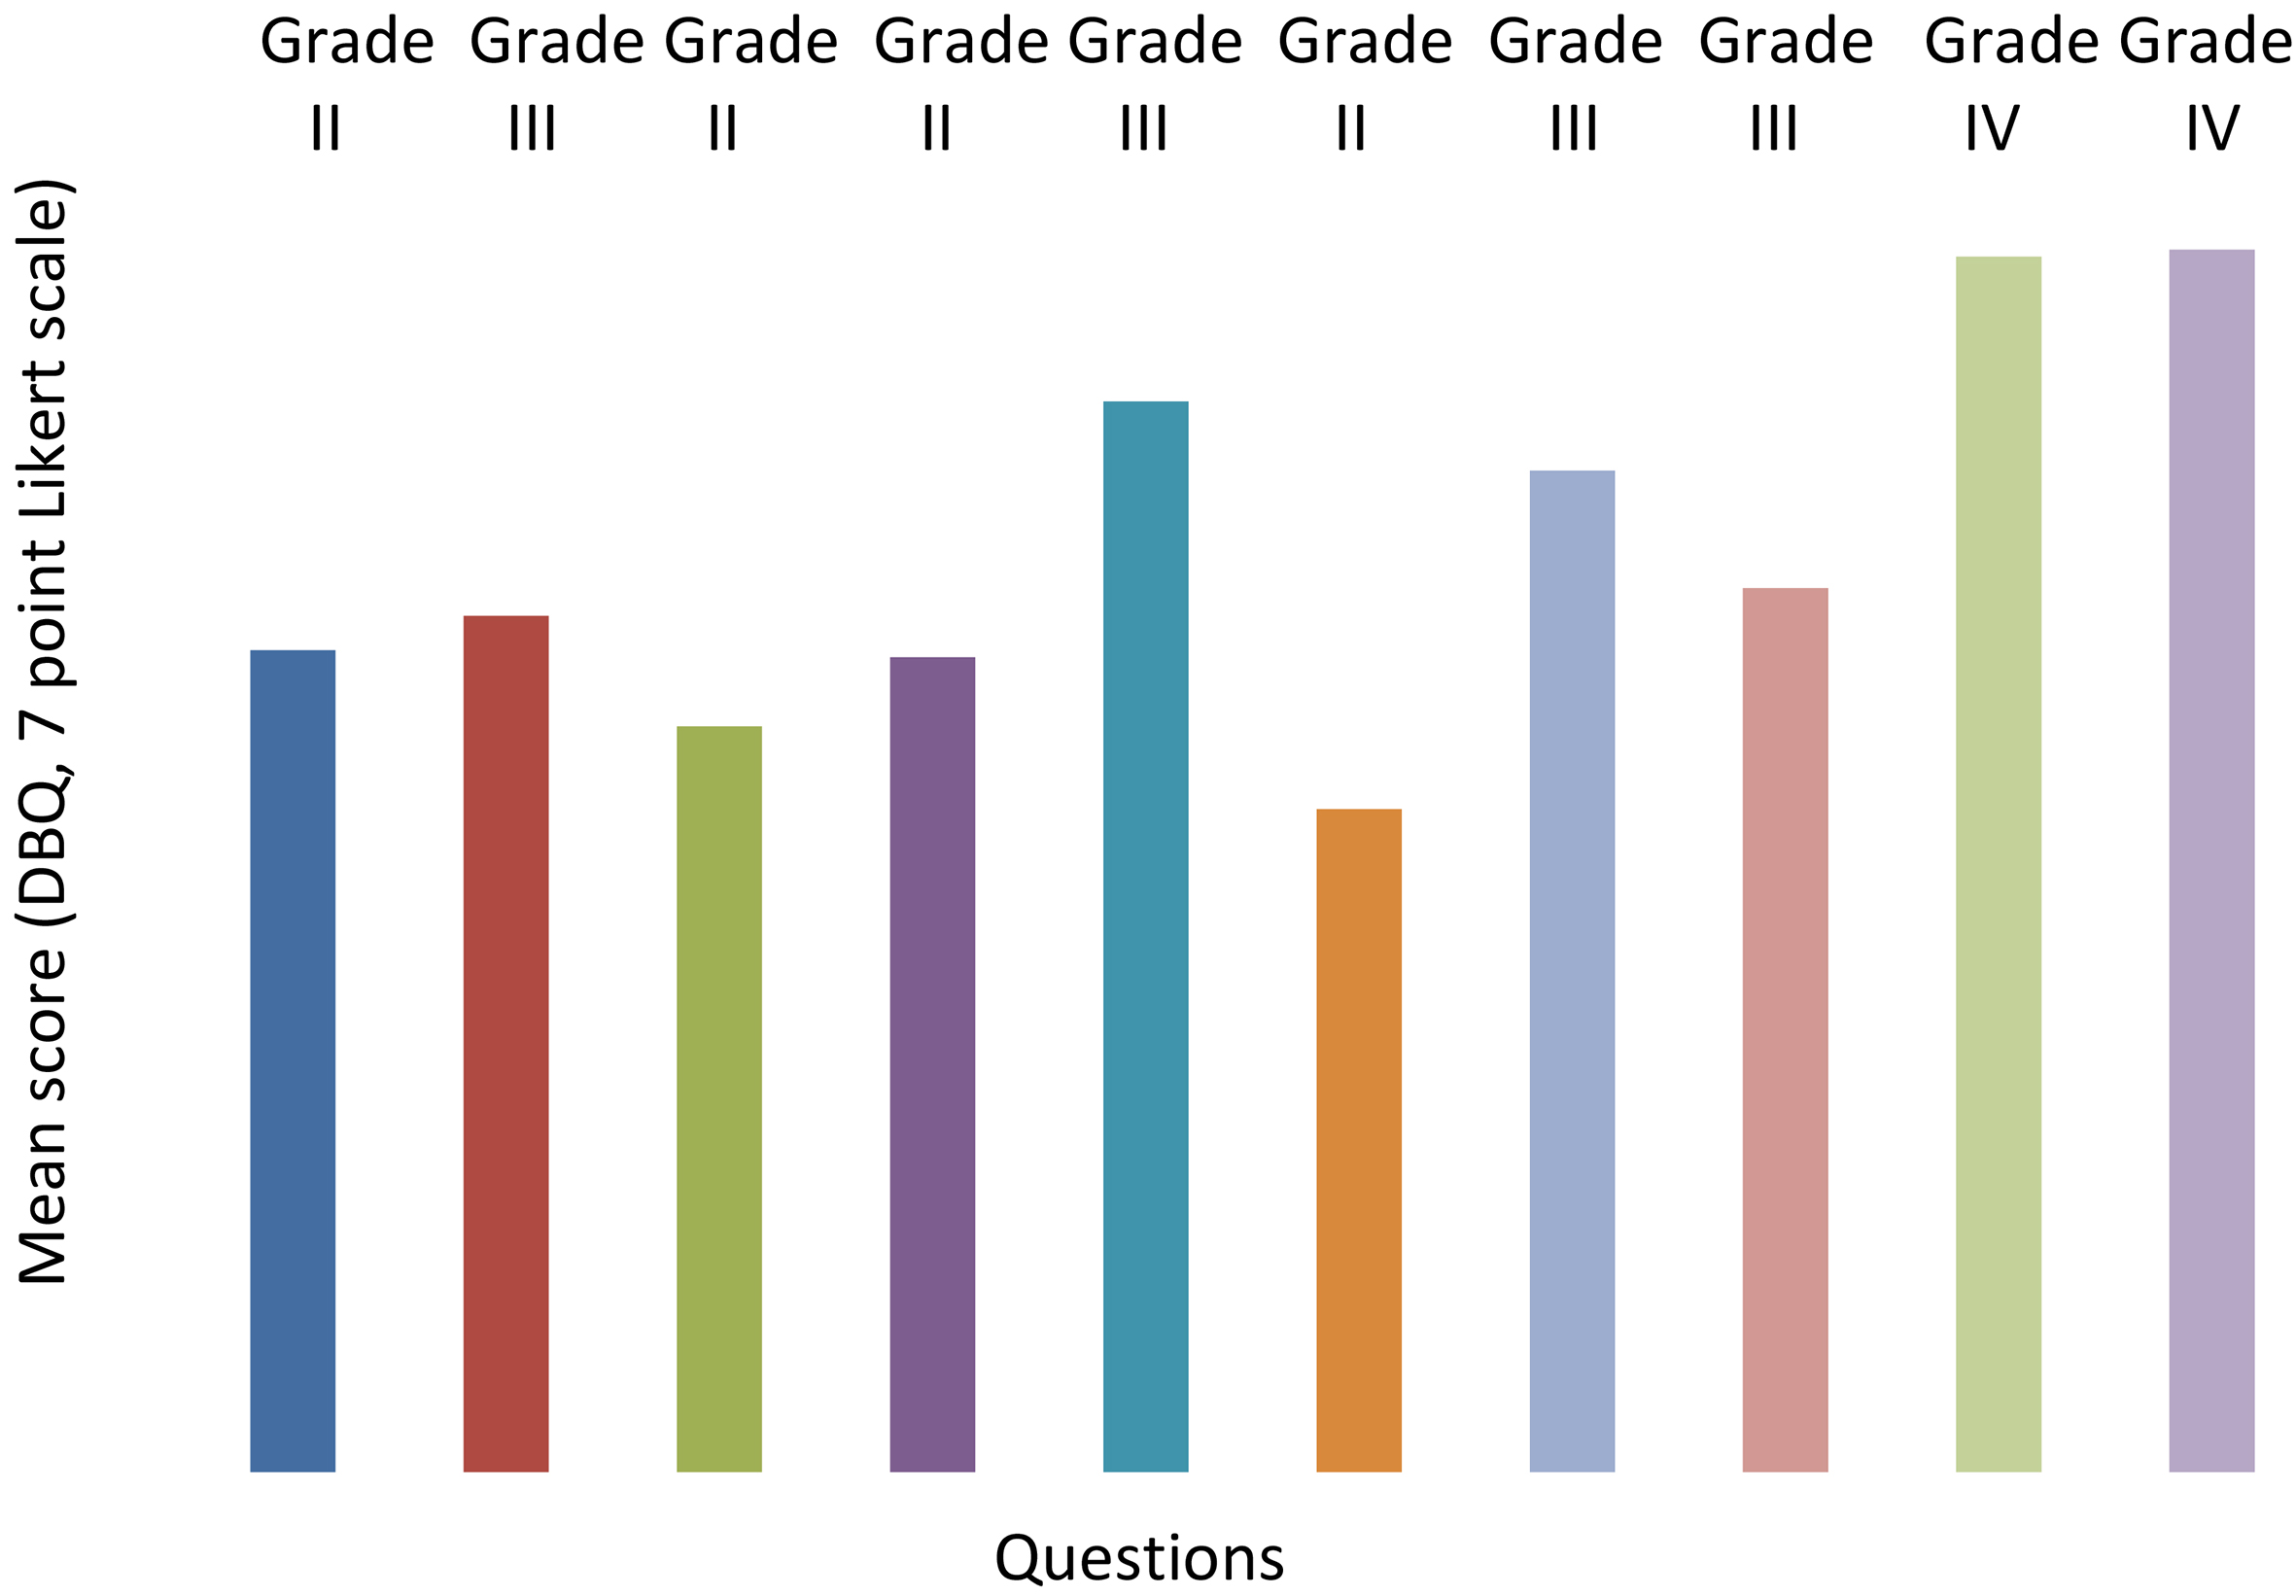
Figure 9.
Percentage of motorbike riders according to grade of risky behaviour.
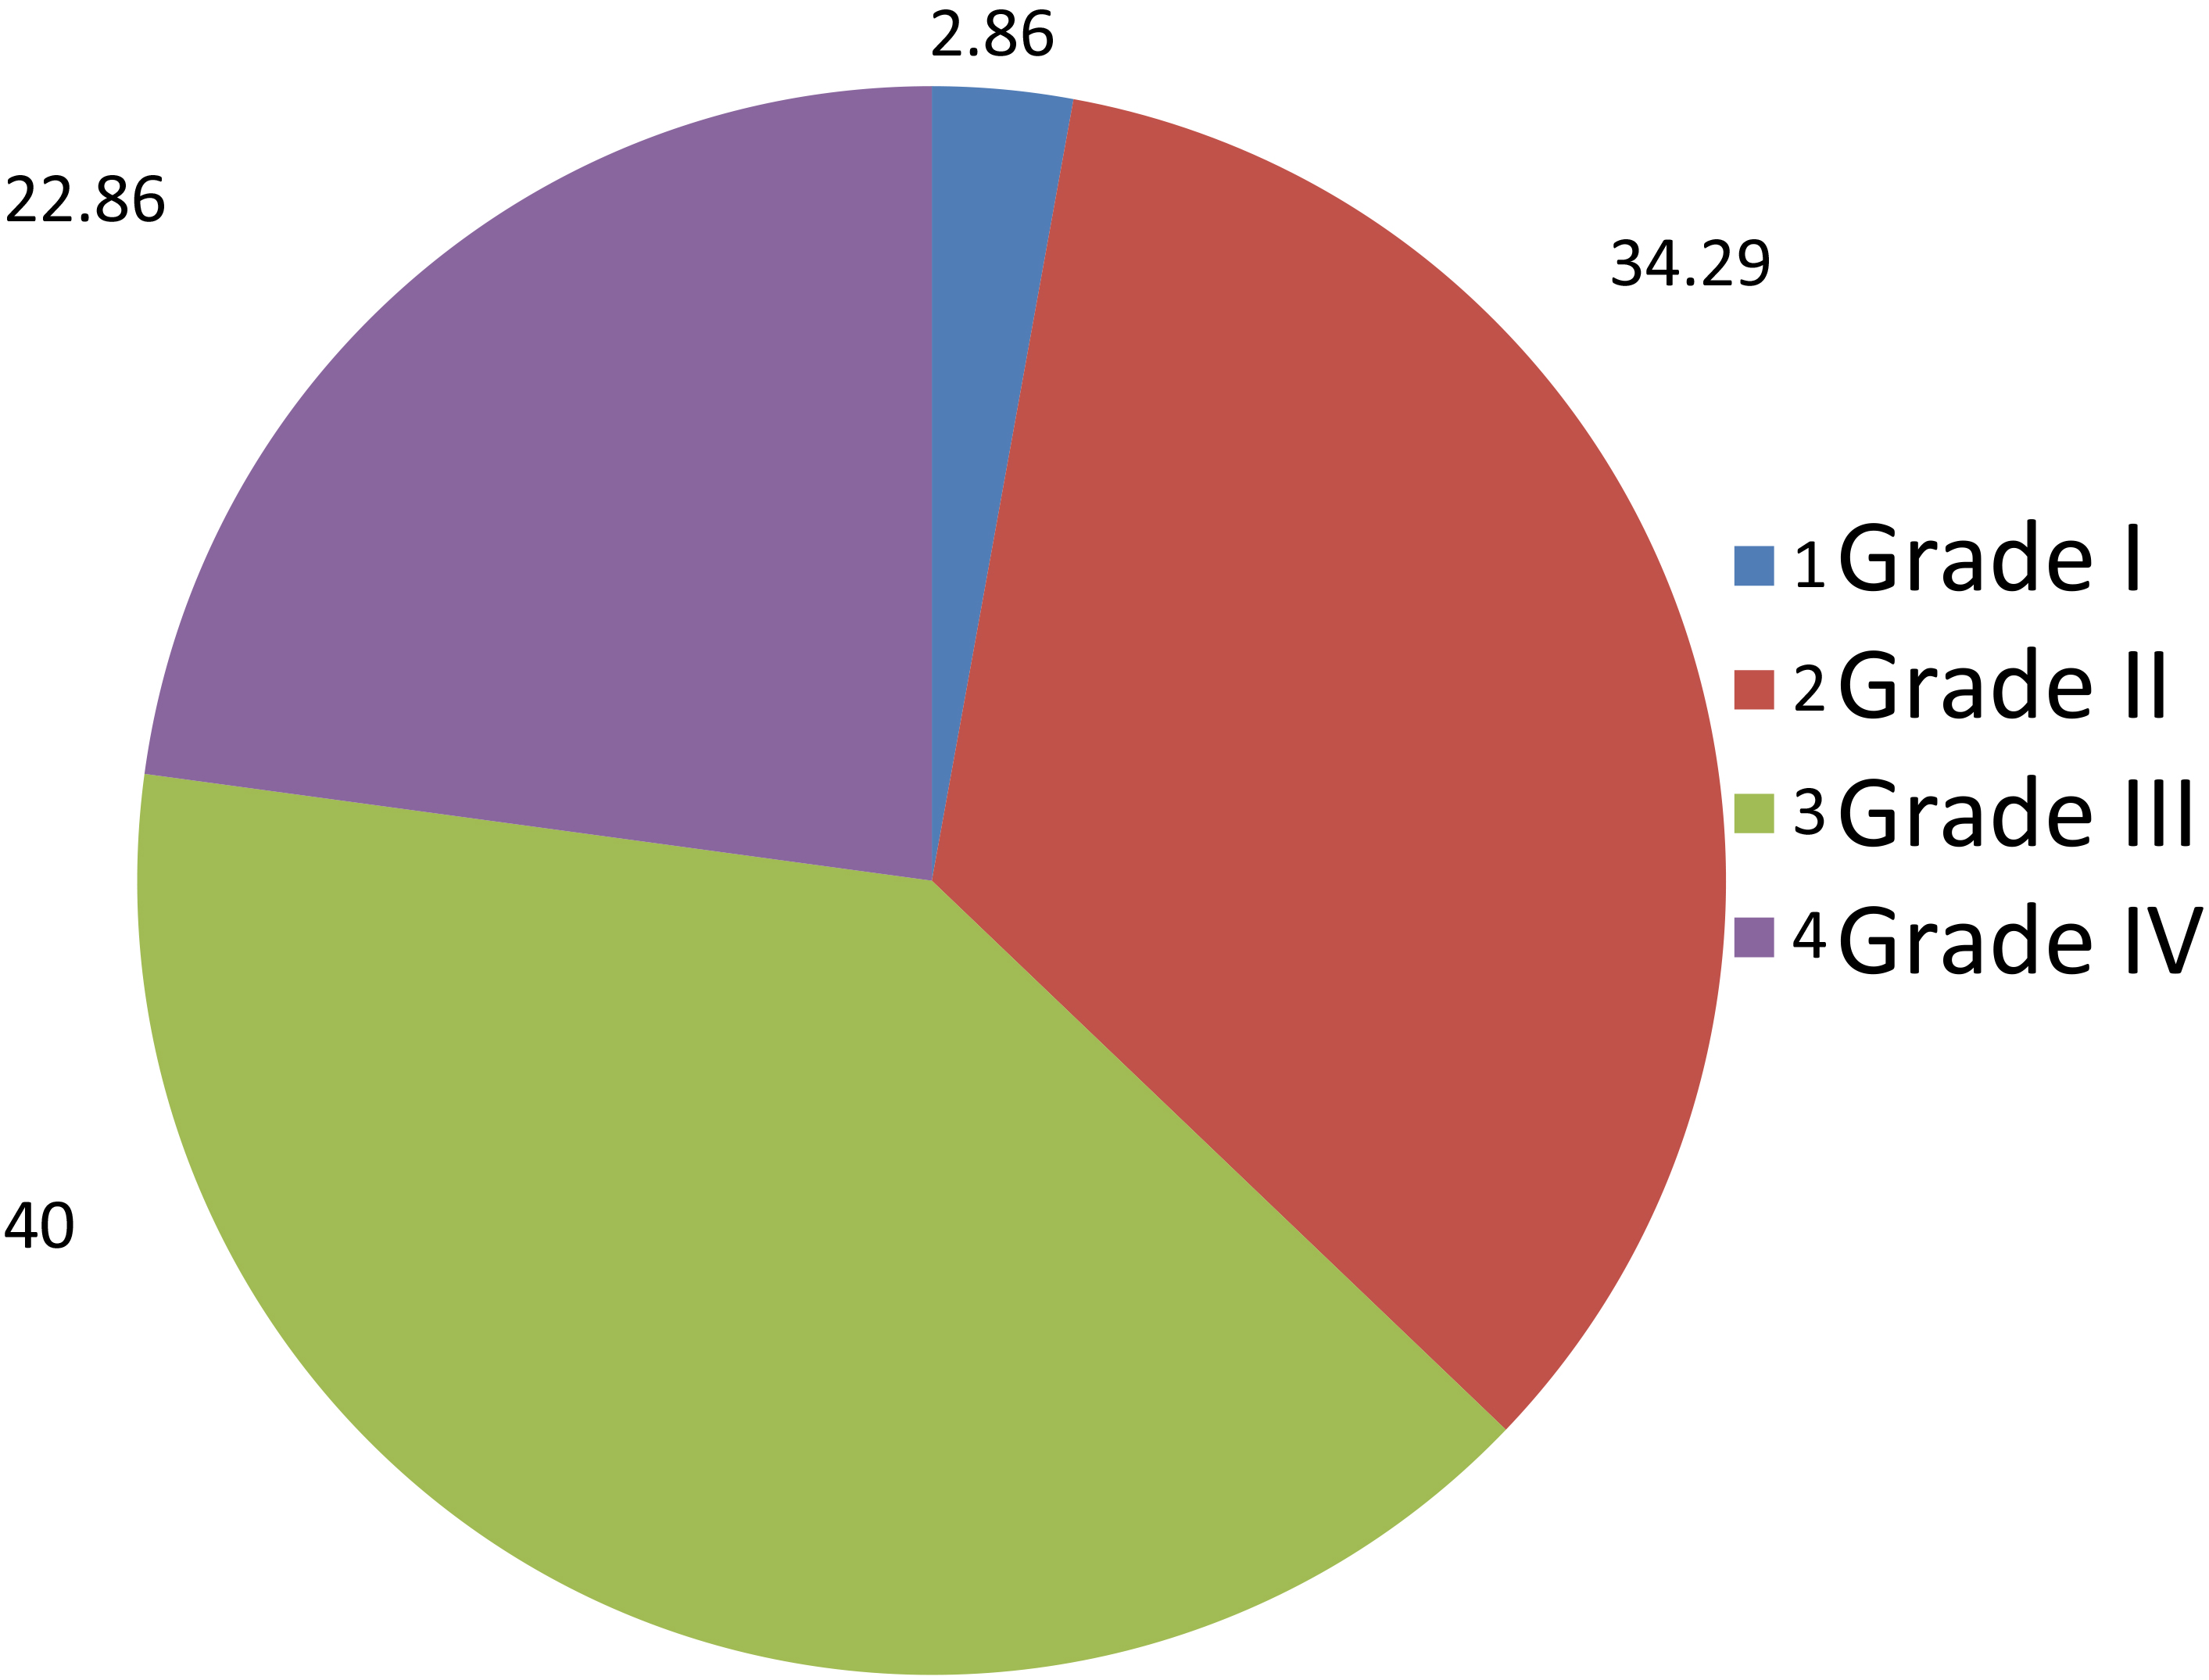
Figure 10.
Risky behaviour: Observational study.
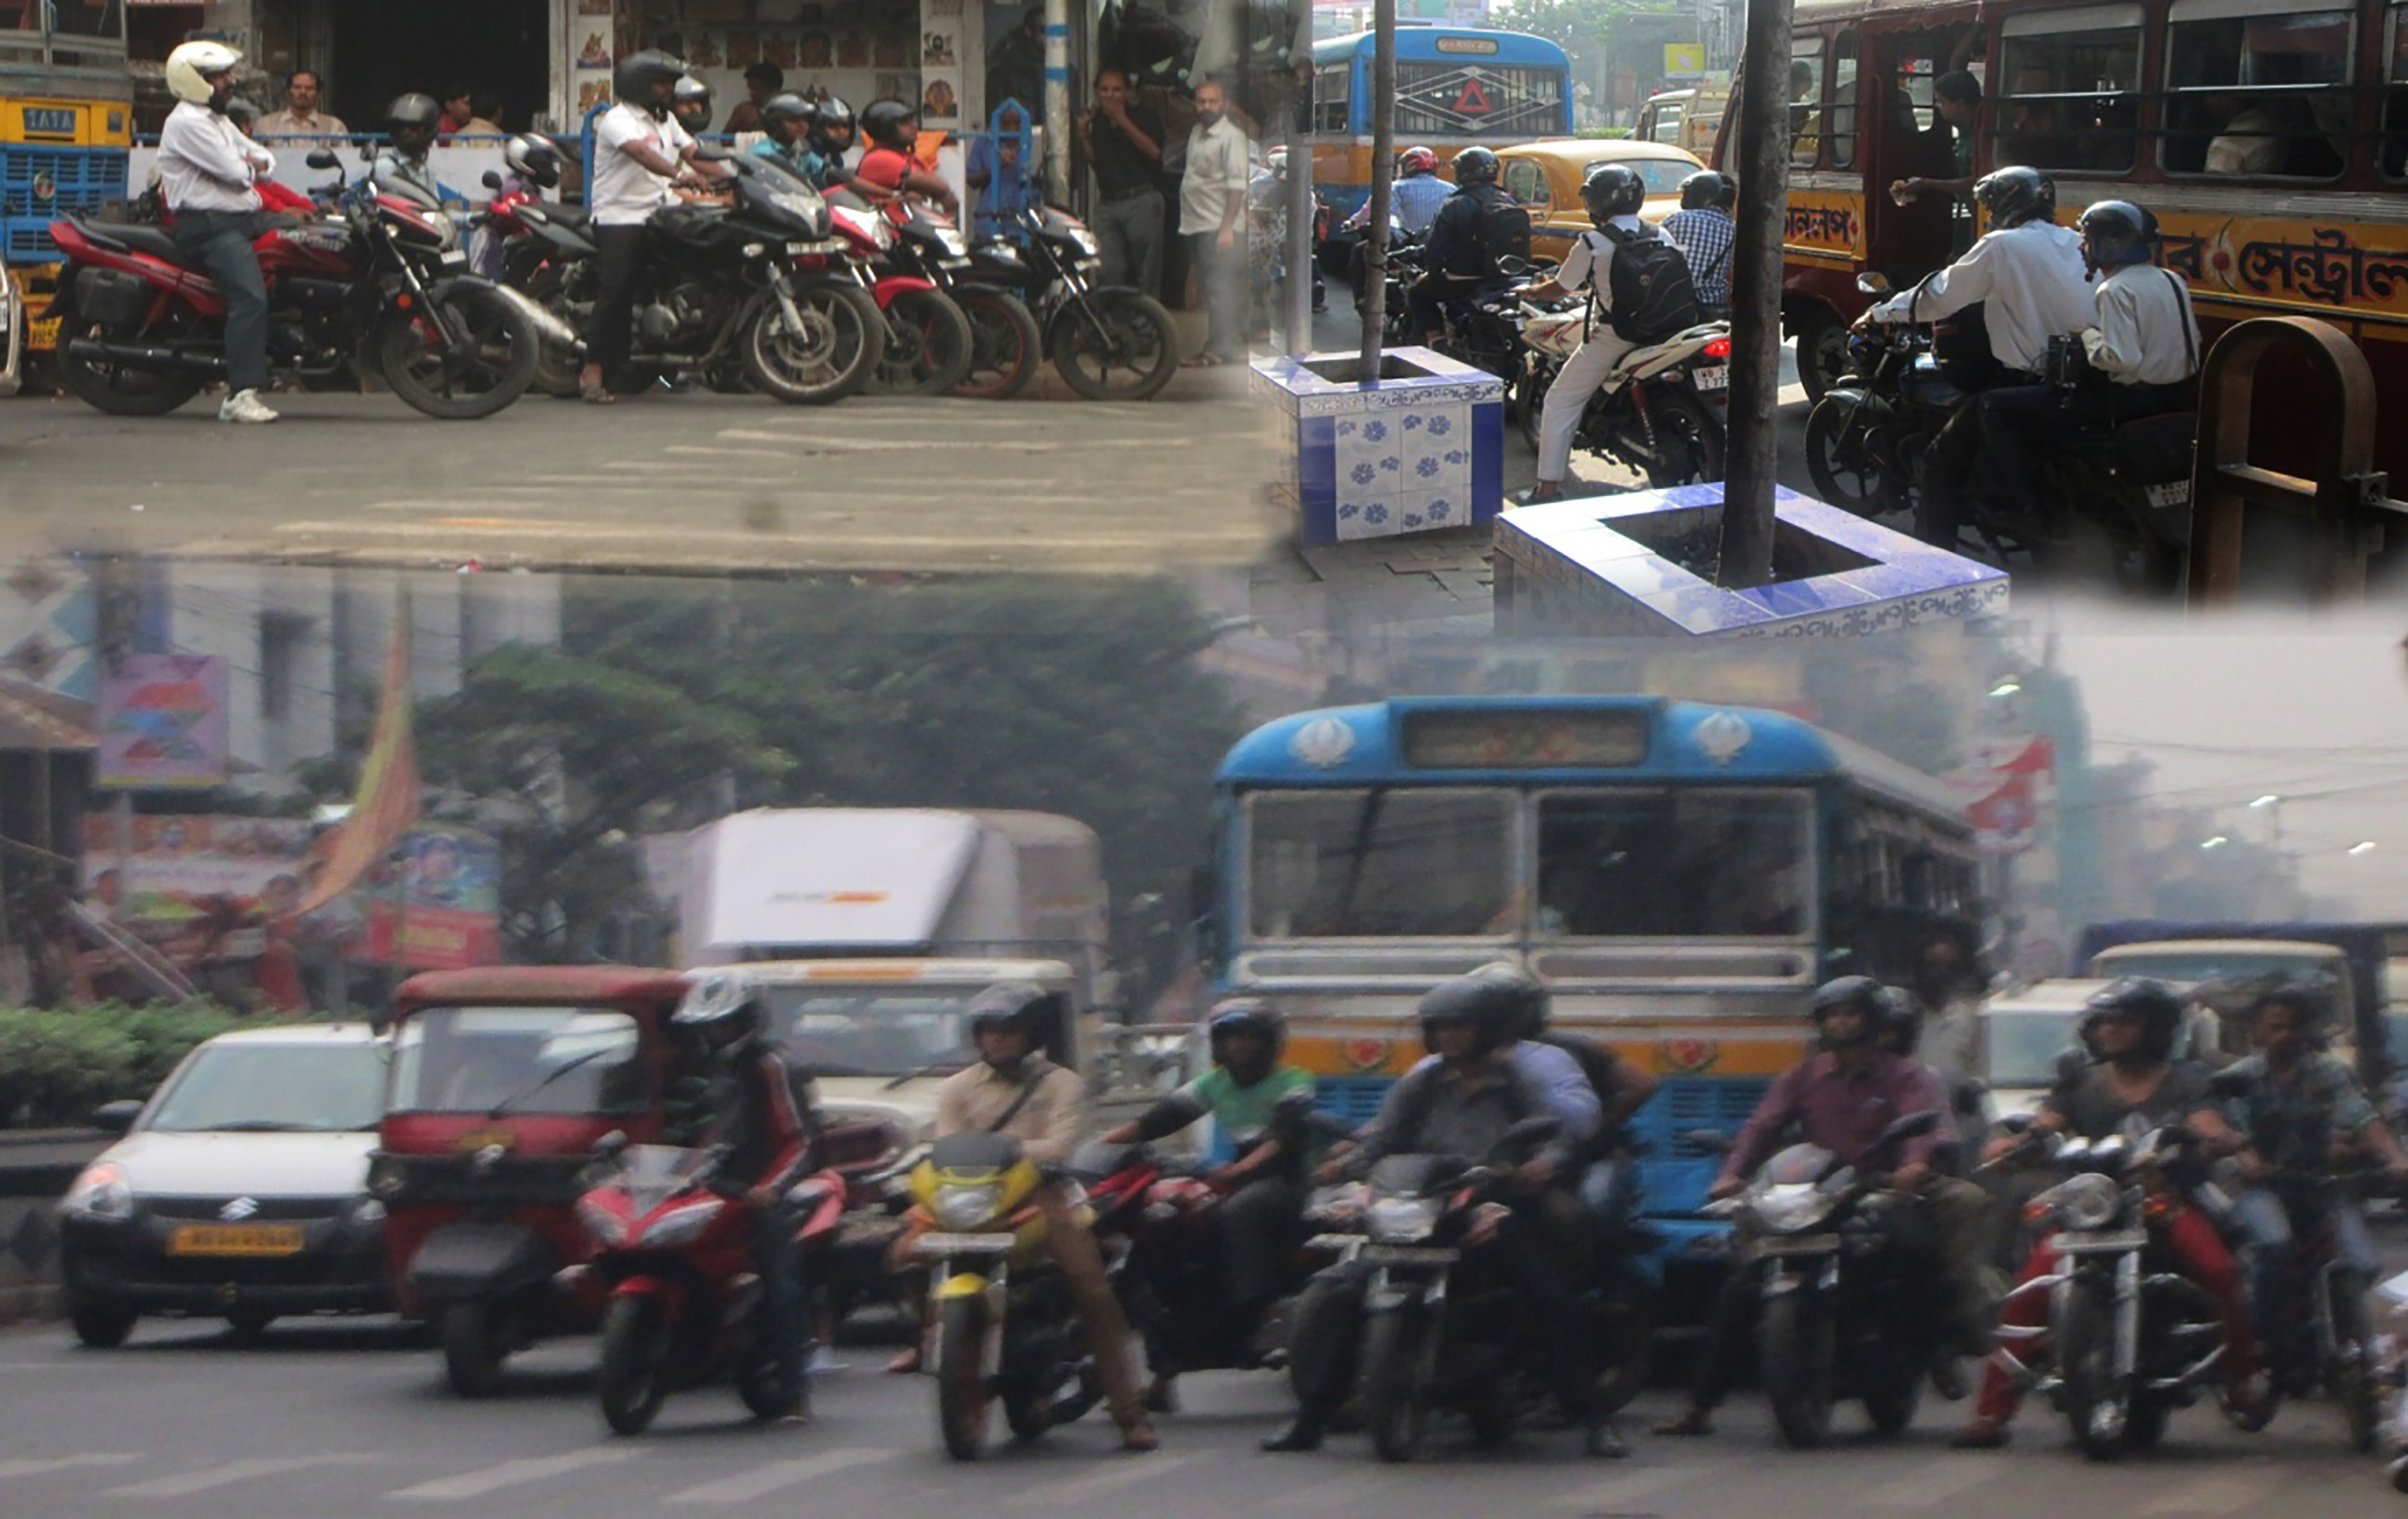
Figure 11.
Risky behaviour: Observational study.
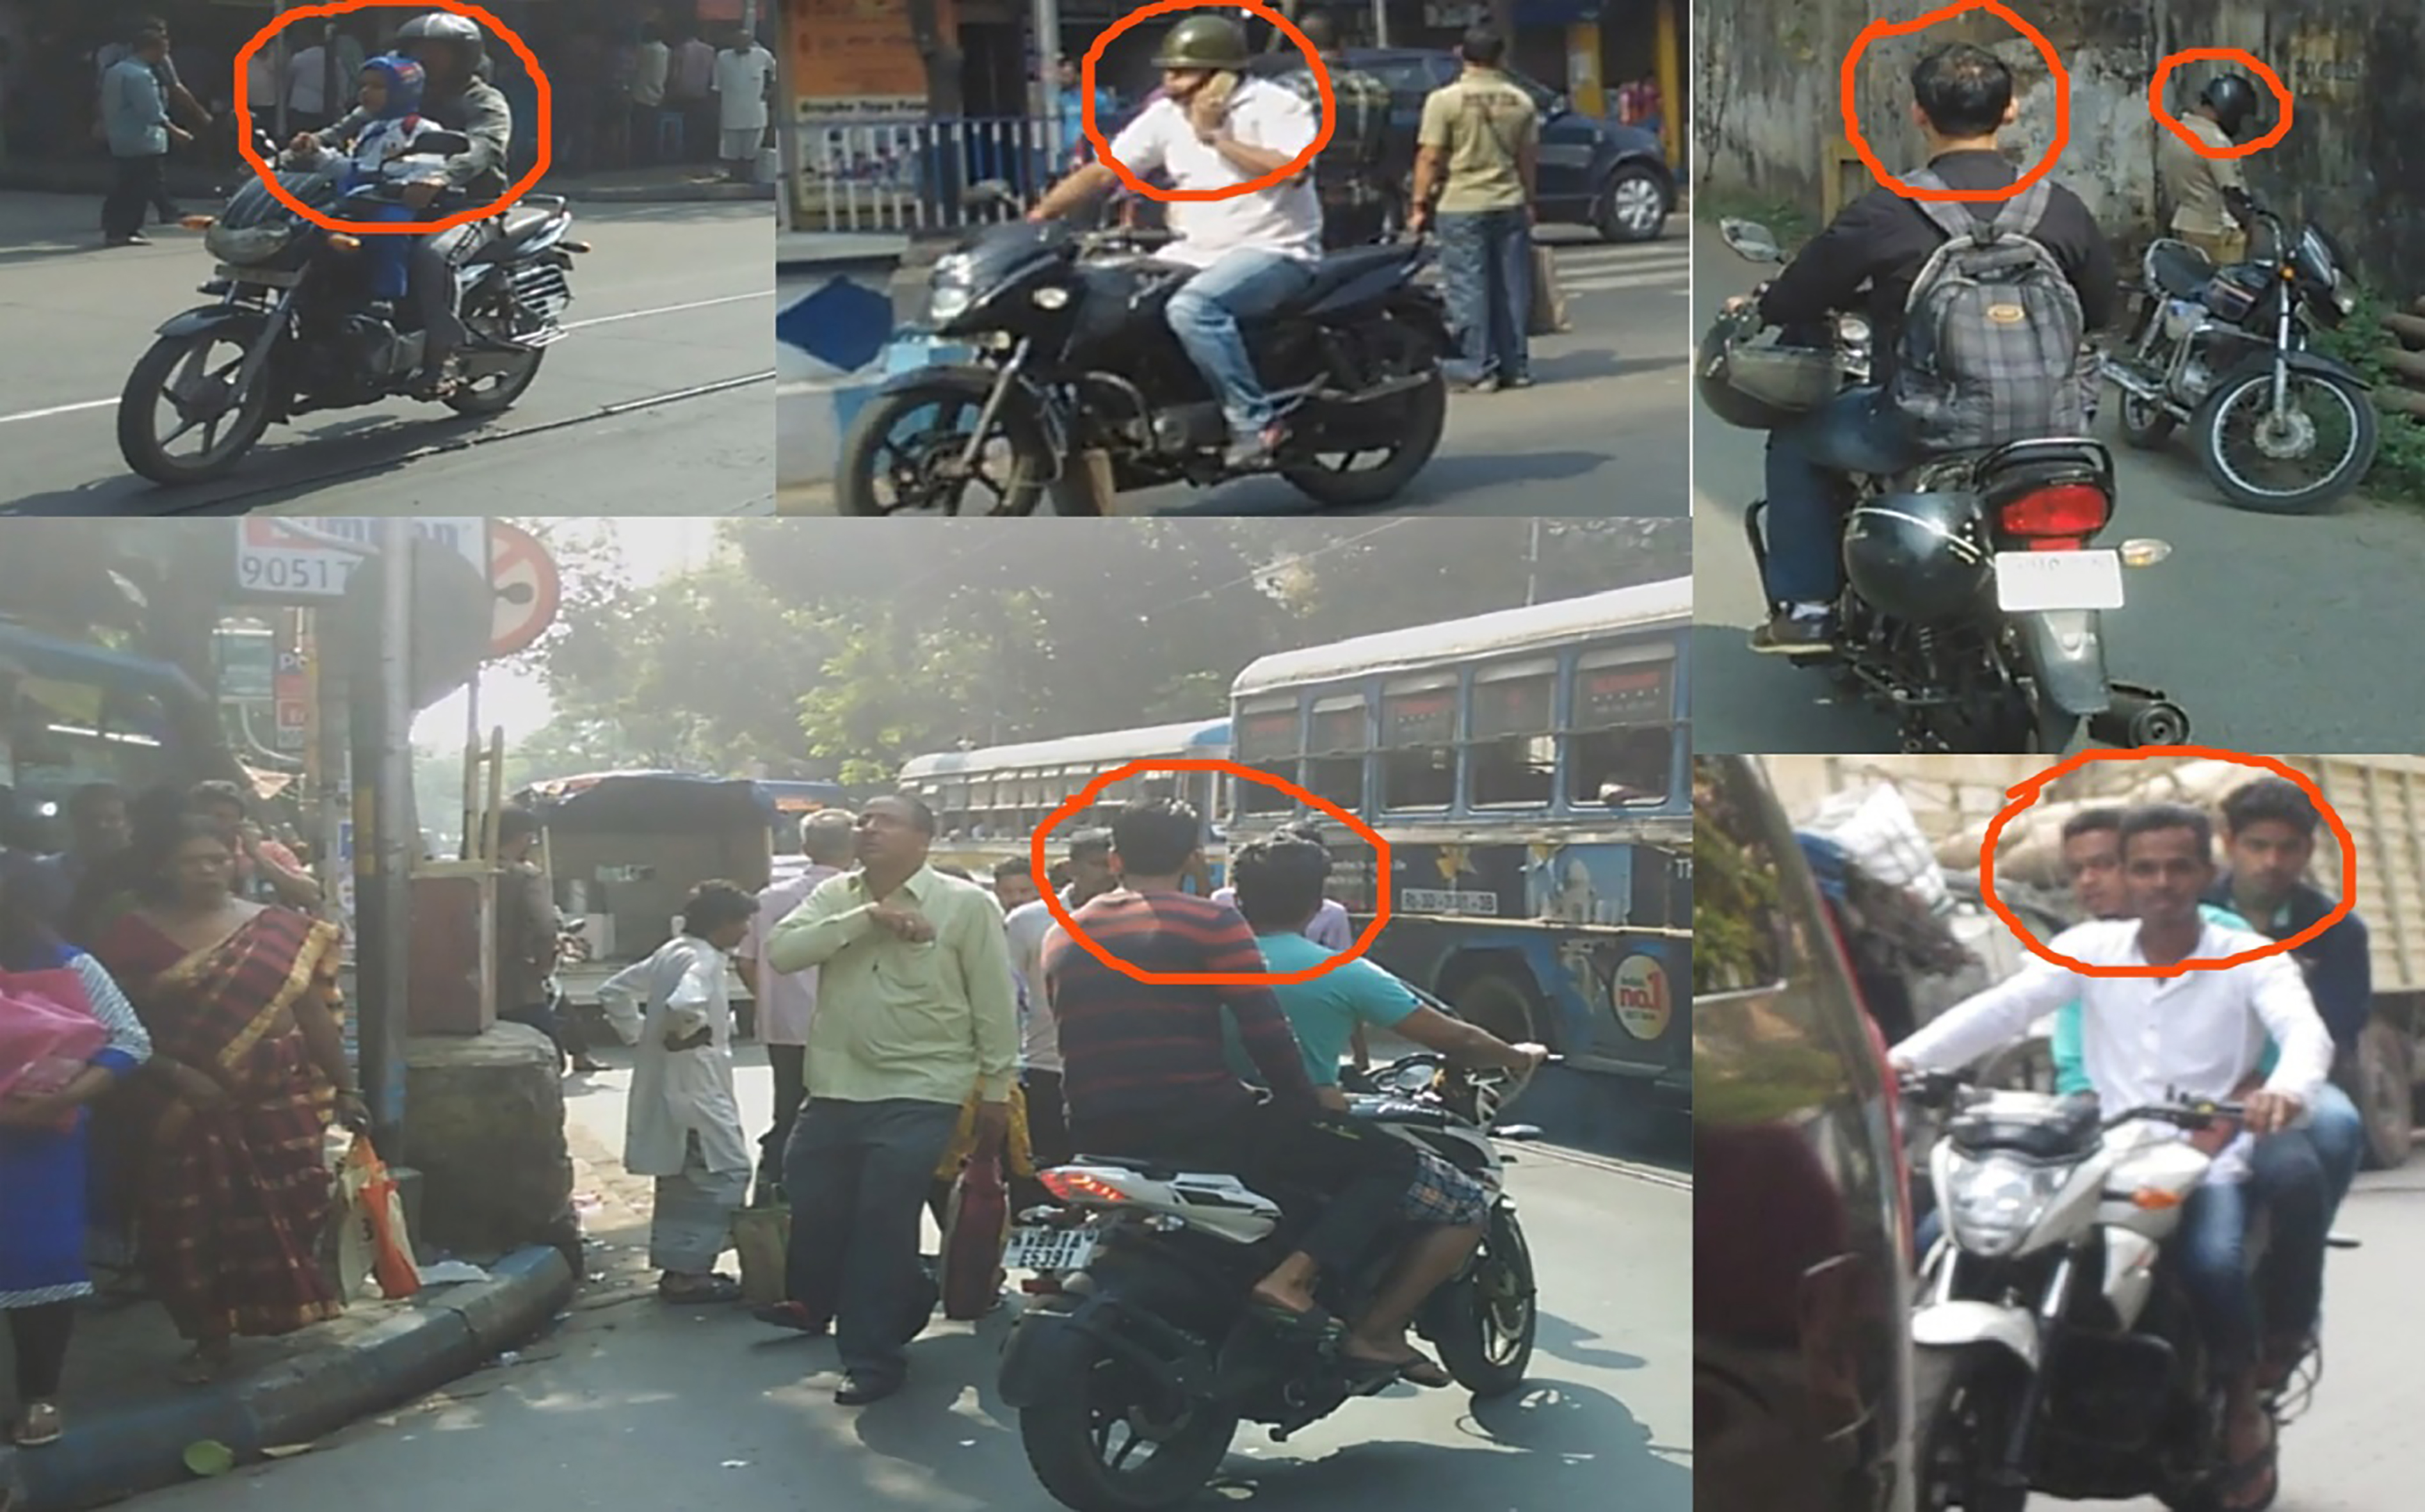
Figure 12.
Risky behaviour: Observational study.
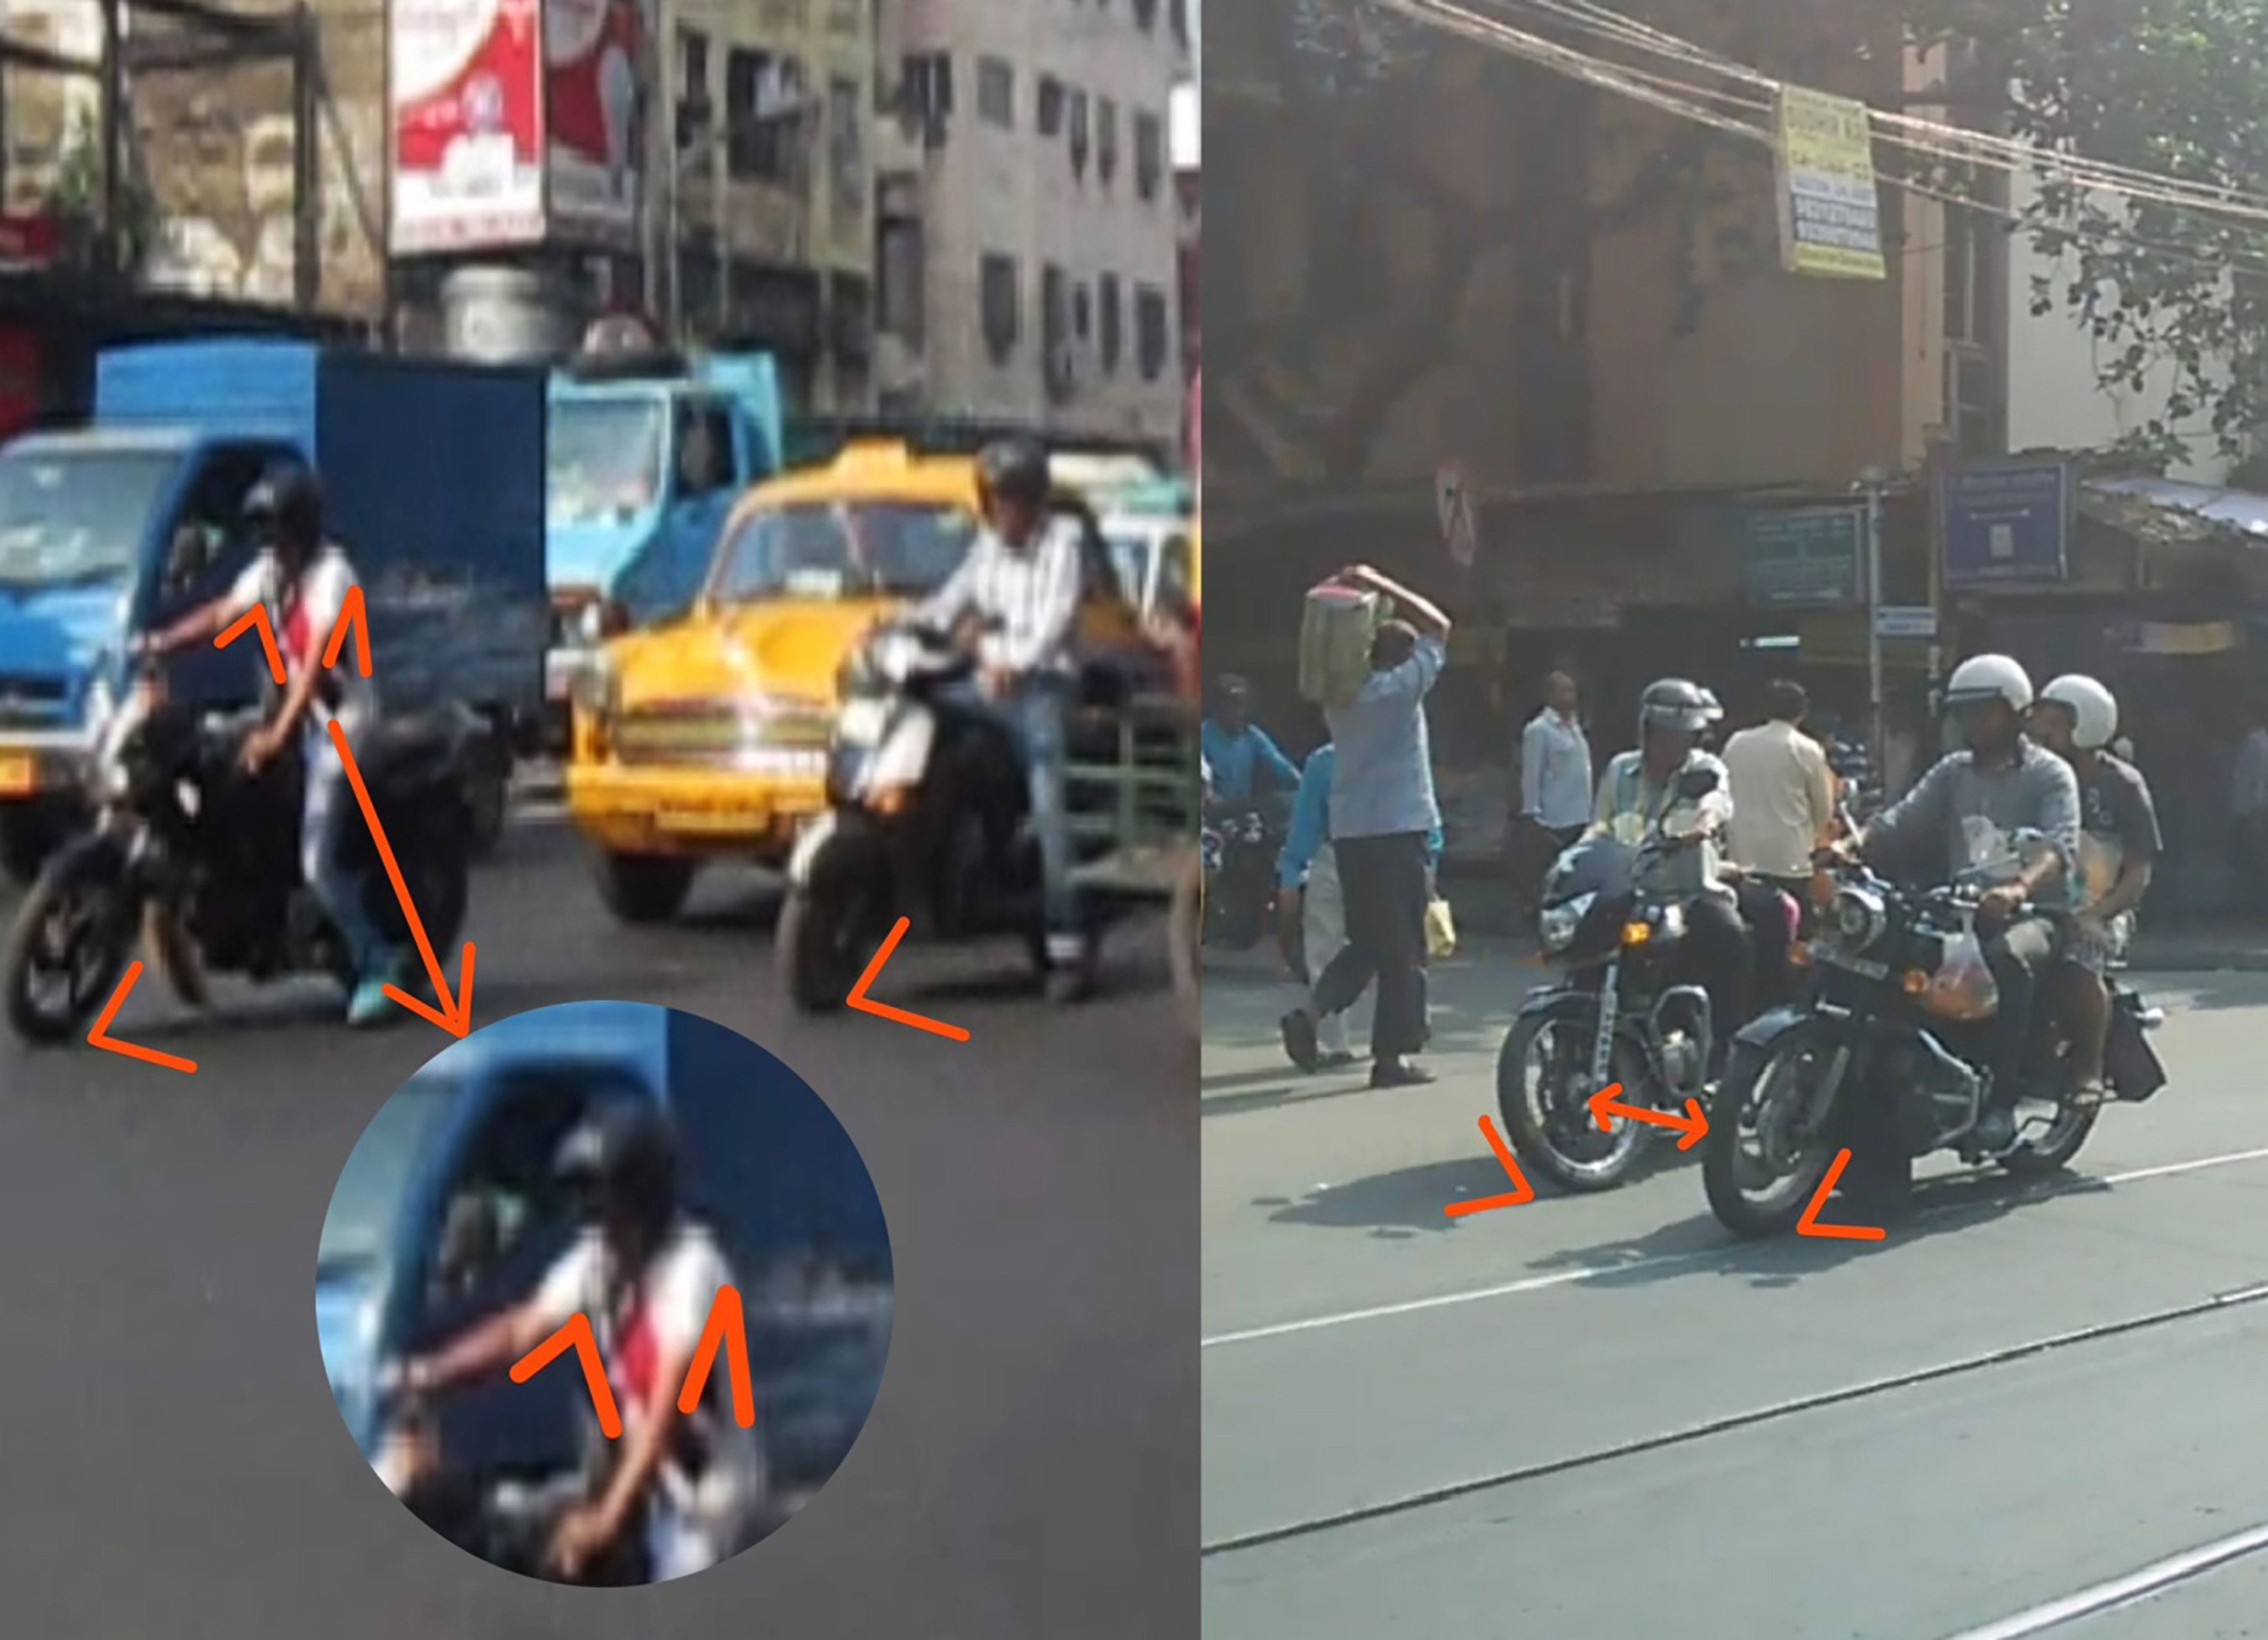
Figure 13.
Risky behaviour: Observational study.
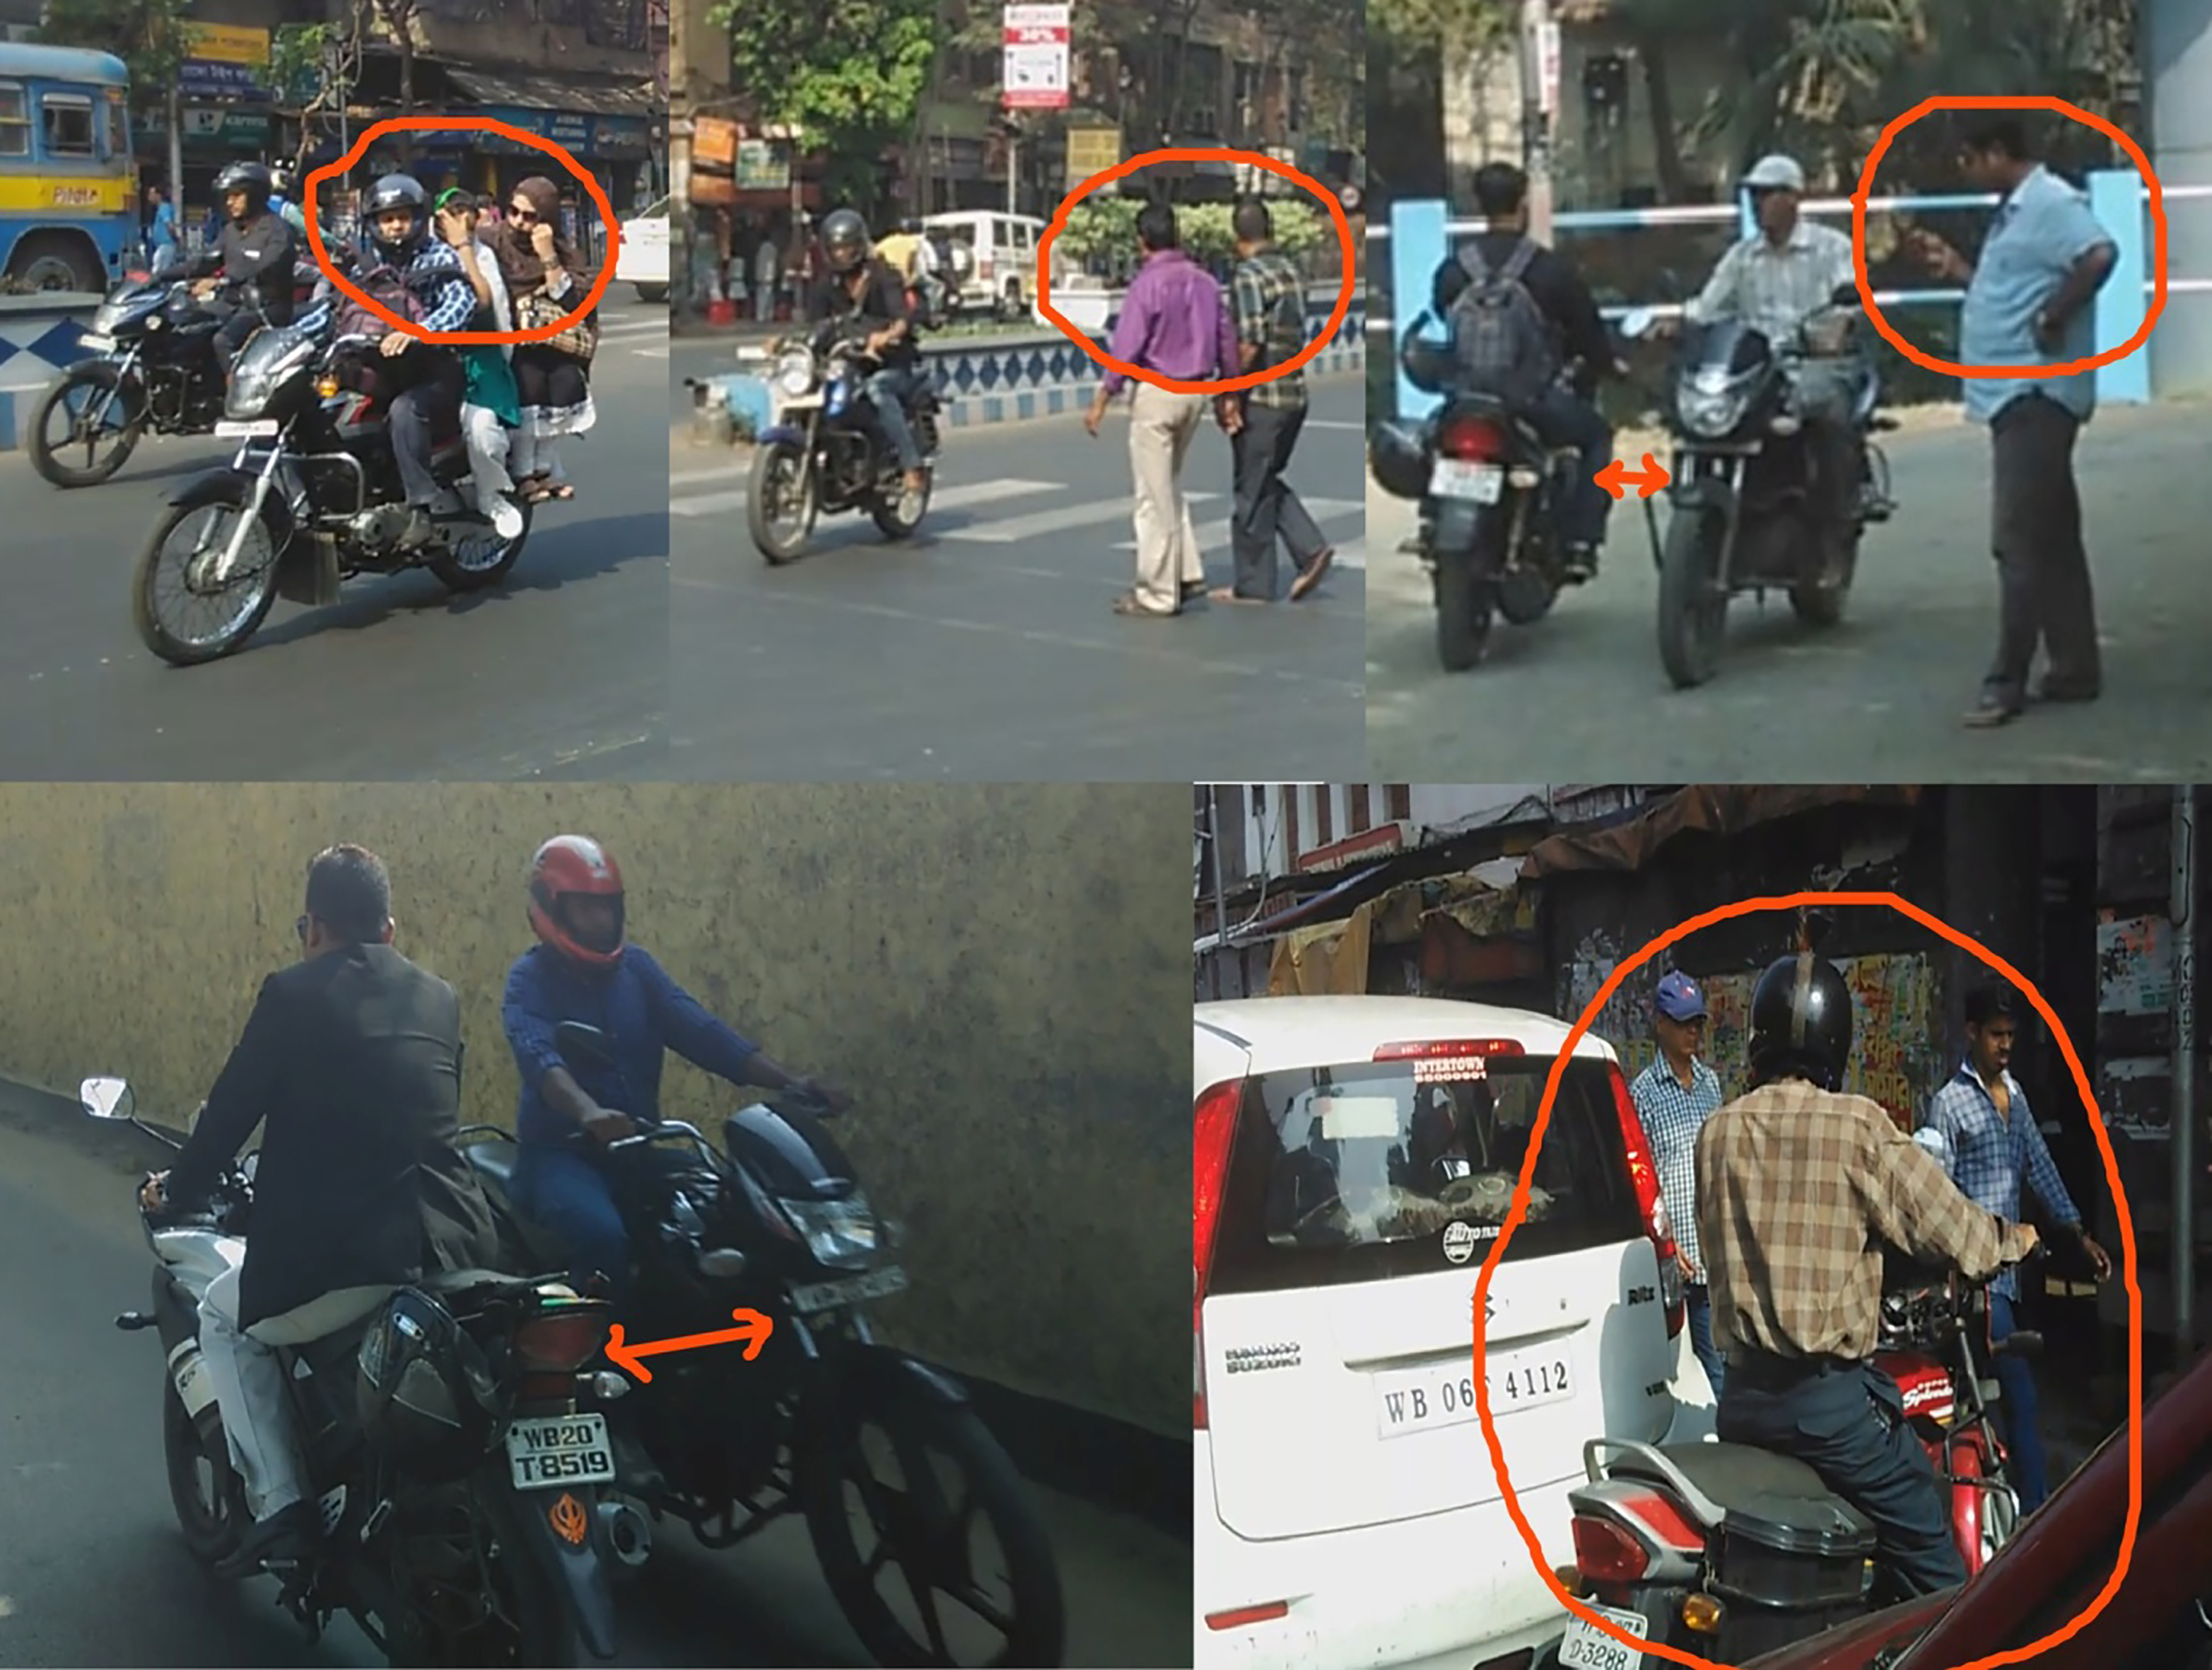
Figure 6 shows mean score and grade of sensation of individual question. Figure 7 shows percentage of bike riders according to grade of sensation. Sensation seeking activities among riders were again evaluated with the help of a set of seven questions; whose Chronbach’s
Figures 10–13 show some of the unsafe acts which were frequently observed among the bike riders.
4.Discussion
Assessment and quantification of postural stress and manifested behaviour are important criteria prior to safety management in the process of ensuring ergonomic design intervention of motor bikes and behaviour based safety among bike riders. Road traffic accident is one of the major causes of mortality and morbidity in India [17]. Adult males belonging to 20–29 years fall in the accident prone age group [18], probably due to the effect of multiple stressors synergistically acting on them. It has often been observed that the rider frequently performs unsafe act but contradictorily analyses him to be a safe rider.
Choice of bike is often governed by external features like looks and style ,neglecting aspects of safety and comfort, neglecting the safety aspect, making bike a ‘vehicle of style statement’. Bike advertisements generally focus on the showmanship [7]. Physiological comfort and safety must also be taken into consideration while purchasing a bike in order to reduce postural stress, discomfort and chances of accident.
Pain occurrence was generally observed in body parts with maximum deviation from neutral position. Prolonged assumptions of static posture, deviations of joint angles of different body segments (as per Ergofellow 2.0 software) were noted to comply with regions of pain identified. Incidence and magnitude of pain were aggravated due to continuous exposure to vibration. The postures adopted during bike riding were interpreted and revealed that they were of medium to high risk category and immediate changes were necessary.
Scores to access magnitude of aggression, sensation and risky behaviour among bike riders were notably high. The cumulative effect of contributory stressors and prolong exposure to them culminate in increased irritability. Interestingly, most of the drivers were observed to provide a self-contradictory assessment of behaviour while riding, although they would identify themselves as safe rider but frequently perform unsafe acts while commuting. This attitude of the drivers necessitated detailed observation of prevalent violation of safety. Moving ahead of stationary traffic through fringes, changing lanes sometimes creating transverse shortcuts, inept use of footpaths were seen. The bike riders often carry more than one pillion riders, talk using mobile phones and do not wear helmet. The riders are prone to exhibit their agility to take sharp turns, movement through narrow alleys and perform careless overtakes.
These vivid observations bolstered with quantification of behavioural violations are supposed to aid the process of ensuring behavioural based safety. Introduction of checkpoints to reduce unsafe behaviour at regular intervals may be of help along with attempts of personal aggression management.
A multidimensional approach in reducing Road Traffic Accident is necessary. Ergonomic intervention paired with behavioural management is supposed to improve alacrity of the riders and combat stress related manifestations ultimately providing assurance for better safety conditions.
5.Study limitations
The study had some limitations. In this study assessment of magnitude of aggression, sensation and driver behaviour was done among 35 bike riders. Subject number requires to be increased for further exploration. For this study no invasive physiological marker for aggression could be taken into consideration.
6.Conclusions
In this study, physical and perceived workload of the motorbike riders were assessed. Attempt was made to quantify aggression, sensation level and risky driving behaviour. This study revealed the necessity of ergonomics assessment in safety management and risk governance. Immediate ergonomic intervention regarding bike design and implementation of BBS are essential in order to reduce MSDs and accidents.
7.Concluding remarks
Ergonomic interventions or motorbike redesign based on ergonomics and anthropometry should be given due consideration along with various aspects of motorbike components or accessories, such as, seat, handles, foot pedals and helmet. For providing motorbike driver safety and reduce road accidents, formal training in behavioural based safe motorbike driving, mandatory use of helmet and law enforcement of safe driving speed, should be considered.
Acknowledgments
We would like to acknowledge all the motorbike riders who volunteered as subjects for this study. Thanks are due to Presidency University for funding this work (Faculty Research and Professional Development Fund). Thanks are also due to Dr. Debdut Ghosh Thakur for all his co-operation and encouragement.
Conflict of interest
None to report.
References
[1] | NCRB. Accidental; deaths and suicides in India 2014, (2015) . |
[2] | Tushar JP, Arijit KD & Venus KP. A comparative study between core stabilization and superficial strengthening’s exercises for the treatment of low back pain in two wheeler riders. Int J Pharm Bio Sci. (2015) ; 6: (1): 168-176. |
[3] | Thamsuwan O, Blood RP, Ching RP, Boyle L & Johnson PW. Whole body vibration exposures in bus drivers: A comparison between a high-floor coach and a low-floor city bus. Int J Industr Ergonom. (2013) ; 43: (1): 9-17. |
[4] | Okunribido OO, Shimbles SJ, Magnusson M & Pope M. City bus driving and low back pain: a study of the exposures to posture demands, manual materials handling and whole body vibration. Appl Ergon. (2007) ; 38: (1): 29-38. |
[5] | Alperovitch-Najenson D, Katz-Leurer M, Santo Y, Golman D & Kalichman L. Upper body quadrant pain in bus drivers. Arch Environ Occup Health. (2010) ; 65: (4): 218-223. |
[6] | Monica S & Vishal K. Factors Influencing Consumer Buying Behavior Towards Bikes Among Indian Youth: A Study. Asian Journal of Research in Social Sciences and Humanities. (2014) ; 4: (1): 177-183. |
[7] | Cunneen C. Working Class Boys and ‘Crime’: Theorising the class/gender mix in P Patton and R Poole (eds). War/ Masculinity. Sydney: Intervention Publications. (1985) . |
[8] | McAtamney L & Corlett EN. RULA: a survey method for the investigation of work-related upper limb disorders. Appl Ergon. (1993) ; 24: (2): 91-99. |
[9] | Hignett S & McAtamney L. Rapid Entire Body Assessment (REBA). Appl. Ergon. (2000) ; 31: (2): 201-205. |
[10] | Kuorinka I, Jonsson B, Kilbom A, Vinterberg H, Biering-Sørensen F, Andersson G, Jørgensen K. Standardized Nordic Questionnaire for the analysis of musculoskeletal symptomsAppl. Ergon. (1987) ; 18: (3): 233-237. |
[11] | Borg GA. Psychophysical bases of perceived exertion. Med Sci Sports Exerc. (1982) ; 14: (5): 377-381. |
[12] | Watson B, Tunnicliff D, White K, Schonfeld C & Wishart D. Psychological and social factors influencing motorcycle riders intensions and behavior. Australian Government. Australian Transport Safety Bureau. (2007) . |
[13] | Reason JT, Manstead A, Stradling SG, Baxter J & Campbell K. Errors and violations on the roads: A real distinction? Ergonomics. (1990) ; 33: (10–11): 1315-1332. |
[14] | Stradling S, Meadows M & Beatty S. Characteristics of speeding, violating and thrill seeking drivers. In T. Rothengatter & R. D. Huguenin (Eds.), Traffic and Transport Psychology: Theory and Application (pp. 177-192). Oxford: Elsevier. (2004) . |
[15] | Elliott MA, Sexton B & Keating S. Motorcyclists’ behaviour and accidents. (Behavioural Research in Road Safety (2003) ; Thirteenth Seminar Proceedings). Retrieved 10 November2004,from http//www.dft.gov.uk/stellent/groups/dft_rdsafety/documents/pdf/dft_rdsafety_pdf_024714.pdf. |
[16] | Watson B, Tay R, Schonfeld C, Wishart D, Tunnicliff D, Lang C, et al.. Short term process and outcome evaluation of Q-RIDE. (2003) ; (unpublished report) (Brisbane: Centre for Accident Research and Road Safety – Queensland (CARRS-Q). |
[17] | Dandona R & Mishra A. Death due to road traffic crashes in Hyderabad city in India: Need for strengthening surveillance. Natl Med J India. (2004) ; 17: (2): 74-79. |
[18] | Khare N, Gupta SK, Varshney A & Athavale AV. Epidemiological study of road traffic accident cases attending tertiary care hospital, in Bhopal MadhyaPradesh. Natl J Community Med. (2012) ; 3: (3): 395-399. |


