
The functional relationship of Yap/Taz with autophagy functions in sarcopenia associated with aging
Abstract
BACKGROUND:
Muscle loss is one of the features associated with aging with significant impacts on the quality of life. Yap/Taz, the effectors of the Hippo pathway, was shown to regulate organ size and may be associated with aging. We postulate that Yap/Taz modulation may play a role in maintaining muscle fiber size or mediating the function of autophagy during aging and sarcopenia.
OBJECTIVE:
The research aim to explore sarcopenia and its relationship to autophagy and Yap/Taz expression. Additionally, we also explored the relationship of autophagy function and Yap/Taz on skeletal muscle tissue during aging.
METHODS:
We conducted experiments on two groups of rats kept at 16 and 80 weeks. Skeletal muscle tissue from the soleus muscle was harvested, and mRNA expression of Yap/Taz and genes associated with the autophagy pathway were quantified. Immunoblotting was done with antibodies against Yap/Taz and autophagy proteins. Bafilomycin and Verteporfin were used on the C2C12 cell line to elucidate the interaction between autophagy and Yap/Taz.
RESULTS:
Old rats were found to have a smaller fiber surface area of the soleus muscle and was associated with increased Yap mRNA and protein expression. The inhibition of autophagy increased Yap levels. However, the inhibition of Yap/Taz function did not affect autophagy in skeletal muscle.
CONCLUSIONS:
With current evidence, increased Yap was paradoxically associated with sarcopenia, and this increase was caused by the decreased autophagic flux caused by aging.
1Introduction
Muscle loss is one of the features associated with physiological aging and is related to a reduced quality of life. Muscle loss, coupled with the reduction in muscular function, is defined by the European Working Group on Sarcopenia in Older People 2 (EWGSOP2) as the criteria for probable sarcopenia [1]. The disease burden from sarcopenia arises because it is a relatively common condition and is associated with short-term and long-term adverse effects [2]. Therefore, treatments or interventions aimed at improving muscle function in the elderly are essential. However, complex processes were involved in skeletal muscle aging, involving quantitative and qualitative aspects. For example, several factors were known to influence the muscle loss associated with aging, such as dysfunctional protein synthesis and metabolism and the decreased physical activity of the elderly [2, 3]. However, in the context of age-related sarcopenia, impaired protein degradation, not reduced protein synthesis, were the ones associated with muscle atrophy. These conclusions were based on findings that showed Akt overexpression from the protein synthesis pathway paradoxically produced muscle degeneration and weakness and reduced the lifespan of mice [4]. Additionally, physical exercises were shown to reduce muscle atrophy by inducing the autophagy pathway with the effects on the maintenance of mitochondrial quality [5]. Therefore, muscle loss is associated with decreased protein quantity and quality as well. The Hippo pathway may influence several of these factors causing sarcopenias, such as the Yes-associated protein or the transcriptional co-activator with PDZ-binding motif protein. Especially along with the areas of cellular proliferation and autophagy [6–9].
Yes-associated protein (YAP) and transcriptional co-activator with PDZ-binding motif (TAZ) are the two effectors of the Hippo signaling pathway involved in cellular proliferation and tissue growth. Previous research has shown that the overexpression of YAP/TAZ resulted in cellular overgrowth, as shown in Drosophila and several human cancer cell lines. However, their effects were not limited to cell proliferation but were more pervasive, influencing cell fate, metastasis, and regeneration. Several authors have reviewed the function of the Hippo pathway in regenerative medicine, showing promises in liver, skin, and intestinal tissues [10–12]. In skeletal muscle, both YAP/TAZ play a similar but distinctive role during growth. YAP was shown to induce muscle tissue hypertrophy by promoting myoblast proliferation, while TAZ was shown to induce myoblast differentiation. Additionally, YAP was highly expressed in satellite cells from humans and mice, showing its effects in influencing cell fate in muscle tissue [13, 14]. Therefore, the ability of YAP/TAZ to regulate proliferation and differentiation of muscle tissue may also apply to other conditions such as muscle loss during old age.
Several mechanisms were shown to cause aging-influenced sarcopenia potentially. Systemic inflammation, hormonal changes, reduced growth factor secretion, reduced satellite cell population, and protein metabolism imbalances all contribute to decreased muscle mass. YAP/TAZ may influence this pathway either through increasing satellite cell population or through autophagy mechanisms [15]. Autophagy was shown to be a key mechanism shown to counteract muscle loss in aging. Autophagy induction has been shown using mice and flies to improve lifespan and parameters of muscle aging [4, 16, 17]. The effects of autophagy on aging have been well documented that calorie restrictions and other methods to induce autophagy have been proven effective at increasing lifespan [18]. However, although YAP/TAZ and Autophagy may produce beneficial effects during aging, their relationship is very complicated. Additionally, most research on these fields was focused on cancer cells, with results showing autophagy induction consistently reduced YAP protein levels [19–21] and studies in mice showing YAP protein are substrates of the autophagy machinery [21, 22]. However, overexpression of YAP was also shown to downregulate autophagy function [23]. Thus, as inhibitors of each other’s function, their role and relationship in skeletal muscle aging are still unknown. Therefore, this article explored the sarcopenic phenotype and its relationship to autophagy and Yap/Taz expression. We also explored the relationship between autophagy function and Yap/Taz on skeletal muscle tissue during aging.
2Materials and methods
2.1Animal models and diet composition
At eight weeks of age, Wistar rats (Rattus norvegicus) were obtained from P.T. Biofarma, Bandung, Indonesia. The animals were housed on a 12:12 light-dark cycle at room temperature with unrestricted access to food and water. All rats were fed the standard chow diet (Prospets, Surya Sains Indonesia) with the composition shown in Table 1. The rats were acclimatized for two weeks for the young group before being sacrificed and their organs harvested. The rats were raised until 80 weeks for the aged group with standard care before being sacrificed. Unless otherwise noted, the sample size used for these experiments was five each for both the young control group and the old group. Ethical clearance for animal models in this research was obtained from the Ethical Committee of Universitas Padjadjaran with protocol number 1004/UN6.KEP/EC/2018.
Table 1
The nutritional content of the standard chow diet that was used in this study
| Parameter | Content |
| Water Content | 10.98% |
| Ash Content | 6.13% |
| Protein Content | 24.89% |
| Fat Content | 9.70% |
| Carbohydrate Content | 48.30% |
2.2Cell culture
C2C12 cells were seeded at a concentration of 0.5×10⁴ cells per well inside a growth medium consisting of DMEM, 10% Fetal Bovine Serum, 100 U/mL Penicillin, and 100μg/mL of Streptomycin. Cells were grown for 48 hours until they reached 90% confluence. Four interventions were given, negative control consisting of only the medium, DMSO, 0.1μM Bafilomycin, and 5μM Verteporfin. The cells were harvested at 24 hours and were stored at –80°C until RNA and protein extraction.
2.3Western blot
Muscle tissue from the Soleus muscle was obtained and lysed in a lysis buffer with protease inhibitor. The BioRad protein assay kit (5000002) was used to quantify the protein concentration. Equal amounts of samples were loaded into SDS-Page and were electrophorized at 120 volts for 60 minutes. The resulting gel was transferred to a nitrocellulose membrane for an hour and then blocked using a 1% Skim Milk and 0.1% Tween 20 in a Tris buffer. Membranes were incubated with antibodies, and for every sample, normalization was done using GAPDH. Signal detection was done by the Li-Cor Odyssey Infrared system and was quantified using the associated software. The list of antibodies can be found in the supplementary materials.
2.4Real-Time PCR
RNA was extracted using the TRIsure reagent (BIO-38033) according to the manufacturer’s instructions. RNA was stored at –80°C until the time for real-time PCR. RNA quality was measured using U.V. absorbance at A260/A280 nm. RNA with a ratio of 1.9–2.0 were used for real-time PCR. Real-time PCR were done using My Taq One Step Real Time PCR Kit (BIO-65049) according to the manufacturer’s instructions. An equal amount of RNA was used for each reaction. Expression data were normalized using GAPDH as a housekeeping gene and were quantified using the ΔΔCq method using the formula by Livak and Schmittgen [24]. The list of primers and the cycling conditions we used in this study can be found in the supplementary materials.
2.5Histological sections and surface area measurement
The soleus muscle was excised and fixed in 4% buffered paraformaldehyde solution (PFA). The organ was then embedded in paraffin and was sectioned to 2-μm thick sections at its midsection. All sections were stained using hematoxylin and eosin. Visualization was done using a Leica ICC50 HD microscope at 400x magnification. Muscle fiber surface area was measured through several steps. Ten high power fields were obtained for each rat and used as input to Cellpose, a generalist algorithm for cellular segmentation [25]. The resulting mask was fed to the FIJI plugin LabelToROIs and then the fiber surface area was measured in microns [26]. A surface area less than the average muscle fiber diameter of 35μM was omitted to counteract false positives. Outliers with a considerable surface area were also removed while creating a boxplot using the base R package before analysis.
2.6Statistical analysis
Statistical analysis was done using R version 4.1.0. Gene expression analysis were done using the ΔΔCq method. Semiquantitative Western blot image analysis was done by densitometric analysis using the Li-Cor software. Finally, between-group comparisons were made using the appropriate test (t-tests, ANOVA, or Kruskal-Wallis) with the post hoc analysis using Tukey HSD or its non-parametric equivalent whenever appropriate.
3Results
3.1Animal models
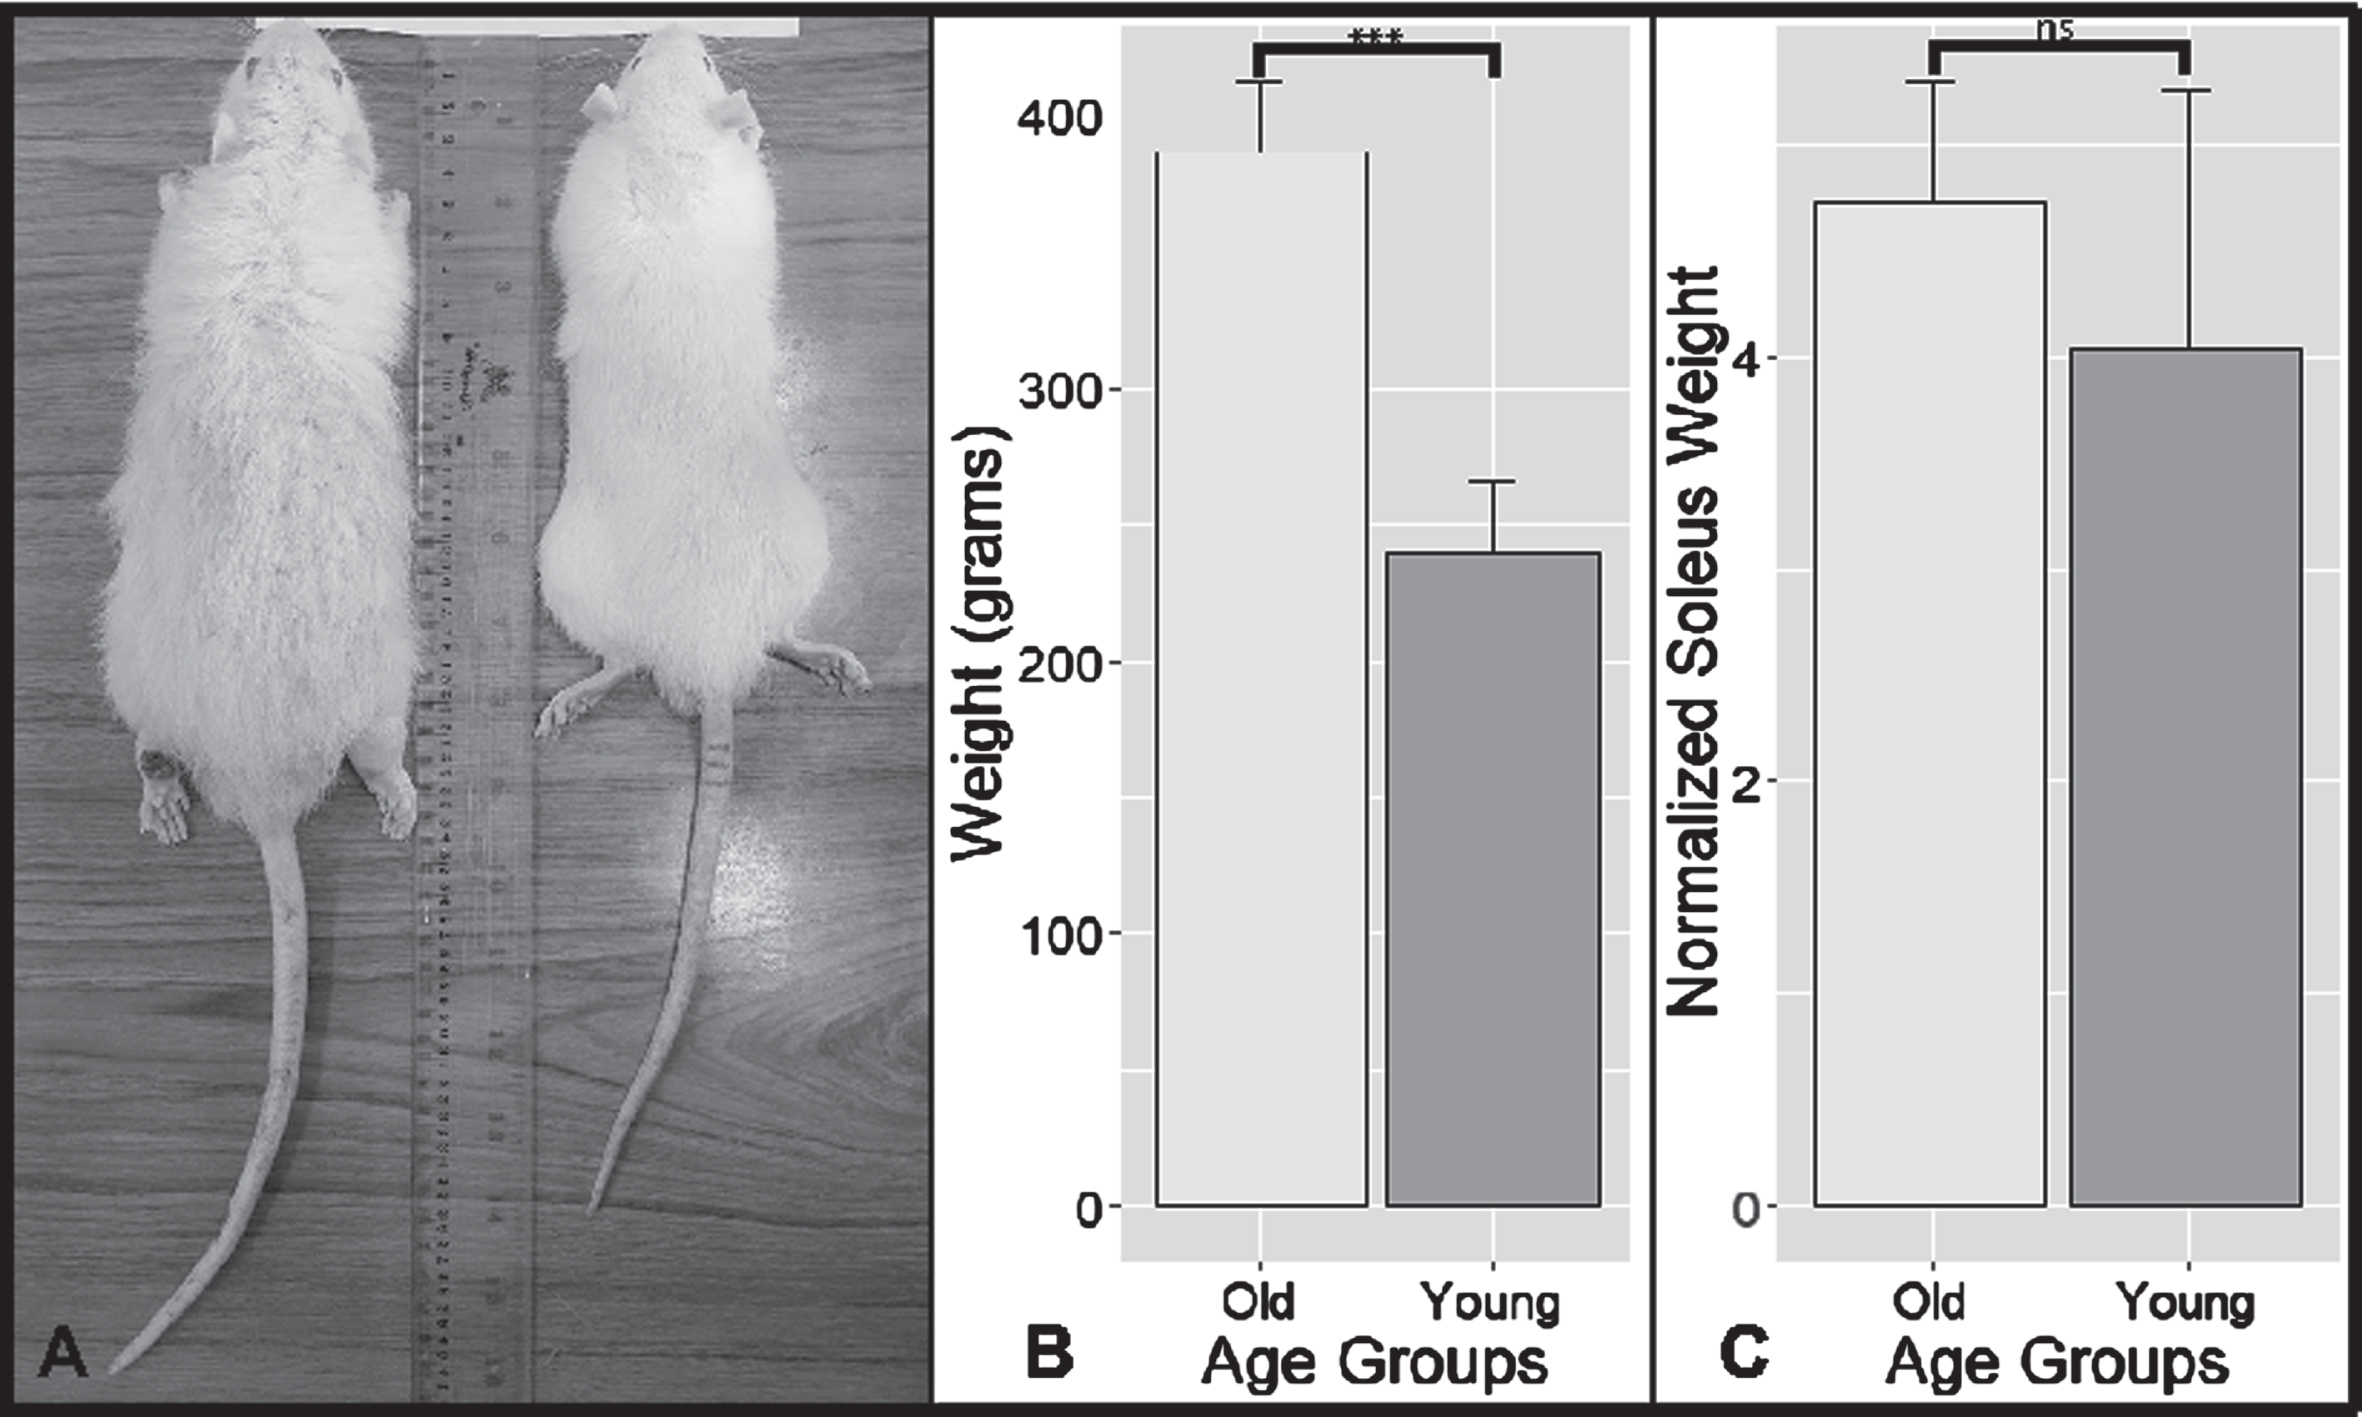
The rats used in this experiment were Wistar rats raised in normal conditions until the age of 80 weeks for the old group and ten weeks for the young group. The rats were in healthy condition aside from the fur thinning, as seen in Fig. 1. However, the weights of both groups differed significantly, with a mean difference of 147.4 grams (independent t-tests, p < 0.001, 95% CI (109.20–185.60)). We calculated the normalized weight of the soleus muscle by dividing the average soleus weight from each side of rats’ limbs to their total body weight. Although the normalized weight of old rats was smaller than controls on average, our results did not reach statistical significance.
Fig. 1
Old and Young Animal Models results. (A) Photos of old (left) and young (right) rats side by side. Notice the more extensive body mass and fur thinning on the old rat compared to the young rat. (B) A bar graph depicting the comparison of the mean weight of old and young rats. Notice the considerable larger weight of old rats (p < 0.001; 147.4g (109.20g–185.60g)). (C) A bar graph comparing the normalized weight of the soleus muscle with their respective weight. Normalized values were multiplied by 10,000 to aid visualization. ***: highly significant differences with the level of p < 0.001. ns: no significant differences with the level of p > 0.05. Error bars: standard deviation.
3.2Old rats were shown to have a smaller fiber surface area compared with younger controls
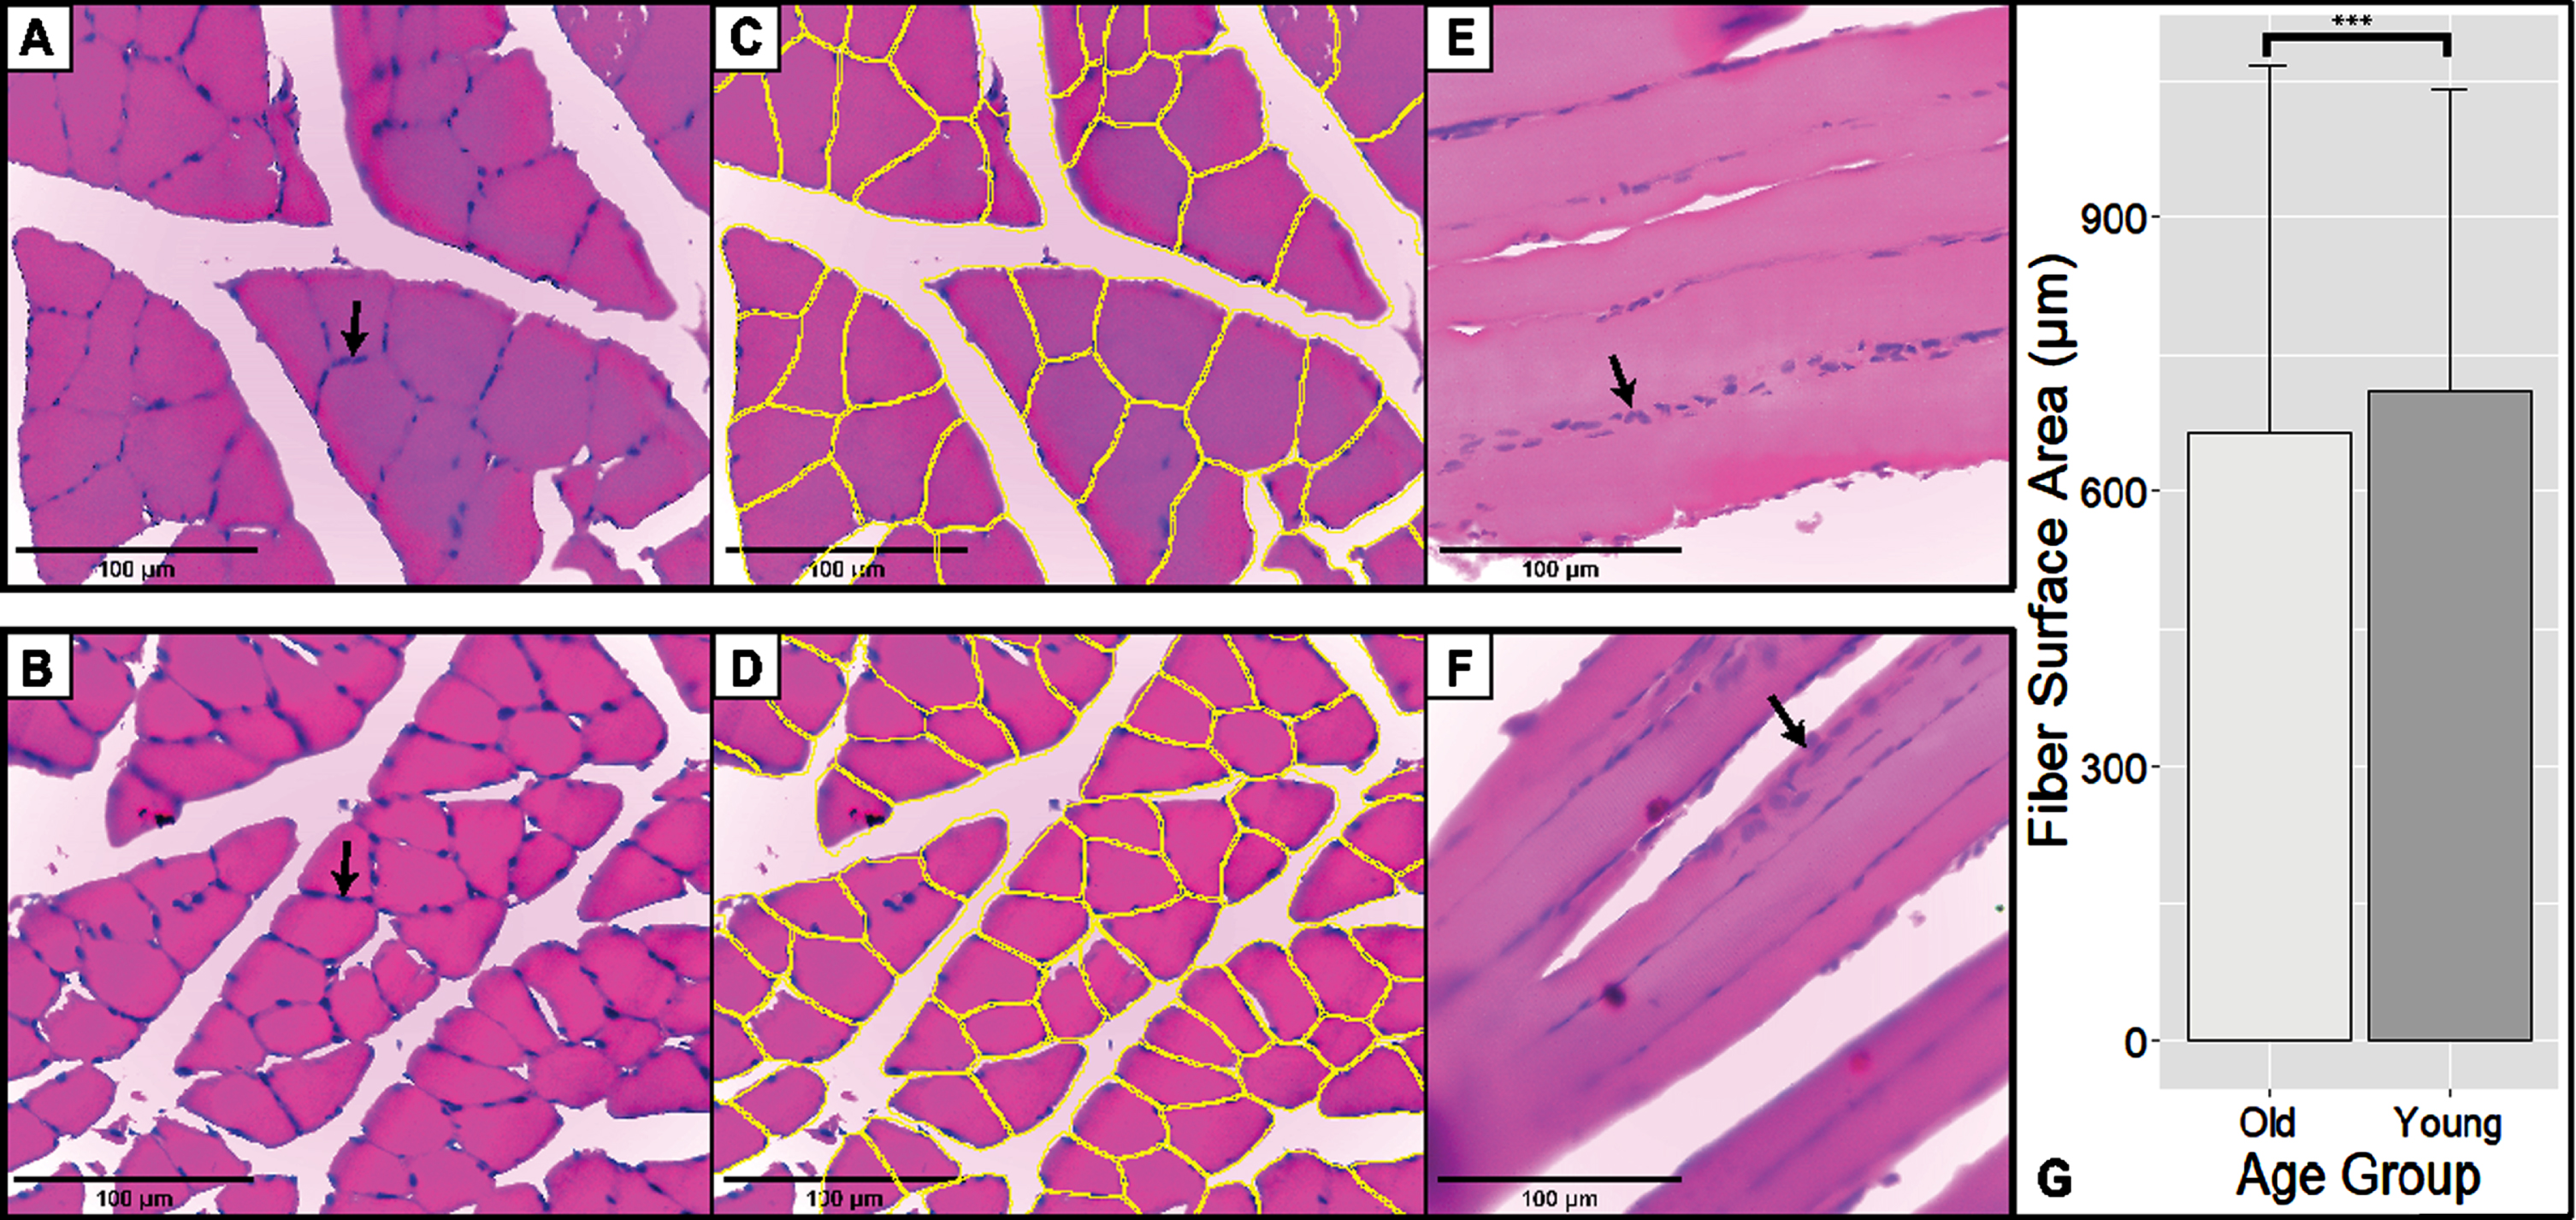
In total, the surface area of 4992 fibers was measured. Most of these fibers belonged to the old group with 2903 fibers, and the rest belonged to the younger controls. Figure 2 showed representative pictures of the soleus muscle stained using H&E. Compared to younger controls, the cell surface area of old age rats was much lower with a mean difference of 42.83μm2 (independent t-tests, p-value <0.001, 95% CI (–63.14, –22.35)).
Fig. 2
H&E Staining of Skeletal Muscle in Transverse and Longitudinal Section. Scale bar: 100μm. Black arrows showed the peripheral nucleus of skeletal muscle cells. (A-B) Representative pictures of transverse old rats (above) and young rats (below). These sections are typical H&E-stained sections. (C-D) Fiber segmentation is done on sections A and B using the Cellpose Algorithm. Yellow outlines correspond to the individual muscle fibers recognized by the algorithm. (E-F) Representative pictures and longitudinal sections of old rats (above) and young rats (below). (G) Fiber surface area of old and young rats. Old rats have a smaller soleus fiber surface area compared to younger controls (p < 0.001; 42.83μm2 (22.35μm2–63.14μm2)).
3.3Old rats were shown to have a higher expression of Yap and a lower expression of Myh1 compared to young control rats
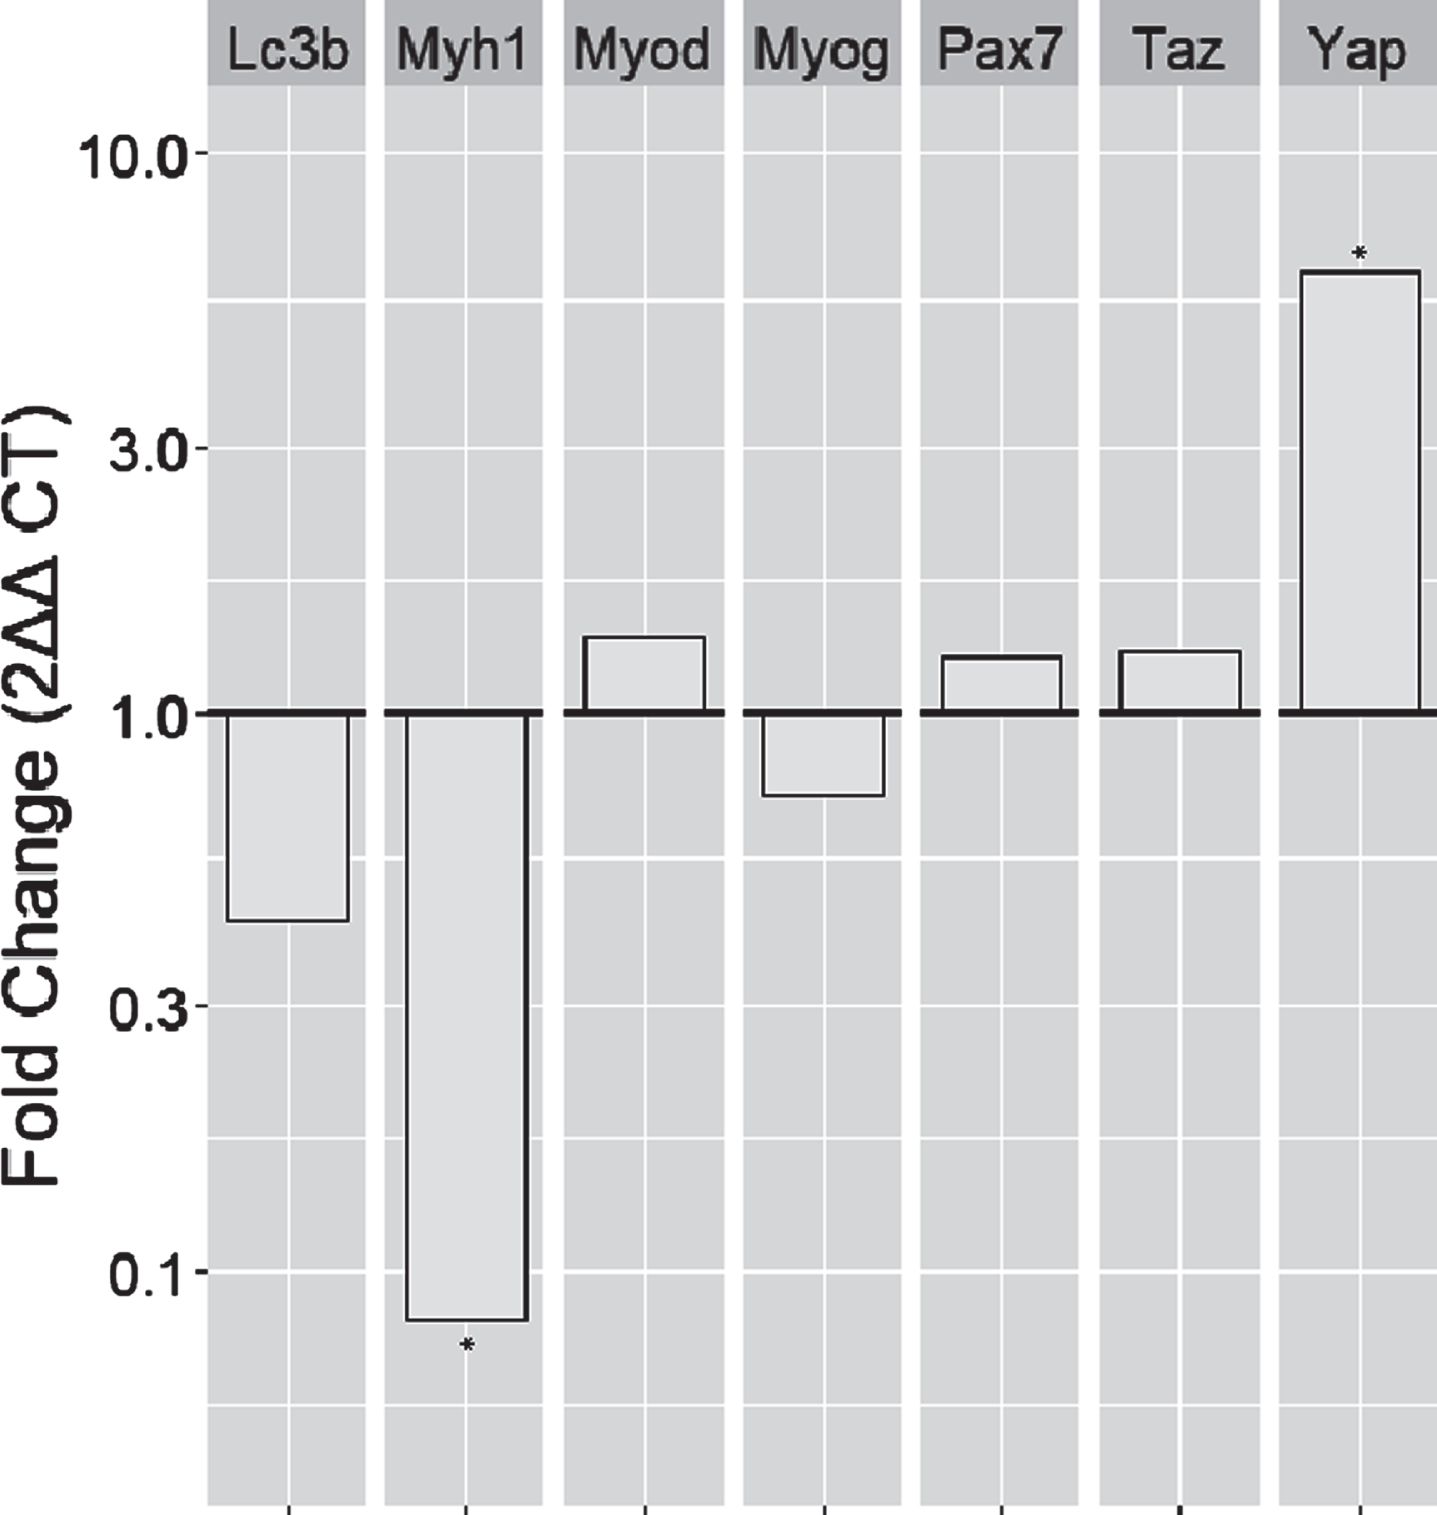
Gene expression data were collected for select genes involved in muscle cell differentiation and growth, such as the myosin heavy chain gene (Myh1), myogenic differentiation 1 (Myod1), myogenin (Myog), and paired box 7 (Pax7). Additionally, genes encoding proteins involved in autophagy and the Hippo pathway were also collected, specifically the Microtubule Associated Protein 1 Light Chain 3 Beta (Lc3b) and the Yes-associated protein (Yap) and transcriptional co-activator with PDZ-binding motif (Taz).
Figure 3 demonstrated the relative gene expression shown in fold changes com-pared to young controls. Two genes stand out with a significant difference, the Myh1 and the Yap gene (independent t-tests, p < 0.05 and p < 0.05, with 0.08-fold and 6.15-fold change, respectively).
Fig. 3
Gene expression analysis of genes involved in autophagy, myogenesis, and the Hippo pathway. Bar charts denote the fold changes of gene expression in old rats compared to young control rats. Yap (p < 0.05) and Myh1 (p < 0.05) fold changes were 6.15-fold and 0.08-fold, respectively. *: significant difference compared to young controls at the level of p < 0.05
3.4Old rats have higher Yap protein levels with lower autophagy markers compared to young control rats
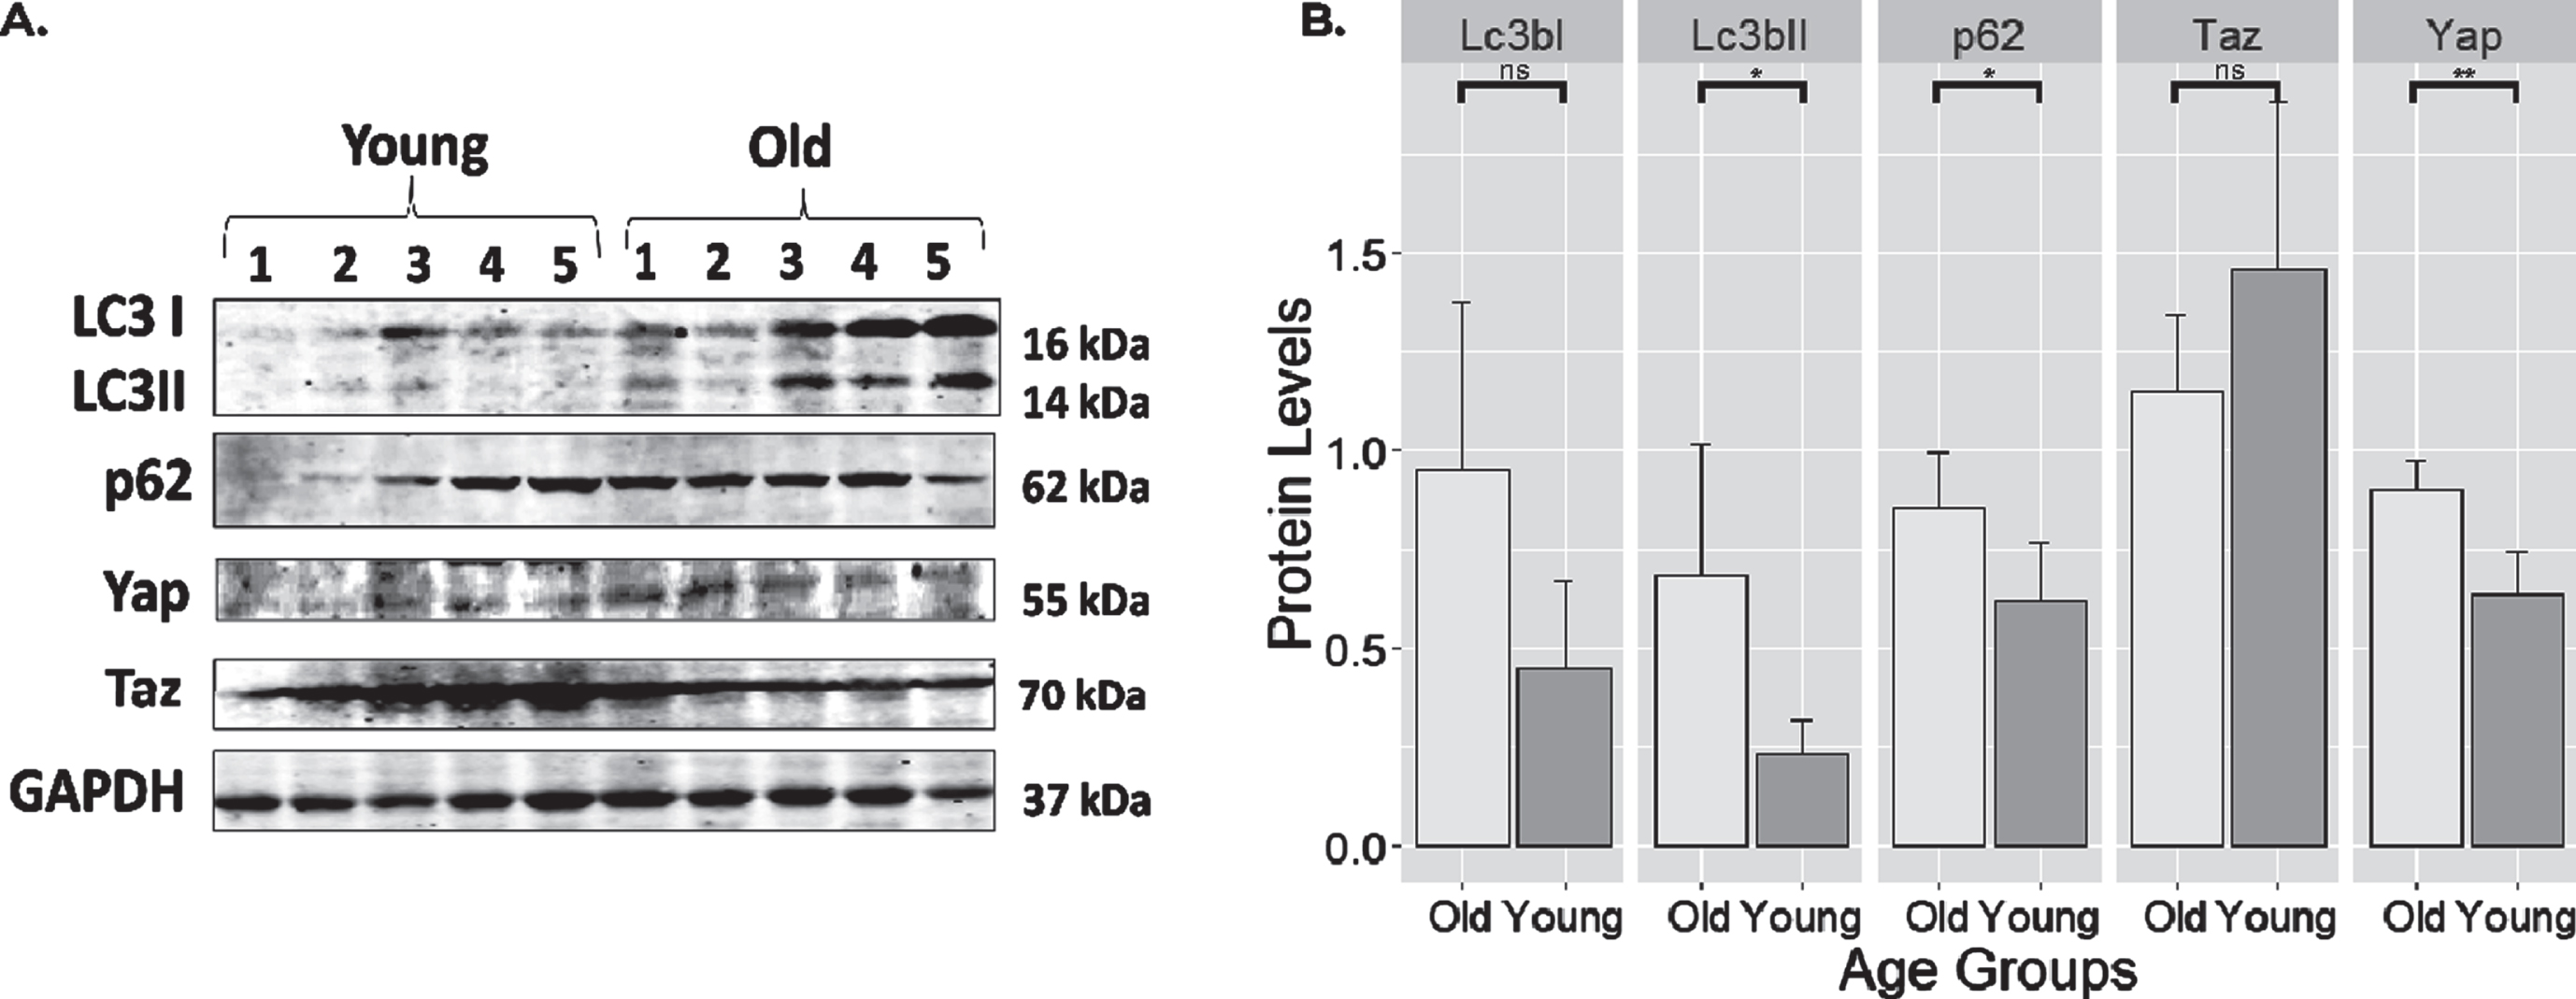
Protein expressions from the soleus muscle were compared between old and young rats using Western Blot as shown in Fig. 4. Normalization of protein levels was done using Gapdh. Compared to young rats, old rats showed impaired autophagic flux as shown by the increased levels of Lc3bII (p < 0.05) and p62 (p < 0.05). Additionally, on average, the levels of Lc3bI showed higher protein levels in old rats, although it did not reach statistical significance (p = 0.055). Yap protein level was also higher in old rats (p < 0.01). However, its counterpart Taz did not show changes between the two groups.
Fig. 4
Expression of select proteins from old and young rat skeletal muscle. (A) Full blot of Lc3, p62, Yap, Taz, and Gapdh. (B) protein expression levels normalized to Gapdh. Notice that autophagy markers such as Lc3bII (p < 0.05; 0.45 (0.046–0.857)) and p62 (p < 0.05; 0.233 (0.022–0.445)) markers were highly expressed in old muscle. Yap also has a higher expression (p < 0.01; 0.267(0.129–0.405)) in old rats compared to younger controls. The levels of Lc3bI and Taz were unchanged. **: highly significant differences with the level of p < 0.01. *: significant difference compared at the level of p < 0.05. ns: no significant differences with the level of p > 0.05. Error bars: standard deviation.
3.5Autophagy inhibition was shown to increase Yap/Taz protein levels, but not vice versa
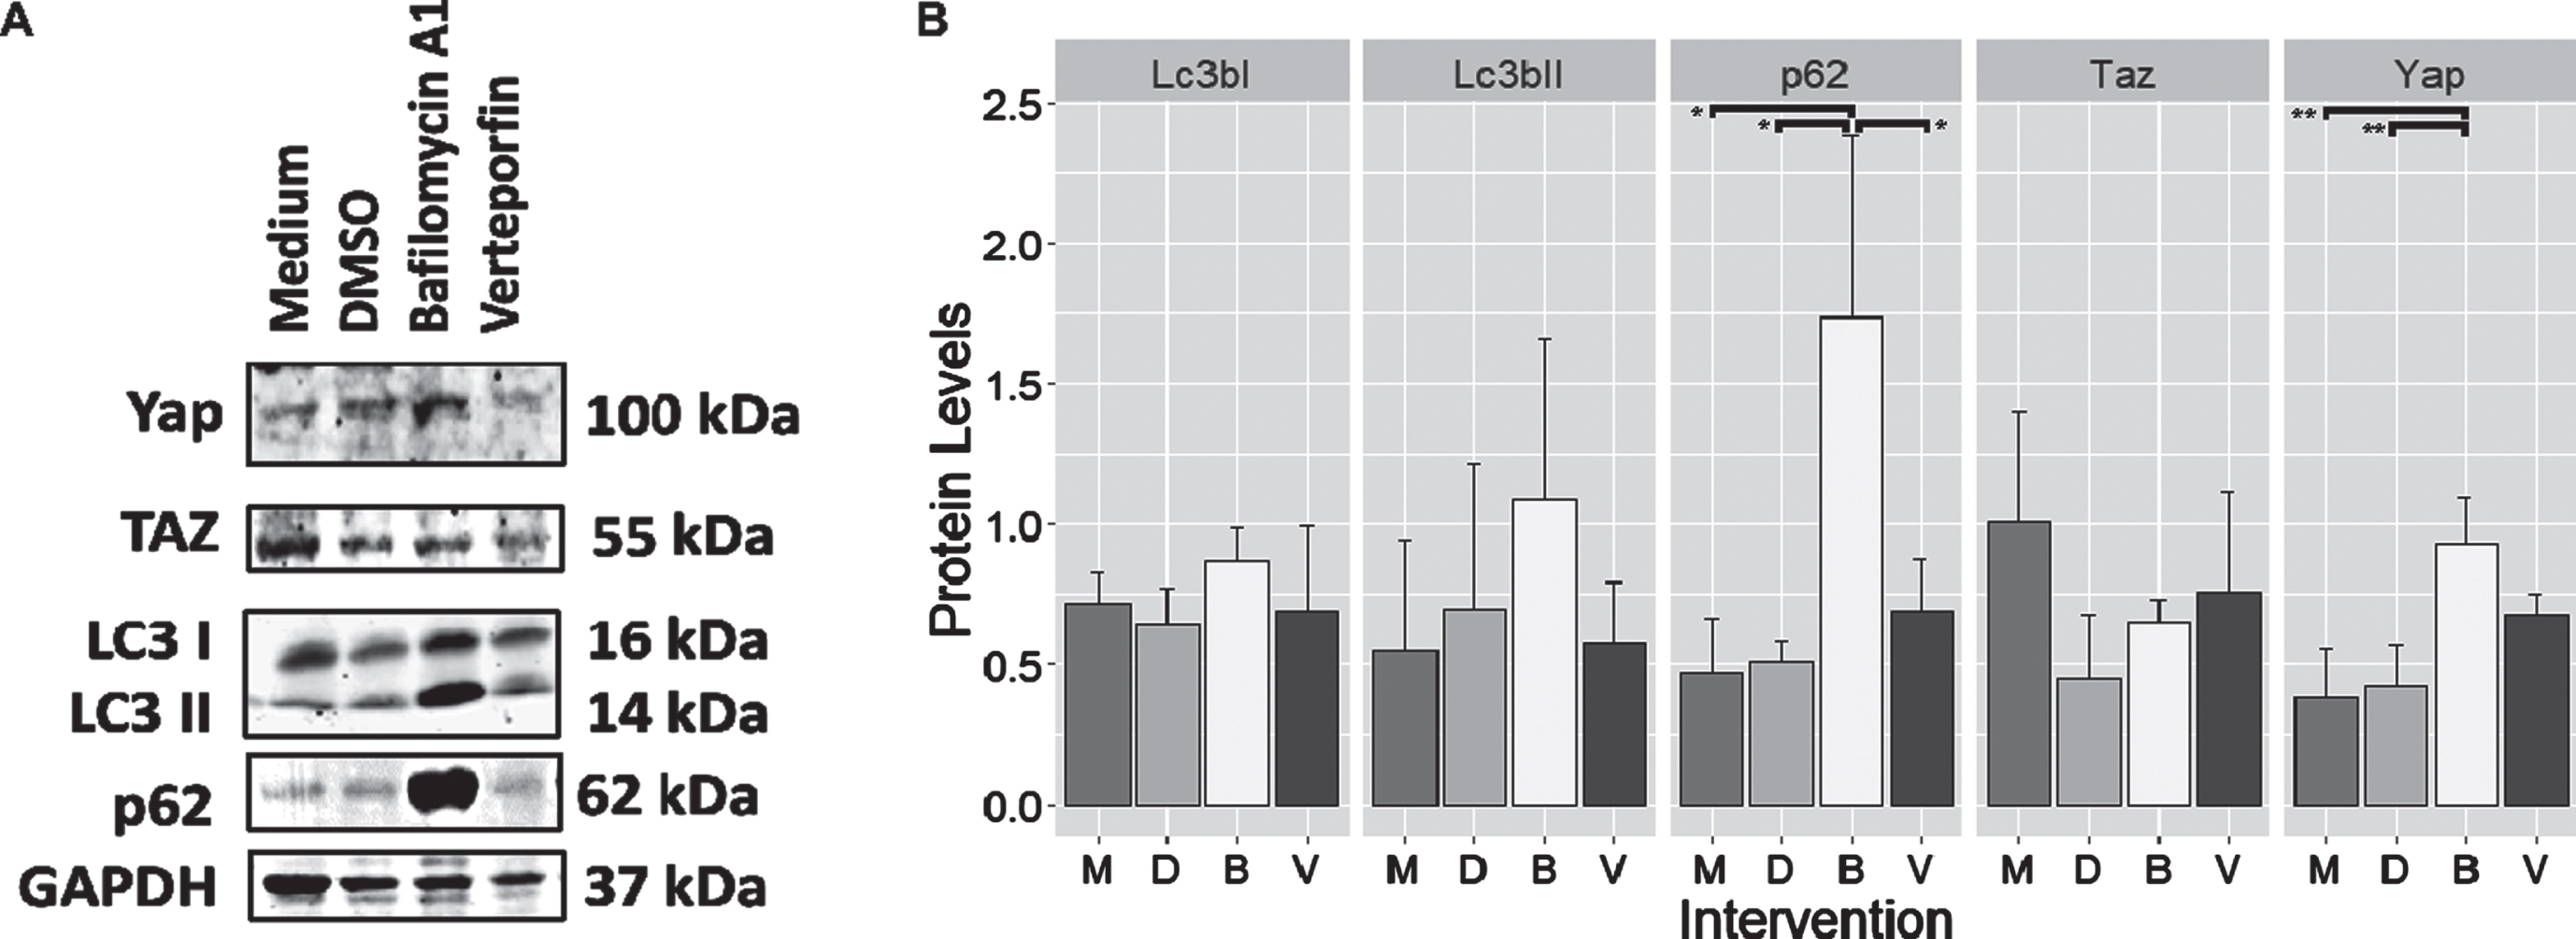
Protein expression was collected from cell cultures after treatment with Bafilomycin, an autophagy inhibitor or Verteporfin which blocked Yap downstream interactions. Figure 5 showed that after 24 hours, the Bafilomycin A1 group showed higher expression of p62 compared to the medium control (Tukey HSD; p < 0.05), DMSO (Tukey HSD; p < 0.05), and Verteporfin (Tukey HSD; p < 0.05). In addition, Yap was shown to be increased compared to medium (Tukey HSD; p < 0.01) and DMSO control (Tukey HSD; p < 0.01). Notably, the application of Verteporfin did not significantly affect LC3I, LC3II, and p62 which belongs to the autophagy pathway
Fig. 5
Protein expression levels from C2C12 cells treated with Bafilomycin A1 and Verteporfin. (A) Representative blot of Yap/Taz and proteins involved in autophagy. Note the very marked increase in p62 and Yap intensity after treatment using Bafilomycin A1. (B) Bar plot showing the relative expression levels of proteins from blot A. After treatment with Bafilomycin A1, the p62 protein significantly increased compared to medium, DMSO, and Verteporfin (post hoc analysis –Tukey HSD, p < 0.05 for all three pairs). In addition, the administration of Bafilomycin A1 also significantly increased Yap levels compared to medium and DMSO (post hoc analysis –Tukey HSD, p < 0.01 for all two pairs). Other proteins did not reach a statistically significant difference. M: Medium; D: DMSO; B: Bafilomycin A1; V: Verteporfin. **: highly significant differences at the level of p < 0.01; *: significant difference compared at the level of p < 0.05.
4Discussion
This experiment shows that aging did influence skeletal muscle both at the structural level with size changes and from its functional standpoint through differential gene and protein expression. In addition, old rats were found to have a significantly smaller fiber size than young rats (Fig. 2). These reflect the ongoing sarcopenia that affects rats of old age despite these rats having a higher body weight than young rats. These effects may also be caused by nutritional deficiencies, especially minerals such as magnesium, selenium, and calcium. Research has shown the association between calcium and selenium with skeletal muscle size and sarcopenia [27]. However, no comparisons were made in this research to ascertain their relationships.
Several types of fibers might be much more vulnerable to age-related sarcopenia than the rest. Specifically, the slow fibers were shown to be more resistant, presumably due to the effects of PGC-1α [28]. Our findings showed that fiber differentiation is affected by aging. We found that aging causes a loss of MYH1 expression, signifying the shift from fast 2x to slow fibers. These findings were also corroborated by the findings of several authors, which explored the protein expression or fiber type composition changes that happened during aging [29, 30]. However, since we measured all fibers irrespective of their types, our findings might underestimate the real effects aging has on muscle fiber size. Despite this limitation, our results showed a net decrease in muscle fiber size in aged rats compared to younger controls.
Since genes of the Hippo pathway, specifically Yap and Taz, were known to positively influence muscle fiber growth, we assumed that these genes might be downregulated in old rats. However, several genes that we have measured showed that this is not the case. Yap was shown to be significantly upregulated, reaching more than six folds in old rats. However, Taz remained unchanged. Although these findings are in contrast to previous results that found Yap overexpression to increase fiber size [9, 31], an author also associated Yap overexpression with muscle atrophy and myopathy [7, 32]. Clearly, the influence of the Hippo pathway on skeletal muscle is not straightforward, and many pathways interact to produce the final phenotype of muscle growth.
Additionally, protein expression of Yap/Taz did coincide with their gene expression. Yap was shown to be highly expressed on the skeletal muscle of old rats. However, although the increase of this protein is usually associated with hypertrophy, [15] currently we found that sarcopenia is associated with increased Yap levels. Corroborating our findings, previous research has shown that aged muscle and genetically induced sarcopenic muscle have higher Yap protein levels than younger controls [6, 33]. In this study, we confirmed that these changes also occurred during physiological aging and the sarcopenia associated with it. We also found that age-induced sarcopenia is also associated with decreased autophagic flux in old rats. Our findings complemented findings from the study by Yoshida et al., which found that the sarcopenic phenotype caused by the activation of (pro)renin receptors was first caused by autophagy dysfunction [33]. Thus, we can conclude that both autophagy and Yap signaling was altered during physiological aging and contributed to the loss of muscle mass.
To ascertain the influence of Yap/Taz and autophagy, we then used a cell culture model of C2C12 cells combined with Bafilomycin, which inhibits the autophagy pathway, and Verteporfin, which inhibits Yap downstream function. The results showed that Bafilomycin successfully induced the accumulation of p62 and both isoforms of LC3, proteins involved in the autophagy pathway. However, the increase in autophagy proteins was coupled with an increase in the expression of Yap. Proofing that Yap was autophagy substrates, and the inhibition of autophagy caused this protein to accumulate. Our findings were supported by the findings of previous investigators that coupled Yap as an autophagy substrate, although this research was based on cancer cell lines [34, 35]. However, we have to note that other research found Yap/Taz was closely correlated with autophagy and they helped regulate the fusion of autophagosomes [22]. Although conflicting, these findings reflect the complexity of Yap/Taz and autophagy regulations. It would seem that both of their functions were differentially regulated and influenced by different organs and cancer cells. Based on our current findings, we can summarize that at least in skeletal muscle tissue, the inhibition of autophagy increased Yap protein levels. However, the administration of Verteporfin failed to produce any significant changes to autophagic activity in C2C12 cell lines. We argued that in skeletal muscle cells during aging condition the signaling pathway flows from autophagy to Yap/Taz and not the other way around. Since autophagy functions were already known to decrease during aging [36, 37] and contribute to the sarcopenic phenotype found on skeletal muscle, it may exert its effects on sarcopenia through increasing Yap levels.
5Conclusions
Through this research, we found that aging caused age-related muscle changes resulting in sarcopenia. Similar to genetically induced sarcopenia, the sarcopenic muscle exhibit changes in autophagic flux. The lowered autophagic flux was shown to increase Yap/Taz protein levels in old rats. However, the increase of Yap/Taz was associated with muscle sarcopenia, unlike previous transgenic studies. However, further research is needed. Furthermore, evaluating whether inhibiting Yap or selectively abolishing Yap expression in old rats alters skeletal muscle mass needs to be conducted to finally ascertain the contribution of this supposed growth-promoting protein in skeletal muscle aging.
Author’s contributions
Conceptualization, A.S., R.L., H.G., and I.S.; Methodology, A.S., R.L., F.N.D., and U.S.; Formal Analysis, A.S., R.L., H.G., and I.S.; Writing –Original draft, A.S., R.L., and Y.S.P.; Writing –Review & Editing, A.S., R.L., H.G., and I.S.; Data visualization, A.S., R.L., and N.S.; Supervision, H.G., N.S., F.N.D., and U.S.; Project Administration, H.G., N.S., Y.S.P. Funding Acquisition, I.S., N.S., Y.S.P. All authors have read, agreed and contributed to the final version of the manuscript.
Acknowledgments
We acknowledge the team members, Susianti, Nurul, and Canadia at the Central Laboratory Universitas Padjadjaran for their technical expertise to assist and support us during this study. We also thank Maranatha Christian University for providing kits and reagents used in this research. Additionally,we also thank Drh. Permanawati, and Drh. Devi Kartika for their technical support.
Declaration of conflicting interests
The authors have no conflict of interest to report.
Funding
This research was supported by the Direktorat Jenderal Pendidikan Tinggi Indonesia through the Program Magister Doktoral Sarjana Unggul (PMDSU) batch V with grant number 211/SP2H/LT/DRPM/2020 to Ardo Sanjaya, and to the Kementerian Riset, Teknologi, dan Pendidikan Tinggi through the World Class Research grant with grant number 3854/UN6.C/LT/2019 to Iwan Setiawan. We also thank the Indonesian World Class Research grant No. 1207/UN6.3.1/PT.00/2021 from the Ministry of Education and Culture to Ronny Lesmana and the Universitas Padjadjaran Internal Research Grant (RPLK) with grant No. 1908/UN1/RPLK to Yuni Susanti Pratiwi.
Data availability
Data are available upon reasonable requests to the authors.
Supplementary materials
[1] The supplementary material is available in the electronic version of this article: https://bit.ly/3ReccM8.
References
[1] | Cruz-Jentoft AJ , et al. , Sarcopenia: Revised European consensus on definition and diagnosis, Age and Ageing (2019) ;48: (1):16–31. |
[2] | Cruz-Jentoft AJ , Sayer AA Sarcopenia, The Lancet. 3931) (2019) ;393: (10191):2636–46. |
[3] | Dhillon RJS , Hasni S Pathogenesis and management of sarcopenia, Clinics in Geriatric Medicine (2017) ;33: (1):17–26. |
[4] | Sandri M , et al. Signalling pathways regulating muscle mass in ageing skeletal muscle, The role of the IGF1-Akt-mTOR-FoxO pathway. Biogerontology (2013) ;14: (3):303–23. |
[5] | Zeng Z , et al. Exercise-induced autophagy suppresses sarcopenia through Akt/mTOR and Akt/FoxO3a signal pathways and AMPK-mediated mitochondrial quality control. Frontiers in Physiology. 2020;11. |
[6] | Iyer SR , et al. Age-dependent changes in nuclear-cytoplasmic signaling in skeletal muscle. Experimental Gerontology. 2021;150. |
[7] | Iyer SR , et al. Differential YAP nuclear signaling in healthy and dystrophic skeletal muscle, Am J Physiol Cell Physiol (2019) ;317: (1):C48–57. |
[8] | Zhao K , et al. Muscle Yap is a regulator of neuromuscular junction formation and regeneration, The Journal of Neuroscience (2017) ;37: (13):3465–77. |
[9] | Watt KI , et al. The Hippo pathway effector YAP is a critical regulator of skeletal muscle fibre size, Nature Communications (2015) ;6: (1). |
[10] | Schlegelmilch K , et al. Yap1 acts downstream of alpha-catenin to control epidermal proliferation, Cell (2011) ;144: (5):782–95. |
[11] | Loforese G , et al. Impaired liver regeneration in aged mice can be rescued by silencing Hippo core kinases MST1 and MST2, EMBO Molecular Medicine (2016) ;9: (1):46–60. |
[12] | Gregorieff A , et al. Yap-dependent reprogramming of Lgr5+ stem cells drives intestinal regeneration and cancer, Nature (2015) ;526: (7575):715–8. |
[13] | Judson RN , et al. The Hippo pathway member Yap plays a key role in influencing fate decisions in muscle satellite cells, J Cell Sci (2012) ;125: (Pt 24):6009–19. |
[14] | Sun C , et al. Common and distinctive functions of the hippo effectors taz and Yap in skeletal muscle stem cell function, Stem Cells (2017) ;35: (8):1958–72. |
[15] | Setiawan I , et al. Hippo pathway effectors YAP and TAZ and their association with skeletal muscle ageing. Journal of Physiology and Biochemistry. 2021. |
[16] | Demontis F , Perrimon N FOXO/4E-BP signaling in drosophila muscles regulates organism-wide proteostasis during aging, Cell (2010) ;143: (5):813–25. |
[17] | Tsai S , et al. Muscle-specific 4E-BP1 signaling activation improves metabolic parameters during aging and obesity, Journal of Clinical Investigation (2015) ;125: (8):2952–64. |
[18] | Basisty N , Meyer JG , Schilling B Protein turnover in aging and longevity, Proteomics (2018) ;18: (5-6) . |
[19] | Pei T , et al. Increased expression of YAP is associated with decreased cell autophagy in the eutopic endometrial stromal cells of endometriosis. Molecular and Cellular Endocrinology. 2019;491. |
[20] | Pérez E , et al. Autophagy regulates tissue overgrowth in acontext-dependent manner, Oncogene (2014) ;34: (26):3369–76. |
[21] | Lee YA , et al. Autophagy is a gatekeeper of hepatic differentiation and carcinogenesis by controlling the degradation of Ya, Nature Communications (2018) ;9: (1). |
[22] | Totaro A , et al. Cell phenotypic plasticity requires autophagic flux driven by YAP/TAZ mechanotransduction, Proceedings of the National Academy of Sciences (2019) ;116: (36):17848–57. |
[23] | Hansen CG , et al. The Hippo pathway effectors YAP and TAZ promote cell growth by modulating amino acid signaling to mTORC1, Cell Research (2015) ;25: (12):1299–313. |
[24] | Livak KJ , Schmittgen TD Analysis of relative gene expression data using real-time quantitative PCR and the 2–ΔΔCT method, Methods (2001) ;25: (4):402–8. |
[25] | Stringer C , et al. Cellpose: A generalist algorithm for cellular segmentation, Nature Methods (2020) ;18: (1):100–6. |
[26] | Waisman A , et al. Automatic and unbiased segmentation and quantification of myofibers in skeletal muscle, Scientific Reports (2021) ;11: (1). |
[27] | van Dronkelaar C , et al. Minerals and sarcopenia; the role of calcium, iron, magnesium, phosphorus, potassium, selenium, sodium, and zinc on muscle mass, muscle strength, and physical performance in older adults: A systematic review, Journal of the American Medical Directors Association (2018) ;19: (1):6–11.e3. |
[28] | Wang Y , Pessin JE Mechanisms for fiber-type specificity of skeletal muscle atrophy, Current Opinion in Clinical Nutrition and Metabolic Care (2013) ;16: (3):243–50. |
[29] | Murgia M , et al. Single muscle fiber proteomics reveals fiber-type-specific features of human muscle aging, Cell Re (2017) ;19: (11):2396–409. |
[30] | Snow LM , McLoon LK , Thompson LV Adult and developmental myosin heavy chain isoforms in soleus muscle of aging Fischer Brown Norway rat, The Anatomical Record Part A: Discoveries in Molecular, Cellular, and Evolutionary Biology (2005) ;286A: 1 866–73. |
[31] | Watt KI , et al. Yap is a novel regulator of C2C12 myogenesis, Biochemical and Biophysical Research Communications (2010) ;393: (4):619–24. |
[32] | Judson RN , et al. Constitutive expression of Yes-associated protein (Yap) in adult skeletal muscle fibres induces muscle atrophy and myopathy, PLoS One (2013) ;8: (3):e59622. |
[33] | Yoshida N , et al. (Pro)renin receptor accelerates development of sarcopenia via activation of Wnt/YAP signaling axis, Aging Cell (2019) ;18: (5):e12991. |
[34] | Wang P , et al. Activation of Aurora A kinase increases YAP stability via blockage of autophagy, Cell Death & Disease (2019) ;10: (6) |
[35] | Takamura A , et al. Autophagy-deficient mice develop multiple liver tumors, Genes & Development (2011) ;25: (8):795–800. |
[36] | Escobar KA , et al. Autophagy and aging: Maintaining the proteome through exercise and caloric restriction, Aging Cell (2019) ;18: (1). |
[37] | Jiao J , Demontis F Skeletal muscle autophagy and its role in sarcopenia and organismal aging, Current Opinion in Pharmacology (2017) ;34: :1–6. |

