
Continuous energy restriction (CER) plus 16/8 time-restricted feeding improve body composition and metabolic parameters in overweight and obese, but no more than CER alone
Abstract
BACKGROUND:
Current guidelines recommend continuous energy restriction (CER) and lifestyle change as the basis of obesity treatment. Recently, several intermittent fasting protocols have received considerable interest as an alternative weight loss strategy.
OBJECTIVE:
This study compared the effects of 8-week CER versus CER along with 16/8 time-restricted feeding (16/8 TRF) on body composition and metabolic markers in excess weight physically active subjects.
METHODS:
Twenty-four physically active obese or overweight adults, from both genders, were split into two groups: CER plus 16/8 TRF (CER + TRF) and CER. Both groups consumed a 20%energy restriction diet. CER plus 16/8 TRF were asked to consume their meals during an 8-hour open window (12 to 20 pm). We evaluated body composition and metabolic biomarkers before and after the intervention.
RESULTS:
We observed a reduction in body weight (BW), body mass index (BMI), waist circumference (WC), and fat mass (FM) in both groups. However, a decrease in fat-free mass (FFM) and skeletal muscle mass (SMM) was seen only in the CER. Although fasting glucose did not change, we observed a decrease in fasting insulin and HOMA-IR in both groups. Leptin decrease in both treatments. Cortisol levels increased only in the CER group.
CONCLUSIONS:
We can conclude that CER + TRF is as effective as CER to promote weight and fat loss, but, CER + TRF seems to be more efficient in maintaining lean body mass.
1Introduction
Obesity is increasing at alarming rates all over the world and is a major risk factor for metabolic comorbidities such as type 2 diabetes mellitus, cardiovascular diseases, insulin resistance, metabolicsyndrome and more recently, preliminary data suggest that obesity can increase the risk of severe COVID-19 infection [1–3]. Body weight loss, traditionally based on modest continuous energy restriction (CER) and lifestyle changes that are known to improve metabolic parameters such as insulin and lipoproteins levels. In addition, metabolic regulation of glucose and lipids seems to be influenced by other dietary strategies such as altering meal timing and fasting [4, 5].
Intermittent fasting (IF) is a restricted feeding period originated in religious traditions [6]. IF has gained considerable scientific and popular repercussions, being considered a strategy along to CER due to the positive effects on body composition and health biomarkers [7, 8]. IF has been shown to improve glucose and lipid metabolism, oxidative stress, inflammatory markers, cardiovascular diseases, percentage of visceral and total body fat mass, even during the short time (8–12 weeks) [4–6, 9–13]. These reported effects can be mediated through changes in metabolic pathways and cellular processes such as autophagy, lipolysis, and stress resistance, which are well-documented animal models and cell cultures [14, 15].
Many IF methods have been described, but the most popular protocols can be grouped into three categories: Alternate-day fasting, Whole-day fasting and Time-restricted feeding [7]. Time-restricted feeding involves the same routine of daily eating, with several hours designated as fasting window and the remaining hours as feeding window or open window. In this protocol, fasting lasts at least 12 h and may extend to 20 h a day [16]. Between time-restricted feeding protocol, stands out the 16/8 TRF that involves eating only during an 8-hour window and fasting for the remaining 16 hours. Although this protocol became popular, few works have evaluated 16/8 IF effects on body composition and health markers [7, 8].
Reduction in body weight [8, 17–19], fat mass [8, 17, 19, 20] and waist circumference [18] have been observed in subjects undergoing 16/8TRF, independent of energy restriction. Furthermore, improvement of biomarkers such as total cholesterol, triglycerides, fasting insulin, HOMA-IR [8, 17], leptin [8], adiponectin [19], and blood pressure [17, 20] has been shown.
Gabel et al. evaluated the safety of 12 weeks 16/8 TRF program found no changes in self-reported adverse events, body image perception, complete blood count, and disordered eating patterns [21]. However, Kesztyüs et al. [18] reported some side effects, such as, cravings, dizziness, nausea, and feeling hungry in their work, but despite hunger and side effects, participants adhered quite well.
Therefore, the aim of the present study was to investigate the effects of 8 week CER associated or not to TRF (8h eating window) on body composition and metabolic parameters in overweight/obese individuals undergoing moderate-intensity exercise. We hypothesized that TRF associated with CER protocol results in greater outcomes in body weight, fat mass, and fat-free mass than CER alone.
2Material and methods
2.1Participants and study design
Fifty-two participants were enrolled in the study. The inclusion criteria were age between 18 to 40 years old, BMI > 25 kg/m2 and to practice physical exercise three times a week. Individuals with kidney disease, hormonal diseases, limiting joint diseases, heart disease, or diabetes were not included. Twelve individuals were excluded for not meeting some inclusion criteria and sixteen participants refused to participate because the research period coincided with the 2016 World Cup. Therefore, twenty-four subjects (20 women and 4 men), physically active, aged between 18 and 40 years old, were assigned for the study. Study protocol comprised an 8-week intervention phase and individuals were matched for BMI and gender before being divided evenly into two groups: Continuous Energy Restriction (CER; n = 12) and CER associated with time-restricted feeding (CER + TRF; n = 12) (Fig. 1). The characteristics of subjects are shown in Table 1. All participants read and signed an informed consent document with the description of the testing procedures approved by the ethical committee of the Federal University of Lavras No 84305518.5.0000.5148, and conformed to standards for the use of human subjects in research as outlined in the current Declaration of Helsinki.
Fig. 1
Study flow chart.
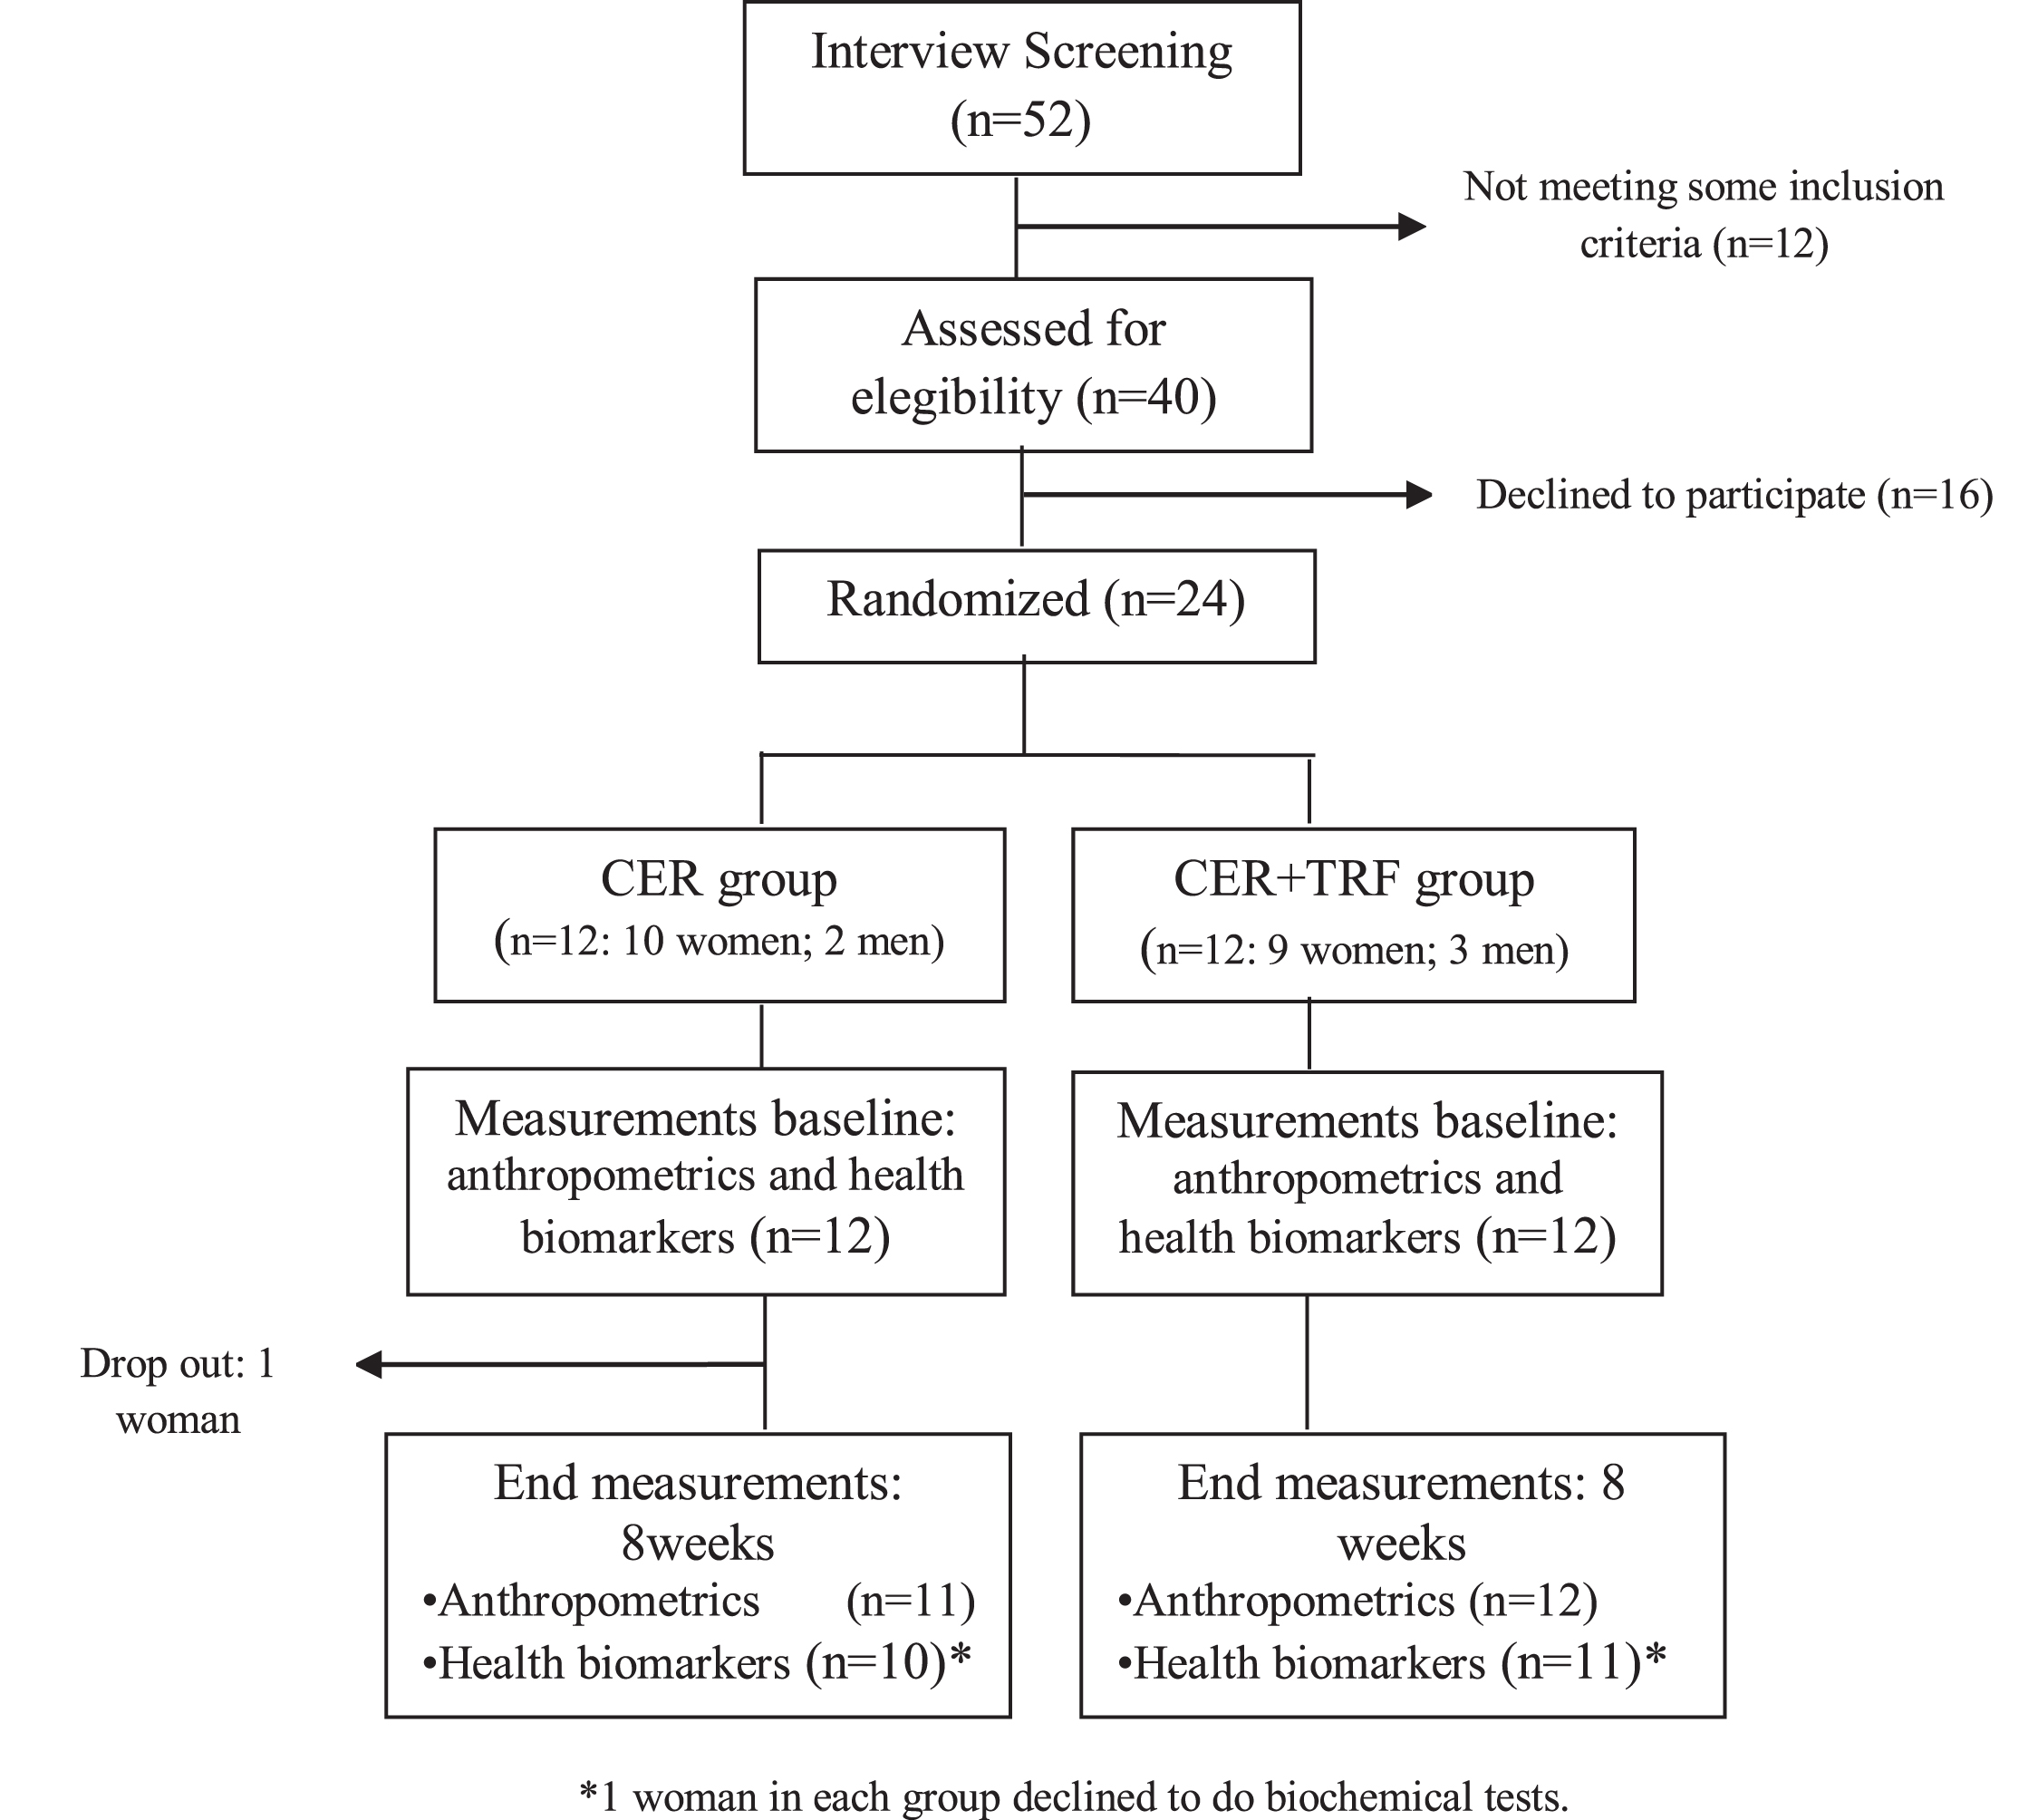
Table 1
Individual’s baseline characteristics
| Variables | CER | CER + TRF | Value p |
| Age (yr) | 33.0±8.7 | 32.4±5.5 | 0.837 |
| BW (kg) | 84.0±14,3 | 83.3±13.5 | 0.975 |
| Height (cm) | 163.0±7.8 | 165.6±8.6 | 0.540 |
| BMI (kg/m2) | 31.7±5,6 | 30.5±3.5 | 0.909 |
| FM (kg) | 32.6±11.0 | 32.7±6.6 | 0.965 |
| FFM (kg) | 51.5±10.2 | 50.7±10.7 | 0.926 |
| WC (cm) | 94.7±9.9 | 93.4±11.2 | 0,769 |
Results were presented as mean±SD. BW: body weight; BMI: body mass index; FM: fat mass; FFM: free mass; WC: waist circumference.
2.2Diet
Both groups were submitted to a 20%energy restriction diet, which was based on daily Estimated Energy Requirement (EER) calculated according to the equations proposed by the Institute of Medicine (2003) with an adaptation (fat-free mas was used instead of body weight). The EER was (CER =2124.1±276.9 Kcal/day; CER + TRF = 2104.2±296.3 Kcal/day), shared into four to five meals. Diet was. A registered dietitian assigned a food plan, based on the 3-day 24-hour dietary recall (Table 2). Meal plans were analyzed by software (Diet Smart®). Throughout the 8-week experimental period, subjects from CER + TRF were asked to consume their meals during an 8-hour open window (12 to 20 pm) and drinking water and non-caloric beverages (e.g., tea, coffee) during the fasting period. Eating window protocol was chosen to better align with a social schedule. CER group had their meals without time restrictions. Participants were asked to eat only the foods prescribed in their diet and refrain from alcohol consumption during the study.
Table 2
Diet characteristics
| Baseline (both groups) | CER | CER + TRF | Value p One way ANOVA | |
| Energy (Kcal/d) | 2176.0±425.0a | 1702.6±211.5b | 1674.0±237.4b | < 0,001 |
| Carbohydrate (g/d) | 248.7±59.7a | 195.5±27.4b | 195.0±28.1b | < 0,001 |
| Carbohydrate (%E) | 45.9±7.1a | 46.9±2.0a | 46.7±1.9a | 0,962 |
| Protein (g/d) | 96.5±32.4a | 112.0±15.7a | 118.5±18.1a | 0,056 |
| Protein (g/kg) | 1.16±0.41a | 1.43±0.13a | 1.37±0.23a | 0,053 |
| Protein (%E) | 19.7±4.6a | 26.9±1.7b | 28.3±1.5b | < 0,001 |
| Fat (g/d) | 88.6±28.4a | 50.6±6.8b | 47.5±7.8b | < 0,001 |
| Fat (%E) | 35.1±6.5a | 26.3±1.9b | 25.0±2.1b | < 0,001 |
Means values followed by different letters in the line differ significantly from each other according to Kruskal-Wallis test at 5%significance.
The subjects were evaluated before and after 8 weeks of protocol and were monitored weekly by the researchers to clarify doubts and provide support to follow the protocol.
2.3Training
Participants were asked to maintain their habitual physical activity levels. Everyone trained in the same place, supervised by the single professional bachelor in physical education. During the study, the subjects performed three sessions of the standardized training (20 min. aerobics exercises + resistance training + exercises to balance and proprioception, total =∼1 hour) weekly.
2.4Measurements
Weight and body composition were measured by electrical bioimpedance from In Body 230 multifrequency analyzers, which uses the tetrapolar 8-point tactile electrode method. The subjects were instructed to stand upright and to grasp the handles of the analyzer, thereby providing contact with 8 electrodes, 2 in each hand e foot, and to slightly abduct his or her arms and remain during the assessment. The subjects were asked to follow some procedures before the test: at least 4 hours fast, urinate at least 30 minutes before testing, performed no physical activity 24 hours before testing, refrain alcohol for 48 h before testing, and do not consume diuretic medications for 7 days before the test. In women, a bioimpedance test was done in the non-menstrual period. Height was determined using a stadiometer with a scale in millimeters (precision of 0.1 cm) Sanny®. Waist circumference (WC) was measured using an inelastic tape encircled in the natural waistline.
2.5Blood collection and analysis protocol
The metabolic markers were evaluated before and after the intervention. Blood samples were collected after 12 hours of fasting. We evaluated fasting glucose (oxidase method), fasting insulin (Chemiluminescence method), triglycerides (TG), and total cholesterol (TC) (Enzyme Trinder method). High-density lipoprotein (HDL) is performed by the Selective Detergent Accelerator Method. LDL-C fraction was calculated from Friedewald’s formula: LDL-C = TC –HDL-C –(TG/5). Non-HDL-c was calculated subtracting the high-density lipoprotein (HDL) cholesterol value from a total cholesterol reading. Cortisol was analyzed using the Chemiluminescence method and Leptin immunoassay method. The Clinical Analysis Laboratory Santa Cecília –Lavras M.G., Brazil, performed all analyses.
2.6Statistical analyses
Results are presented as mean±standard deviation (SD). We evaluated the normality through the Shapiro–Wilk’s W test. To test baseline differences of the diet and anthropometric characteristics between groups we used independent samples t-test or Mann-Whitney Rank Sum Test. ANOVA or Kruskal-Wallis on way test plus Tukey or Dunn’s test was used to test baseline differences of the characteristics of the diet. Paired samples two-tailed t-tests or Wilcoxon signed-rank test was used to compare variables before and after the intervention within each group. The two-way repeated-measures ANOVA was performed to assess differences between groups over the course of the study. All differences were considered significant at P < 0.05. The analysis was performed through Sigma Plot software (Vers. 2012) and Prism 5 GraphPad software (Abacus Concepts GraphPad Software, San Diego, USA).
3Results
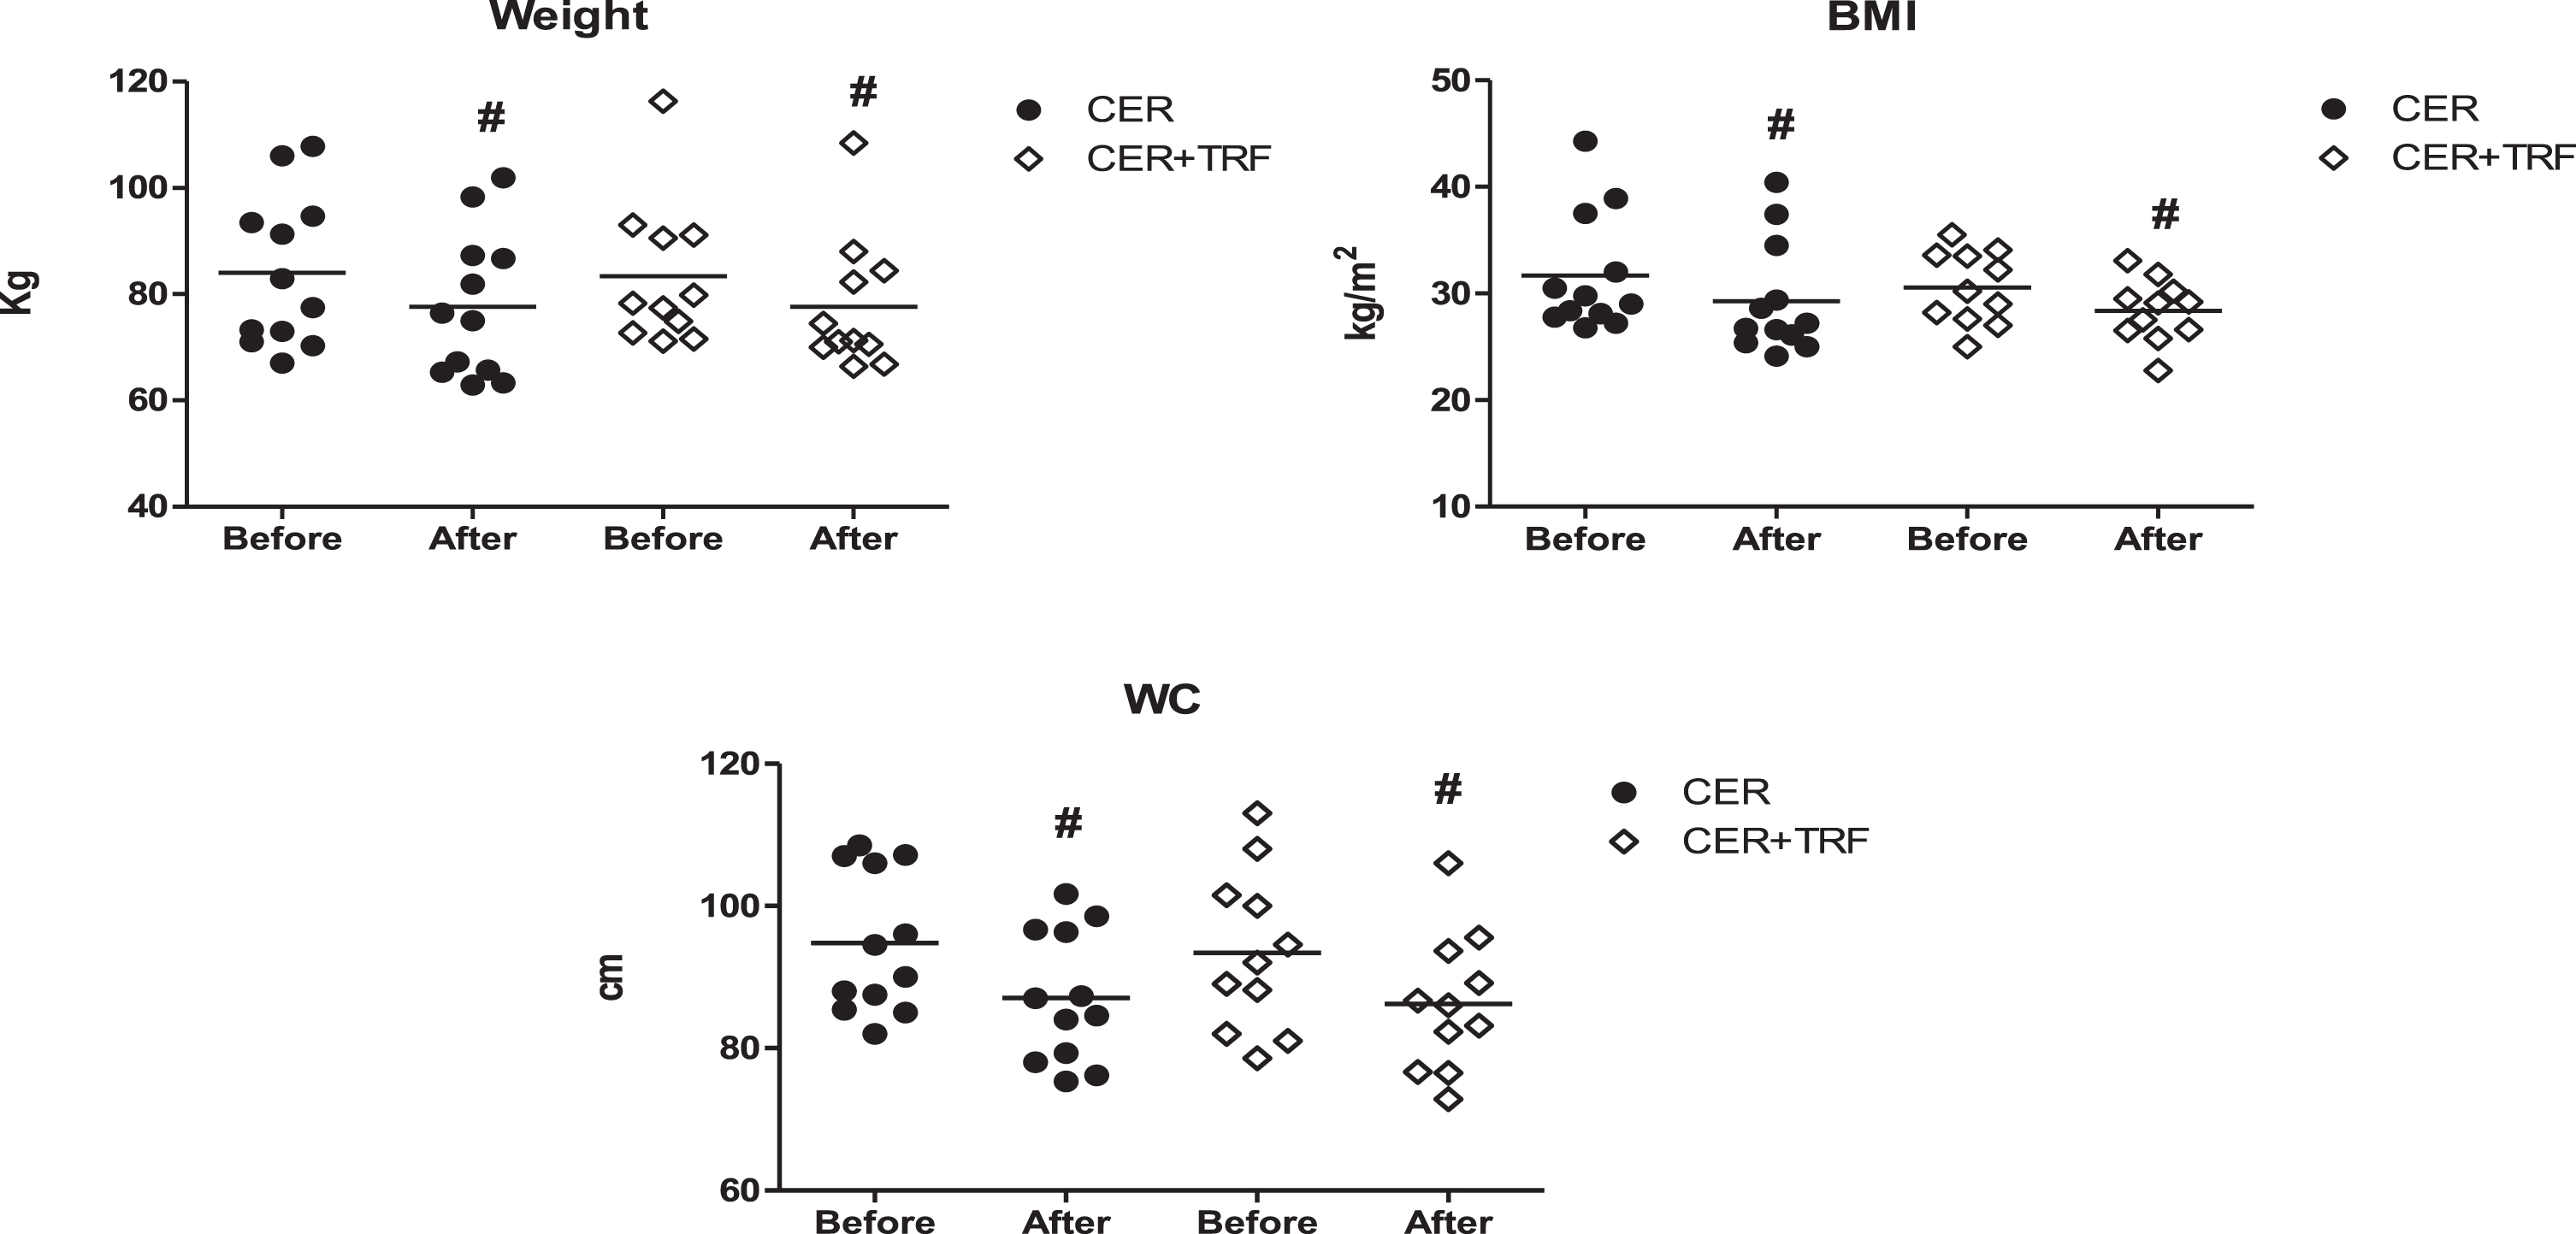
Twenty four excess weight subjects (83.3%women), physically active, aged 32.2±6,4 years, participated in this trial. After 8 weeks of study we observed a significant decrease in BW (CER +TRF 83.3±13.5 kg vs 77.6±12.5kg, Δ= –6.8%; CER 84.0±14.3 kg vs 77.7±13.6 kg, Δ= –7.6%), BMI (CER + TRF 30.5±3.5 kg/m2 vs 28.4±2.9kg/m2, Δ= –6.8%; CER 31.7±5.6 k/m2 vs 29.3±5.3 kg/m2, Δ= –7.6%), and WC (CER + TRF 93.4±11.4 cm vs 86.2±9.7cm, Δ= –7.5%; CER 94.7±9.9 cm vs 87.1±9.2 cm, Δ= –8.1%) in both groups. However, no significant difference was seen between groups (Fig. 2). All dates are presented as Mean±SD.
Fig. 2
Effects of CER + TRF and CER on BW, BMI, and WC. Results are presented as Mean±SD. CER + TRF with 8-hour eating window; CER: continuous energy restriction; BMI: body mass index; WC: waist circumference. (#) represents the difference within groups (p < 0.001).
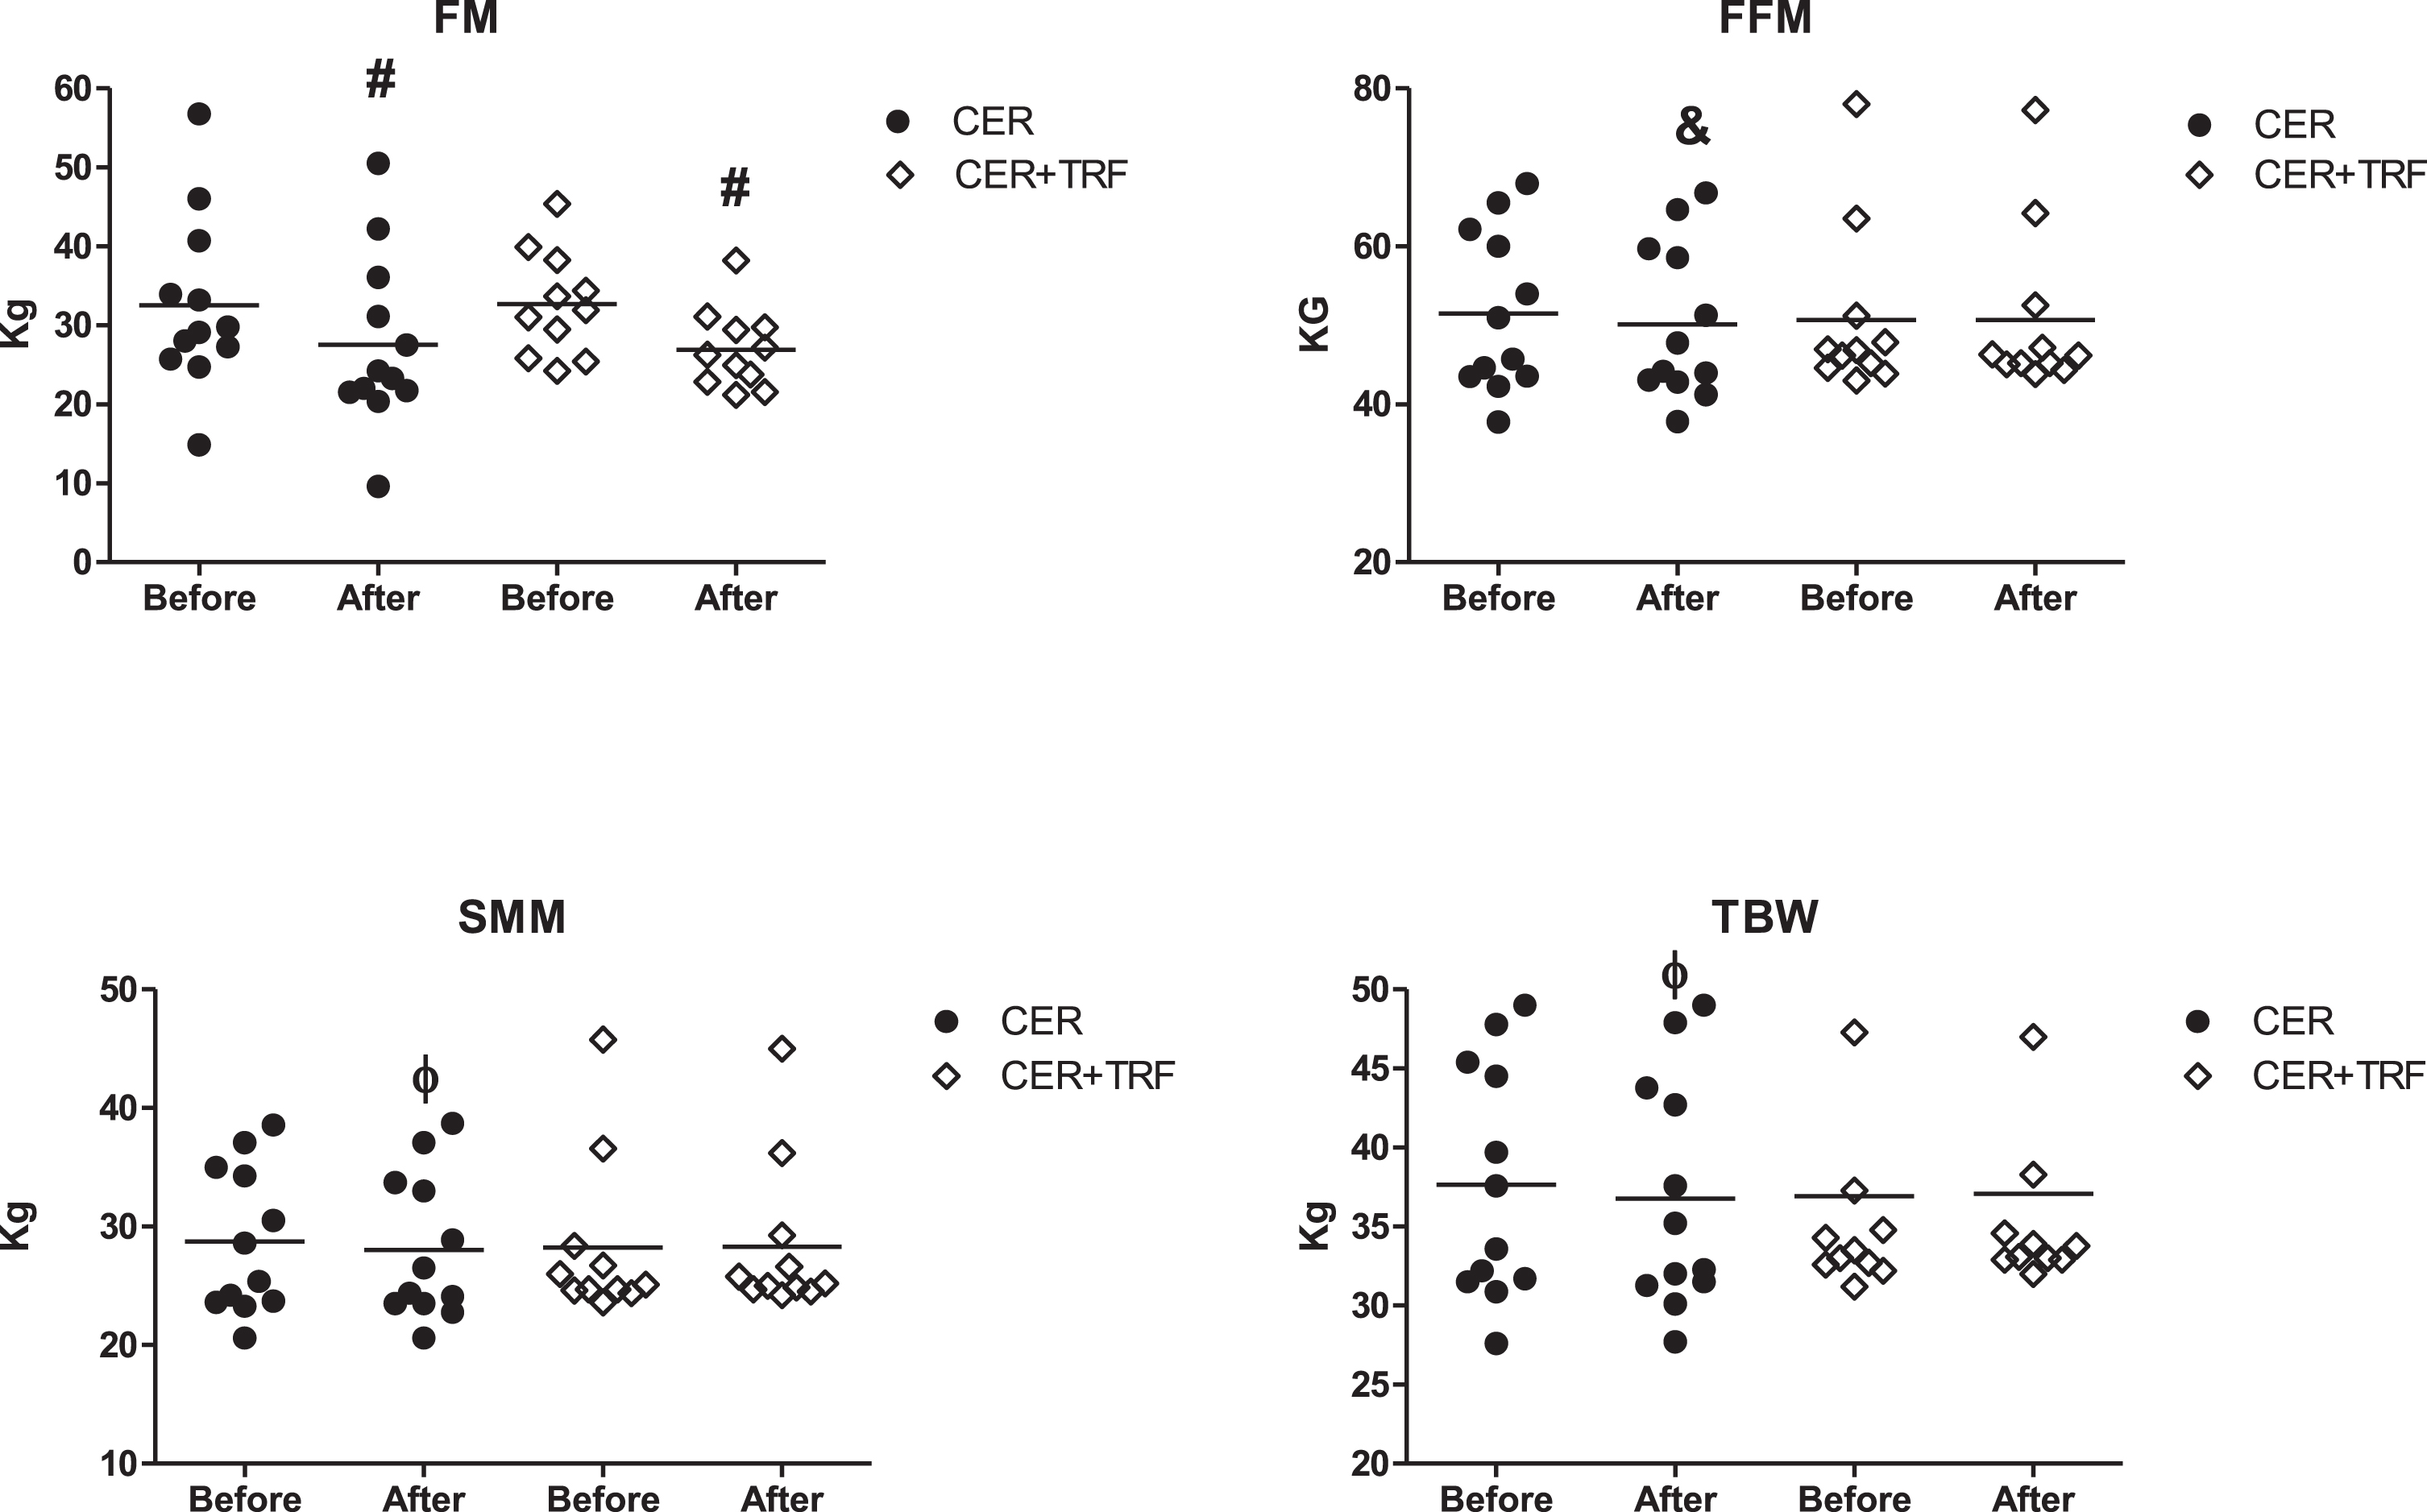
Regarding body composition, both groups showed reduction in FM (CER + TRF 32.7±6.6 kg vs 26.9±5.0 kg, Δ= –17.0%and CER 32.6±11.0 kg vs 27.6±11.0 kg, Δ= –17.1%), however, no difference was seen between CER+16/8TRF versus CER group. When we looked at FFM, total body water (TBW) and SMM a decrease was observed only in the CER group [(FFM: CER 51.5±10.2 kg vs 50.1±9.8kg, Δ= –2.6%, CER + TRF = 50.7±10.7kg vs 50.7±10.6 kg Δ= 0.0%); TWB: CER 37.6±2.1 kg vs 36.8±2.1 kg Δ= –2.2%, CER +TRF = 36.9±8.1 kg vs 37.1±7.7 kg Δ= +0.6%); (SSM: CER:28.7±1.8 kg vs 28.1±1.8 kg, Δ=–2.3%, CER + TRF = 28.2±6.9 kg vs 28.3±6.5 kg, Δ= +0.5%)] (Fig. 3). Changes in FFM, TBW and SMM were greater in CER group when compared to CER + TRF (p = 0.015; p = 0.027; p = 0.044, respectively).
Fig. 3
Effects of CER + TRF, and CER on body composition. CER + TRF with 8-hour food window; CER: continuous energy restriction; FM: fat mass; FFM: fat free mass; TBW: total body water; SMM: skeletal muscle mass. (#,&,Φ) represents the significant difference within groups, #p < 0.001, &,Φp < 0.05.
The metabolic markers evaluated before and after the interventions are shown in Table 3. We observed a significant reduction in TG only in the CER + TRF group. Although glycemia did not change, we observed a decrease in fasting insulin and HOMA-IR in both groups. Leptin decrease in both treatments after 8 weeks. Cortisol levels increased only in the CER group.
Table 3
Effects of CER and CER + TRF on metabolic markers before and after protocol
| CER | Δ | CER + TRF | Δ | 2 way | |||
| Before | After | CER | Before | After | CER + TRF | ANOVA Time*Diet | |
| TC (mg/dl) | 167.8±52.2 | 160.4±31.5 | 0,546 | 193.5±33.0 | 170.9±42.1 | 0.029 | 0,349 |
| LDL-c (mg/dl) | 98.9±46.6 | 95.7±25.3 | 0,762 | 114.6±24.8 | 103.2±35.2 | 0,204 | 0,568 |
| HDL-c (mg/dl) | 45.8±7.1 | 44.7±7.9 | 0,515 | 52.04±13.4 | 49.05±11.6 | 0,285 | 0,549 |
| N-HDL-c (mg/dl) | 122.0±53.9 | 115.7±26.1 | 0.365 | 141.1±30.3 | 123.4±38.4 | 0.052 | 0.454 |
| TG (mg/dl) | 130.2±81.0 | 109.9±59.6 | 0,210 | 160.8±118.3 | 87.7±46.3 | 0.004 | 0.081 |
| Glucose (mg/dl) | 89.7±10.0 | 91.5±9.5 | 0,308 | 93.7±6.0 | 90.6±7.1 | 0,432 | 0,115 |
| Insulin (mg/dl) | 11.6±8.5 | 8.4±4.9 | 0,014 | 10.9±4.5 | 8.1±3.3 | 0.036 | 0,823 |
| Cortisol (ng/dl) | 12.6±5.8 | 15.4±7.8 | 0,054 | 10.3±5.8 | 10.5±5.6 | 0,879 | 0,164 |
| Leptin (ng/dl) | 31.2±28.7 | 16.9±15.7 | 0,002 | 40.8±24.3 | 20.5±18.8 | 0.015 | 0,426 |
| HOMA –IR | 2.6±2.1 | 1.9±1.3 | 0,024 | 2.5±1.0 | 1.8±0.8 | 0.046 | 0,986 |
Results are presented as mean±SD. TC: Total cholesterol, LDL: Low-Density Lipoprotein, HDL: High-Density Lipoprotein, N-HDL: Non High-Density Lipoprotein, TG: Triglycerides.
4Discussion
Intermittent Fasting (IF) has gained considerable scientific and popular repercussions, being considered as a strategy along to CER. Positive effects of IF have been described on parameters such as glucose and lipids metabolism, oxidative stress, inflammation, cardiovascular diseases, visceral and total body fat mass [4–6, 8, 9, 11–13, 22, 23]. The present work aimed to compare the effects of CER + TRF versus CER, on body composition and metabolic parameters, in overweight/obese individuals working out in moderate intensity. For that, all subjects were submitted to a 20%caloric restriction diet, according to their daily energetic spending, with similar macronutrients distribution (Table 1). According to our results, CER + TRF was as efficient as CER in reducing BW, FM, BMI, and WC, however, CER + TRF seemed to be more efficient for FFM and SMM preservation. In this way, CER + TRF can be considered as an alternative strategy to CER to promote weight loss while preserving muscle mass (15). In the present study, all participants consumed individualized diets considering their eating habits, which is more applicable in everyday life.
Similar to our results works done by others also observed a reduction in body weight, BMI, and WC [8, 10, 17–20, 24–27]. The reduction in weight (–6.8%), BMI (–6.8%), WC (–7.5%), and especially in FM (–17%) observed in the present study were more expressive compared to other studies that involved TRF without energy restriction [8, 17, 18, 20, 27–30] or TRF with energy restriction (19). Furthermore, 8-week 16/8TRF protocol effects on body weight, BMI, WC, and FM were not different from those observed in the CER group. These results are in agreement with Stratton et al. (19) which demonstrated that, when daily caloric intake is the same, alterations in meal frequency do not play a role in the reductions of body weight and FM. Thus, it seems that caloric balance would be the most important factor for changes in body composition, despite restricting daily eating hours.
Our results showed that CER + TRF was more efficient in preserving FFM and SMM than CER alone. Many studies have also shown that intermittent fasting protocols do not harm but better preserve FFM [10, 17, 19, 20, 28, 31]. Two factors that may contribute to FFM maintenance during energy restriction are physical exercise and increased protein intake [32]. In our study, both groups performed similar physical exercise, including resistance training, and had increased protein intake. In part, FFM loss, observed in the CER group, can be attributed to the reduction of body water (CER group: FFM = –1.4 kg and TBW = –0.8 kg). Also, increased cortisol levels, observed in the CER group could favor FFM loss. Another factor is the possible increase in m-Tor, which triggers protein synthesis and regulates cell growth. Some studies showed TRF increased expression and activity of mTOR, at least in the first hours after the food window [33, 34].
Improvement in body composition was found in both groups, CER + TRF and CER, and may have been influenced by other factors besides caloric restriction such as individualized diet prescription, regarding individual eating habits and support throughout the study (monitoring weekly diet +training follow-up in all sessions). Both factors contribute to treatment adherence, which is a relevant issue for successful weight loss and improvement in body composition [35, 36].
Evidence shows that weight loss leads to improvement in metabolic markers [17, 37]. In general, several protocols of IF provide little or no advantage on plasma lipids compared to CER [30]. However, in the present study significant reduction in total triglycerides (TG) was observed only in the CER + TRF group. The magnitude of changes in plasma lipids is influenced by individual metabolic status; those with higher plasma lipid levels tend to have a better outcome in this parameter [27]. In our work, initial levels of TC and TG were higher in the CER + TRF group, although not differing from the CER group. When a single outlier was removed (TG before = 451 mg/dL), intragroup statistical significance was maintained (p = 0,005), but diet effect was absent (p = 0,148). Varady et al. [10] observed a reduction in TG only in IF fasting when compared to CER counterparts. Studies by McAllister et al. [20], Gabel et al. [17], and Kesztyus et al. [18], showed no changes in TC, TG, and LDL-c in ad libitum 16:8 TRF. However, Mcallister et al. [20] observed an increase in HDL-c, in both groups. A meta-analysis done by Moon et al. [27], evaluating beneficial effects of TRF on metabolic diseases, observed that nine studies reported a significant reduction in TG levels. On the other hand, ten studies reported no significant changes in TG, LDL-c, and HDL-c levels.
Although glycemia did not change, we observed a significant decrease in fasting insulin and HOMA-IR in both groups. However, no difference was observed between 16/8 TRF and CER in these parameters. In Moon et al. [27] meta-analysis fasting glucose reduction was significant only in studies that included subjects with a metabolic abnormality. Pellegrini et al. [38] found that TRF protocol promoted significant improvement in fasting glucose, but no positive changes in insulin and HOMA-IR. Studies with 16/8 TRF without energy restriction did not observe improvements in glycemia, insulinemia, and HOMA index compared to the control group [8, 17, 20]. In the Pureza et al. [39] study, participants were randomized into two groups: hypoenergetic diet with or without 12/12 TRF. TRF protocol did not improve fasting glucose, fasting insulin, and HOMA-IR over caloric restriction.
We also observed a decrease in leptin levels, in both groups, after 8 weeks. However, no difference was found between groups. Similar to our study, Stratton et al. [19] reported a decrease in leptin levels after 4-week TRF + CER (25%caloric restriction) or CER only, without difference between groups. Conversely, Pureza et al. [39] did not observe a difference in leptin levels after 21 days of hypoenergetic diet plus TRF or hypoenergetic diet alone. Besides, Sutton et al. [40] did not report significant changes in leptin levels after five weeks with early TRF. We believe that the reduction in leptin levels was due to short-term caloric restriction plus middle-term weight/fat loss [41].
A rise in cortisol levels during caloric restriction periods has been reported [42]. However, in our study cortisol levels increased in CER protocol and no difference was observed between groups. Our results are in agreement with others that showed no changes in plasma cortisol levels [8, 20, 31]. Stratton et al. [19] observed an increase in cortisol levels after 4-week CER, but the same was not seen in the TRF group. Restricted eating time may improve desynchronization between peripheral and central clocks that enhance biomarkers such as cortisol [27, 43].
In studies using IF protocols such as ADF and 2DW (5:2 diet), the timing of blood measurements relative to the fasting periods (after fed or fast day) may have affected the results. In the present study, this problem did not occur because food intake and fasting time were the same every day.
There are great differences in individual responses to a wide range of overweight treatments. Certainly, CER + TRF may not be the best treatment for weight loss to all individuals, but some people may have great results with this protocol. In our work, in the CER + TRF group two subjects with similar start data had different end results (subject 1: height = 1.56 m, BM = 78.3 kg, GC = 43%and subject 2: height = 1.60 m, BM = 77.4 kg, GC = 44.4%- ΔBW1 = –9.3%, ΔBW2 = –3.7%). We believe that is necessary to search for new strategies to fight obesity. According to our work, CER + TRF or CER protocols are viable ways to promote weight loss.
Some limitations can be pointed out in the present work. First, the sample was small and non-balanced for sex. To minimize the effect of sex, two men were allocated in each group. Second, instruments were not adopted to assess the degree of adherence of the participants as a self-reported questionnaire or APP. However, efforts were made to ensure full adherence to the diet. A researcher (nutritionist) personally met with each individual at least once a week and participants were asked about any difficulty in carrying out the diet. Then, adjustments were made considering the difficulties of each subject. Third, we did not use DEXA for analyzing body composition. However, several procedures have been performed to improve body composition assessment, as described in the methods. At last, the short follow-up period (eight weeks), correspond only to the initial stage of weight loss in overweight and obese subjects. Therefore, is necessary to conduct longer studies with TRF + CER to accesses its long-term efficiency.
In conclusion, our results suggest that the TRF + CER protocol is as efficient as CER in improving BW, FM, and WC. However, TRF + CER seems to be more effective in FFM and SSM maintenance. Also, excepting TG, CER + TRF has the same effect on the evaluated metabolic markers as CER. Thus, CER + TRF and CER are both strategies to promote weight loss and improve health parameters in physically active adults and may be adopted to fight obesity.
Acknowledgments
We are grateful to the volunteers for their efforts to comply with all the procedures proposed in this study.
Funding
This study was supported by the Graduate Program in Nutrition and Health at the Federal University of Lavras-MG.
Conflict of interest
The authors have no conflict of interest to report.
References
[1] | Pantalone KM , Hobbs TM , Chagin KM , Kong SX , Wells BJ , Kattan MW , et al. Prevalence and recognition of obesity and its associated comorbidities: Cross-sectional analysis of electronic health record data from a large US integrated health system. BMJ Open. (2017) ;(11). |
[2] | Reaven G , Abbasi F , McLaughlin T . Obesity, insulin resistance, and cardiovascular disease. Recent Prog Horm Res. (2004) ;59: (Cvd):207–23. |
[3] | Stefan N , Birkenfeld AL , Schulze MB , Ludwig DS . Obesity and impaired metabolic health in patients with COVID-19. Nat Rev Endocrinol [Internet]. (2020) ;16: (7):341–2. Available from: http://dx.doi.org/10.1038/s41574-020-0364-6 |
[4] | Potter GDM , Cade JE , Grant PJ , Hardie LJ . Nutrition and the Circadian System Europe PMC Funders Group. Br J Nutr [Internet]. (2016) ;116: (3):434–42. Available from: https://www.ncbi.nlm.nih.gov/pmc/articles/PMC4930144/pdf/emss-68608.pdf |
[5] | Antoni R , Johnston KL , Collins AL , Robertson MD . Effects of intermittent fasting on glucose and lipid metabolism. Proc Nutr Soc. (2017) ;76: (3):361–8. |
[6] | Trepanowski JF , Bloomer RJ . The impact of religious fasting on human health. Nutr J. (2010) ;9: (1):1–9. |
[7] | Tinsley GM , La Bounty PM . Effects of intermittent fasting on body composition and clinical health markers in humans. Nutr Rev. (2015) ;73: (10):661–74. |
[8] | Moro T , Tinsley G , Bianco A , Marcolin G , Pacelli QF , Battaglia G , et al. Effects of eight weeks of time-restricted feeding (16/8) on basal metabolism, maximal strength, body composition, inflammation, and cardiovascular risk factors in resistance-trained males. J Transl Med. (2016) ;14: (1):1–10. |
[9] | Stote KS , Baer DJ , Spears K , Paul DR , Harris GK , Rumpler W V , et al. A controlled trial of reduced meal frequency without caloric restriction in healthy, normal-weight, middle-aged adults [10]. Am J Clin Nutr [Internet]. (2007) ;85: (4):981–8. Available from: https://www.ncbi.nlm.nih.gov/pmc/articles/PMC2645638/ |
[10] | Varady KA , Bhutani S , Klempel MC , Kroeger CM . Comparison of effects of diet versus exercise weight loss regimens on LDL and HDL particle size in obese adults. Lipids Health Dis [Internet]. (2011) ;10: (1):119. Available from: http://www.lipidworld.com/content/10/1/119 |
[11] | Klempel MC , Kroeger CM , Bhutani S , Trepanowski JF , Varady KA . Intermittent fasting combined with calorie restriction is effective for weight loss and cardio-protection in obese women. Nutr J. (2012) ;11: (1):1–9. |
[12] | Faris MAIE , Kacimi S , Al-Kurd RA , Fararjeh MA , Bustanji YK , Mohammad MK , et al. Intermittent fasting during Ramadan attenuates proinflammatory cytokines and immune cells in healthy subjects. Nutr Res [Internet]. (2012) ;32: (12):947–55. Available from: http://dx.doi.org/10.1016/j.nutres.2012.06.021 |
[13] | Longo VD , Mattson MP . Fasting: Molecular mechanisms and clinical applications. Cell Metab [Internet]. (2014) ;19: (2):181–92. Available from: http://dx.doi.org/10.1016/j.cmet.2013.12.008 |
[14] | Michael Anson R , Guo Z , de Cabo R , Iyun T , Rios M , Hagepanos A , et al. Intermittent fasting dissociates beneficial effects of dietary restriction on glucose metabolism and neuronal resistance to injury from calorie intake. Proc Natl Acad Sci U S A. (2003) ;100: (10):6216–20. |
[15] | Bhutani S , Klempel MC , Kroeger CM , Trepanowski JF , Varady KA . Alternate day fasting and endurance exercise combine to reduce body weight and favorably alter plasma lipids in obese humans. Obesity. (2013) ;21: (7):1370–9. |
[16] | Rothschild J , Hoddy KK , Jambazian P , Varady KA . Time-restricted feeding and risk of metabolic disease: A review of human and animal studies. Nutr Rev. (2014) ;72: (5):308–18. |
[17] | Gabel K , Hoddy KK , Haggerty N , Song J , Kroeger CM , Trepanowski JF , et al. Effects of 8-hour time restricted feeding on body weight and metabolic disease risk factors in obese adults: A pilot study. Nutr Heal Aging. (2018) ;4: (4):345–53. |
[18] | Kesztyüs D , Cermak P , Gulich M , Kesztyüs T . Adherence to time-restricted feeding and impact on abdominal obesity in primary care patients: Results of a pilot study in a pre-post design. Nutrients. (2018) ;11: (12). |
[19] | Stratton MT , Tinsley GM , Alesi MG , Hester GM , Olmos AA , Serafini PR , et al. Four weeks of time-restricted feeding combined with resistance training does not differentially influence measures of body composition, muscle performance, resting energy expenditure, and blood biomarkers. Nutrients. (2020) ;12: (4). |
[20] | McAllister MJ , Pigg BL , Renteria LI , Waldman HS . Time-restricted feeding improves markers of cardiometabolic health in physically active college-age men: a 4-week randomized pre-post pilot study. Nutr Res [Internet]. (2020) ;75: :32–43. Available from: https://doi.org/10.1016/j.nutres.2019.12.001 |
[21] | Gabel K , Hoddy KK , Varady KA . Safety of 8-h time-restricted feeding in adults with obesity. Appl Physiol Nutr Metab. (2019) ;44: (1):107–9. |
[22] | Tinsley GM , Butler NK , Forsse JS , Bane AA , Morgan GB , Hwang PS , et al. Intermittent fasting combined with resistance training: effects on body composition, muscular performance, and dietary intake. J Int Soc Sports Nutr [Internet]. (2015) ;12: (S1):P38. Available from: http://www.jissn.com/content/12/S1/P38 |
[23] | Melkani GC , Panda S . Time-restricted feeding for prevention and treatment of cardiometabolic disorders. J Physiol. (2017) ;595: (12):3691–700. |
[24] | Varady KA , Bhutani S , Klempel MC , Kroeger CM , Trepanowski JF , Haus JM , et al. Alternate day fasting for weight loss in normal weight and overweight subjects: A randomized controlled trial. Nutr J. (2013) ;12: (1):1–8. |
[25] | Klempel MC , Kroeger CM , Varady KA . Alternate day fasting (ADF) with a high-fat diet produces similar weight loss and cardio-protection as ADF with a low-fat diet. Metabolism. (2013) ;62: (1):137143. |
[26] | Hoddy KK , Gibbons C , Kroeger CM , Trepanowski JF , Barnosky A , Bhutani S , et al. Changes in hunger and fullness in relation to gut peptides before and after 8 weeks of alternate day fasting. Clin Nutr [Internet]. (1380) ;35: (6):5. Available from: http://www.sciencedirect.com/science/article/pii/S0261561416001023 |
[27] | Moon S , Kang J , Kim SH , Chung HS , Kim YJ , Yu JM , et al.Beneficial Effects of Time-Restricted Eating on Metabolic Diseases: A Systemic Review. Nutrients. (2020) ;12: (5):1267. |
[28] | Seimon R V , Roekenes JA , Zibellini SH , Chung J , Zhu B , Gibson AA , Hills AP , et al. Do intermittent diets provide physiological benefits over continuous diets for weight loss? A systematic review of clinical trials. Mol Cell Endocrinol [Internet]. (2015) ;418: :153–72. Available from: http://dx.doi.org/10.1016/j.mce.2015.09.014 |
[29] | Harris L , Hamilton S , Azevedo LB , Olajide J , De Brún C , Waller G , et al. Intermittent fasting interventions for treatment of overweight and obesity in adults: a systematic review and meta-analysis. JBI Database Syst Rev Implement reports. (2018) ;16: (2):507–47. |
[30] | Rynders CA , Thomas EA , Zaman A , Pan Z , Catenacci VA , Melanson EL . Effectiveness of intermittent fasting and time-restricted feeding compared to continuous energy restriction for weight loss. Nutrients. (2019) ;11: (10):1–23. |
[31] | Tinsley GM , Moore ML , Graybeal AJ , Paoli A , Kim Y , Gonzales JU , et al. Time-restricted feeding plus resistance training in active females: A randomized trial. Am J Clin Nutr. (2019) ;110: (3):628–40. |
[32] | Jäger R , Kerksick CM , Campbell BI , Cribb PJ , Wells SD , Skwiat TM , et al. International Society of Sports Nutrition Position Stand: Protein and exercise. J Int Soc Sports Nutr. (2017) ;14: (1):1–25. |
[33] | Jamshed H , Beyl RA , Manna Della DL , Yang ES , Ravussin E , Peterson CM . Early Time-Restricted Feeding Improves 24-Hour. Nutrients. 2019;3-5. |
[34] | Regmi P , Heilbronn LK . Time-Restricted Eating: Benefits, Mechanisms, and Challenges in Translation. iScience [Internet]. (1011) ;23: (6):101161. Available from: https://doi.org/10.1016/j.isci.2020.101161 |
[35] | Dansinger ML , Gleason JA , Griffith JL , Selker HP , Ernst J . Schaefer. Comparison of diets for weight loss and heart disease risk reduction. JAMA. (2005) ;293: (13):43–53. |
[36] | Del Corral P , Chandler-Laney PC , Casazza K , Gower BA , Hunter GR . Effect of dietary adherence with or without exercise on weight loss: A mechanistic approach to a global problem. J Clin Endocrinol Metab. (2009) ;94: (5):1602–7. |
[37] | Magkos F , Fraterrigo G , Yoshino J , Luecking C , Kirbach K , Kelly SC , et al. Effects of Moderate and Subsequent Progressive Weight Loss on Metabolic Function and Adipose Tissue Biology in Humans with Obesity. Cell Metab [Internet]. (2016) ;23: (4):591–601. Available from: http://dx.doi.org/10.1016/j.cmet.2016.02.005 |
[38] | Pellegrini M , Cioffi I , Evangelista A , Ponzo V , Goitre I , Ciccone G , et al.Effects of time-restricted feeding on body weight and metabolism. A systematic review and meta-analysis. Rev Endocr Metab Disord. (2020) ;21: (1):17–33. |
[39] | Pureza IROM , Melo ISV , Macena ML , Praxedes DRS , Vasconcelos LGL , Silva-Júnior AE , et al. Acute effects of time-restricted feeding in low-income women with obesity placed on hypoenergetic diets: Randomized trial. Nutrition. 2020;77. |
[40] | Sutton EF , Beyl R , Early KS , Cefalu WT , Ravussin E , Peterson CM . Early Time-Restricted Feeding Improves Insulin Sensitivity, Blood Pressure, and Oxidative Stress Even without Weight Loss in Men with Prediabetes. Cell Metab [Internet]. (1221) ;27: (6):1212–1221.e3. Available from: https://doi.org/10.1016/j.cmet.2018.04.010 |
[41] | Wadden TA , Considine RV , Foster GD , Anderson DA , Sarwer DB , Caro JS . Short- and long-term changes in serum leptin in dieting obese women: Effects of caloric restriction and weight loss. J Clin Endocrinol Metab. (1998) ;83: (1):214–8. |
[42] | Tomiyama AJ , Mann T , Vinas D , Hunger JM , Dejager J , Taylor SE . Low calorie dieting increases cortisol. Psychosom Med. (2010) ;72: (4):357–64. |
[43] | Wilkinson MJ , Monoogian NCE , Zadourian A , Lo H , Fakhouri S , Shoghi A , et al. Ten-Hour Time-Restricted Eating Reduces Weight, Blood Pressure, and Atherogenic Lipids in Patients with Metabolic Syndrome. Cell Metab. . (2020) ;31: (1):92–104. |

