
Effect of supplementing meals with soluble milk proteins on plasma leucine levels in healthy older people: A randomized pilot study
Abstract
Background:
The muscle protein synthetic response to food intake is reduced in aging, contributing to a progressive muscle loss. This anabolic resistance results from a decreased sensitivity to anabolic signals, especially leucinemia, a potent activator of protein synthesis. Nutritional strategies are needed to reach the anabolic threshold of leucinemia and stimulate muscle anabolism.
Objectives:
This study sought to evaluate the effect of supplementing meals with soluble milk proteins (SMP) on postprandial leucinemia in elders.
Methods:
During 3 successive experimental sessions, 6 healthy older men (66.7 ± 0.7y) consumed a standardized lunch (27 g of proteins; 2.2 g of leucine) supplemented with a beverage containing 0 g, 5 g or 8.2 g of SMP (0 g, 0.6 g and 1.1 g of leucine, respectively).
Results:
The supplementation with 5 g or 8.2 g of SMP induced an increase of 1.9× and 2.5× in plasma leucine levels, compared to the control meal (without additional SMP). The leucine area under the curve over 3h20 had an increase of 2.1× and 2.3×, respectively, as compared to the control meal.
Conclusions:
Ingesting SMP in addition to a meal strongly increased postprandial plasma leucine, and could be an effective strategy to reach anabolic thresholds and optimize the anabolic effect of each meal.
1Introduction
Preservation of muscle mass is regulated by the balance between protein synthesis and protein degradation. The postprandial period promotes protein anabolism and inhibits protein degradation (via the insulin pathway), whereas the postabsorptive period results in protein catabolism. However, during aging, there is a progressive decline in skeletal muscle mass, which results in sarcopenia. This loss of muscle mass is due to a reduced muscle protein synthetic response to the anabolic stimuli of the meal (termed “anabolic resistance”) and to a decrease in physical activity.
Dietary proteins exert an anabolic action that can be modulated by the quantity of amino acid they provide. As the most potent branched-chain amino acid, leucine acts as a substrate for protein synthesis and signals the activation of synthesis via the mTOR pathway [1]. The origin of anabolic resistance remains unknown but has been largely reported in the literature. Studies indicate that older people show a lack of responsiveness in muscle protein synthesis to amino acid/glucose stimulus [2]. Similarly, while the oral administration of essential amino acids stimulated protein synthesis in young adults, the same oral administration failed to improve protein synthesis in elderly adults [3, 4]. The “anabolic threshold” of plasma amino acid levels, in particular leucinemia, required to stimulate muscle anabolism increases significantly with age [5]. Moreover, a greater retention of ingested amino acids occurs within the splanchnic area of older men than younger men [6, 7], resulting in reduced amino-acid bioavailability for the muscle.
Consequently, several nutritional strategies have been considered to increase amino acid availability to skeletal muscle. These strategies include increasing protein intake, diet supplementation with one or several free amino acids, or using different quality proteins based on their amino-acid composition and/or rate of digestion. Soluble milk proteins and whey are leucine-rich fast proteins, that are rapidly digested and absorbed and induce a rapid, high elevation of plasma leucine. They stimulate muscle protein synthesis at a higher rate than caseins in older men [8, 9], resulting in higher postprandial protein gain [10].
In light of the anabolic resistance that occurs during aging, muscle anabolism may be reduced with the usual nutrient intake in elderly persons, particularly if the meal-induced postprandial elevation of leucinemia does not reach the muscle’s anabolic threshold. Therefore, the objective of this preliminary study was to evaluate the effects of supplementing a standardized lunch with moderate amounts of soluble milk proteins on postprandial plasma leucine levels in elderly people.
2Methods
2.1Participants
Seven healthy older men were screened, and 6 were enrolled in the study. All participants were aged 66 to 69 years old with a BMI between 25.7 and 26.9 kg/m2. Each participant had a normal blood biochemistry profile with the following values: cholesterol ≤3 g/L, triglycerides ≤3 g/L, fasting glucose ≤1.10 g/L, creatinine between 59 and 104 μmol/L and glomerular filtration rate >60 mL/min/1.73m2 (Table 1). Men were excluded from participation if they had renal failure, diabetes, cardiovascular disease, currently evolving disease (e.g. cancer, neurodegenerative disease), symptoms of malabsorption or chronic diarrhea. Additionally, participants with known hypersensitivity or allergy to any constituents of the study products (milk protein or lactose) were also excluded.
All participants gave their written consent after being presented with the purposes, methodology and potential risks of the study. The study was conducted in accordance with the Helsinki Declaration without any major deviation from the protocol approved by the ethics committee (Northwest IV Committee, France, number: 03/050/2013, 3 December 2013). This study was registered at the French agency for the safety of health products (ANSM number: 2013-A01066-39).
2.2Experimental protocol
This study was randomized, controlled and conducted in a double-blind format in a single center to compare 3 different amounts of soluble milk proteins incorporated into drinkable dairy products. Before the start of the study, dieticians provided each participant with specific dietary advice to standardize their diets 48 h before the experimental visits.
The 3 different drinks were administered orally to the participants during 3 successive experimental sessions with at least one washout week between them (Fig. 1). The order of consumption of the 3 drinks was determined in accordance with a computer-generated randomization list. Each session occurred between 8:00 am and 4:00 pm. During these 3 experimental visits, the participants arrived at the clinical site after a 10-hour fast and underwent a clinical examination and medical enquiry. All participants then received a standardized breakfast with sweet tea or coffee, 20 cL orange juice, 180 g drinking yoghourt and 4 breakfast biscuits (providing 368 kcal with 7.4% of energy from proteins, 67.5% of energy from carbohydrates and 24.2% of energy from fat). Two hours later, 100 mL of water was served. Breakfast and water were fully consumed by each participant.
Approximately 4 hours after breakfast and just before lunch, a venous catheter was placed on the arm of each participant by a nurse, and a blood sample was taken immediately after installation (first sample named T0’). Then, participants were given a standardized meal with a starter, main course, cheese and dessert (providing 793.9 kcal with 12.6% of energy from proteins (= 25.1 g), 48.6% of energy from carbohydrates (= 96.5 g) and 37% of energy from fat (= 32.6 g)). The starter was composed of 130 g of diced mixed vegetables (green peas, green beans, flageolet beans, carrots and turnips) and 10 g mayonnaise. The main course was composed of 350 g Lasagna Bolognese. Cheese (2 portions of 17.5 g of processed cheese) was served with 4 crispbreads, and dessert was composed of 135 g fruit salad in syrup. The maximum time for meal consumption was 20 minutes. The second sample (T0) was performed 20 minutes after the collection of T0’, regardless of the time taken by participants to eat the meal. According to randomization, participants then consumed 100 mL of a drink containing either 8.2 g of Prolacta ® (PRO8), 5 g of Prolacta ® (PRO5) or 0 g of Prolacta ® over a maximum of 2 minutes (Table 2). The consumption of the standardized lunch in addition to the control drink was considered the control meal, providing 27 g of proteins and 2.2 g of leucine. Each meal’s protein and leucine levels were estimated using the table provided by the United States Department of Agriculture (reported in 2007 by the French Agence nationale de sécurité sanitaire de l’alimentation, de l’environnement et du travail). Blood collection was performed at T30 min, T60 min, T90 min, T120 min and T180 min (30, 60, 90, 120 and 180 minutes after T0). After the last collection, the nurse removed the catheter. The study coordinator checked the participants’ compliance during the sessions (appropriate meal intake and sampling time).
2.3Study products
The 3 study products (PRO8, PRO5 and Control) were 100 mL drinkable dairy products containing 8.2 g, 5 g or 0 g of soluble milk proteins Prolacta ®(Lactalis Ingredients, Bourgbarré, France). Prolacta ® is a specific ingredient (90% soluble milk-protein isolate) produced directly from pasteurized milk by a two-step cold-membrane process. The soluble milk proteins extracted by this specific and innovative process are native proteins rich in leucine with up to 13% total protein content. Prolacta ® is a fast-acting, leucine-rich protein [8] with a better amino-acid composition than whey [12]. Besides the 2.2 g of leucine provided by the control meal, the supplementation with 8.2 g or 5 g of Prolacta provided 1.1 g and 0.6 g of additional leucine, respectively (Table 2).
2.4Technical analysis
2.4.1Leucine levels
Leucine levels were determined from 1 mL of plasma heparin by high-performance liquid chromatography (HPLC), using the internal procedures of the laboratory (Biomnis, Lyon, France).
2.4.2Glucose and insulin levels
Participants’ blood samples were collected into sodium fluoride and potassium oxalate for glucose determination and into serum-separating tubes (SST) for insulin levels. Blood glucose levels were assessed by an enzymatic UV test (hexokinase method) (AU480; Beckman Coulter, Brea, CA, United States of America) with commercially available glucose reagents (OSR6121; Beckman Coulter, France) by the medical biology laboratory of the Institut Pasteur de Lille. The blood-insulin level was assessed by immunoradiometric assay (Cisbio Bioassays, Codolet, France) by the Lille Regional University Hospital Center.
2.5Statistical analysis
Values are expressed as means ± standard deviation. For all statistical tests, normality was validated by the Shapiro-Wilk test with an α risk of 1% . Additionally, the homogeneity of variances between the 3 solutions under consideration was verified with a Bartlett test.
All statistical tests were performed by Soladis (Lyon, France) with a mixed model to examine one factor (treatment) with repeated data. To account for the correlation between treatments, the unstructured (UN) variance-covariance matrix type was used. If the overall treatment effect was significant, the solutions PRO8, PRO5 and Control were compared in pairs using a Tukey adjustment. Statistical significance was set at p < 0.05 with SAS9.2 ®.
3Results
3.1Maximal increase in leucine levels
In the postprandial state, the maximum increase in plasma leucine levels, calculated as a percent-comparison to the baseline T0’ (before the lunch), differed significantly between PRO8, PRO5 and control meals (p = 0.004). This maximal increase corresponds to the greatest leucine levels in light of the time required to reach this value. The greatest increase in plasma leucine was observed for PRO8 (8.2 g of Prolacta ®); this meal revealed an average of 94.93 ± 18.58% (Fig. 2). This increase was more important than that for PRO5 (5 g of Prolacta ®) (71.17 ± 26.44% , p = 0.033) or for control meals (0 g of Prolacta ®) (37.57 ± 14 56% , p = 0.002). PRO5 also differed significantly from control meals (p = 0.032).
When considering quantitative values, the mean maximal plasma leucine levels (= Cmax) was 214.8 μmol/L ( ± 30.6 μmol/L) for PRO8, 194.5 μmol/L ( ± 28.8 μmol/L) for PRO5 and 155.0 μmol/L ( ± 26.3 μmol/L) for control meals (Table 3). Cmax differed significantly between the 3 meals (p = 0.014). Statistical analysis showed a significant difference between PRO8 and PRO5 (p = 0.013) and the control meals (p = 0.016); analysis also indicated that PRO5 differed from the control meal (p = 0.048).
The mean time required to reach Cmax (= Tmax, compared to the baseline T0’) was shorter after consumption of PRO8 (1h22 ± 28 minutes) compared with PRO5 and control (1h32 ± 32 minutes and 2h17 ± 1h14, respectively). However, no significant difference in Tmax was observed between the 3 meals with regards to Cmax (p = 0.346).
3.2Area under the curve for leucine kinetics
In this study, the area under the curve (AUC) of leucine levels as a function of time during 3h20 (Fig. 3) was calculated using the trapezoidal rule. The mean AUC for PRO8, PRO5 and control meals were, respectively: 11481.5 ± 1274.1 μmol.minutes/L, 10334.7 ± 1763.3 μmol.minutes/L and 4985.7 ± 1274.1 μmol.minutes/L.
Statistical analysis showed a significant difference in AUC between the 3 meals (p < 0.001). AUC for the control was lower than AUC for PRO8 and for PRO5 (p = 0.002 and p < 0.001 respectively). However, no significant difference was observed between AUC for PRO8 and PRO5 meals (p = 0.461).
3.3Glucose and insulin levels
In the postprandial state, there were no significant differences in plasma insulin and glucose kinetics. For insulin, neither maximal insulin levels nor insulin AUC differed between the 3 meals (Cmax: control = 45.2 mmol/L, PRO5 = 46.9 mmol/L,PRO8 = 44.7 mmol/L (p = 0.332); AUC: control = 4344.4, PRO5 = 4320.8, PRO8 = 4337.6 μmol.minute/L (p = 0.977)). Similarly, maximum glucose levels and glucose AUC did not differ between the 3 meals (Cmax: control = 7.67 mmol/L, PRO5 = 7.87 mmol/L, PRO8 = 7.7 mmol/L (p=0.428);AUC: Control = 292.7, PRO5 = 310.0, PRO8 =315.4 μmol.minute/L (p = 0.510)).
4Discussion
The objective of this study was to evaluate the elevation of leucinemia induced by a control lunch supplemented with soluble milk proteins. Results indicated that a control meal (lunch in addition to a control drink without Prolacta ®, providing 27 g of proteins with 2.2 g of leucine) induced a moderate increase in plasma leucine, with a maximum increase of 38% compared to the basal value. The supplementation of the control lunch with 8.2 g of Prolacta ® (providing only 1.1 g of additional leucine) induced a significantly stronger increase in plasma leucine levels with a 2.5× higher increase compared to the control meal. Moreover, the total leucine content that appeared in the blood over the 3h20 period (leucine AUC) was 2.3× higher for the meal containing 8.2 g of Prolacta ® compared to the control meal. Similarly, the meal containing 5 g of Prolacta ® showed a significant increase in both plasma leucine levels (1.9x higher) and leucine AUC (2.1x higher) when compared to the control meal. These results illustrate the high bioavailability of leucine from milk-soluble proteins, which seem to be more efficient than leucine from lunch dietary proteins alone in increasing postprandial leucinemia, even at lower quantities.
The strategy of increasing leucine availability to overcome anabolic resistance has been described in the literature. Studies in humans and in animals have shown that supplementation with free leucine, which is rapidly absorbed and induces an increase in postprandial leucinemia, significantly improved muscle-protein balance after the meal [13]. However, long-term free leucine supplementation was not able to increase or to maintain muscle mass, probably because of a lack of synchronization between the leucine anabolic signal and the arrival of other amino acids from the digestion of dietary proteins to meet the muscle requirements as substrates for protein synthesis [5]. In contrast, due to their rapid digestion rate, soluble milk proteins induce an elevation of plasma leucine and other amino acids. In elderly rodents, milk soluble proteins are more efficient than free leucine supplementation in improving the recovery of muscle mass after immobilization [14].
In addition, several studies showed that soluble milk proteins were more efficient than caseins in inducing protein synthesis in older individuals [8, 10]. Their effects have been studied only in powder or in a liquid matrix, independently of a solid meal containing other types of proteins. However, meal microstructure and macrostructure can affect the different steps of milk protein digestion; furthermore, the ability of soluble milk proteins to induce a peak in plasma leucinemia depends on the matrix in which they are incorporated [15, 16]. This study demonstrated that soluble milk proteins added independently as a supplement to a standard lunch containing other protein types are still able to induce a high and rapid increase in postprandial leucine levels.
The results of this study also raise the question of the ability of a moderate increase in leucinemia induced by the control meal (27 g of proteins, 2.2 g of leucine) to reach the anabolic threshold required to promote maximal anabolism and protein retention [5]. To help older people maintain muscle mass and function, the ESPEN expert group and the PROT-AGE international study group recently recommended a higher protein intake, with at least 1–1.2 g of proteins/kg of body weight/day for healthy older individuals [17, 18]. Several authors propose that this protein intake would be more efficient if it were distributed equally between 3 daily meals [17, 19, 20], while others favor protein pulse feeding with 80% of the protein intake in one meal [21, 22]. However, high-protein levels in a single meal can be hard to achieve in elderly people with diminished appetites and chewing difficulties. Additionally, despite additional protein and energy content, ingestion of more than 30 g of protein in a single meal does not elicit a greater anabolic response in elderly individuals [23]. As a result, the authors propose that the per-meal anabolic threshold of dietary protein intake is between 25 g and 30 g of high-quality proteins per meal, containing about 2.5 g to 2.8 g of leucine [17, 19]. In this way, stimulating muscle-protein synthesis at each meal would be more likely to provide a greater 24 h protein-anabolic response than an unequal protein distribution in adults [24]. Furthermore, the PROT-AGE study group maintains that fast proteins may possess certain benefits over slow proteins in muscle-protein metabolism. Wall and collaborators suggest selecting a rapidly digestible protein source with a high leucine content (or fortifying other dietary protein sources with leucine) as a feasible strategy for reducing the protein dose required for optimal postprandial muscle protein synthesis [25].
Finally, supplementing each meal with a moderate amount of soluble milk proteins could be effective sto reach anabolic thresholds and optimize the anabolic effect of each meal. By increasing maximal leucinemia, soluble milk proteins could reach a higher threshold and sustain this level for a longer time. Therefore, the intake could affect the intensity and duration of the muscles’ anabolic response [5]. However, other long-term studies are required to investigate the effects on protein synthesis and on body composition of supplementing a meal with soluble milk proteins.
In conclusion, this pilot study showed that a moderate amount of soluble milk proteins in addition to a standardized lunch substantially increased plasma leucine levels. This could present an interesting nutritional strategy to restore and optimize the anabolic action of the meal, without affecting the satiety and dietary habits of elderly individuals.
Acknowledgments
The authors would like to thank all subjects who participated in this study and Mathilde Minta and Nathalie Frisicale for their technical assistance. The authors gratefully acknowledge Sophie Dominguez for the English language editing of the manuscript.
This study was supported by research funding from Lactalis. Charlotte Baudry and Pascale Le Ruyet are employees of the Lactalis group.
References
[1] | Kimball SR , Jefferson LS . Control of protein synthesis by amino acid availability. Current Opinion in Clinical Nutrition and Metabolic Care. (2002) ;5: (1):63–67. |
[2] | Volpi E , Mittendorfer B , Rasmussen BB , Wolfe RR . The response of muscle protein anabolism to combined hyperaminoacidemia and glucose-induced hyperinsulinemia is impaired in the elderly. The Journal of Clinical Endocrinology and Metabolism. (2000) ;85: (12):4481–4490. |
[3] | Cuthbertson D , Smith K , Babraj J , Leese G , Waddell T , Atherton P , et al. Anabolic signaling deficits underlie amino acid resistance of wasting, aging muscle. FASEB Journal: Official publication of the Federation of American Societies for Experimental Biology. (2005) ;19: (3):422–424. |
[4] | Katsanos CS , Kobayashi H , Sheffield-Moore M , Aarsland A , Wolfe RR . Aging is associated with diminished accretion of muscle proteins after the ingestion of a small bolus of essential amino acids. The American Journal of Clinical Nutrition. (2005) ;82: (5):1065–1073. |
[5] | Dardevet D , Remond D , Peyron MA , Papet I , Savary-Auzeloux I , Mosoni L . Muscle wasting and resistance of muscle anabolism: The “anabolic threshold concept” for adapted nutritional strategies during sarcopenia. The Scientific World Journal. (2012) ;2012: :269531. |
[6] | Boirie Y , Gachon P , Beaufrere B . Splanchnic and whole-body leucine kinetics in young and elderly men. The American Journal of Clinical Nutrition. (1997) ;65: (2):489–495. |
[7] | Volpi E , Mittendorfer B , Wolf SE , Wolfe RR . Oral amino acids stimulate muscle protein anabolism in the elderly despite higher first-pass splanchnic extraction. The American Journal of Physiology. (1999) ;277: (3 Pt 1):E513–E520. |
[8] | Boirie Y , Dangin M , Gachon P , Vasson MP , Maubois JL , Beaufrere B . Slow and fast dietary proteins differently modulate postprandial protein accretion. Proceedings of the National Academy of Sciences of the United States of America. (1997) ;94: (26):14930–14935. |
[9] | Pennings B , Boirie Y , Senden JM , Gijsen AP , Kuipers H , van Loon LJ . Whey protein stimulates postprandial muscle protein accretion more effectively than do casein and casein hydrolysate in older men. The American Journal of Clinical Nutrition. (2011) ;93: (5):997–1005. |
[10] | Dangin M , Guillet C , Garcia-Rodenas C , Gachon P , Bouteloup-Demange C , Reiffers-Magnani K , et al. The rate of protein digestion affects protein gain differently during aging in humans. The Journal of Physiology. (2003) ;549: (Pt 2):635–644. |
[11] | Holliday EG , Smith AV , Cornes BK , Buitendijk GH , Jensen RA , Sim X , et al. Insights into the genetic architecture of early stage age-related macular degeneration: A genome-wide association study meta-analysis. PloS One. (2013) ;8: (1):e53830. |
[12] | Babault N , Deley G , Le Ruyet P , Morgan F , Allaert FA . Effects of soluble milk protein or casein supplementation on muscle fatigue following resistance training program: A randomized, double-blind, and placebo-controlled study. Journal of the International Society of Sports Nutrition. (2014) ;11: :36. |
[13] | Balage M , Dardevet D . Long-term effects of leucine supplementation on body composition. Current Opinion in Clinical Nutrition and Metabolic Care. (2010) ;13: (3):265–270. |
[14] | Magne H , Savary-Auzeloux I , Migne C , Peyron MA , Combaret L , Remond D , et al. Contrarily to whey and high protein diets, dietary free leucine supplementation cannot reverse the lack of recovery of muscle mass after prolonged immobilization during ageing. The Journal of Physiology. (2012) ;590: (Pt 8):2035–2049. |
[15] | Barbe F , Menard O , Le Gouar Y , Buffiere C , Famelart MH , Laroche B , et al. Acid and rennet gels exhibit strong differences in the kinetics of milk protein digestion and amino acid bioavailability. Food Chem. (2014) ;143: :1–8. |
[16] | Dupont DMO , Le Feunteun S , Rémond D . Comment la structure des gels laitiers régule-t-elle la biodisponibilité des acides aminés? Innovations Agronomiques. (2014) ;36: :57–68. |
[17] | Bauer J , Biolo G , Cederholm T , Cesari M , Cruz-Jentoft AJ , Morley JE , et al. Evidence-based recommendations for optimal dietary protein intake in older people: A position paper from the PROT-AGE Study Group. Journal of the American Medical Directors Association. (2013) ;14: (8):542–559. |
[18] | Deutz NE , Bauer JM , Barazzoni R , Biolo G , Boirie Y , Bosy-Westphal A , et al. Protein intake and exercise for optimal muscle function with aging: Recommendations from the ESPEN Expert Group. Clinical Nutrition. (2014) ;33: (6):929–936. |
[19] | Paddon-Jones D , Rasmussen BB . Dietary protein recommendations and the prevention of sarcopenia. Current Opinion in Clinical Nutrition and Metabolic Care. (2009) ;12: (1):86–90. |
[20] | Paddon-Jones D , Campbell WW , Jacques PF , Kritchevsky SB , Moore LL , Rodriguez NR , et al. Protein and healthy aging. The American Journal of Clinical Nutrition (2015) . [Epub ahead of print]. |
[21] | Arnal MA , Mosoni L , Boirie Y , Houlier ML , Morin L , Verdier E , et al. Protein pulse feeding improves protein retention in elderly women. The American Journal of Clinical Nutrition. (1999) ;69: (6):1202–1208. |
[22] | Bouillanne O , Curis E , Hamon-Vilcot B , Nicolis I , Chretien P , Schauer N , et al. Impact of protein pulse feeding on lean mass in malnourished and at-risk hospitalized elderly patients: A randomized controlled trial. Clinical Nutrition. (2013) ;32: (2):186–192. |
[23] | Symons TB , Schutzler SE , Cocke TL , Chinkes DL , Wolfe RR , Paddon-Jones D . Aging does not impair the anabolic response to a protein-rich meal. The American Journal of ClinicalNutrition. (2007) ;86: (2):451–456. |
[24] | Mamerow MM , Mettler JA , English KL , Casperson SL , Arentson-Lantz E , Sheffield-Moore M , et al. Dietary protein distribution positively influences 24-h muscle protein synthesis in healthy adults. The Journal of Nutrition. (2014) ;144: (6):876–880. |
[25] | Wall BT , Cermak NM , van Loon LJ . Dietary protein considerations to support active aging. Sports Medicine. (2014) ;4: (Suppl 2):S185–S194. |
Figures and Tables
Fig.1
The study was based on a crossover design. During each visit of the study, the six men consumed a standardized lunch supplemented with a beverage containing either 0 g, or 5 g or 8.2 g of soluble milk proteins (randomly assigned). Blood samples were collected before and after lunch consumption (during a 3h20 period).
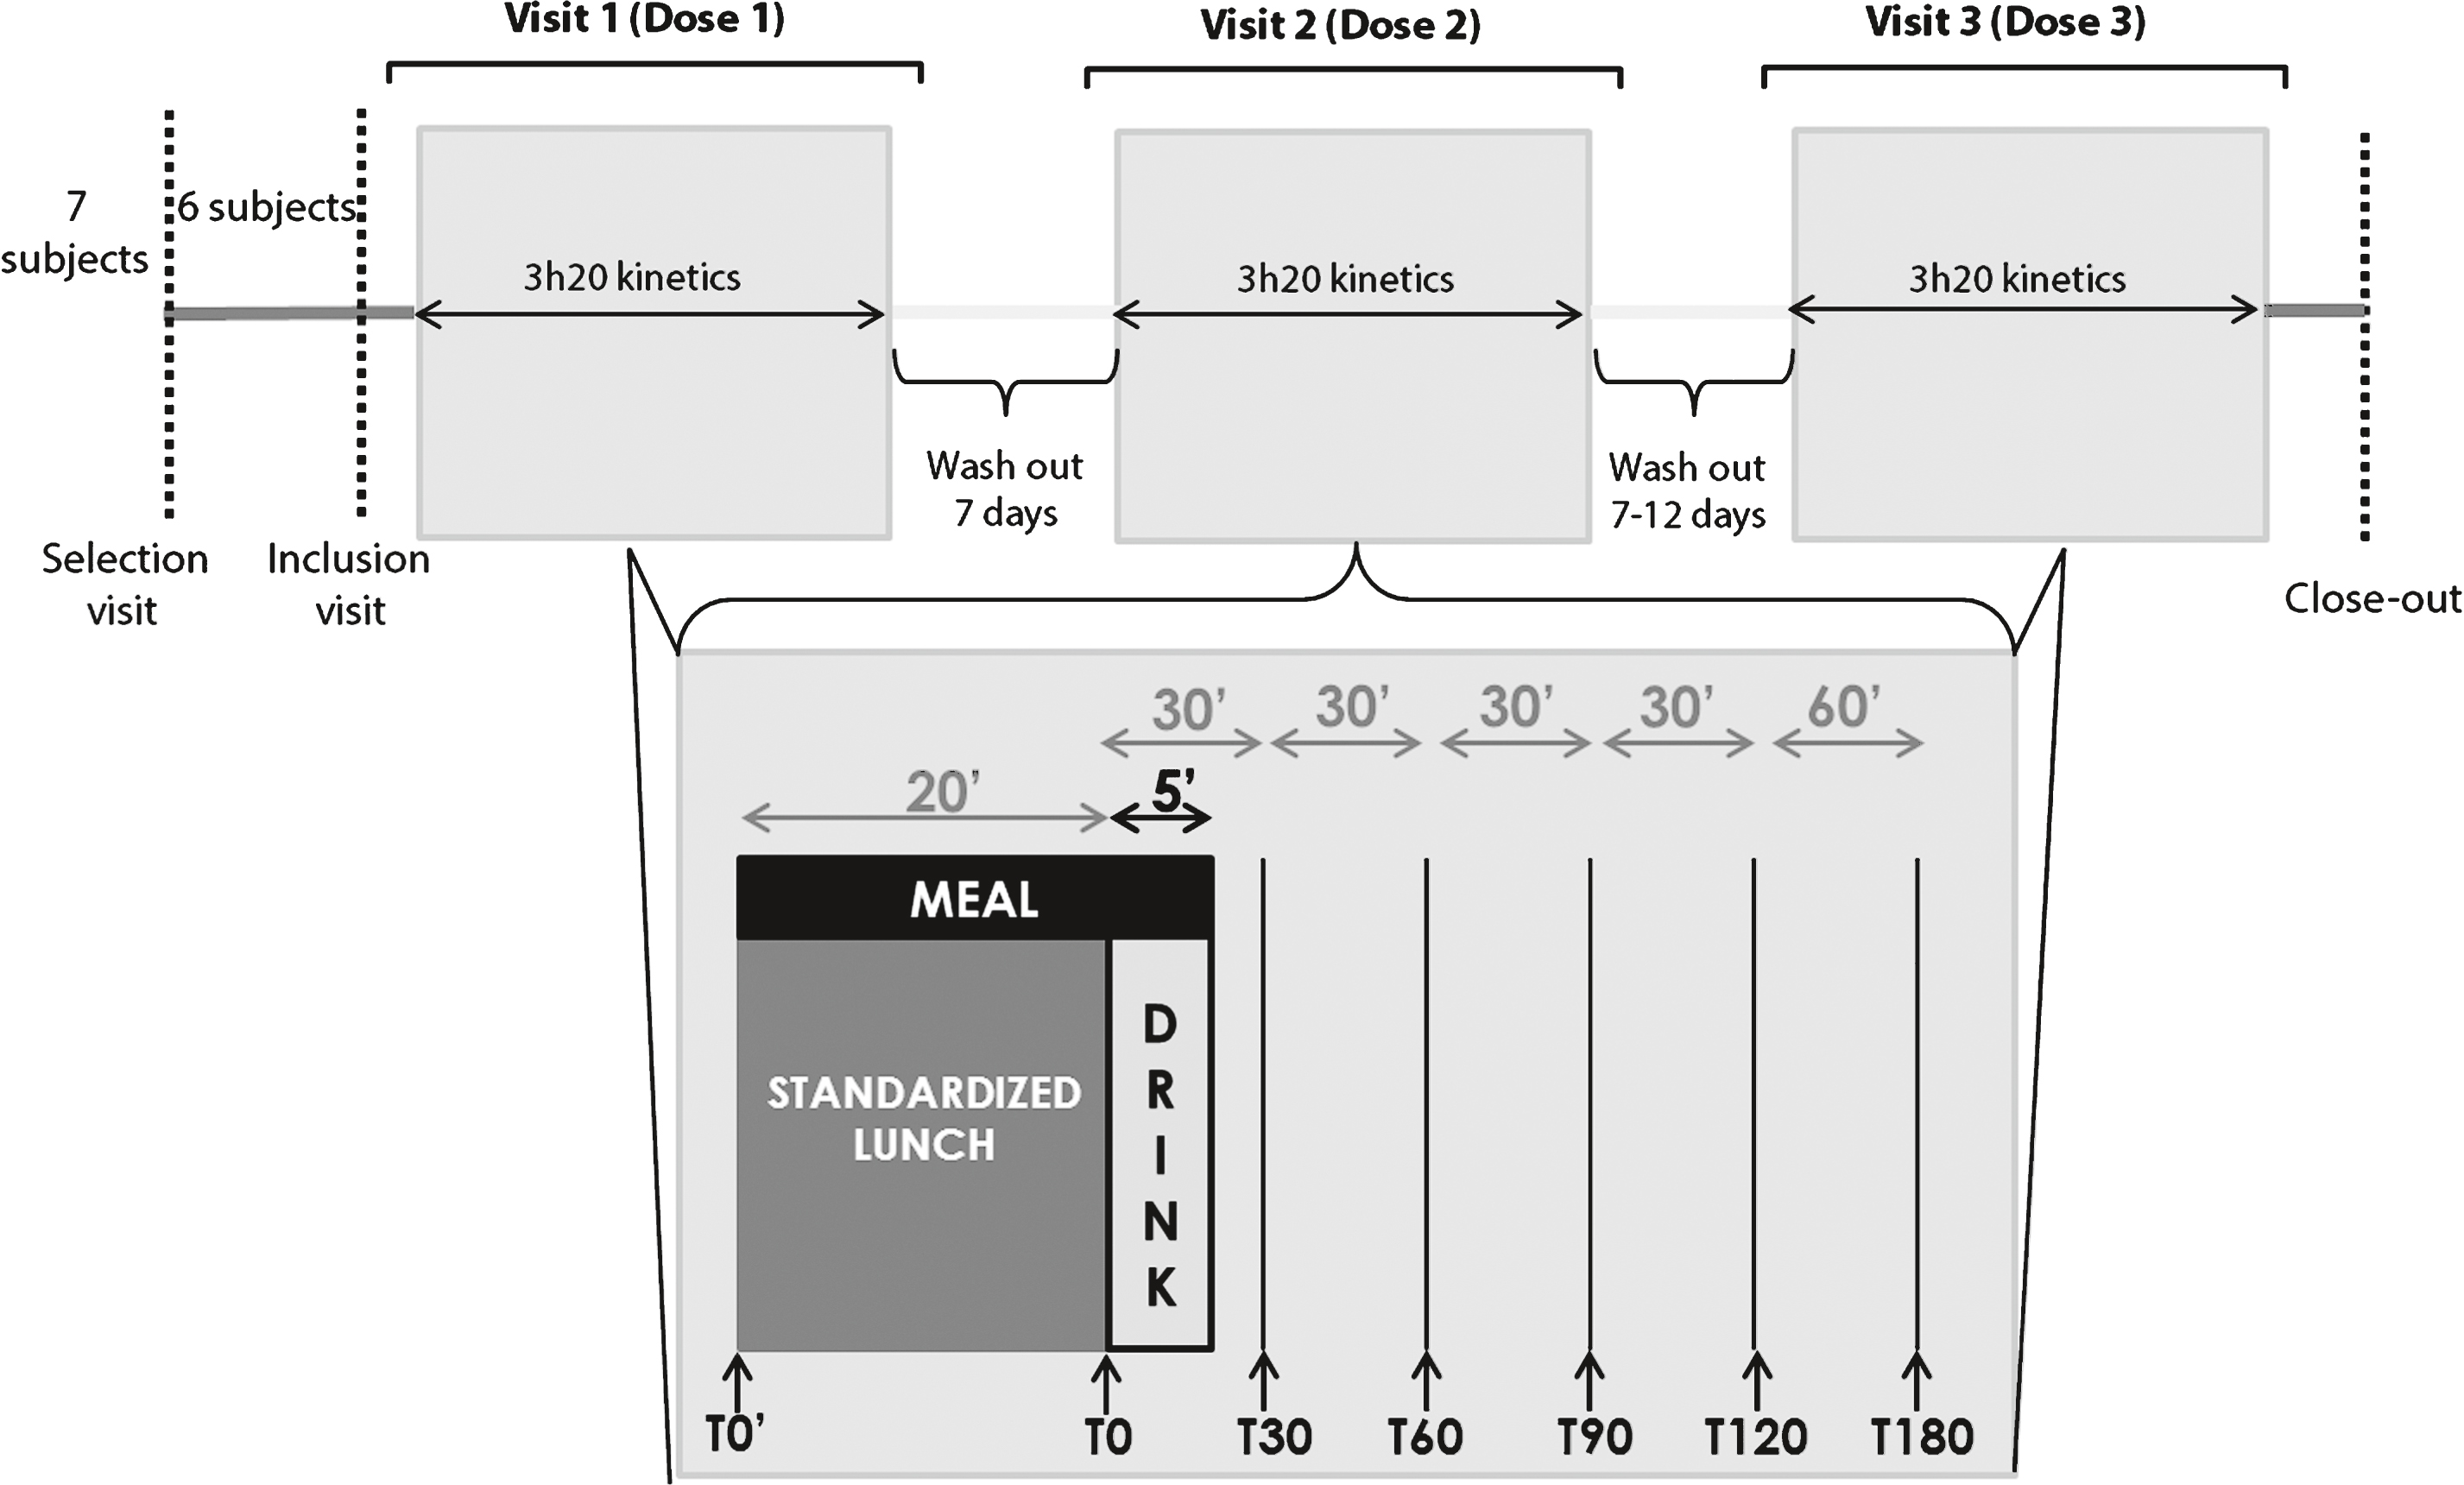
Fig.2
The highest maximal increase in leucine levels was observed with PRO8 consumption. This increase was significantly more important than that for PRO5 or for control meals. PRO5 also differed significantly from control meals.
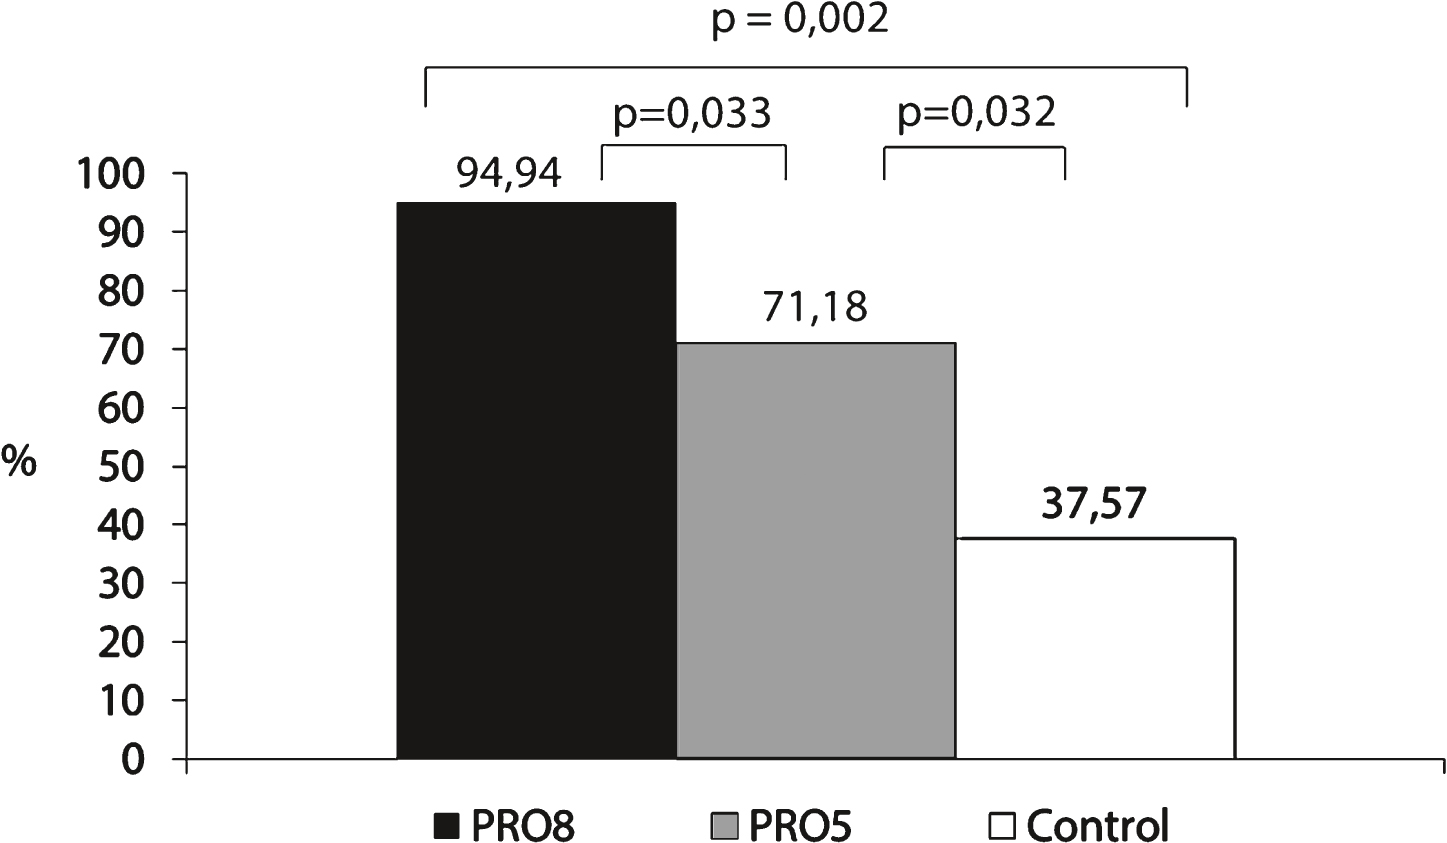
Fig.3
Leucine AUC was 2.3× and 2.1× higher for PRO8 and PRO5 respectively compared to the control meal.
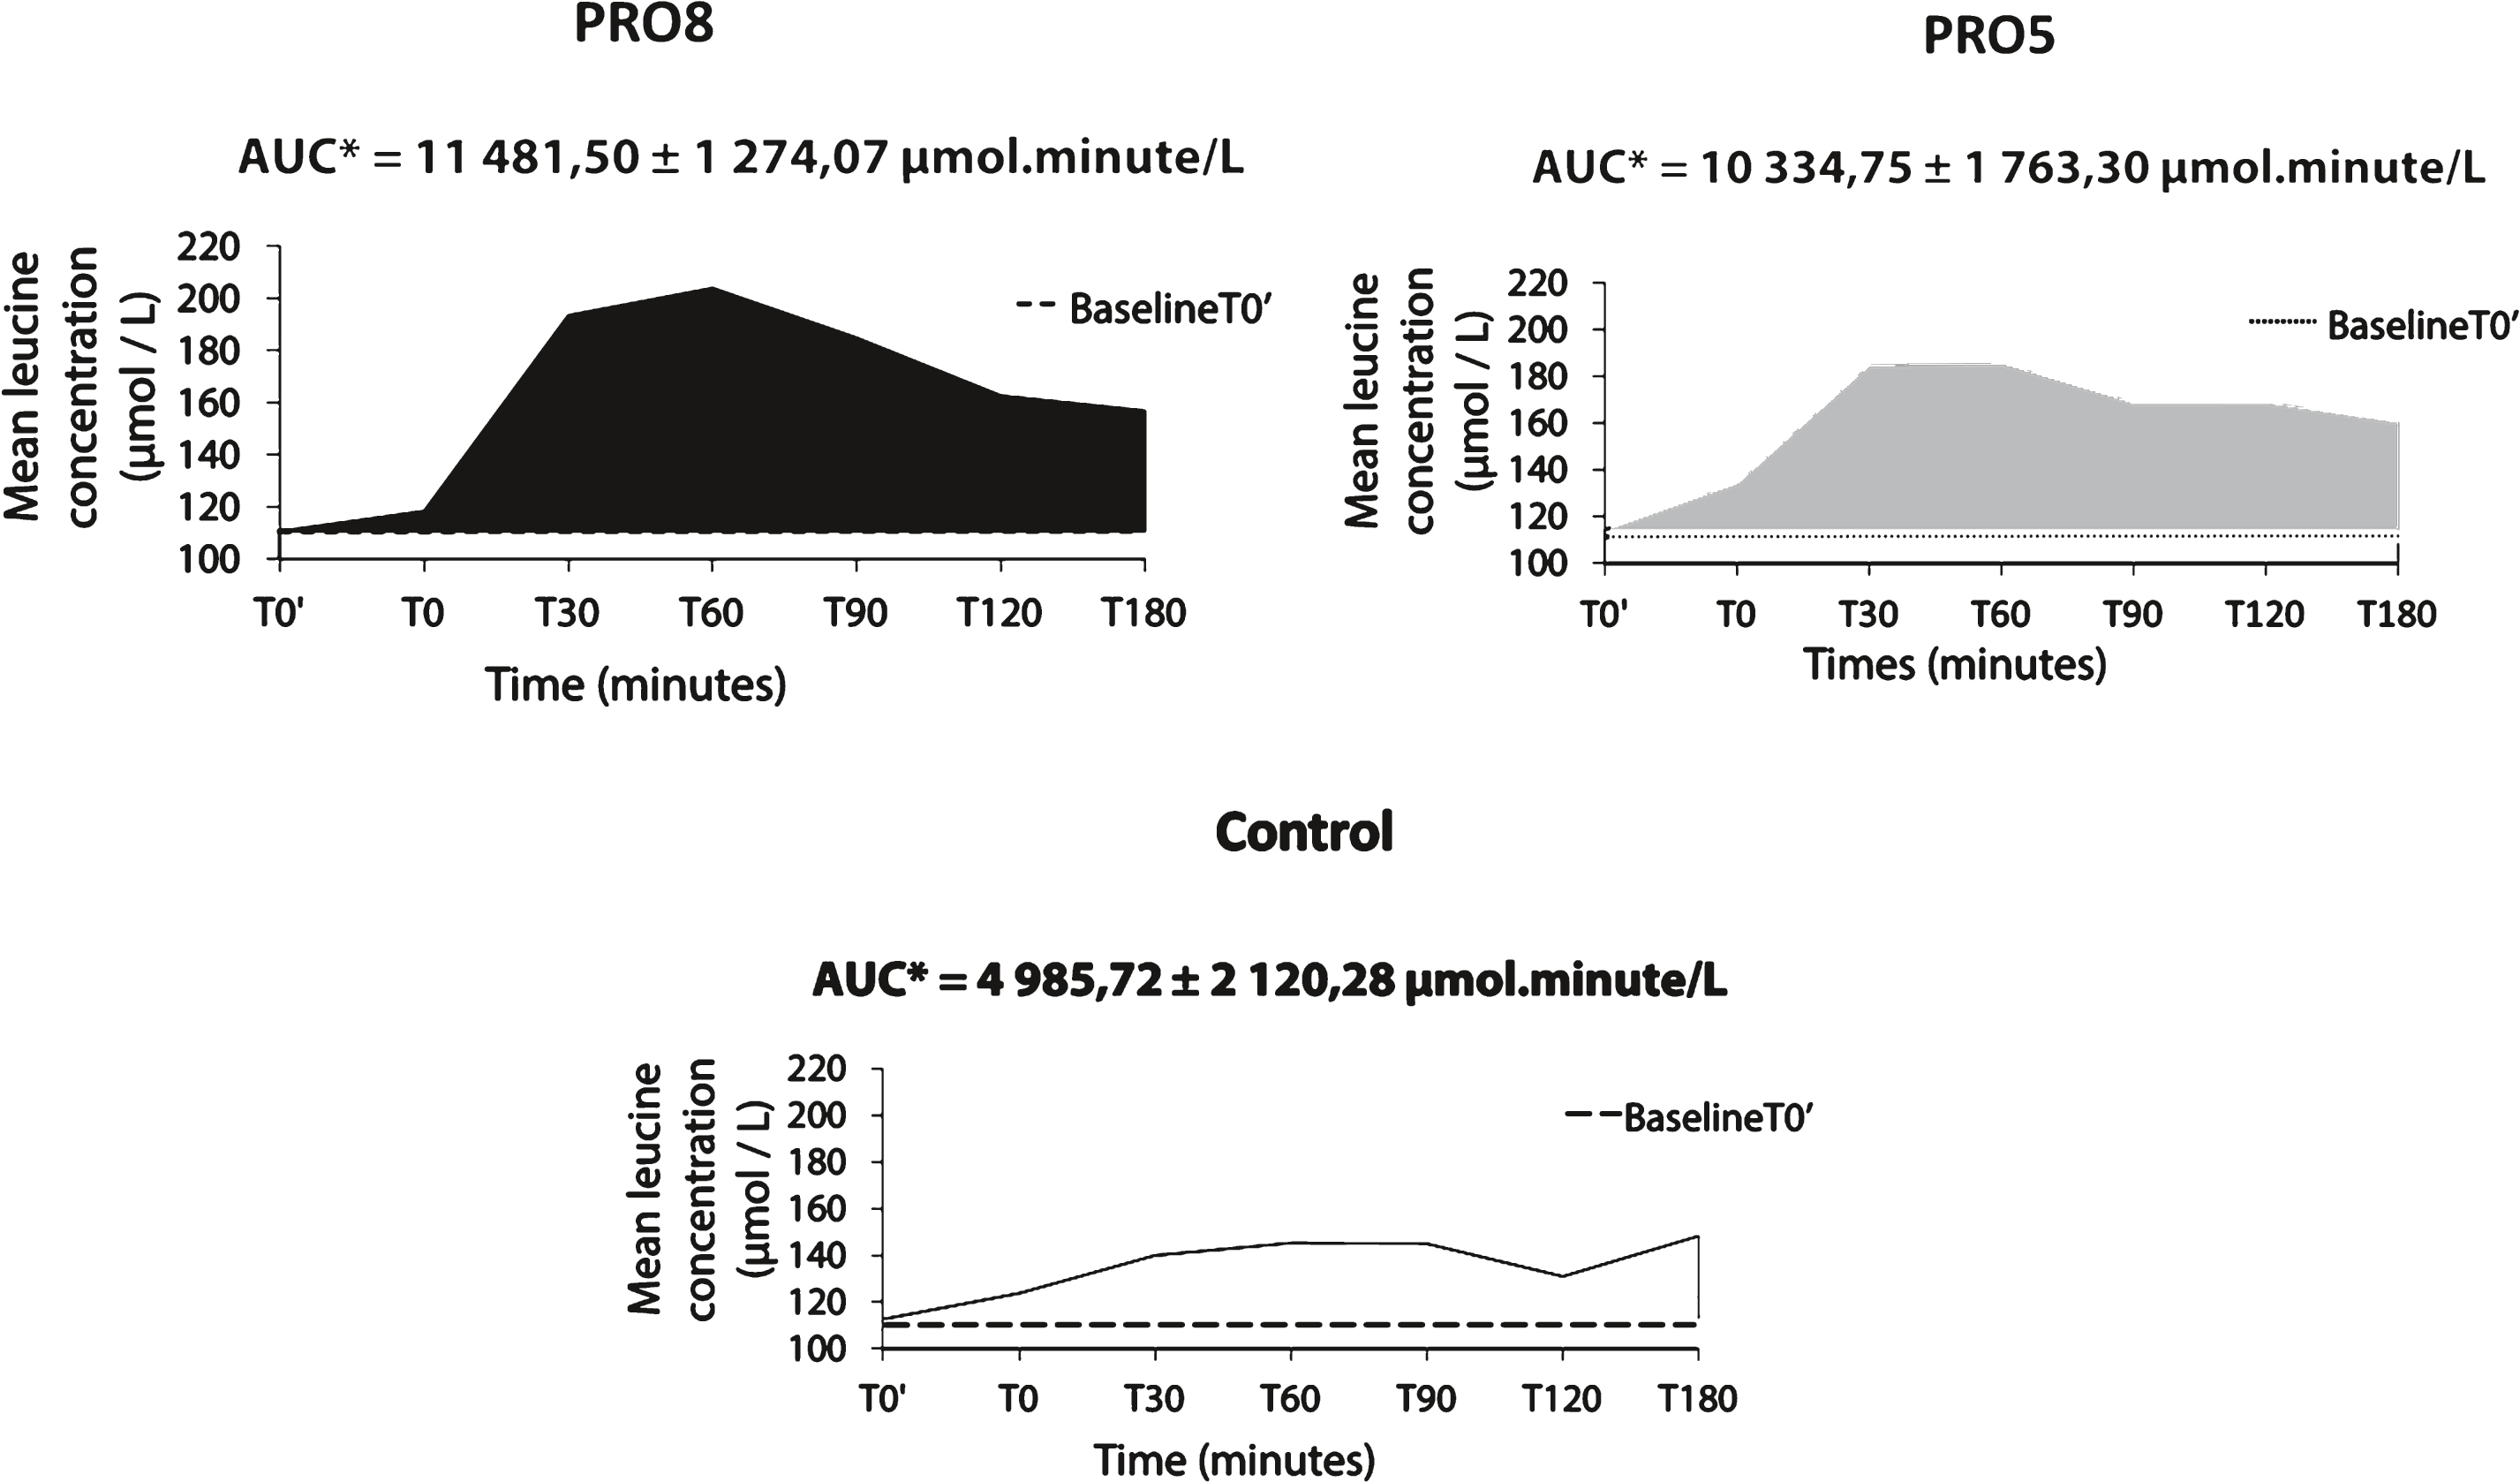
Table 1
Participants characteristics at baseline
| Mean (n = 6) | SD | |
| Age | 66,86 | 0,69 |
| BMI (kg/m2) | 26,48 | 0,42 |
| Total cholesterol (g/L) | 2,17 | 0,42 |
| Triglycerides (g/L) | 0,95 | 0,38 |
| Fasting glucose (g/L) | 1,00 | 0,12 |
| Creatinine ( μmol/L) | 84,00 | 7,64 |
| Glomerular filtration rate (mL/min/1,73 m2) | 79,71 | 8,50 |
Table 2
Nutritional values of the 3 study products
| Per 100 mL | PRO8 | PRO5 | Control | |
| Energy (kcal) | 150.0 | 137.8 | 118.4 | |
| (kJ) | 628.0 | 577.1 | 495.7 | |
| Proteins (g) | 10.0 | 6.8 | 1.9 | |
| Prolacta ® (g) | 8.2 | 5.0 | 0.0 | |
| Of which Leucine (g) | 1.1 | 0.6 | 0 | |
| Other (g) | 1.8 | 1.8 | 1.9 | |
| Carbohydrates (g) | 12.9 | 12.9 | 12.9 | |
| Fat (g) | 6.5 | 6.5 | 6.5 |
Table 3
Maximal leucine levels (Cmax) and maximal leucine level time (Tmax)
| PRO8 | PRO5 | Control | p overall treatment | |
| Cmax ( μmol/L) | 214,8 (1) (2) | 194,5 (1) (3) | 155,0 (2) (3) | 0,014 |
| Tmax(minutes) | 82 | 92 | 137 | 0,346 |
(1) p PRO8-PRO5 = 0,013. (2) p PRO8-Control = 0,016. (3) p PRO5-Control = 0,048.


