
Identification of new dihydrophenanthrene derivatives as promising anti-SARS-CoV-2 drugs through in silico investigations
Abstract
To research, evaluate, and invent novel compounds that inhibit SARS-CoV-2 activity, a series of reported 39 substituted 9, 10-dihydrophenanthrene derivatives were subjected to a quantitative structure-activity relationship (QSAR) study. Gaussian 09 and ChemOffice programs were used to calculate the molecular descriptors employed to determine their impact on the studied activity. Then we reduced the number of descriptors by eliminating the redundant information using principal component analysis (PCA). The creation of molecular models was done by using multiple linear regression (MLR) according to the principles established by the Organization for Economic Co-operation and Development (OECD) and the validation by using external and internal validation, Y-randomization tests, and domain of applicability. Moreover, we evaluated the toxicity of developed compounds using ADMET and Molecular docking to determine their optimal position to form a stable complex. As a result, four molecules may be used to develop a novel drug that can inhibit SARS-CoV-2 without causing the side effect.
1Introduction
SARS-CoV-2, also known as severe acute respiratory syndrome coronavirus 2, was discovered as a new coronavirus 2019 (COVID-19) outbreak that first appeared in the Chinese city of Wuhan in December 2019. It represents a highly dangerous disease that paralyzes the world [1]. The virus has quickly spread from one person to another through respiratory drops released when coughing and sneezing [2], causing 618,521,620 confirmed cases of the infected human being throughout the world [3].
On March 12, 2020, The World Health Organization (WHO) declared the viral epidemic a public health emergency of international significance [4].
Likewise, governments and health departments have chosen various strategies to contain the virus’s spread. Many attempts have been made worldwide to develop and find an efficient drug to treat patients potentially infected with COVID-19, leading to the development of various vaccines that have been widely applied to the public to reduce the transmission rate [5]. However, no single therapy has shown its effectiveness against SARS-CoV-2. And to date, the search for new treatments to combat this epidemic continues to avoid future zoonotic epidemics [6].
SARS-CoV-2 is a member of the family Coronaviridae that belongs to beta coronavirus, an enveloped virus with a single-stranded, positive-sense, 29-30 kb RNA genome in size. It encodes 16 non-structural proteins (ORF1a⟶nsp1-11 and ORF1b⟶nsp12-16) and five major structural proteins (S, spike; E, envelope; M, membrane; N, nucleocapsid; HE, hemagglutinin esterase). These include the papain-like protease (PLpro) and the 3C-like protease (3CLpro), which are important for the viral life cycle and responsible for inhibiting the host immune system [7]. These protease enzymes, therefore, represent the crucial molecular targets for COVID-19 treatment. Furthermore, strong 3CLpro inhibition can lower the chance of mutation-mediated drug resistance [8]. Herein, we will work on identifying a novel agent that targets the enzymatic activity of 3-chymotrypsin-like protease (3CLpro) [9].
In this regard, we based our work on the in vitro results of the study conducted by Zhang et al, about the discovery of multiple derivatives of 9,10-dihydrophenanthrene as potential non-covalent inhibitors of the SARS-CoV-2-3CLpro [10]. By privileged scaffold fusion and structure-activity relationships study. The FRET assay was used to investigate the inhibitory effects of the various discovered compounds on SARS-CoV-2 3CLpro.
Only two effective compounds with the most strong SARS-CoV-2 3CLpro inhibitory activity were among all evaluated 9,10-dihydrophenanthrene derivatives, with IC50 values of 1.55 ± 0.21 mM and 1.81 ± 0.17 mM, respectively. Furthermore, enzyme kinetics studies demonstrated that these two drugs inhibit SARS-CoV-2 3CLpro via a mixed-inhibition mechanism. Then In vitro gastrointestinal, plasma, and microsome stability assays were conducted for both discovered compounds and showed good metabolic stability in the human gastrointestinal tract, plasma, and liver microsomes. We can state that the investigation carried out by Zhang et al. come to continue our research on providing more structural references for the development of SARS-CoV-2 3Clpro inhibitors with higher activity by using computational methods. The benefit behind this is to accelerate the process of active compound discovery.
In this work, we conducted an in-silico study using bioinformatics techniques to predict new noncovalent inhibitors with better activity against COVID-19. The quantitative structure-activity relationship is an effective theoretical approach in discovering new effective anti-SARS-CoV-2 compounds [11]. Over the past few years, several models of quantitative structure-activity-QSAR relationships have been developed to predict potential inhibitors of SARS-CoV-2 [12–15].
This paper determines candidate inhibitors of the studied series by QSAR and molecular docking analysis. Moreover, the evaluation of drug-likeness and ADMET properties was performed to confirm the use of the best inhibitor chosen for the anti-SARS-CoV-2 drug.
2Materials and methods
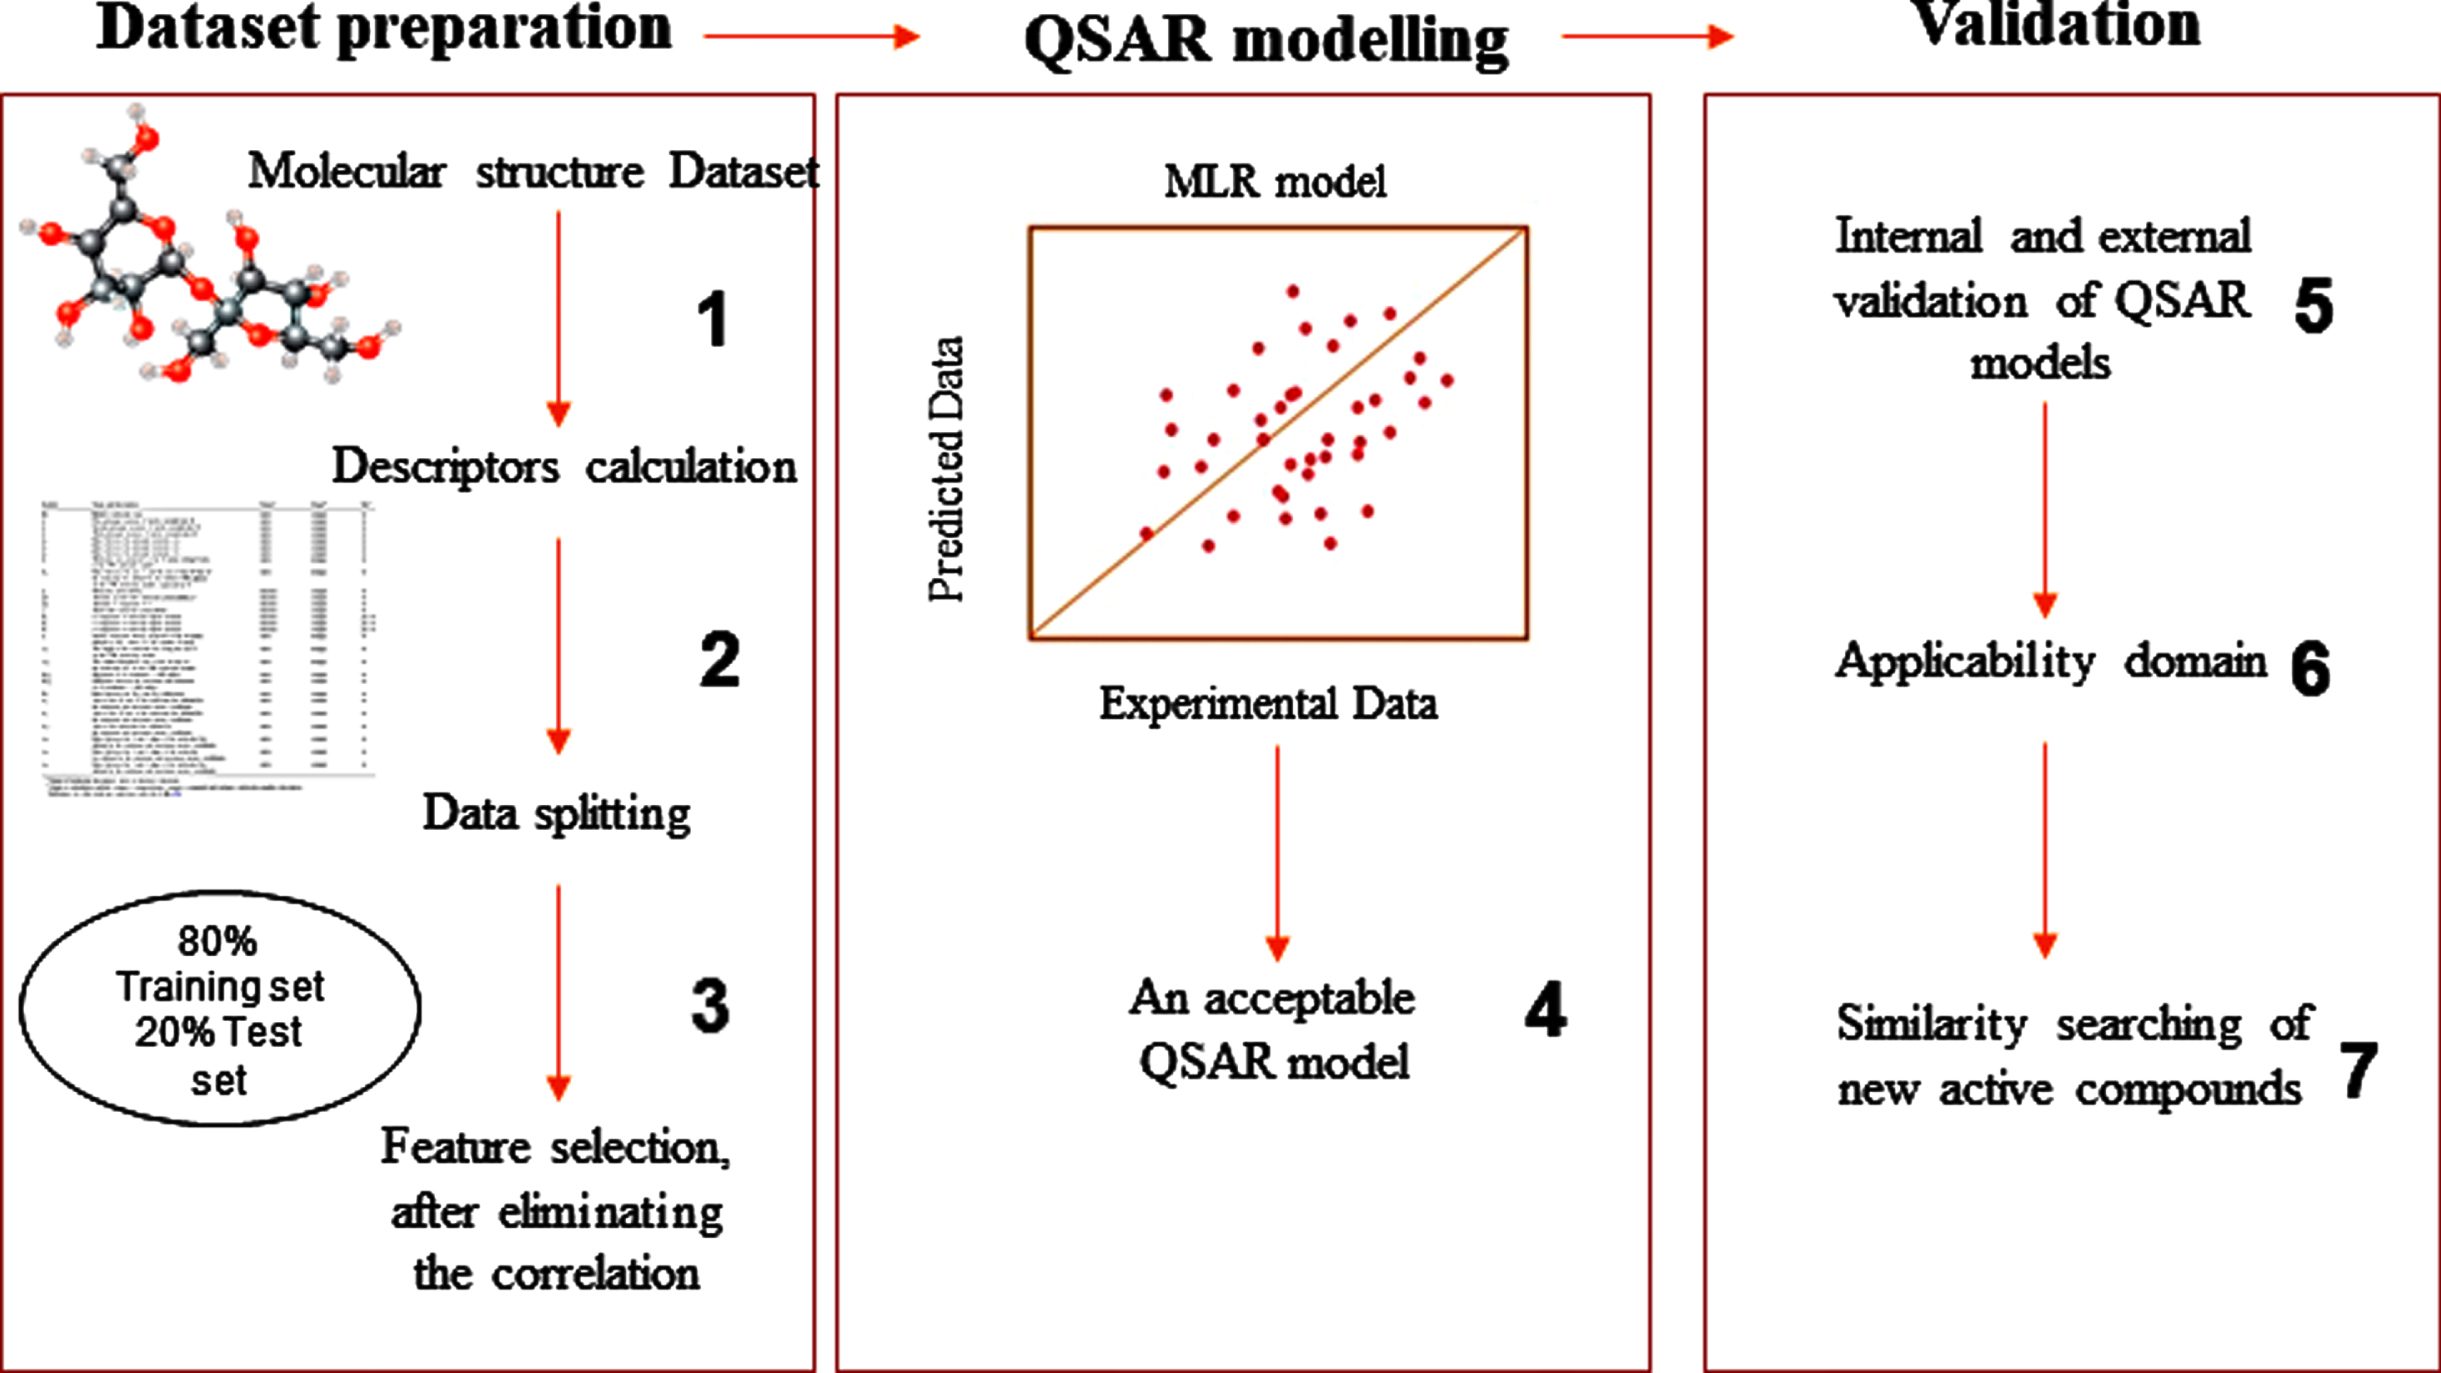
This study aimed to create a model able to predict the inhibitory activities of novel compounds using the QSAR technique for fighting COVID-19. To attain our aim, we followed the processes outlined below, considering the recommendations established by the Organization for Economic Cooperation and Development (OECD) [16] (Fig. 1).
Fig. 1
The process adopted in this study.
2.1The data sets
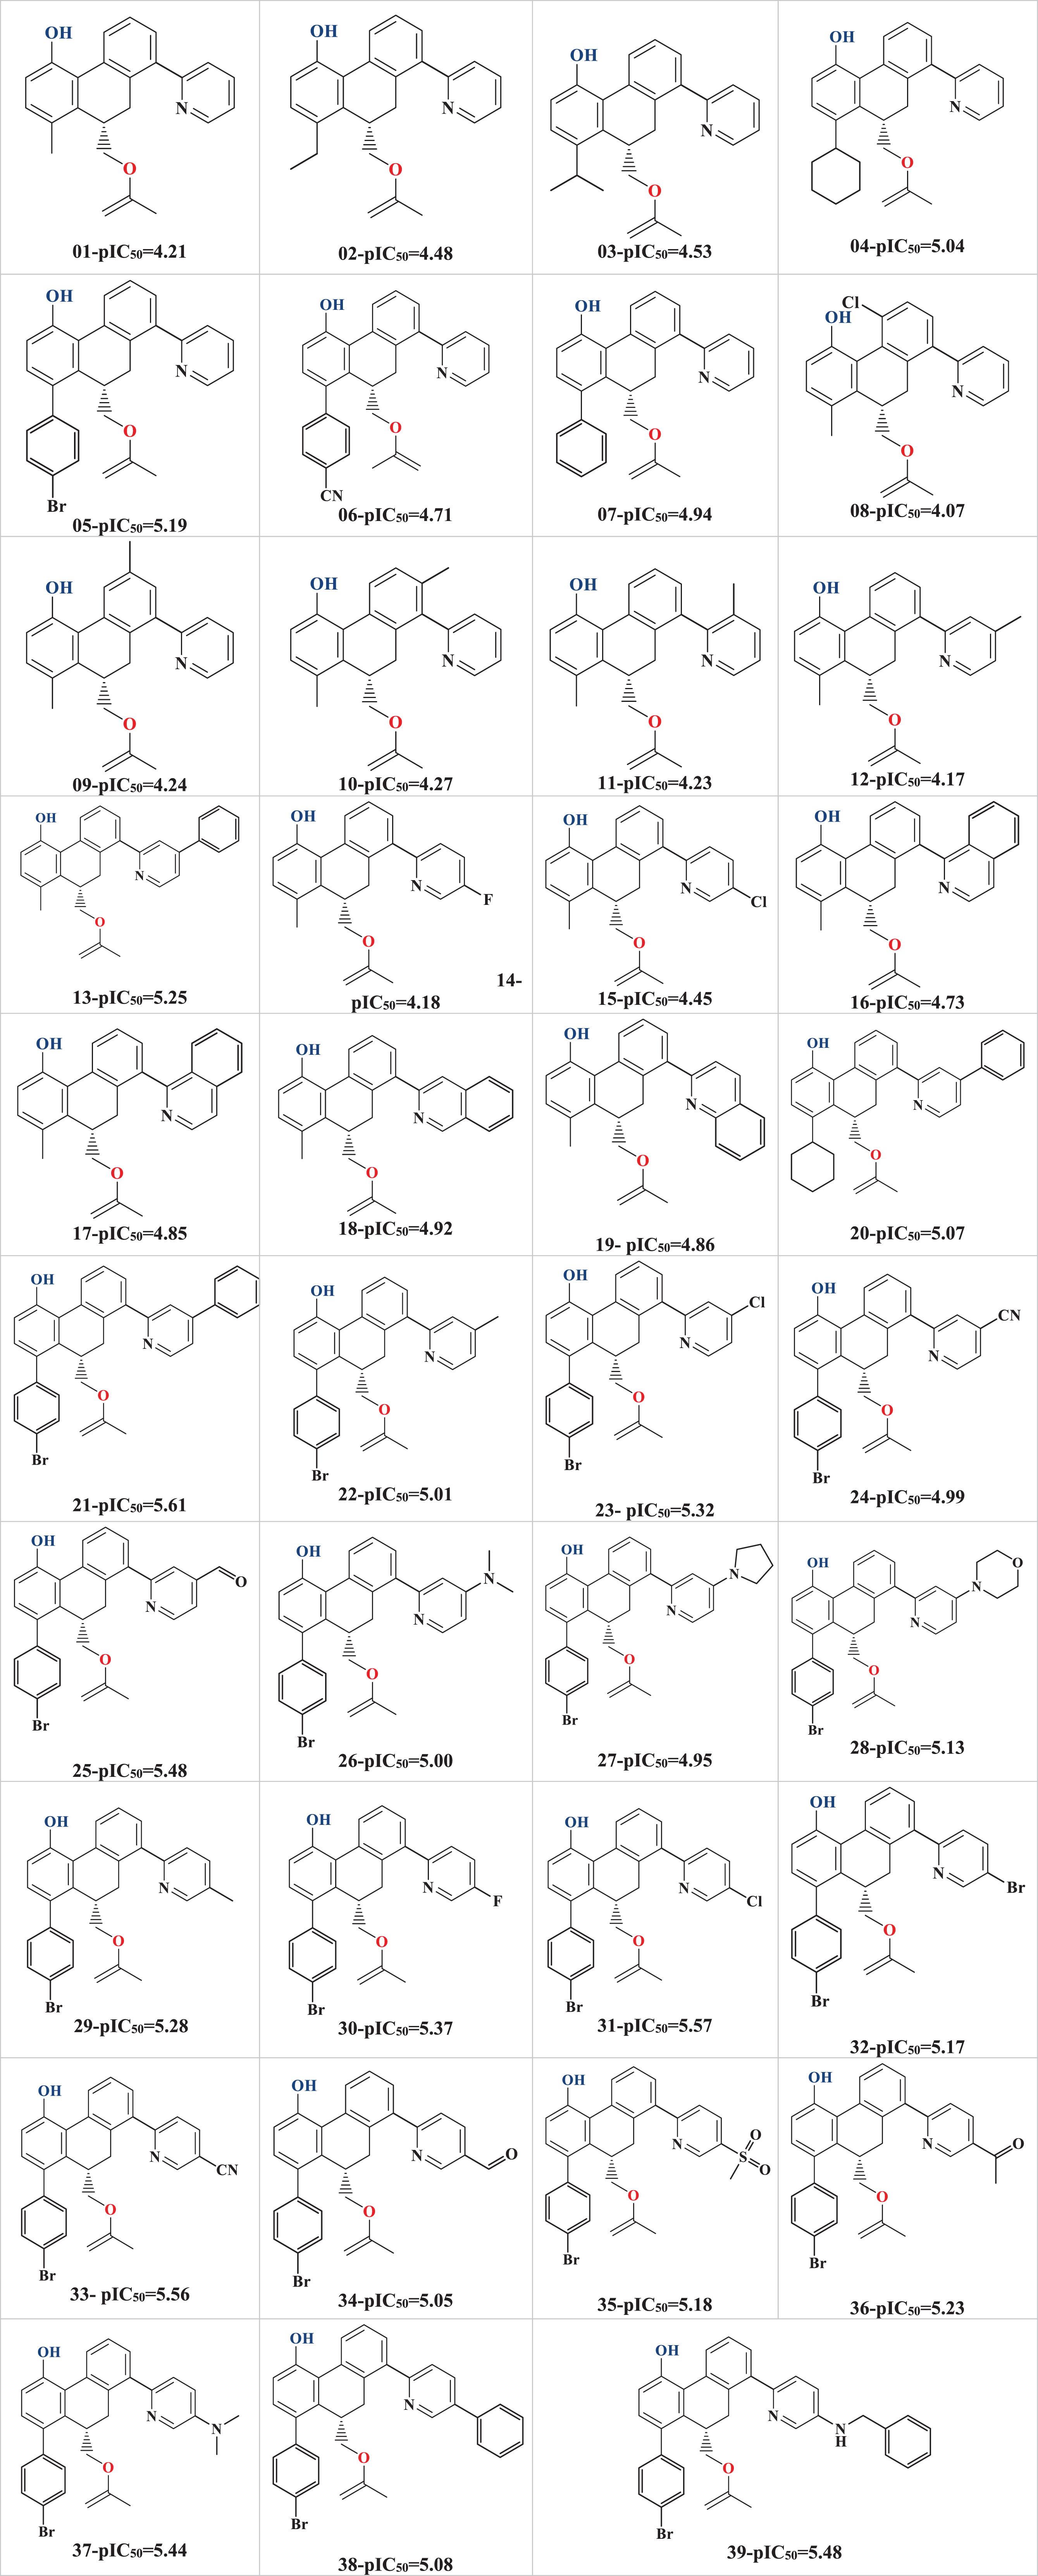
In this work, a dataset of reported thirty-nine (39) substituted 9, 10-dihydrophenanthrene analogs covering a wide chemical space and having moderate to high activity against the SARS-CoV-2 virus strain had been considered. The reported IC50 values were then converted into pIC50 (pIC50 = -logIC50) before quantitative structure-activity relationships (QSAR) modeling. For the sake of better understanding, the structures of all these compounds, along with their calculated pIC50 values, are provided in Table 1.
Table 1
Structures and pIC50 values of the 39 studied compounds
 |
2.2Molecular descriptors calculation
The chemical structures of the 39 molecules in our dataset were drawn using Chemdraw software [17]. The geometrical structure of the investigated series was optimized by using the density functional theory DFT (B3LYP/6-31 G (d, p) basis set) method utilizing the Gaussian09 W [18] and Chem3D software [17], were used to compute various quantum chemical descriptors and calculate the topological, physicochemical, and geometrical descriptors. After the calculation of the descriptors for all the molecules of the studied database, we determined the quantitative relationship between these descriptors and the biological inhibitory activity of the SARS-CoV-2 disease.
2.3Statistical analyses
To build a linear mathematical model, a wide range of chemical descriptors that belongs to different classes (1D, 2D, 3D) were generated for all the 39 molecules obtained by in vitro synthesis [10]. Then for representing the QSAR models, we did use the statistical methods presented below.
2.3.1Principal components analysis (PCA)
PCA is a descriptive statistical method, very useful in summarizing the maximum of information contained in the data and representing them in a simple and comprehensible form, reducing the dimensionality of a dataset and understanding the distribution of the variables and the connection between them [19]. This paper used PCA to generate a robust model by removing highly inter-correlated and redundant values while keeping efficient data. Furthermore, the pretreated descriptors were divided into two sets of the group, a set of training used in the construction of the model 2D-QSAR and a set of tests used in the external validation of these models. The descriptors applied for the development of the models are shown in Table 2
Table 2
List of molecular descriptors with different classes
| Descriptors | Symbol | Class |
| Percentage mass of Carbon | % C | Constitutional |
| Percentage mass of Hydrogen | % H | |
| Percentage mass of Nitrogen | % N | |
| Percentage mass of Brome | % Br | |
| Percentage mass of Chlore | % Cl | |
| Percentage mass of Oxygen | % O | |
| Molecular Weight | MW | |
| Number of HBond Acceptors | NHA | Physico-chemical |
| Number of HBond Donors | NHD | |
| Molecular Refractivity | MR | |
| Coefficient of partition Octanol/Water | LogP | |
| Pka (log units) | Pka | |
| Number Rotatable Bonds | Nrot | Geometrical |
| Polar Surface Area | PSA | Topological |
| Topological Diameter | ||
| Energy gap | E (ev) | Quantum (Electronic) |
| Dipole Moment | μ | |
| Electronegativity | X | |
| Energy gap | EGAP (ev) | |
| Energy HOMO | EHOMO (ev) | |
| Energy LUMO | ELUMO (ev) |
2.3.2Model development
This study used the multiple linear regression (MLR) method available in XLSTAT software [20] to develop the QSAR models. MLR is a statistical tool that establishes a linear regression between independent variables X (molecular descriptors) and a dependent variable Y (biological activity to be predicted) according to the following relation Equation (1)
(1)
Where ai represents the coefficients of those descriptors, a0 is the intercept of the equation, and n is the number of the molecular descriptors.
Afterward, multiple statistical parameters, such as the correlation coefficient (R2) and the root mean square error (RMSE), were determined. The model is simultaneously developed until the R2 value is significantly higher and the RMSE value is lower by entering the new descriptor. All developed models were validated using internal cross-validation (R2CV) and external validation (R2Test).
2.3.3Statistical testing and validation
The validation of the models QSAR remains a very sensitive step in statistical studies to evaluate the importance of QSAR models and, thus, their predictive abilities of the activities/properties of other new compounds. It generally starts with an internal validation and then an external validation. In addition, we run a Y-randomization test to assess the effectiveness of the originally developed model and then by the definition of the applicability domain, that is to say, the region of the chemical space in which a compound can be predicted with confidence.
To select the best MLR model, the coefficient of determination R2 (Equation 2), the coefficient adjusted for degrees of freedom R2Adj (Equation 3), the mean squared error MSE (Equation 4), the coefficient of determination for the test set R2Test, and cross-validation coefficient R2cv (Equation 5), were used.
If R2, R2Adj, R2Test, and R2cv values are greater than 0.6 according to A. Golbraikh, A.Tropsha [21], F-value is higher (F > 0.33) and a level of signification p-value between 1% and 5%, the model is statistically acceptable.
(2)
(3)
(4)
(5)
Where Yobs and Ycalc are, respectively, the value of the observed and calculated response,
2.3.4Applicability domain
The applicability domain of a QSAR model is the final step in validating the developed QSAR model; it is regarded as an important step in evaluating whether the model is accurate in making predictions within the chemical space for which it was developed [22]. Furthermore, according to the Organization for Economic Cooperation and Development (OECD), the validation process by defining the applicability domain remains very important [23]. There are different methods for defining AD models [24], but the most common method is determining the leverage value hi for each molecule using the following formula Equation (6).
(6)
With (i = 1,2, . . . ..,n) for each compound, xi is the line-vector descriptor of the query compound, X is n*(k-1) matrix of k model descriptor values for training set compounds, and the superscript T refers to the transpose of matrix/vector [25]. In the present study, we used the Williams plot available in Matlab software [26] to determine the AD, the leverage threshold h* value (Equation 7) was calculated and then compared with the leverage value hi when (hi > h*), it indicates that the compound affects negatively on the developed model, so it is considered outside the applicability domain.
(7)
With n the number of compounds in the training set and k the number of descriptors.
2.4In silico Pharmacokinetic ADMET prediction
ADMET parameters (absorption, distribution, metabolism, excretion, and toxicity) and Pharmacokinetic characteristics of the selected compounds represent a vital tool to predict the failures in drug development candidates and accelerate the process of active compound discovery [27]. These studies consist of evaluating the drug’s likeness properties and determining the activity through the human body. These pharmacokinetic parameters were assessed for the four derivatives predicted compounds of 9, 10 dihydrophenantrene to examine their drug candidate properties. Applying the pkCSM server [28] by introducing the SMILES strings of the structures. It’s a web platform that gives rapid information to evaluate pharmacokinetic and toxicity properties.
2.5Molecular docking
Molecular docking is an essential tool in structural molecular biology and computer-aided drug design [29]. It is widely used to predict the predominant ligand’s binding mode(s) in the active site of a target protein with a known three-dimensional structure [30]. The configuration of the docking input structures is just as important as the docking itself. First, the 3D-dimensional structure of the SARS-CoV-2 main protein (PDB entry: 6LU7, Resolution: 2.16 Å) was downloaded from the Protein Data Bank (http://www.rcsb.org). Then the target protein was prepared using AutoDockTool-1-5-6 [31] by removing all heteroatoms, water molecules, and imbalance charges by Gasteiger charges while we added the polar hydrogens to the protein structures. Next, the 3D structures of the ligands (all the proposed compounds) were optimized by the Gaussian 09 software using a combination of Density Functional Theory (DFT) with Becke’s three Lee, Yang, Parr parameters (B3LYP) functional, together with a basis set 6–31G* to achieve the optimal structures of the molecules, after that, the structures of the ligands were converted to the PDBQT format using the AutoDockTool-1-5-6.The 3D grid configuration for the AutoDock was set to define the map size, where the total binding energy between the ligand and the SARS-CoV-2 protein is measured. We used a grid box with the dimensions 15×22×15 Å3, with its center located at x = –10.75, y = 12.46, z = 68.92, with spacing 0.375 Å between the grid points.
After preparing the protein and the ligand, we performed molecular docking using the AutoDock Vina program [32], where we determined the best position of the docked ligands with the appropriate protein considering their binding affinities. The most stable complexes represent the lower value of the binding score. Discovery Studio 2021 Software [33] was used to visualize the ligand-protein interaction.
3Results and discussions
After selecting the chemical descriptors to be used in our QSAR model by using the PCA technique and collecting the experimental values of the Anti-SARS-CoV-2 activities for the 39 derivative molecules as reported by Zhang et al. [10]. We built the QSAR model, represented in Equation 8:
(8)
NTest (number of test compounds) = 6 and NTraining (number of training compounds) = 33
With Statistical parameters: R2 = 0.805; R2adj = 0.777; RMSE = 0.042; p-value < 10- 4; F = 28.951
Generally, a QSAR model is considered predictive if the calculated values of R2, R2cv, are greater than 0.6 and 0.5 for R2adj [34]; hence, the robustness of the MLR model was confirmed based on the statistical performances obtained. Also, a low value of the mean square error (RMSE = 0.042) indicated that the predicted model is reliable and predictive. Then the high value of F-statistic (F = 28.951) signified that the model is statistically acceptable. Moreover, the p-value is less than 0.0001, implying that the model is statistically significant with a level greater than 95% .
Then, we carried out the internal validation by the leave-one-out cross-validation method, where the value of the cross-validation coefficient R2cv was higher than 0.5 (R2cv = 0.732), which indicated a good predictability of the pIC50 of the compounds of test set molecules in agreement with the experimentally determined value. According to Y-randomization, we ran 50 random trials. As a result, the cRp2 was estimated, confirming the strength of the built model, and the results are listed in Table 3.
Table 3
Random parameters values
| Parameters | values | Threshold value |
| R2cv | 0.732 | >0.500 |
| Average of 50 R2rand | 0.100 | <R2 |
| Average of 50 R2cvrand | –0.253 | <R2cv |
| cR2p | 0.758 | >0.500 |
The predicted and calculated pIC50 values are given in Table 4. The relationship between the observed activity values and the predicted values is shown in Fig. 2.
Table 4
Experimental pIC50 values for the 39 molecules used as training and test sets and corresponding predicted values based on the MLR-developed model
| Training set | Compounds | Activity (pIC50) | Compounds | Activity (pIC50) | ||
| Exp | Pred | Exp | Pred | |||
| 3 | 4,531 | 4,502 | 21 | 5,609 | 5,729 | |
| 4 | 5,043 | 4,749 | 22 | 5,008 | 5,155 | |
| 5 | 5,191 | 5,068 | 23 | 5,32 | 5,266 | |
| 6 | 4,714 | 4,903 | 24 | 4,989 | 5,204 | |
| 7 | 4,943 | 4,792 | 25 | 5,479 | 5,349 | |
| 8 | 4,068 | 4,448 | 26 | 5 | 4,962 | |
| 10 | 4,269 | 4,282 | 28 | 5,131 | 5,105 | |
| 11 | 4,23 | 4,308 | 29 | 5,28 | 5,127 | |
| 12 | 4,166 | 4,359 | 30 | 5,368 | 5,156 | |
| 13 | 5,248 | 4,971 | 31 | 5,565 | 5,301 | |
| 14 | 4,175 | 4,329 | 32 | 5,172 | 5,35 | |
| 15 | 4,446 | 4,493 | 33 | 5,556 | 5,214 | |
| 16 | 4,733 | 4,571 | 34 | 5,051 | 5,219 | |
| 17 | 4,849 | 4,816 | 35 | 5,177 | 5,203 | |
| 18 | 4,922 | 4,766 | 36 | 5,234 | 5,379 | |
| 19 | 4,859 | 4,815 | 38 | 5,082 | 5,568 | |
| 39 | 5,48 | 5,432 | – | – | – | |
| Test set | 1 | 4,214 | 4,265 | 20 | 5,069 | 5,464 |
| 2 | 4,481 | 4,356 | 27 | 4,95 | 5,187 | |
| 9 | 4,239 | 4,327 | 37 | 5,437 | 5,048 | |
Fig. 2
Correlation between the observed and predicted activity.
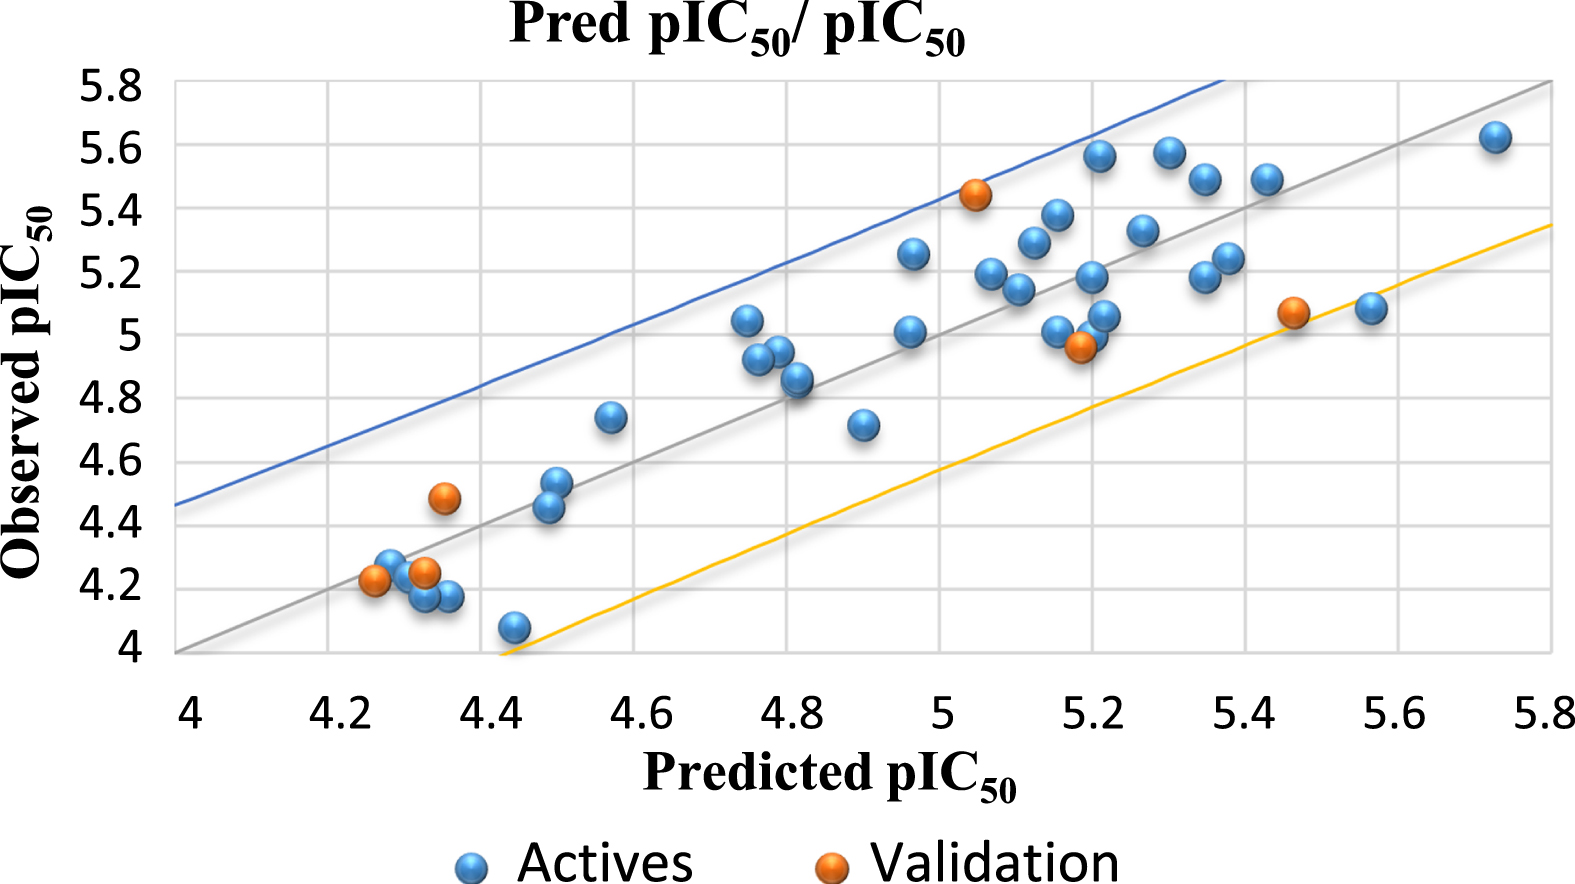
To evaluate the predictive power of the resulting model, the external validation was performed by calculating the coefficient of correlation R2 test. The concluded value of the R2 test is 0.731, greater than 0.6 [34]. Therefore, the external validation of the MLR model guarantees the robustness of the developed model to predict the pIC50.
Therefore, we can sum up that the model gives important information to predict new molecules with high activity against SARS-CoV-2. The model is a function of 4 molecular descriptors. The descriptors, Polar Surface Area PSA, HOMO- 1 energy (EHomo - 1), and the Gap energy EGAP are negatively influencing the activity, and the Molar Refractivity (MR) parameters are positively influencing the activity. The Molar Refractivity has a positive sign in the model, which suggests that the increased activity can be achieved by increasing the volume of the molecules.
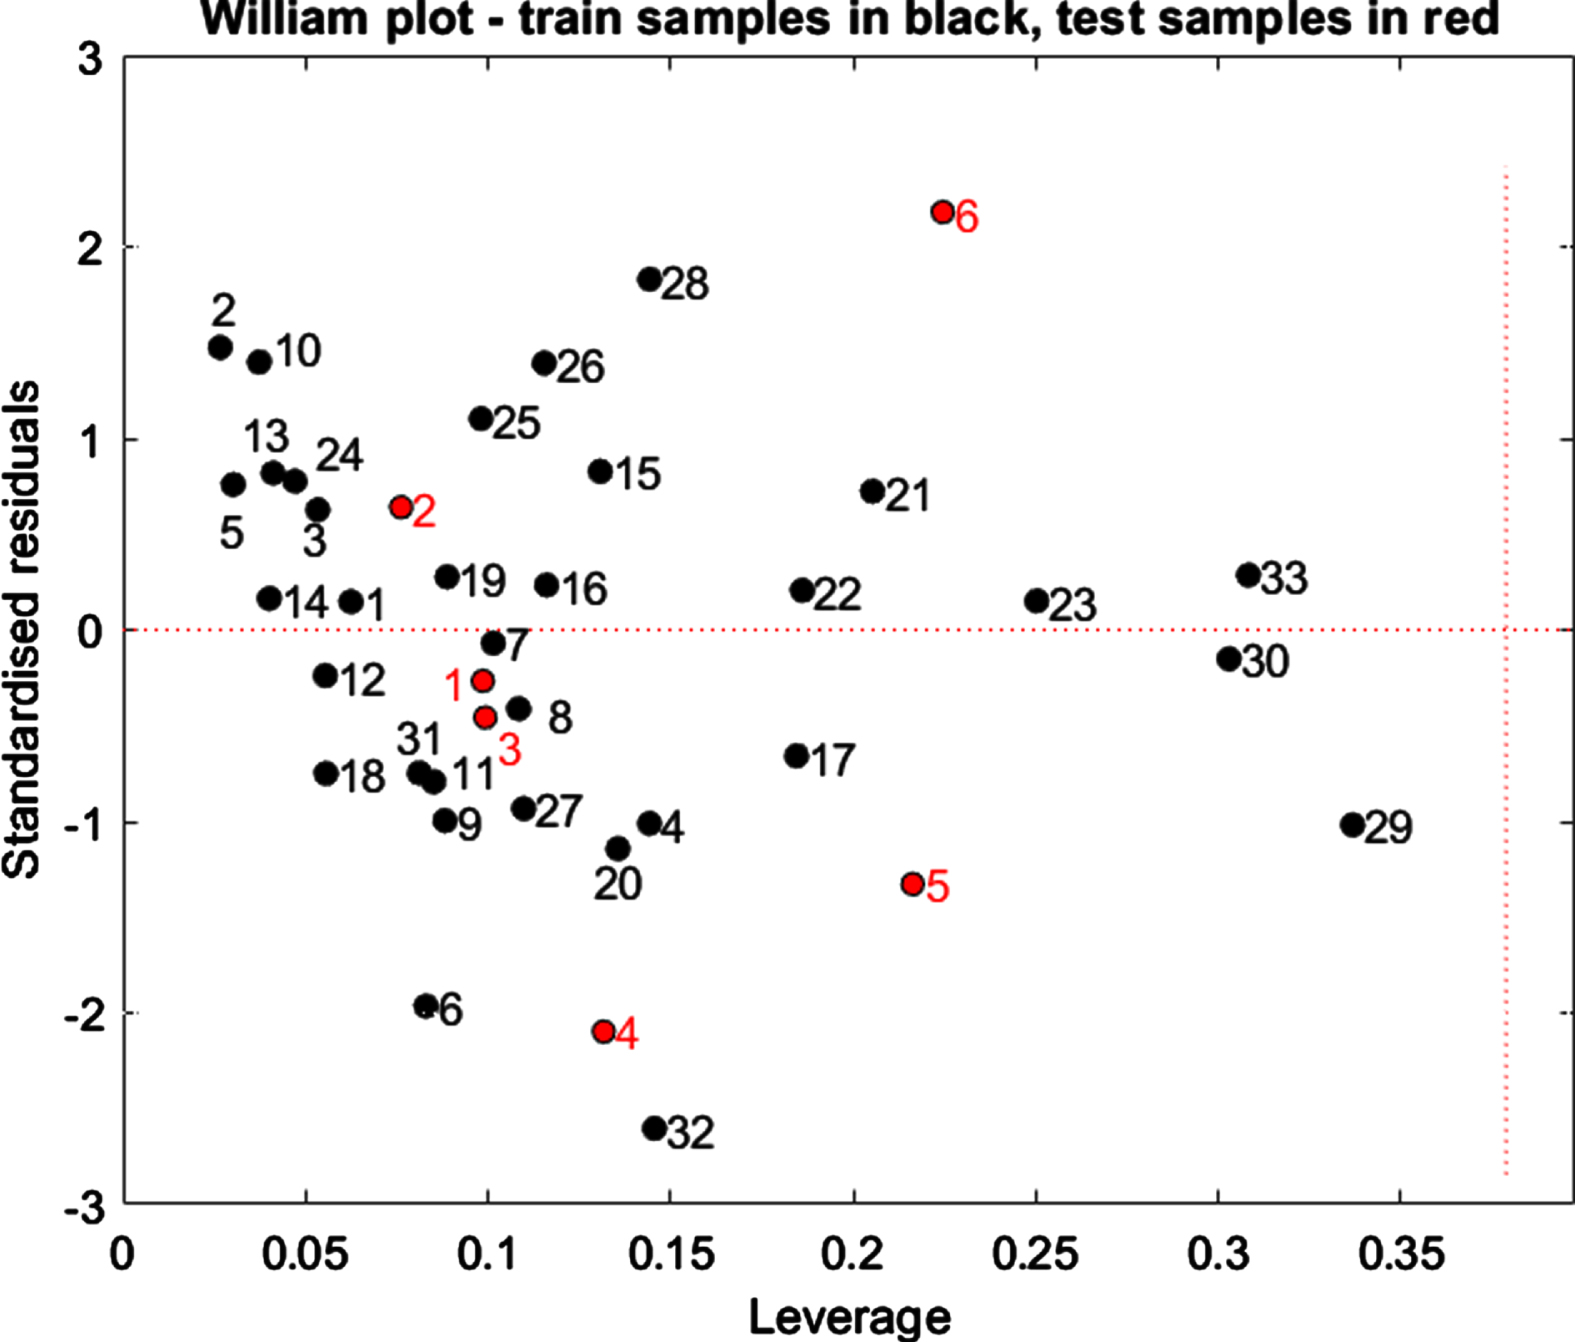
3.1Applicability domain
One of the most important aspects of QSAR modeling is defining the applicability domain (AD). Figure 3 shows the William Plot based on the MLR model results. Vertical dashed lines and horizontal dotted lines, respectively, have been used to indicate acceptable limits of structural similarity and inhibitory activity. The standardized residuals and leverage threshold values (h* = 0.378) were plotted to gain a better understanding of structural similarity and biological activity. The predicted activity value will be valid and correct only for compounds located to the left of the leverage threshold h*, while the molecules outside the applicability domain are not correctly predicted. h* value is calculated by using the following Equation (Equation 9)
Fig. 3
William plot for standardized residuals and leverage of the QSAR model generated using MLR methods.
(9)
n and k represent the number of training compounds and descriptors used in the model, respectively.
There are no outliers (h* = 0.378) among the compounds in the test set.
3.2The newly designed compounds
Based on the established model, the sign of each variable (descriptor) in the model, also their level of influence (Molar refractivity influence strongly on the SARS-CoV-2 activity). We proposed newly designed molecules with better activity. We began by modifying the structure of the high-activity compounds (Fig. 4) and attempting to increase the value of the molar refractivity by adding high molecular weight groups.
Fig. 4
Structure of the highly active compounds
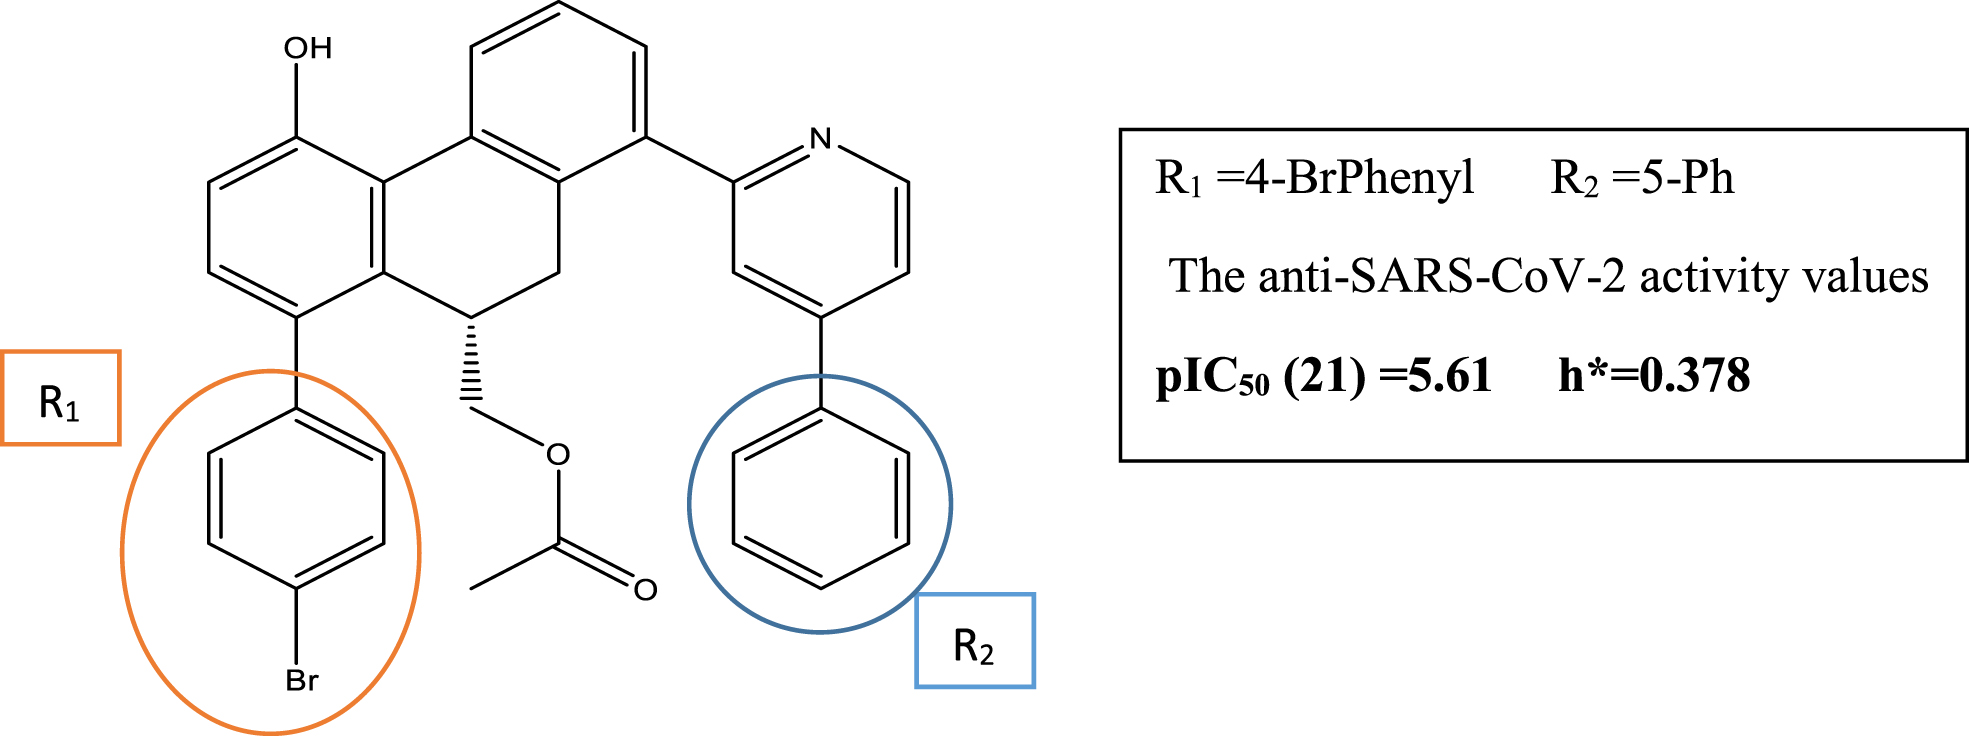
Table 5
List of the designed compounds
| \ | STRUCTURES | MR | PSA | E GAP | EHOMO- 1 | pIC50 | hi | Outlier/ | |
| R1 | R2 | Inside | |||||||
| C1 | 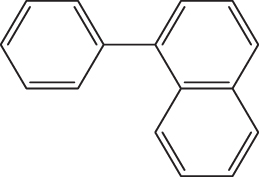 | 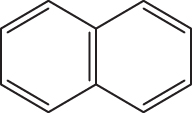 | 19.278 | 58.890 | 0.159 | –5.887 | 6.147 | 0.494 > h* | outlier |
| C2 |  | 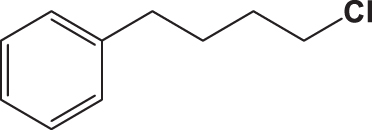 | 18.202 | 58.890 | 0.167 | –6.286 | 6.354 | 0.316 < h* | inside |
| C3 | 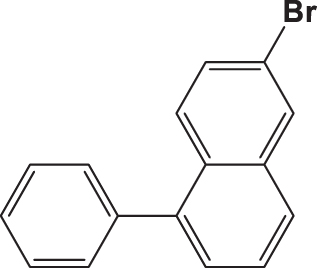 |  | 20.832 | 58.890 | 0.154 | –6.061 | 6.307 | 0.709 > h* | outlier |
| C4 | 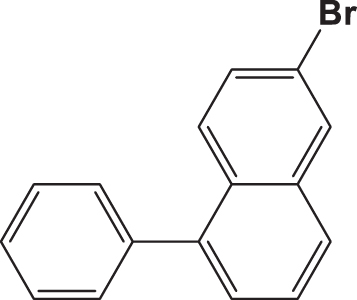 |  | 20.055 | 58.890 | 0.153 | –6.029 | 6.295 | 0.595 > h* | outlier |
| C5 |  |  | 17.711 | 58.890 | 0.168 | –6.127 | 6.235 | 0.291 < h* | inside |
| C6 |  |  | 20.260 | 58.890 | 0.154 | –6.078 | 6.319 | 0.618 > h* | outlier |
| C7 |  |  | 18,213 | 58,89 | 0,082 | –8,074 | 8,058 | 0,369 < h* | inside |
| C8 |  |  | 18,545 | 58,89 | 0,095 | –8,097 | 8,049 | 0,3469 < h* | inside |
| C9 |  |  | 17,889 | 58,89 | 0,101 | –8,097 | 7,827 | 0,3925 > h* | outlier |
Nine compounds were proposed at this phase, and we predicted their activity values. After that, we calculated their leverage values to detect the molecules that belong to the applicability domain. Table 5 represents the list of the designed molecules with the calculated values. Compared to the most active compounds, all designed compounds demonstrated excellent activities. Moreover, except for the compounds identified as out of the domain (C1, C3, C4, C6, and C9), four designed compounds (C2, C5, C7, and C8) fall within the applicability domain.
3.3Molecular docking results
A docking simulation was conducted to get detailed information about the most important interactions that influence anti-SARS-CoV-2 activity. We performed the docking analysis for the four designed compounds (C2, C5, C7, and C8) in the active site of the 6LU7 receptor, to get further information about ligand-receptor binding energy and explore the binding poses adopted by the ligands. The results obtained showed a good value of binding affinity, it represented a higher docking score of < -7 kcal/mol, which concludes that the tested ligands can form a stable complex with the protein. Table 6 shows the compounds with good binding affinity.
Table 6
The screened compounds’ binding energies toward 6LU7
| LU7 receptor | Compounds | C2 | C5 | C7 | C8 |
| Score (kcal/mol) | –8.4 | –8.1 | –8.8 | –8.8 |
3.4Protein-ligand interaction analysis
We defined the interaction between the protein and the ligand using the discovery studio. The analysis revealed that the high binding affinity of compound C1 (–8.4Kcal/mol) is due to the formation of Pi-Alkyl bonds with MET49, Pi-Sigma bonds with MET49, Pi-Cation bonds with HIS41, two carbon-hydrogen bonds with ARG188, THR190, carbon-hydrogen bonds with MET165 and Pi-Donor Hydrogen Bond with CYS145 at a distance of 4.41Å, 3.58Å, 4.91Å, 2.48Å, 2.97Å, 3.57Å, 4.18Å respectively. Furthermore, the C5 compounds also formed several interactions, including three conventional hydrogen bonds with THR190, GLN192, and MET165 at a distance of 3.07Å, 3Å, and 2.74Å respectively, Pi-Sigma bonds with MET49 at a distance of 3.52Å, Pi-Donor hydrogen bond with CYS145 at a distance of 4.17Å and 2 Pi-Sulfur bonds with MET49 at a distance of (5.93Å, 4.49Å). Also, binding analysis within the active site of 6LU7 indicated that the C7 forms three Conventional Hydrogen Bond with GLN189, PHE140, and GLU166 at distances 2.46 Å, 2.49 Å, 2.47Å, two Pi-Alkyl Bonds with MET165 at 4.64Å, 4.46Å, Pi-Sulfur with CYS145 at a distance of 5.77Å, Pi-Pi T-shaped with HIS41 at a distance of 4.98Å. Moreover, the interaction formed between the last ligand C8 and the amino acid of 6LU7 protein shows three Pi-alkyl bonds with MET165, LEU27, and CYS145 at a distance of 3.53Å, 4.46Å and 4Å respectively, Pi-cation bond with HIS41 at a distance of 4.46Å, and Carbon Hydrogen Bond with MET165 at a distance of 3.53Å. The existence of van der Waals forces between the ligand and followed residues (GLN192, GLN189, THR25, THR26, THR24, GLY143, ASN142, PRO168, LEU167, THR190, ARG188, HIS172, HIS163, ASP187, HIS164, LEU141, SER144 and ASN142, accounts for the obtained complexes’ high affinity. Which creates a robust environment, thus stabilizing the complex. Table 7 shows the interaction formed between the amino acids of the 6LU7 protein and the proposed ligand.
Table 7
2D structures of complexes formed between proposed compounds and 6LU7 protein
| N | Residues | Type | 2D-structure |
| C2 | MET49 | Conventional hydrogen bond | 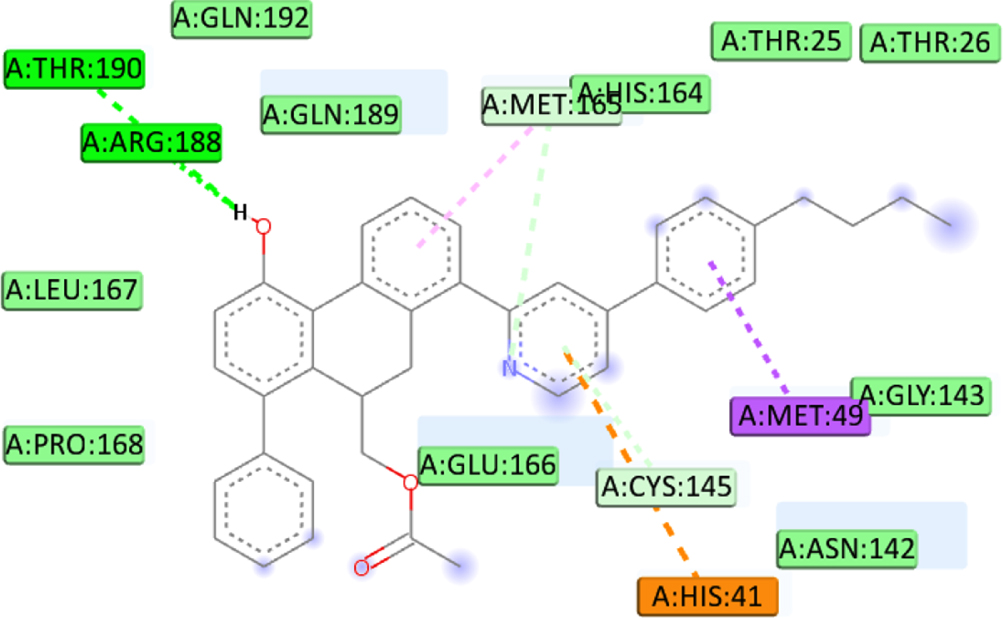 |
| HIS41 | Pi-Cation | ||
| ARG188 | Pi-Donor hydrogen bond | ||
| THR190 | Pi-Sigma | ||
| MET165 | Pi-Alkyl | ||
| CYS145 | |||
| C5 | GLN189 | Conventional hydrogen | 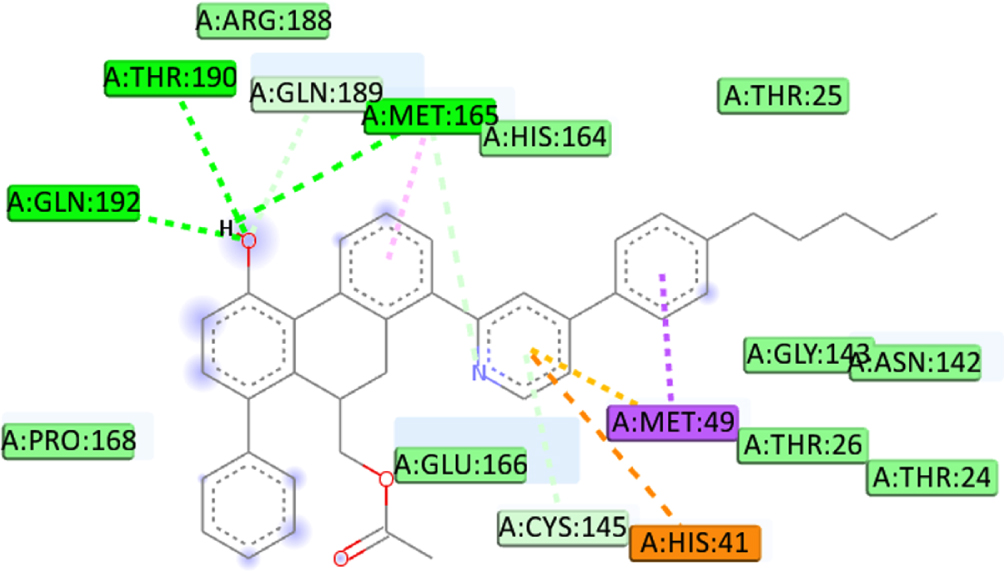 |
| CYS145 | Pi-Cation | ||
| HIS41 | Pi-Donor hydrogen bond | ||
| MET49 | Pi-Alkyl | ||
| THR190 | Pi-sulfur | ||
| GLN192 | Pi-Sigma | ||
| MET165 | |||
| C7 | CYS145 | Conventional hydrogen | 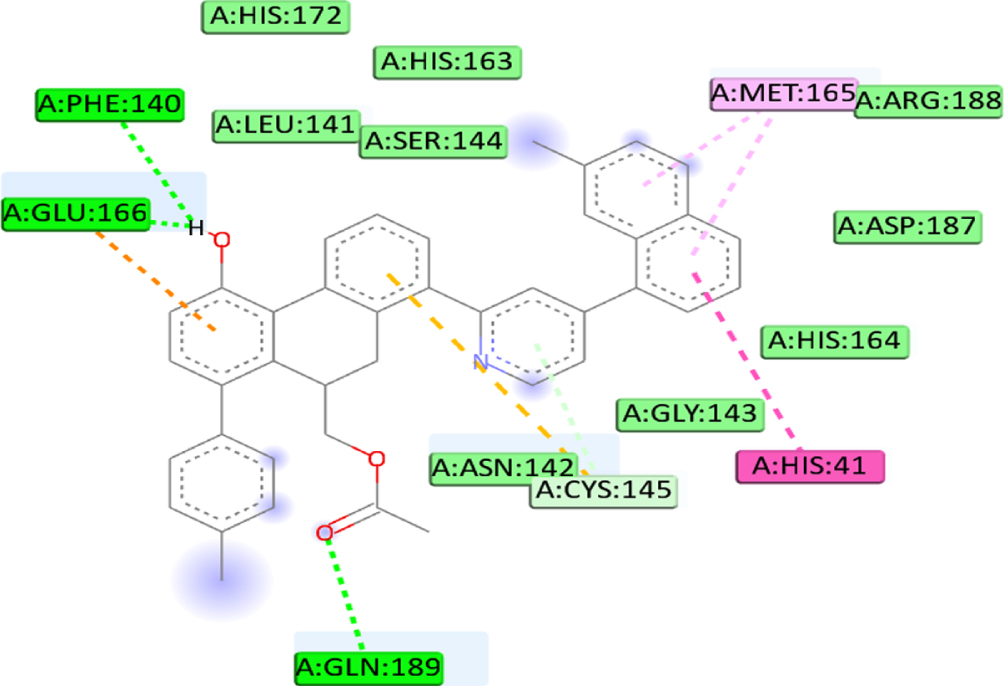 |
| HIS41 | Pi-Alkyl | ||
| MET165 | Pi-sulfur | ||
| PHE140 | Pi-Donor hydrogen bond | ||
| GLU166 | Pi-T-shaped | ||
| SER144 | |||
| GLN189 | |||
| C8 | LEU27 | Pi-Alkyl | 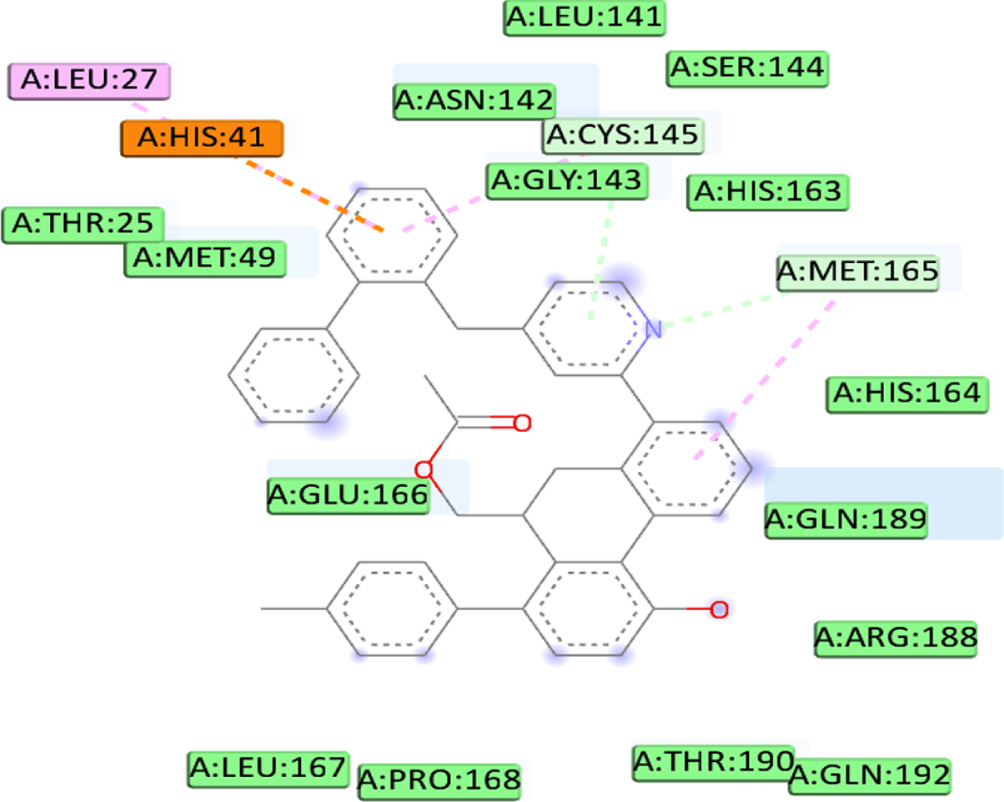 |
| HIS41 | Pi-cation | ||
| GLU166 | Carbon hydrogen bonds | ||
| GLY143 | |||
| CYS145 | |||
| MET165 |
3.5ADMET prediction
The Absorption, Distribution, Metabolism, Excretion, and Toxicity (ADMET) properties for the four predicted compounds (C2, C5, C7, C8) were generated using the pkCSM web server [35]. Table 8 present the predicted values for every single property.
Table 8
pkCSM webserver prediction of ADMET properties for the selected compounds
| Properties | Compounds | ||||
| C2 | C5 | C7 | C8 | ||
| Absorption | Intestinal absorption (human) | 99.731 | 96.671 | 100 | 100 |
| Distribution | Fraction unbound (human) | 0.325 | 0.298 | 0.357 | 0.365 |
| Distribution | VDss Human (log L/kg) | –1,237 | –1,238 | –0.825 | –0.674 |
| Metabolism | CYP1A2 inhibitor | No | No | No | Yes |
| Metabolism | CYP2C19 inhibitor | No | No | No | No |
| Metabolism | CYP2C9 inhibitor | No | No | No | No |
| Metabolism | CYP2D6 inhibitor | No | No | No | No |
| Metabolism | CYP3A4 inhibitor | No | No | No | No |
| Excretion | Renal OCT2 substrate | No | No | No | No |
| Toxicity | AMES toxicity | No | No | No | No |
| Toxicity | hERG I inhibitor | No | No | No | No |
| Toxicity | hERG II inhibitor | Yes | Yes | Yes | Yes |
| Toxicity | Hepatotoxicity | No | Yes | Yes | Yes |
In terms of the percentage of absorption by the human small intestines, all compounds represent a high absorption value (>90%) which indicates good absorption by the human intestine.
For the distribution, the steady-state volume (VDss) is considered low compared to the standard value (Log VDss < –0.15) for all the compounds. Also, the compounds represent a high value of the fraction unbound which shows that the predicted fraction of the compounds will be unbound to serum proteins. The distribution indices reported by all molecules indicated a good distribution capacity.
In terms of metabolism, cytochrome P450 (CYP) is an important enzyme that can activate drug metabolism. Therefore, it is indispensable to evaluate the ability of compounds to inhibit cytochromes (CYP). The server predicted that the compounds are not inhibitors for the different isoforms (CYP1A2, CYP2C19, CYP2C9, CYP2D6, and CYP3A4), only for the compounds C8 is an inhibitor for the CYP1A2 isoform. For the excretion, the predicted molecules are not a substrate for renal organic cation transporter 2. The contact with this transporter aids in the clearance of substances and may result in undesirable interactions; hence, a negative prediction is regarded as beneficial.
Finally, four indicators were employed to forecast the toxicity of the compounds. AMES toxicity is a test that determines if a chemical is carcinogenic, all of the compounds don’t represent any of the AMES toxicity. Inhibition of hERG I/II is the leading cause of fatal ventricular arrhythmia and has led to the discontinuation of several drugs. The server predicts that all the compounds are likely to be hERGII inhibitors. Hepatoxicity, reveals if the substance may interfere with the liver’s normal function. The server shows that only the compound C2 is not likely to be o be associated with the disrupted normal function of the liver.
4Conclusion
In this study, The MLR approach was used to thoroughly investigate and explain the 2D quantitative structure-activity relationship (2D-QSAR) for 9,10-dihydrophenanthrene derivatives to inhibit SARS-CoV-2 activity. As a consequence, we established a model based on the molecular descriptors of the 9,10-dihydrophenanthrenes derivatives that showed a strong capacity to impact the biological activity against SARS-CoV-2 (3CLpro). As a result, 9 new drug molecules were created based on the developed model and the structure of the compound n°21 the most bioactive compound (the greatest in vitro biological activity pIC50). The biological activity of designed compounds (pIC50) was then predicted using the selected model, and their non-covalent interaction with 3CLpro (PDB code: 6LU7) was determined by using molecular docking, and in silico pharmacokinetics, ADME characteristics, and toxicity were assessed for the retained molecules. The findings of this investigation showed that 4 compounds, had strong biological inhibitory activity (pIC50), diversity of non-covalent binding to 3CLpro, and acceptable pharmacokinetic appropriateness. Finally, we demonstrated that 4 small compounds modeled on 9,10-dihydrophenanthrene structures have the potential to operate as a viable non-covalent therapeutic candidate against COVID-19.
References
[1] | Hollett M. , Bell D. COVID-19, in Radiopaedia.org, Radiopaedia.org, 2020. doi: 10.53347/rID-73913. |
[2] | Ahmad S. A Review of COVID-19 (Coronavirus Disease-2019) Diagnosis, Treatments, and Prevention, Eurasian J Med Oncol 2020, doi: 10.14744/ejmo.2020.90853. |
[3] | W.H.O. World Health Organization “WHO Coronavirus (COVID-19) Dashboard, [https://covid19.who.int/table].” |
[4] | Mousazadeh Z. , Naghdali M. , Goldar Z.M. , Hashemi M. , El Din Mahmoud, A. , Al-Qodah, Z. , Sandoval, M.A. , Hashim, K.S. , Sillanpää, M. , Hussain, C. , Mustansar, E. , Mohammad, M. A review of deciphering the successes and learning from the failures in preventive and health policies to stop the COVID-19 pandemic. 2021. doi: 10.1016/B978-0-323-85780-2.00003-2. |
[5] | Wu T. , Kang S. , Peng W. , Zuo C. , Zhu Y. , Pan L. , Fu K. , You Y. , Yang X. , Luo X. , Jiang L. , Deng M. Original Hosts, Clinical Features, Transmission Routes, and Vaccine Development for Coronavirus Disease (COVID-19), Front Med 8: (2021) . doi: 10.3389/fmed.2021.702066. |
[6] | Zumla A. , Chan J.F.W. , Azhar E.I. , Hui D.S.C. , Yuen K.-Y. Coronaviruses — drug discovery and therapeutic options, Nat Rev Drug Discov 15: (5) ((2016) ) pp. 327–347. doi: 10.1038/nrd.2015.37. |
[7] | Woo P.C.Y. , Huang Y. , Lau S.K.P. , Yuen K.-Y. Coronavirus Genomics and Bioinformatics Analysis, Viruses 2: (8) ((2010) ), 1804–1820. doi: 10.3390/v2081803. |
[8] | Deshmukh M.G. , Ippolito J.A. , Zhang C. , Stone E.A. , Reilly R.A. , Miller S.J. , Jorgensen W.L. , Anderson K. Structure-guided design of a perampanel-derived pharmacophore targeting the SARS-CoV-2 main protease, Structure 29: (8) ((2021) ), pp. 823–833.e5. doi: 10.1016/j.str.2021.06.002. |
[9] | Anand K. , Ziebuhr J. , Wadhwani P. , Mesters J.R. , Hilgenfeld R. Coronavirus Main Proteinase (3CL pro) Structure: Basis for Design of Anti-SARS Drugs, Science (80-.) 300: (5626) ((2003) ), pp. 1763–1767. doi: 10.1126/science.1085658. |
[10] | Zhang J.W. , Xiong, Y. , Wang, F. , Zhang, F.M. , Yang, X. , Lin, G.Q. , Tian, P. , Ge G. , Gao, D. Discovery of 9,10-dihydrophenanthrene derivatives as SARS-CoV-2 3CLpro inhibitors for treating COVID-19, Eur J Med Chem 228: ((2022) )114030. doi: 10.1016/j.ejmech.2021.114030. |
[11] | Roy K. , Kar S. , Das R.N. Newer QSAR Techniques, in Understanding the Basics of QSAR for Applications in Pharmaceutical Sciences and Risk Assessment, Elsevier, 2015, pp. 319–356. doi: 10.1016/B978-0-12-801505-6.00009-0. |
[12] | Aouidate A. , Ghaleb A. , Chtita S. , Aarjane M. , Ousaa A. , Maghat H. , Sbai A. , Choukrad M. , Bouachrine M. , Lakhlifi T. Identification of a novel dual-target scaffold for 3CLpro and RdRp proteins of SARS-CoV-2 using 3D-similarity search, molecular docking, molecular dynamics and ADMET evaluation, J Biomol Struct Dyn 39: (12) ((2021) ), 4522–4535. doi: 10.1080/07391102.2020.1779130. |
[13] | Belhassan A. , Chtita S. , Zaki H. , Alaqarbeh M. , Alsakhen N. , Almohtaseb F. , Lakhlifi T. , Bouachrine M. In silico detection of potential inhibitors from vitamins and their derivatives compounds against SARS-CoV-2 main protease by using molecular docking, molecular dynamic simulation and ADMET profiling, J Mol Struct 1258: ((2022) ), 132652. doi: 10.1016/j.molstruc.2022.132652. |
[14] | Daoui O. , Elkhattabi S. , Chtita S. Rational identification of small molecules derived from 9,10-dihydrophenanthrene as potential inhibitors of 3CLpro enzyme for COVID-19 therapy: a computer-aided drug design approach, Struct Chem 33: (5) ((2022) ), 1667–1690. doi: 10.1007/s11224-022-02004-z. |
[15] | Fouedjou R.T. , Fogang H.P.D. , Ouassaf M. , Daoui O. , Abul Qais, F. , Elkhattabi, S. , Bakhouch, S. , Belaidi F. , Chtita, S. TARGETING THE MAIN PROTEASE AND THE SPIKE PROTEIN OF SARS-COV-2 WITH NATURALLY OCCURRING COMPOUNDS FROM SOME CAMEROONIAN MEDICINAL PLANTS: AN IN-SILICO STUDY FOR DRUG DESIGNING, J Chil Chem Soc 67: (3) ((2022) ), 5602–5614. doi: 10.4067/S0717-97072022000305602. |
[16] | Guidance Document on the Validation of (Quantitative) Structure-Activity Relationship [(Q)SAR] Models. OECD, 2014. doi:10.1787/9789264085442-en. |
[17] | Chemoffice, scientific personal productivity tools-PerkinElmer Informatics, [Online]. Available: https://www.cambridgesoft.com/Ensemble_for_Chemistry/details/Default.aspx?fid=16 |
[18] | Gaussian 09, Revision A.02 Frisch, M.J. , Trucks, G. W. , Schlegel, H. B. , Scuseria, G. E. , Robb, M. A. , Cheeseman, J. R. et al. https://gaussian.com/g09citation/ [Online]. Available: https://gaussian.com/g09citation/. |
[19] | Jolliffe I. Principal Component Analysis, in Encyclopedia of Statistics in Behavioral Science, Chichester, UK: John Wiley & Sons, Ltd, 2005. doi: 10.1002/0470013192.bsa501. |
[20] | “XLSTAT, https://www.xlstat.com/fr/”, [Online]. Available: https://www.xlstat.com/fr/. |
[21] | Golbraikh A. , Tropsha A. Beware of q2!, J Mol Graph Model 20: (4) ((2002) ), 269–276. doi: 10.1016/S1093-3263(01)00123-1. |
[22] | Netzeva T.I. , Worth A.P. , Aldenberg T. , Benigni R. , Cronin M.T.D. , Gramatica P. , Jaworska J.S. , Kahn S. , Klopman G. , Marchant C.A. , Myatt G. , Nikolova-Jeliazkova N. , Patlewicz G.Y. , Perkins R. , Roberts D.W. , Schultz T.W. , Stanton D.T. , van de Sandt, J.J.M. , Tong, W. , Veith G. , Yang, C. Current Status of Methods for Defining the Applicability Domain of (Quantitative) Structure-Activity Relationships, Altern to Lab Anim 33: (2) ((2005) ), 155–173. doi: 10.1177/026119290503300209. |
[23] | “(OECD) validation of qsar models”, [Online]. Available: https://www.oecd.org/chemicalsafety/risk-assessment/validationofqsarmodels.htm. |
[24] | Roy K. , Kar S. , Das R.N. Validation of QSAR Models, in Understanding the Basics of QSAR for Applications in Pharmaceutical Sciences and Risk Assessment, Elsevier, 2015, pp. 231–289. doi: 10.1016/B978-0-12-801505-6.00007-7. |
[25] | Gramatica P. Principles of QSAR models validation: internal and external, QSAR Comb Sci 26: (5) ((2007) ), 694–701. doi: 10.1002/qsar.200610151. |
[26] | “Matlab, https://www.mathworks.com/products/matlab.html”, [Online]. Available: https://www.mathworks.com/products/matlab.html. |
[27] | Guan L. , Yang H. , Cai Y. , Sun L. , Di P. , Li W. , Liu G. , Tang Y. ADMET-score –a comprehensive scoring function for evaluation of chemical drug-likeness, Medchemcomm 10: (1) ((2019) ), 148–157. doi: 10.1039/C8MD00472B. |
[28] | “pkCSM, https://biosig.lab.uq.edu.au/pkcsm/”, [Online]. Available: https://biosig.lab.uq.edu.au/pkcsm/. |
[29] | Chtita S. , Belhassan A. , Aouidate A. , Belaidi S. , Bouachrine M. , Lakhlifi T. Discovery of Potent SARS-CoV-2 Inhibitors from Approved Antiviral Drugs via Docking and Virtual Screening, Comb Chem High Throughput Screen 24: (3) ((2021) ), pp. 441–454. doi: 10.2174/1386207323999200730205447. |
[30] | Morris G.M. , Lim-Wilby M. Molecular Docking, 2008, pp. 365–382. doi: 10.1007/978-1-59745-177-2_19. |
[31] | Morris G.M. , Huey R. , Lindstrom W. , Sanner M.F. , Belew R.K. , Goodsell D.S. , Olson A.J. AutoDock4 and AutoDockTools4: Automated docking with selective receptor flexibility, J Comput Chem 30: (16) ((2009) ), 2785–2791. doi: 10.1002/jcc.21256. |
[32] | Trott O. , Olson A.J. AutoDock Vina: Improving the speed and accuracy of docking with a new scoring function, efficient optimization, and multithreading, J Comput Chem pp. NA–NA, 2009, doi: 10.1002/jcc.21334. |
[33] | “Dassault systeme BIOVIA discovery studio, https://www.3ds.com/products-services/biovia/products/molecularmodeling-simulation/biovia-discovery-studio/”, [Online]. Available: https://www.3ds.com/products-services/biovia/products/molecular-modeling-simulation/biovia-discovery-studio/. |
[34] | Tropsha A. Best Practices for QSAR Model Development, Validation, and Exploitation, Mol Inform 29: (6–7) pp. 476–488, Jul. 2010, doi: 10.1002/minf.201000061. |
[35] | Pires D.E.V. , Blundell T.L. , Ascher D.B. pkCSM: Predicting Small-Molecule Pharmacokinetic and Toxicity Properties Using Graph-Based Signatures, J Med Chem 58: (9) ((2015) ), pp. 4066–4072. doi: 10.1021/acs.jmedchem.5b00104. |


