
Everolimus Exposure as a Predictor of Toxicity in Renal Cell Cancer Patients in the Adjuvant Setting: Results of a Pharmacokinetic Analysis for SWOG S0931 (EVEREST), a Phase III Study (NCT01120249)
Abstract
Background:
S0931 is assessing recurrence-free survival in renal cell carcinoma (RCC) patients randomized to receive everolimus (EVE) versus placebo for one year following nephrectomy. Due to a higher than expected dropout rate, we assessed EVE trough levels in the adjuvant setting to evaluate the relationship between EVE exposure and probability of toxicity.
Methods:
Patients received 10 mg daily EVE for nine 6-week cycles. Pre-dose whole blood samples were collected pre-cycle 2 and pre-cycle 3 and analyzed for EVE. Patients with pre-cycle 2 and/or pre-cycle 3 EVE results were used in the analysis. Patients were segregated into quartiles (Q) based on EVE levels and logistic regression was used to model the most common adverse event outcomes using EVE trough as a predictor. Hazard and odds ratios were adjusted for age, BMI and performance status.
Results:
A total of 467 patients were included in this analysis. Quartiles normalized to an EVE dose of 10 mg/day were < 9.0, 9.0–12.9, 12.9–22.8, and > 22.8 ng/mL, respectively. EVE trough levels increased with increasing age (p < 0.001). Furthermore, EVE trough levels were higher in men than women (19.4 versus 15.4 ng/mL, p = 0.01). Risk of grade 2 + triglycerides was increased in Q2 and Q3 vs Q1 (OR = 2.08; p = 0.02 and OR = 2.63; p = 0.002). Risk of grade 2 + rash was increased in Q2 and Q4 vs Q1 (OR = 2.99; p = 0.01 and OR = 2.90; p = 0.02). There was also an increased risk of any grade 3 + tox in Q2 vs Q1 (OR = 1.71; p = 0.05).
Conclusions:
We identified significant gender and age-related differences in EVE trough levels in patients receiving adjuvant treatment for RCC. Furthermore, our analysis identified significant associations between EVE exposure and probability of toxicity.
INTRODUCTION
The mTOR inhibitor everolimus (EVE) was originally developed for its immunosuppressant properties in the prevention of rejection after solid-organ transplantation. Based on positive effects on progression free survival in the pivotal Phase III study [1], EVE received FDA approval in 2009 for treatment of patients with advanced RCC following treatment failure with sunitinib or sorafenib. Although EVE has improved outcomes in patients with advanced RCC, its use is associated with several common adverse events that represent a challenge to the clinician [2]. Notably, metabolic disturbances such as hyperglycemia and hyperlipidemia, along with the mucositis/stomatitis and pneumonitis have been commonly reported [3]. Rates of EVE treatment interruption and dose reduction due to toxicity are reported to be as high as 64% [4].
Because EVE has been shown to improve progression-free survival in advanced RCC, it is appropriate to study this active agent in the adjuvant setting. EVE also has the advantage of oral dosing, making it most suitable to chronic daily dosing. However, chronic EVE dosing has not been previously studied in an adjuvant cancer population. Due to the relatively high incidence of EVE-associated adverse events, careful assessment of the tolerability of chronic dosing is required. In April of 2011, the Southwest Oncology Group initiated a randomized, double-blind, placebo controlled Phase III trial evaluating one year of adjuvant EVE therapy in post-nephrectomy RCC patients. In addition to evaluating recurrence-free survival, a secondary objective is to understand the frequency and severity of toxicity in this population.
The published literature on EVE steady-state pharmacokinetics and chronic toxicity has largely been in the post-transplant setting in which it has been co-administered with other immunosuppressant drugs as part of triple-therapy rejection prophylaxis [5]. The applicability of this toxicity data to the adjuvant renal carcinoma population is confounded by potential contribution of co-administered immunosuppressants and other factors unique to the post-transplant setting. The adjuvant renal carcinoma setting involves a patient population with curative potential. Therefore, mTOR inhibitor-associated side effects with the potential for long-term implications, such as hyperlipidemia and immunosuppression, are of particular concern, especially with chronic daily dosing [6].
In renal transplantation patients, a relationship has been reported between EVE area-under-the-curve (AUC) and both thrombocytopenia and metabolic toxicities [5]. This has led to the routine clinical practice of therapeutic drug monitoring (TDM). Because EVE trough levels have been shown to be closely correlated with the AUC, trough level monitoring has become an acceptable surrogate measure of overall everolimus exposure [7]. In the post-transplantation setting, EVE trough levels are recommended to be maintained in the desired range of 3 to 8 ng/mL to optimize efficacy and decrease the incidence of adverse reactions, but trough levels of up to 15 ng/mL are associated with manageable toxicity [6, 8]. Although the target exposure range for EVE has not been established in cancer patients, a recently published study of advanced cancer patients receiving 10 mg daily found that EVE trough levels above 26.3 ng/mL were associated with a 4-fold increased risk of toxicity, while levels below 11.9 ng/mL were associated with a 3-fold increased risk of progression [9].
On the current SWOG 0931 study, steady-state trough blood samples were prospectively collected from patients during the first 2 cycles of therapy. The goal of this analysis was to evaluate the relationship between measured EVE exposure and the incidence of the most common EVE-associated toxicities.A potential association between EVE trough levels and disease free survival will also be explored once the data are mature and the study is unblinded. It may ultimately be possible to define an EVE target range that can be applied in a TDM approach to minimize the risk of toxicity and maximize the probability of survival in the RCC adjuvant setting.
PATIENTS AND METHODS
Patients and treatment
Patients with histologically or pathologically confirmed RCC considered to be intermediate or high risk and who had undergone full surgical resection including removal of all positive lymph nodes were eligible. Subjects were randomized to receive EVE 10 mg/day or placebo for nine 6-week cycles. Dose reductions were allowed for toxicity and included 5 mg/day (Dose Level -1) and 5 mg every other day (Dose Level -2). Once the dose was reduced, patients continued on the same dose and no dose escalations were allowed. Treatment was discontinued if EVE was withheld for > 21 days for pneumonitis or > 28 days for any other reason.
Once EVE treatment was initiated, toxicity assessments were performed weekly during the first cycle and then at the start of each subsequent cycle. Weekly toxicity assessments could be performed by phone during the first cycle for weeks when a physical exam was not required. Toxicity grading was performed using the NCI Common Terminology Criteria for Adverse Events (CTCAE) version 4.0.
For assessment of EVE trough levels, pre-dose blood samples were collected pre-cycle 2 and pre-cycle 3. Prior to their scheduled appointments, patients were instructed not to take their daily EVE dose until after their blood was drawn in the clinic. Five milliliters of whole blood was collected in plastic purple-top EDTA tubes and tubes were stored frozen at – 20°C until subsequent batch analysis. Whole blood concentrations of EVE were analyzed using LC-MS/MS as previously described [10].
Statistical methods
Patients with pre-cycle 2 and/or pre-cycle 3 EVE measurements were used in the analysis. When both trough levels were available, the results were averaged. Samples with an EVE concentration below the lower limit of detection for the assay (0.25 ng/mL) were excluded. Furthermore, samples where the EVE dose at end of the previous cycle was reported to be “0 mg” were excluded. Patients who were not assessable for toxicity were also excluded. For each time point, raw EVE measurements were normalized to a dose 10 mg/day based on the steady-state dose reported at end of the previous cycle. Patients were segregated into quartiles (Q) based on EVE levels and logistic regression was used to model the following adverse event outcomes using EVE trough as a predictor; any grade 3 + toxicity, grade 2 + hypertriglyceridemia, grade 2 + hyperglycemia, grade 2 + oral mucositis, and grade 2 + rash (maculo-papular, acneiform, or pustular). Cox proportional hazards regression was used to assess time to premature stopping of EVE. Hazard and odds ratios were adjusted for age, BMI and performance status.
RESULTS
Everolimus pharmacokinetics
This study reached its accrual goal and was closed to enrollment in September 2016 with 1545 total patients, 775 randomized to the EVE arm. A total of 467 patients had pre-cycle 2 and/or pre-cycle 3 EVE trough measurement and were included in this analysis. The median EVE trough was 12.8 ng/mL (range 3.1, 75.6) per 10 mg dose. EVE trough quartile ranges are summarized in Table 1. Of the 467 patients, 129 (28%) had their doses reduced prior to the pre-cycle 2 and/or pre-cycle 3 EVE trough sample. Quartile ranges normalized to an EVE dose of 10 mg/day were < 9.0, 9.0–12.9, 12.9–22.8, and > 22.8 ng/mL, respectively.
Table 1
EVE average trough quartiles normalized to a dose of 10 mg/day
| Quartile | No. of Subjects | Range (ng/mL per 10 mg) |
| 1 | 117 | <9.0 |
| 2 | 117 | 9.0–12.9 |
| 3 | 116 | 12.9–22.8 |
| 4 | 117 | >22.8 |
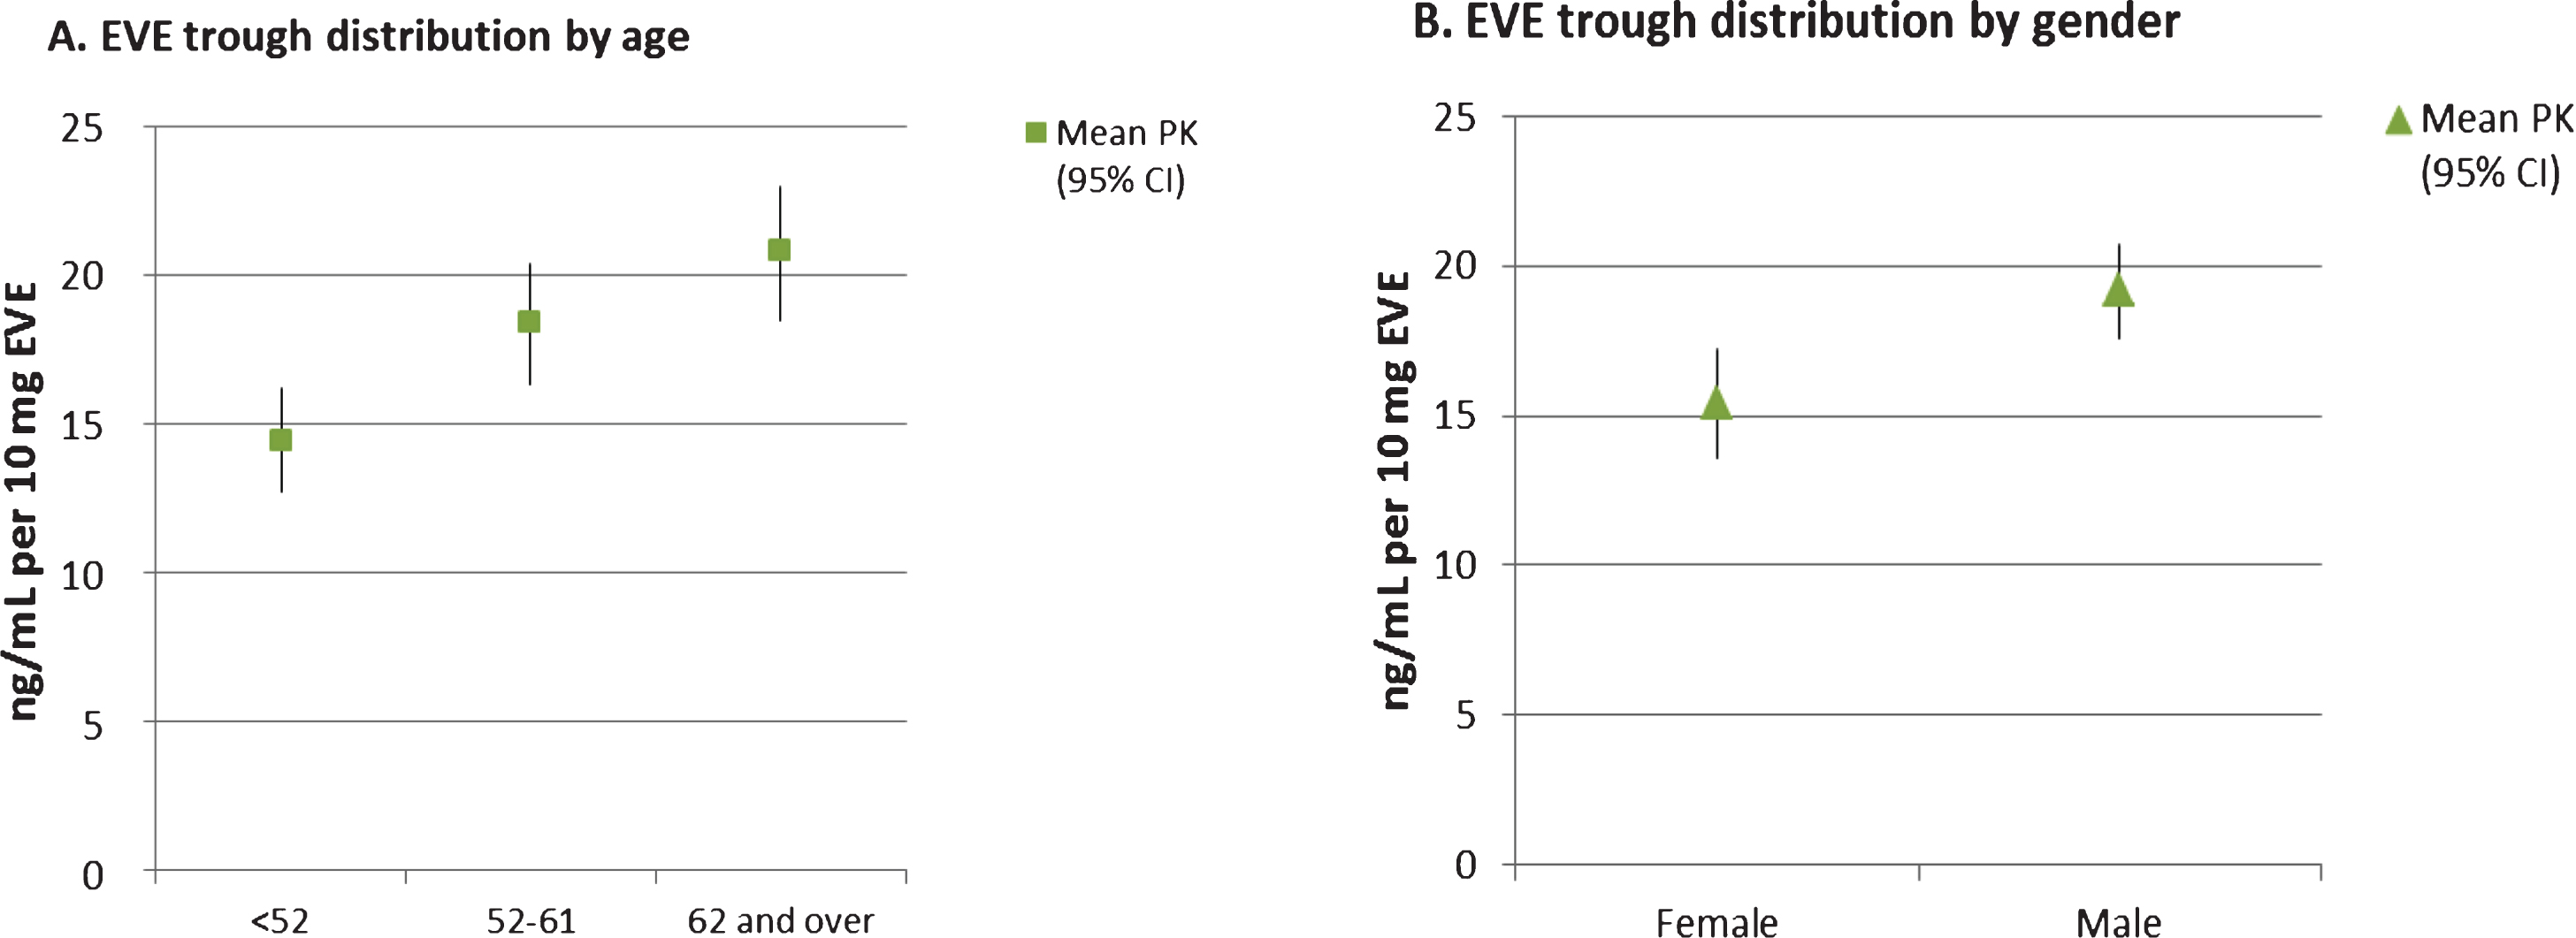
The clinical characteristics of the patients included in this sub-study were compared with those who were not included due to missing EVE trough levels and no notable differences were found. Table 2 summarizes EVE trough results by key demographic features. As shown in the table and depicted in Fig. 1A, there was a significant positive association between increasing age and EVE trough levels (p < 0.001). EVE trough concentrations normalized to a dose of 10 mg/day in patients under 52 years, 52–61 years and over 62 years were 14.4 (1.7, 70.5), 18.4 (0.5, 60.7), and 20.8 (0.3, 75.6) ng/mL, respectively. Furthermore, men had significantly higher normalized EVE trough levels than women (19.4 versus 15.4 ng/mL, p = 0.01). There was also a trend towards increasing EVE trough with increasing disease stage, but this was not significant (p = 0.09)
Table 2
Patient characteristics from the everolimus arm with averaged pre-cycle 2 and pre-cycle 3 EVE troughs normalized to a dose of 10 mg/day
| Baseline Patient Characteristics | N = 467 | ADJUSTEDa | p-valueb | |
| (ng/mL per 10 mg) | ||||
| (mean, range) | ||||
| Age | under 52 | 31% | 14.4 (1.7, 70.5) | <0.001 |
| 52–61 | 33% | 18.4 (0.5, 60.7) | ||
| 62 and over | 36% | 20.8 (0.3, 75.6) | ||
| Race | White | 93 % | 18.1 (0.3, 75.6) | 0.42 |
| Other | 7 % | 16.4 (5.0, 60.7) | ||
| Gender | Male | 69 % | 19.2 (1.8, 75.6) | 0.01 |
| Female | 31 % | 15.4 (0.3, 70.5) | ||
| BMI | Normal | 18 % | 18.5 (0.5, 61.5) | 0.71 |
| Overweight | 35 % | 18.0 (3.1, 65.0) | ||
| Obese | 47 % | 17.8 (0.3, 75.6) | ||
| Risk Group | Intermediate high risk | 44 % | 17.3 (0.3, 70.5) | 0.84 |
| Very high risk | 56 % | 18.5 (1.7, 75.6) | ||
| Histology | Clear cell | 81 % | 18.0 (0.3, 75.6) | 0.98 |
| Non-clear cell | 19 % | 18.0 (1.7, 57.1) | ||
| Performance Status | 0 | 79 % | 17.8 (0.5, 70.5) | 0.47 |
| 1 | 21 % | 18.7 (0.3, 75.6) | ||
| Extent of surgical resection | Radical nephrectomy | 91 % | 17.9 (0.3, 75.6) | 0.37 |
| Partial nephrectomy | 9 % | 19.1 (2.9, 50.1) | ||
| Invasion of renal vein | Yes | 34 % | 17.6 (1.8, 61.5) | 0.93c |
| No | 58 % | 18.4 (0.3, 75.6) | ||
| Unknown | 8 % | 16.5 (5.3, 55.9) | ||
| Stage | pTX, pT0, pT1a | <1 % | 14.2 (3.7, 23.1) | 0.09d |
| pT1b | 8 % | 15.0 (4.2, 47.4) | ||
| pT2a | 11 % | 16.4 (0.3, 40.6) | ||
| pT2b | 8 % | 17.2 (4.9, 57.1) | ||
| pT3a | 54 % | 18.9 (0.5, 75.6) | ||
| pT3an | 10 % | 17.6 (2.9, 53.3) | ||
| pT3b-c | 6 % | 18.1 (1.8, 51.0) | ||
| pT4 | 2 % | 20.0 (7.6, 55.6) | ||
| Regional lymph nodes | pN0 | 31 % | 19.2 (3.1, 68.7) | 0.15e |
| pNX | 61 % | 17.6 (0.3, 75.6) | ||
| pN+ | 8 % | 16.3 (1.7, 61.5) | ||
| Histologic grade | GX | 2 % | 16.9 (1.7, 51.7) | 0.61 f |
| G1 | 2 % | 13.3 (0.5, 38.7) | ||
| G2 | 24 % | 18.0 (0.3, 70.5) | ||
| G3-4 | 72 % | 18.1 (1.8, 75.6) | ||
aaveraged pre-cycle 2 and pre-cycle 3 samples, adjusted for EVE dose at time of collection. bKruskal-Wallis test. cpatients with unknown invasion of renal vein were excluded from this test. dpatients with pTX, pT0, pT1a were excluded from this test, remaining patients were grouped into categories: pT1/pT2 and pT3/pT4. epN0 combined with pNX in this test. fpatients with GX were excluded from this test.
Fig.1
Mean EVE trough versus age (panel A) and gender (panel B). Symbols are the mean EVE trough values normalized to a dose of 10 mg/day. Bars indicate the 95% confidence intervals.
EVE trough-toxicity analyses
The rates for the most common EVE-associated adverse events are summarized in Table 3. The percentage of patients with any grade 3 + toxicity, grade 2 + hypertriglyceridemia, grade 2 + hyperglycemia, grade 2 + oral mucositis, and grade 2 + rash were 41% (193/467), 30% (141/467), 14% (64/467), 33% (152/467), and 13% (62/467), respectively. The percentage of patients prematurely stopping EVE for any reason was 39% (172/441).
Table 3
Association of EVE troughs and adverse events and premature stopping
| Reference group = Q1 | |||
| Logistic Regression Outcome | Quartile | OR (95% CI)* | p-value* |
| Any toxicity Grade 3 + | 1 | REF | REF |
| Event rate: 41% (193/467) | 2 | 1.71 (1.01, 2.92) | 0.05 |
| Chi-square (df = 3) testp = 0.004 | 3 | 1.51 (0.88, 2.60) | 0.13 |
| 4 | 0.68 (0.39, 1.20) | 0.18 | |
| Hypertriglyceridemia Grade 2 + | 1 | REF | REF |
| Event rate: 30% (141/467) | 2 | 2.08 (1.40, 3.78) | 0.02 |
| Chi-square (df = 3) testp = 0.007 | 3 | 2.63 (0.45, 4.78) | 0.002 |
| 4 | 1.38 (0.74, 2.59) | 0.31 | |
| Hyperglycemia Grade 2 + | 1 | REF | REF |
| Event rate: 14% (64/467) | 2 | 1.32 (0.61, 2.85) | 0.49 |
| Chi-square (df = 3) test p = 0.53 | 3 | 0.73 (0.31, 1.70) | 0.47 |
| 4 | 1.12 (0.50, 2.50) | 0.79 | |
| Oral mucositis Grade 2 + | 1 | REF | REF |
| Event rate: 33% (152/467) | 2 | 0.99 (0.58, 1.71) | 0.99 |
| Chi-square (df = 3) test p = 0.87 | 3 | 0.84 (0.48, 1.46) | 0.53 |
| 4 | 0.85 (0.49, 1.48) | 0.56 | |
| Combined rash Grade 2+ (maculo-papular, acneiform, pustular) | 1 | REF | REF |
| 2 | 2.99 (1.26, 7.09) | 0.01 | |
| Event rate: 13% (62/467) | 3 | 1.77 (7.0, 4.48) | 0.23 |
| Chi-square (df = 3) test p = 0.05 | 4 | 2.90 (1.21, 6.97) | 0.02 |
| PH regression Outcome | Quartile | Hazard Ratio (95% CI)* | p-value* |
| Premature stopping of EVEa | 1 | REF | REF |
| Event rate: 39% (172/441) | 2 | 1.06 (0.68, 1.65) | 0.79 |
| Chi-square (df = 3) test p = 0.48 | 3 | 1.03 (0.65, 1.61) | 0.91 |
| 4 | 1.34 (0.87, 2.06) | 0.18 | |
aPercentage of patients prematurely stopping EVE for any reason excepta death or progression.
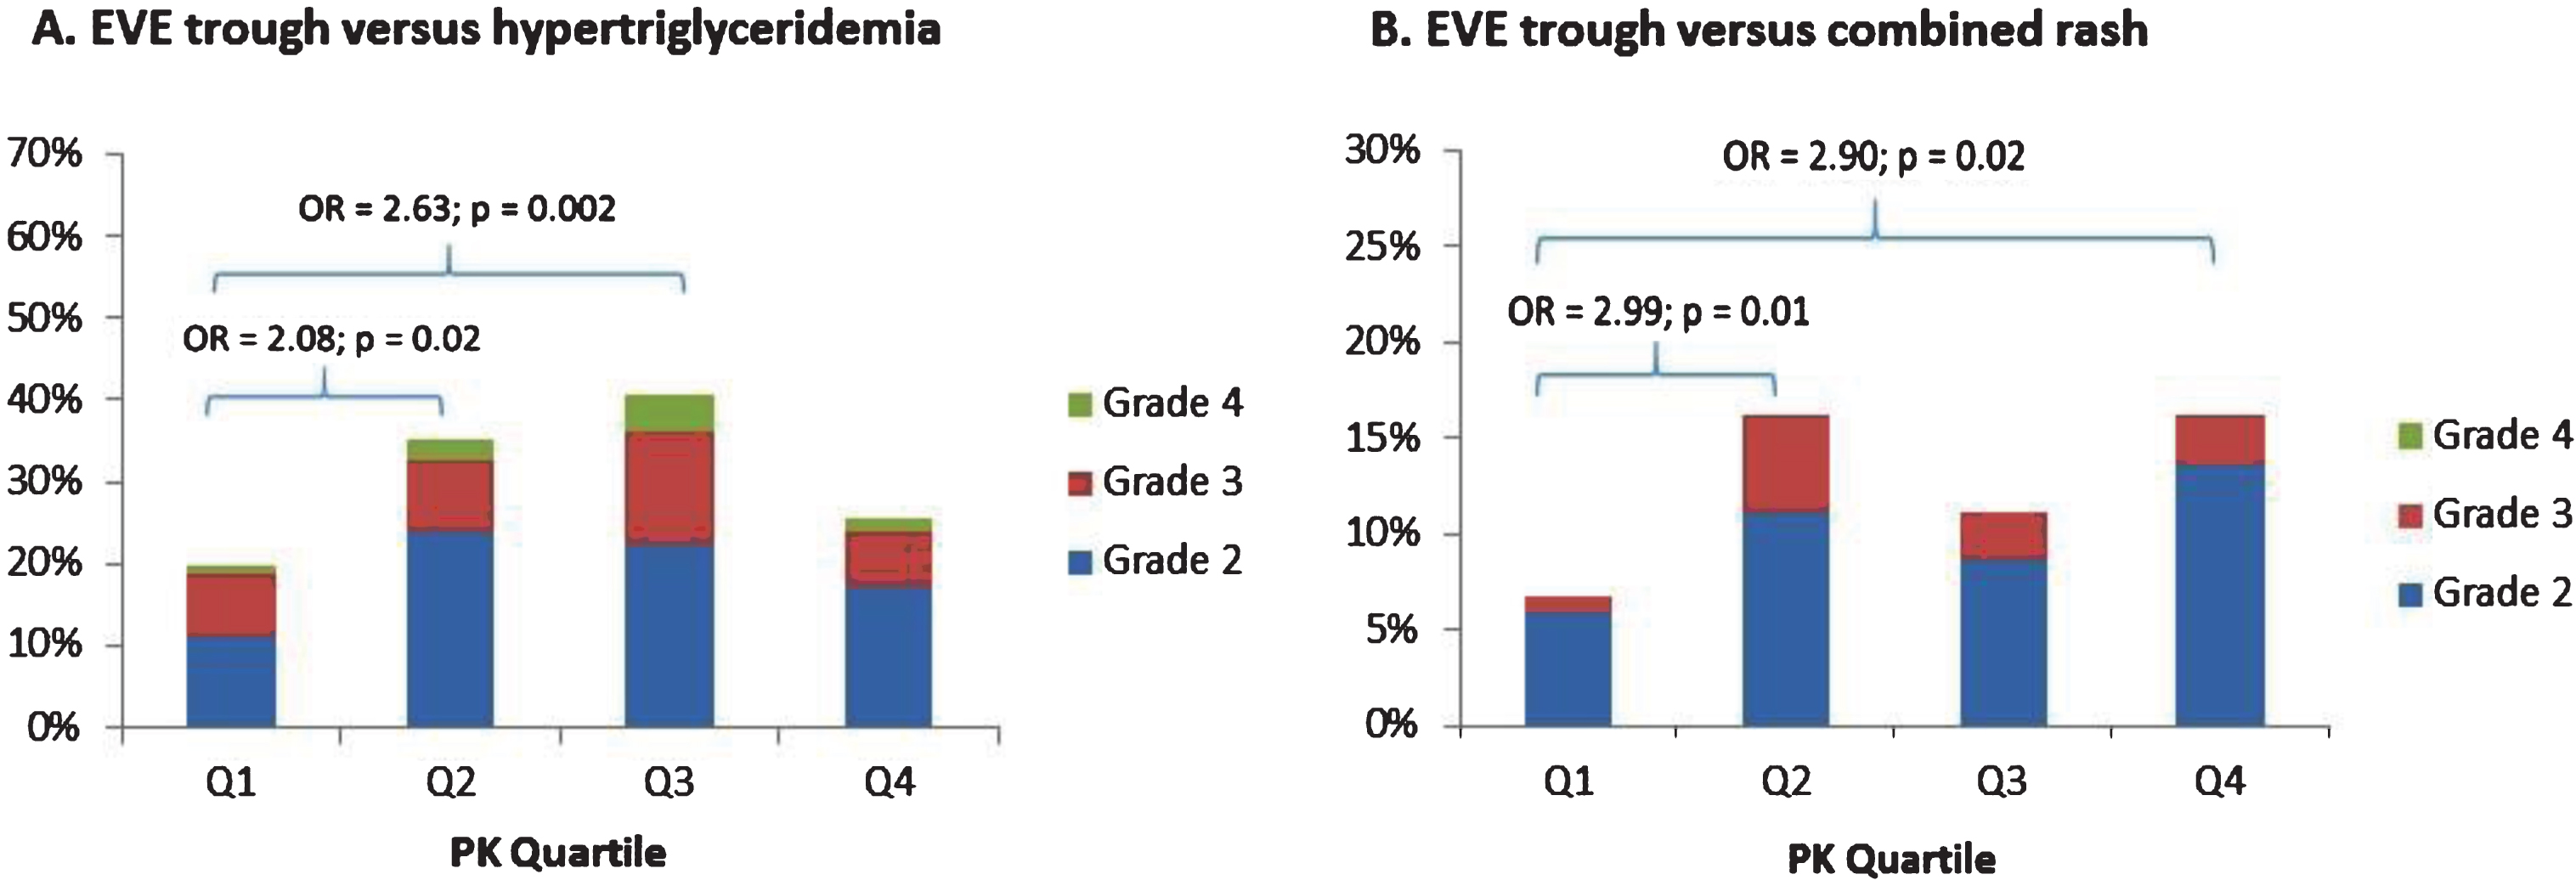
Table 3 also summarizes the EVE trough quartiles according to risk of individual adverse events and premature stopping of EVE. As shown in the table and Fig. 2. The risk of grade 2 + hypertriglyceridemia was significantly increased in Q2 and Q3 vs Q1 (OR = 2.08; p = 0.02 and OR = 2.63; p = 0.002).Furthermore, the risk of grade 2 + rash was significantly increased in Q2 and Q4 vs Q1 (OR = 2.99; p = 0.01 and OR = 2.90; p = 0.02). There was also an increased risk of any grade 3 + tox in Q2 vs Q1 (OR = 1.71; p = 0.05). The proportion of patients with adverse event-related discontinuationswas similar across EVE trough quartiles(p = 0.48).
Fig.2
Risk of hypertriglyceridemia (panel A) and combined skin rash (panel B) by EVE trough quartile ranges.
DISCUSSION
Due to the advances made in the treatment of metastatic RCC using tyrosine kinase inhibitors, there have been multiple trials conducted to determine whether these active drugs can improve survival in the adjuvant setting. However, results of these studies to date have been mixed. The S-TRAC trial found that adjuvant sunitinib resulted in longer disease-free survival compared placebo in high-risk clear cell RCC [11], while the ASSURE trial showed no survival benefit to adjuvant treatment with either sunitinib or sorafenib relative to placebo [12]. Furthermore, while a placebo-controlled randomized study of adjuvant pazopanib (PROTECT) showed some improvement in disease free survival, it failed to meet its primary endpoint [13]. Therefore, whether there is an overall benefit to adjuvant VEGF-directed therapy, and if so, who would be most likely to benefit remain open questions.
A common theme among all of the adjuvant RCC trials to date has been the high frequency of bothersome toxicity resulting in treatment discontinuation on the active treatment arms. For example, the percentage of patients who discontinued sunitinib due to toxicity was 28.1% on the S-TRAC trial [11] and 44% on the ASSURE study [12]. The rate of pazopanib discontinuation because of AEs on PROTECT was 35% and 39% in the 800 mg and 600 mg dose cohorts, respectively [13]. On the current S0931 study, 39% of the patients on the active treatment arm prematurely discontinued EVE. Interestingly, only 13% of patients receiving EVE on the pivotal Phase III trial for metastatic RCC discontinued treatment due to adverse events [1], consistent with the observation that patients are generally less tolerant of toxicities in the adjuvant setting [11]. It is intriguing to wonder whether the survival outcome differences seen with S-TRACT and ASSURE might be due to the ability of patients to stay on the drug longer in the former compared to the later. Furthermore, a correlation was observed between higher pazopanib trough concentrations and longer DFS on PROTECT. Taken together, these results suggest that higher serum drug concentrations may be associated with greater clinical benefit. It also leads to the question of whether there is a way to improve the tolerability and efficacy of these TKIs on an individual basis guided by TDM.
Dose individualization of EVE based on measured trough levels is an established clinical practice in solid organ transplant patients, with the target therapeutic widow defined as 3–8 ng/mL. More recently, investigations in patients with advanced solid tumors, including some with metastatic RCC, have reported significant associations between EVE trough levels and both toxicity and progression free survival [4, 9] For example, Deppenweiler et al. [9] reported that patients with EVE trough levels > 26.3 ng/mL had a 4-fold increased risk of toxicity, while patients with trough levels < 11.9 ng/mL had a 3-fold increased risk of progression. Another group of investigators [14] found that advanced RCC patients who discontinued treatment due to toxicity had significantly higher EVE trough levels compared to those who did not (27.6 vs 15.7 ng/mL), and the patients who stopped treatment due to adverse events had a short time to treatment failure. Based on the published evidence supporting the existence of EVE exposure-toxicity and exposure-response relationships, it seems likely that there is an optimal therapeutic window for RCC patients that can be targeted to minimize the risk of toxicity and maximize the likelihood for a good clinical outcome.
In the current study, we attempted to identify relationships between EVE trough levels and the most common toxicities. Although we found significant associations between increasing EVE trough levels and the risk of hypertriglyceridemia, skin toxicity, and any grade 3 + toxicity, these associations were not consistent across all quartiles. For example, the increased risk of hypertriglyceridemia was only significant between Q2 and Q3 compared to Q1. The highest EVE quartile was not associated with an increased risk of hypertriglyceridemia. However, when the data are presented graphically (i.e. Fig. 2), an overall trend towards increasing risk of toxicity can be seen. Although this data set includes a large number of subjects, a major limitation is that EVE trough measurements were only performed once or twice per subject during the first 13 weeks of a 52 week treatment period. Furthermore, dose normalization of EVE trough levels could have introduced bias since the most common reason for dose reduction was for toxicity. Finally, factors such as non-compliance, inaccurate sample collection times, and intra-subject pharmacokinetic variability are potential confounding variables that could have affected our estimate of true EVE trough values. An ideal study would include more frequent trough level measurements over a longer period of time, particularly close in time to the occurrence of adverse events. However, this is not practical in a large multicenter Phase 3 trial such as this one.
Despite the limited associations seen between EVE trough levels and toxicity, we were able to identify age and gender-related differences in EVE pharmacokinetics. Men were found to have higher EVE tough levels than women, while trough levels also increased with increasing age independent of gender. Previous pharmacokinetic analyses have failed to identify associations between age or gender and EVE disposition, although most of these studies have been in the solid organ transplant setting. Interestingly, the study of Thiery-Vuillemin et al. [15] in patients with advanced RCC, reported similar effects of age and gender on EVE trough levels as the ones reported here. Also, a population-based pharmacokinetic analysis of EVE in RCC patients [14] found a trend towards lower clearance in older patients, which is consistent with increasing trough levels with age. The mechanisms of these interactions and their potential significance are yet to be determined.
The results presented here add to the growing body of literature pointing to a relationship between measured EVE exposure and toxicity. Additional analyses once the study is unblinded will assess whether there is an association between EVE trough levels and survival. Regardless of the outcome of the future analyses, sufficient evidence already exists to support a prospective study comparing fixed dose to dose-individualized EVE in advanced RCC patients. While questions remain regarding the optimal EVE therapeutic window and the preferred frequency for TDM, based on the current data and previously reports [9, 14, 15], targeting trough levels between 15 and 20 ng/mL could potentially decrease the risk of toxicity leading to treatment discontinuation and increase the likelihood of a good outcome.
FUNDING
Research reported in this publication was supported by the National Cancer Institute of the National Institutes of Health under Award Numbers CA180888, CA180819; in part by Novartis Pharmaceuticals, in part by a grant from The Hope Foundation through the SWOG Trial Support (STrS) program, and by the City of Hope Cancer Center Support Grant for the Analytical Pharmacology Core (P30CA033572). The content is solely the responsibility of the authors and does not necessarily represent the official views of the National Institutes of Health, Novartis Pharmaceuticals or The Hope Foundation.
CONFLICT OF INTEREST
TWS reports a grant from The Hope Foundation through the SWOG Trial Support (STrS) program, during the conduct of this study. EIH reports clinical trial funding support from Genentech/Roche, Merck Sharpe and Dohme, and Bristol-Myers Squibb outside the submitted work. PCM reports grants from Boehringer Ingelheim, personal fees from Novartis, personal fees from AstraZeneca, personal fees from Celgene, personal fees from Lilly, personal fees from Pfizer, personal fees from Guardant Health, and personal fees from Apton Biosystems, all outside the submitted work. MNS reports grants and personal fees from Merck Sharp & Dohme, grants from Janssen Oncology, grants from Advaxis, grants from Bristol-Myers Squibb, and grants from Nektar, all outside the submitted work. PL reports consultant fees from Novartis, during the conduct of this study. NJV reports personal fees from Novartis, during the conduct of this study; personal fees from Pfizer, personal fees from Merck, personal fees from Exelixis, personal fees from BMS, all outside the submitted work. CWR reports non-financial support from Novartis, during the conduct of this study; personal fees from Eisai, personal fees from Exelixis, personal fees from Genentech/Roche, personal fees from Novartis, personal fees from Pfizer, grants from Argos, grants from Bristol-Myers Squibb, grants from CytRx Corporation, grants from Daiichi-Sankyo, grants from Eisai, grants from Exelixis, grants from Genentech, grants from Novartis, grants from Glaxo Smith Kline, grants from Janssen, grants from Karyopharm, grants from MabVax, grants from Merck, grants from Morophotek, grants from Threshold Pharmaceuticals, grants from TRACON, and non-financial support from Bayer, all outside the submitted work. MP, CMT, GSP, MVM, and IMT have nothing to disclose.
ACKNOWLEDGMENTS
The authors have no acknowledgments.
REFERENCES
[1] | Motzer RJ , Escudier B , Oudard S , Hutson TE , Porta C , Bracarda S , et al. Efficacy of everolimus in advanced renal cell carcinoma: A double-blind, randomised, placebo-controlled phase III trial. Lancet (London, England). (2008) ;372: (9637):449–56. PubMed PMID: 18653228. Epub 2008/07/26. eng. |
[2] | Rodriguez-Pascual J , Cheng E , Maroto P , Duran I . Emergent toxicities associated with the use of mTOR inhibitors in patients with advanced renal carcinoma. Anti-Cancer Drugs. (2010) ;21: (5):478–86. PubMed PMID: 20401967. Epub 2010/04/20. eng. |
[3] | Rugo HS , Hortobagyi GN , Yao J , Pavel M , Ravaud A , Franz D , et al. Meta-analysis of stomatitis in clinical studies of everolimus: Incidence and relationship with efficacy. Annals of Oncology: Official Journal of the European Society for Medical Oncology. (2016) ;27: (3):519–25. PubMed PMID: 26759276. Pubmed Central PMCID: PMC4769991. Epub 2016/01/14. eng. |
[4] | Ravaud A , Urva SR , Grosch K , Cheung WK , Anak O , Sellami DB . Relationship between everolimus exposure and safety and efficacy: Meta-analysis of clinical trials in oncology. European Journal of Cancer (Oxford, England: 1990). (2014) ;50: (3):486–95. PubMed PMID: 24332451. Epub 2013/12/18. eng. |
[5] | Kovarik JM , Kahan BD , Kaplan B , Lorber M , Winkler M , Rouilly M , et al. Longitudinal assessment of everolimus in de novo renal transplant recipients over the first post-transplant year: Pharmacokinetics, exposure-response relationships, and influence on cyclosporine. Clinical Pharmacology and Therapeutics. (2001) ;69: (1):48–56. PubMed PMID: 11180038. Epub 2001/02/17. eng. |
[6] | Kovarik JM , Kaplan B , Tedesco Silva H , Kahan BD , Dantal J , Vitko S , et al. Exposure-response relationships for everolimus in de novo kidney transplantation: Defining a therapeutic range. Transplantation. (2002) ;73: (6):920–5. PubMed PMID: 11923693. Epub 2002/03/30. eng. |
[7] | Mabasa VH , Ensom MH . The role of therapeutic monitoring of everolimus in solid organ transplantation. Therapeutic Drug Monitoring. (2005) ;27: (5):666–76. PubMed PMID: 16175142. Epub 2005/09/22. eng. |
[8] | Kovarik JM , Tedesco H , Pascual J , Civati G , Bizot MN , Geissler J , et al. Everolimus therapeutic concentration range defined from a prospective trial with reduced-exposure cyclosporine in de novo kidney transplantation. Therapeutic Drug Monitoring. (2004) ;26: (5):499–505. PubMed PMID: 15385832. Epub 2004/09/24. eng. |
[9] | Deppenweiler M , Falkowski S , Saint-Marcoux F , Mon-chaud C , Picard N , Laroche ML , et al. Towards therapeutic drug monitoring of everolimus in cancer? Results of an exploratory study of exposure-effect relationship. Pharmacological Research. (2017) ;121: :138–44. PubMed PMID:28473246. Epub 2017/05/06. eng. |
[10] | Gadgeel SM , Lew DL , Synold TW , LoRusso P , Chung V , Christensen SD , et al. Phase I study evaluating the combination of lapatinib (a Her2/Neu and EGFR inhibitor) and everolimus (an mTOR inhibitor) in patients with advanced cancers: South West Oncology Group (SWOG) Study S0528. Cancer Chemotherapy and Pharmacology. (2013) ;72: (5):1089–96. PubMed PMID: 24057042. Pubmed Central PMCID: PMC4072025. Epub 2013/09/24. eng. |
[11] | Ravaud A , Motzer RJ , Pandha HS , George DJ , Pantuck AJ , Patel A , et al. Adjuvant Sunitinib in High-Risk Renal-Cell Carcinoma after Nephrectomy. The New England Journal of Medicine. (2016) ;375: (23):2246–54. PubMed PMID: 27718781. |
[12] | Haas NB , Manola J , Uzzo RG , Flaherty KT , Wood CG , Kane C , et al. Adjuvant sunitinib or sorafenib for high-risk, non-metastatic renal-cell carcinoma (ECOG-ACRIN E2805): A double-blind, placebo-controlled, randomised, phase 3 trial. Lancet (London, England). (2016) ;387: (10032):2008–16. PubMed PMID: 26969090. Pubmed Central PMCID: 4878938. |
[13] | Motzer RJ , Haas NB , Donskov F , Gross-Goupil M , Var-lamov S , Kopyltsov E , et al. Randomized Phase III Trial of Adjuvant Pazopanib Versus Placebo After Nephrectomy in Patients With Localized or Locally Advanced Renal Cell Carcinoma. Journal of Clinical Oncology: Official journal of the American Society of Clinical Oncology. (2017) ;35: (35):3916–23. PubMed PMID: 28902533. Pubmed Central PMCID: 6018511. |
[14] | Tanaka A , Yano I , Shinsako K , Sato E , Fukudo M , Masuda S , et al. Population Pharmacokinetics of Everolimus in Relation to Clinical Outcomes in Patients With Advanced Renal Cell Carcinoma. Therapeutic Drug Monitoring. (2016) ;38: (6):663–9. PubMed PMID: 27661398. Epub 2016/09/24. eng. |
[15] | Thiery-Vuillemin A , Mouillet G , Nguyen Tan Hon T , Montcuquet P , Maurina T , Almotlak H , et al. Impact of everolimus blood concentration on its anti-cancer activity in patients with metastatic renal cell carcinoma. Cancer Chemotherapy and Pharmacology. (2014) ;73: (5):999–1007. PubMed PMID: 24682543. |


