
Targeted Therapy and Immunotherapy: Effect of Body Mass Index on Clinical Outcomes in Patients Diagnosed with Metastatic Renal Cell Carcinoma
Abstract
Background:
Previous research has identified an association between high body mass index (BMI) and better overall survival (OS) in metastatic renal cell carcinoma (mRCC) patients treated with vascular endothelial growth factor-tyrosine kinase inhibitors (VEGF-TKIs).
Objective:
The current study sought to determine whether the effect of BMI on OS extends beyond VEGF-TKIs to mTOR inhibitors or immunotherapy (IO).
Design, Setting and Participants:
A retrospective study was conducted among patients diagnosed with mRCC treated at a single institution from 2009 to 2017. Demographic and clinical variables were collected. BMI was characterized as high (≥25 kg/m2) versus low (<25 kg/m2).
Outcomes Measurement and Statistical Analysis:
The Kaplan-Meier method was used to estimate the difference in OS, with comparisons based on BMI and by treatment type.
Results and Limitations:
Among 353 patients (M = 64 years old, 73% male) 66% were overweight or obese (BMI≥25 kg/m2). Patients were treated with VEGF-TKI (65%), mTOR (23%), or IO (12%). Among patients treated with VEGF-TKI with low BMI, median OS was 24.0 months (95% CI, 20.7–27.2) versus 36.0 months (95% CI, 18.6–53.3) among patients with high BMI (P = 0.02). The median OS for patients with low BMI treated with mTOR was 18.0 months (95% CI, 2.8–33.1), versus 25.0 months (95% CI, 16.6–33.4) among patients with high BMI (P = 0.04). In contrast, patients with low BMI treated with IO had a median OS of 23.6 months (95% CI, 17.5–29.7) versus 19.9 months (95% CI, 10.6–29.2) among patients with high BMI (P = 0.26). The retrospective nature and the small sample size are the main limitations of this study.
Conclusions:
High-BMI was associated with improved OS in patients with mRCC treated with VEGF-TKI and mTOR, but the inverse trend was observed among patients receiving IO. Our data highlight the need to reassess this phenomenon in the context of IO-based regimens.
INTRODUCTION
Several studies have suggested an association between obesity and kidney cancer and have established obesity as a risk factor in the development of this malignancy [1–4]. A better understanding of this association has been particularly important when we consider the concerning numbers related to the epidemiology of obesity and kidney cancer. Over the past three decades, obesity has become a major public health issue in the United States [5–7]. In this time period, the number of kidney cancer cases have also increased [8].
There have been significant advances in the treatment of renal cell carcinoma (RCC) over the last two decades, led most notably by enhanced imaging methods that enable earlier detection of small renal masses and a better understanding of the RCC biologic mechanism that has enabled the development of new drugs [9]. This evolutionary path began with the first class of drugs which reported activity for systemic treatment of RCC in what was marked the “cytokine era”. The expected median overall survival (OS) was 13 months with interferon-alpha treatment; durable responses in a small percentage of eligible patients with advanced renal cell cancer were demonstrated with interleukin-2 [9–12]. The introduction of a new class of drugs that target vascular endothelial grow factor (VEG F) and intracellular molecules of the mammalian target of rapamycin (mTOR) pathway, [13–15] has led to a notable increase in median OS to 24 to 30 months. Further, these treatments are associated with fewer adverse events and better quality of life (QOL) [9]. More recently the development novel immunotherapy drugs (IO) that inhibit immune checkpoint targets such as the programmed death cell-1 and its ligand (PD-1 and PD-L1), and the cytotoxic T-lymphocyte associated-4 protein (CTLA-4) have added impressive survival and QOL benefits [9, 16, 17].
In the context of these treatment advances, more recent studies have investigated the relationship between RCC and elevated body mass index (BMI). These studies have found that excess weight could serve as a prognostic factor in RCC, although this association was attenuated by different types of treatment [18–21]. For example, Choueiri et al. observed higher OS in obese patients treated with targeted therapies for RCC, even after adjusting for prognostic factors, such as the International Metastatic Renal Cell Carcinoma Database Consortium (IMDC) risk criteria [19]. Furthermore, Albiges and collaborators identified an association between high BMI and treatment outcomes in patients with metastatic RCC (mRCC), with greater OS among patients with higher BMI being treated with VEGF-TKIs [20]. The authors expanded their evaluation by including the assessment of immunohistochemistry staining for fatty acid synthase (FASN) and FASN gene expression for a specific cohort of patients, suggesting a role for fatty acid metabolism in the prognosis of patients with mRCC [20].
The current evidence suggests that overweight and obesity may be a risk factor for RCC, as well as a positive prognostic factor for patients treated with VEGF-TKIs drug. Given this assumption, this study sought to determine the association between BMI and OS among patients being treated for kidney malignancies, and examine this association in patients treated with VEGF-TKIs, mTOR inhibitors, and immunotherapy (IO).
MATERIAL AND METHODS
Patient Selection
In this retrospective study, we analyzed data from electronic medical records of patients diagnosed with mRCC, from 2009 to 2017, treated at a single institution located in Duarte, California. This study was approved by an internal institutional review board. Patients were eligible if they had histologically confirmed RCC and received first and/or second line treatment with VEGF-TKI, mTOR, and IO. We divided the cohort of patients with mRCC into three groups based on primary type of systemic therapy received in the first or second line setting. Patients with high-BMI and low-BMI were then compared within each of these three groups. Patients treated with combination therapy (VEGF-TKI + mTOR or VEGF-RKI + IO) were excluded. Further clinical information reported prior to the start new line of therapy (age, gender, race, marital status, BMI median, histology, previous nephrectomy, metastatic site, IMDC, and systemic treatment rendered) was also collected from medical records. The type of systemic therapy rendered was grouped by the mechanistic type of drug: VEGF-TKI (sunitinib, pazopanib, sorafenib, or axitinib), IO group (nivolumab, atezolizumab, or avelumab), and mTOR (temsirolimus or everolimus). In order to simplify our description of each subgroup after the categorization in high- or low-BMI we used the following abbreviation: V-H and V-L for patients who received VEGF-TKI inhibitors with high- and low-BMI, IO-H and IO-L respectively for patients who received immune-checkpoint inhibitors with high- and low-BMI, and M-H and M-L for patients who received mTOR inhibitors with high- and low-BMI.
Statistical analysis
A descriptive analysis was performed to estimate frequencies, mean, standard deviation (SD), median and 95% confidence interval (95% CI) of the clinical characteristics by treatment type. The chi-square test was used to determine the association between treatment groups and clinical characteristics, and between BMI and clinical characteristics for each group (VEGF-TKI, mTOR and IO). For each treatment type, patients were grouped as normal weight (BMI < 25 kg/m2) or overweight (BMI≥25 kg/m2). Overall survival was estimated using the Kaplan-Meier method and calculated by the difference in months between the date of diagnosis to the date of death or last follow-up. Further, Cox proportional-hazards modeling was used to assess the effect of BMI on survival, for gender, race, IMDC, and histology. All analyses were performed using the Statistical Package for Social Science (SPSS) software, version 24.0.
RESULTS
We assessed a total of 353 cases of mRCC who received systemic therapy as first (n = 230) and/or second line treatment (n = 123). There was a higher proportion of high-BMI patients in the VEGF-TKI group compared to other treatment groups (Supplementary Figure 1). Of those recruited, 229 received targeted therapy with VEGF-TKI agents (31% V-L and 69% V-H). 82 received mTOR inhibitors (43% M-L and 57% M-H), and 42 received IO (29% I-L and 71% I-H). Clinical data are summarized in Table 1. Among the entire cohort there was a median age of 64 years (range 38–89); age varied in the IO group which presented a median age of 68 years in the I-L versus 63 years in the I-H group (P = 0.21). In terms of race, white patients were predominant in all subgroups followed by Hispanic and Asian. Notably, there was a higher proportion of Asian than Hispanic patients in the M-L (34% Asian versus 5% Hispanic; P = 0.001) and in the IO-L (41% Asian versus 25% Hispanic; P = 0.02).
Table 1
Sample clinical characteristics
| VEGF-TKI (n = 229) | mTOR (n = 82) | IO (n = 42) | P-Value | |||||||
| BMI < 25 (n = 72) | BMI≥25 (n = 157) | P-Value | BMI < 25 (n = 35) | BMI≥25 (n = 47) | P-Value | BMI < 25 (n = 12) | BMI≥25 (n = 30) | P-Value | ||
| Age | 0.83 | 0.50 | 0.21 | 0.13 | ||||||
| Median (range) | 62.6 (25–89) | 62.9 (25–87) | 66.7 (47–89) | 61.7 (38–78) | 68.1 (55–78) | 63.9 (49–84) | ||||
| Gender | 0.001 | 0.28 | 0.14 | 0.37 | ||||||
| Female | 32 (44.4%) | 31 (19.7%) | 10 (28.6%) | 8 (17.0%) | 6 (50.0%) | 8 (26.7%) | ||||
| Male | 40 (55.6%) | 126 (80.3%) | 25 (71.4%) | 39 (83.0%) | 6 (50.0%) | 22 (73.3%) | ||||
| Race | 0.27 | 0.001 | 0.02 | 0.61 | ||||||
| White | 45 (66.2%) | 121 (78.1%) | 20 (57.1%) | 39 (81.3%) | 4 (33.3%) | 26 (86.7%) | ||||
| Black | 1 (1.5%) | 4 (2.6%) | 1 (2.9%) | 1 (2.1%) | 0 (0.0%) | 1 (3.3%) | ||||
| Hispanic | 13 (19.1%) | 19 (12.3%) | 2 (5.7%) | 7 (14.9%) | 3 (25.0%) | 1 (3.3%) | ||||
| Asian | 8 (11.8%) | 9 (5.8%) | 12 (34.3%) | 1 (2.1%) | 5 (41.7%) | 2 (6.7%) | ||||
| Indian | 1 (1.5%) | 1 (0.6%) | 0 (0.0%) | 0 (0.0%) | 0 (0.0%) | 0 (0.0%) | ||||
| Filipino | 0 (0.0%) | 1 (0.6%) | 0 (0.0%) | 0 (0.0%) | 0 (0.0%) | 0 (0.0%) | ||||
| Marital Status | 0.20 | 0.11 | 0.13 | 0.67 | ||||||
| Single | 10 (14.7%) | 17 (11.0%) | 2 (5.7%) | 7 (14.9%) | 0 (0.0%) | 7 (23.3%) | ||||
| Married | 45 (66.2%) | 122 (78.7%) | 29 (82.9%) | 33 (70.2%) | 10 (83.4%) | 21 (70.0%) | ||||
| Divorced | 10 (14.7%) | 11 (7.1%) | 1 (2.9%) | 6 (12.8%) | 1 (8.3%) | 0 (0.0%) | ||||
| Widowed | 3 (4.4%) | 5 (3.2%) | 3 (8.6%) | 1 (2.1%) | 1 (8.3%) | 2 (6.7%) | ||||
| Pathology | 0.92 | 0.16 | 0.35 | 0.97 | ||||||
| Clear cell | 56 (80.0%) | 124 (80.5%) | 24 (70.6%) | 40 (85.1%) | 8 (66.7%) | 24 (80.0%) | ||||
| Non clear cell | 14 (20.0%) | 30 (19.5%) | 10 (29.4%) | 7 (14.9%) | 4 (33.3%) | 6 (20.0%) | ||||
| Nephrectomy | 0.19 | 0.28 | 0.31 | 0.09 | ||||||
| Yes | 60 (83.3%) | 141 (89.8%) | 25 (71.4%) | 39 (83.0%) | 10 (83.3%) | 28 (93.3%) | ||||
| Metastatic site | 0.38 | 0.30 | 0.28 | 0.71 | ||||||
| Kidney | 5 (7.4%) | 7 (4.5%) | 3 (8.6%) | 1 (2.1%) | 1 (8.3%) | 0 (0.0%) | ||||
| Pancreas | 4 (5.9%) | 6 (3.9%) | 0.49 | 0 (0.0%) | 1 (2.1%) | 0.38 | 1 (8.3%) | 0 (0.0%) | 0.28 | 0.35 |
| Lymph node | 21 (22.6%) | 72 (46.5%) | 0.04 | 12 (34.3%) | 21 (44.7%) | 0.34 | 3 (25.0%) | 20 (66.7%) | 0.26 | 0.24 |
| Lung | 48 (70.6%) | 111 (71.6%) | 0.87 | 23 (65.7%) | 31 (66.0%) | 0.98 | 9 (75.0%) | 21 (70.0%) | 0.74 | 0.64 |
| Brain | 9 (13.2%) | 17 (11.0%) | 0.62 | 8 (22.9%) | 4 (8.5%) | 0.11 | 4 (33.3%) | 2 (6.7%) | 0.05 | 0.74 |
| Liver | 15 (22.1%) | 25 (16.1%) | 0.34 | 4 (11.4%) | 7 (14.9%) | 0.64 | 2 (16.7%) | 4 (13.3%) | 0.78 | 0.59 |
| Bone | 26 (36.8%) | 51 (32.9%) | 0.57 | 14 (40.0%) | 11 (23.4%) | 0.14 | 3 (25.0%) | 7 (23.3%) | 0.90 | 0.40 |
| IMDC risk group | 0.08 | 0.19 | 0.89 | 0.16 | ||||||
| Favorable | 12 (17.6%) | 38 (24.5%) | 4 (11.4%) | 12 (25.5%) | 2 (16.7%) | 5 (16.7%) | ||||
| Intermediate | 43 (63.2%) | 103 (66.5%) | 23 (65.7%) | 29 (61.7%) | 10 (83.3%) | 25 (83.3%) | ||||
| Poor | 13 (19.1%) | 14 (9.0%) | 8 (22.9%) | 6 (12.8%) | 0 (0.0%) | 0 (0.0%) | ||||
| Baseline Body Mass | – | – | – | 0.79 | ||||||
| Median (range) | 22.5 (17–24) | 31.2 (25–54) | 22.0 (17–24) | 31.1 (25–49) | 24.0 (15–24) | 30.0 (25–46) | ||||
| Treatment | 0.56 | 0.01 | 0.12 | – | ||||||
| Sunitinib | 49 (68.1%) | 104 (66.2%) | – | – | – | – | ||||
| Pazobanib | 5 (6.9%) | 10 (6.4%) | – | – | – | – | ||||
| Sorafenib | 5 (6.9%) | 12 (7.6%) | – | – | – | – | ||||
| Axitinib | 3 (4.2%) | 6 (3.8%) | – | – | – | – | ||||
| Crizotinib | 3 (4.2%) | 1 (0.6%) | – | – | – | – | ||||
| Cabozantinib | 2 (2.8%) | 4 (2.5%) | – | – | – | – | ||||
| Bevacizumab | 3 (4.2%) | 1 (0.6%) | – | – | – | – | ||||
| Sonepcizumab | 2 (2.8%) | 12 (7.6%) | – | – | – | – | ||||
| Cediranib | 0 (0.0%) | 1 (0.6%) | – | – | – | – | ||||
| Volitinib | 0 (0.0%) | 5 (3.2%) | – | – | – | – | ||||
| Tivantinib | 0 (0.0%) | 1 (0.6%) | – | – | – | – | ||||
| Temsirolimus | – | – | 22 (62.9%) | 31 (66.0%) | – | – | ||||
| Everolimus | – | – | 13 (37.1%) | 16 (34.0%) | – | – | ||||
| Nivolumab | – | – | – | – | 10 (83.3%) | 22 (73.3%) | ||||
| Atezolizumab | – | – | – | – | 2 (16.7%) | 1 (3.3%) | ||||
| IpiNivo | – | – | – | – | 0 (0.0%) | 7 (23.4%) | ||||
There was a higher proportion of clear cell RCC compared to non-clear cell RCC histology across all three subgroups (Table 1). The most common metastasis sites were lung (70%), followed by lymph nodes (42%) and bone (32%). Notably, the V-L and M-L subgroups demonstrated a higher number of bone metastasis than lymph node metastasis. Most patients were intermediate risk as per IMDC prognostic criteria. In the IO group, 83% of patients were in the intermediate risk (P = 0.19). A marked contrast was seen in the mTOR group with a difference between poor- and favorable-prognosis of 22% versus 11% respectively in the M-L (P = 0.19). An opposite trend in the M-H subgroup was noted, with 12% with poor-prognosis and 25% for patients with favorable-prognosis (P = 0.19). Data concerning BMI in this cohort showed a relatively even distribution across the subgroups with BMI values of 22 for the V-L, 31 for the V-H, 22 for the M-L, 31 for the M-H, 24 for the IO-L subgroup, and 30 for the IO-H subgroup (P = 0.79).
In terms of treatment, there was a relatively even distribution of patients who received nephrectomy, with a mean of 86% reported across the subgroups. The most frequently used drug in the VEGF-TKI group was sunitinib that was prescribed in 68% of 229 patients, followed by sorafenib (7%) and pazopanib (7%) in a similar distribution between these two subgroups (P = 0.56). In the IO group, the primary agent was nivolumab (76%), followed by nivolumab/ipilimumab (16%, P = 0.12). Regarding the mTOR inhibitors and the M-L subgroup, everolimus was used in 54% of cases, while 46% received temsirolimus (P = 0.01).
Overall survival was calculated for each group (VEGF-TKI, mTOR and IO) in order to compare survival differences between the respective BMI subgroups (Fig. 1). The comparison between patients treated with VEGF-TKI was statistically significant with 24 months (95% CI, 20.7–27.2) versus 36 months (95% CI, 18.6–53.3) among low-BMI and high-BMI groups respectively (p = 0.02). A similar result was found among those treated with mTOR inhibitors, with 18 months (95% CI, 2.8–33.1) versus 25 months (95% CI, 16.6–33.4) for low- and high-BMI, respectively (p = 0.04). However, patients treated with immunotherapy who had a low BMI possessed a median OS of 23.6 months (95% CI, 17.5–29.7) versus 19.9 months (95% CI, 10.6–29.2) among patients with high-BMI (P = 0.26). In the VEGF-TKI group, the covariate IMDC remained significant (P = 0.001), while gender, race, and histology failed to reach significance. A similar finding was found in the mTOR group. The HR for both scenarios indicates a strong relationship between non-favorable prognostic (IMDC) and increased risk of death. No significant contribution was found in the IO group (Table 2).
Fig.1
Overall survival stratified by BMI.
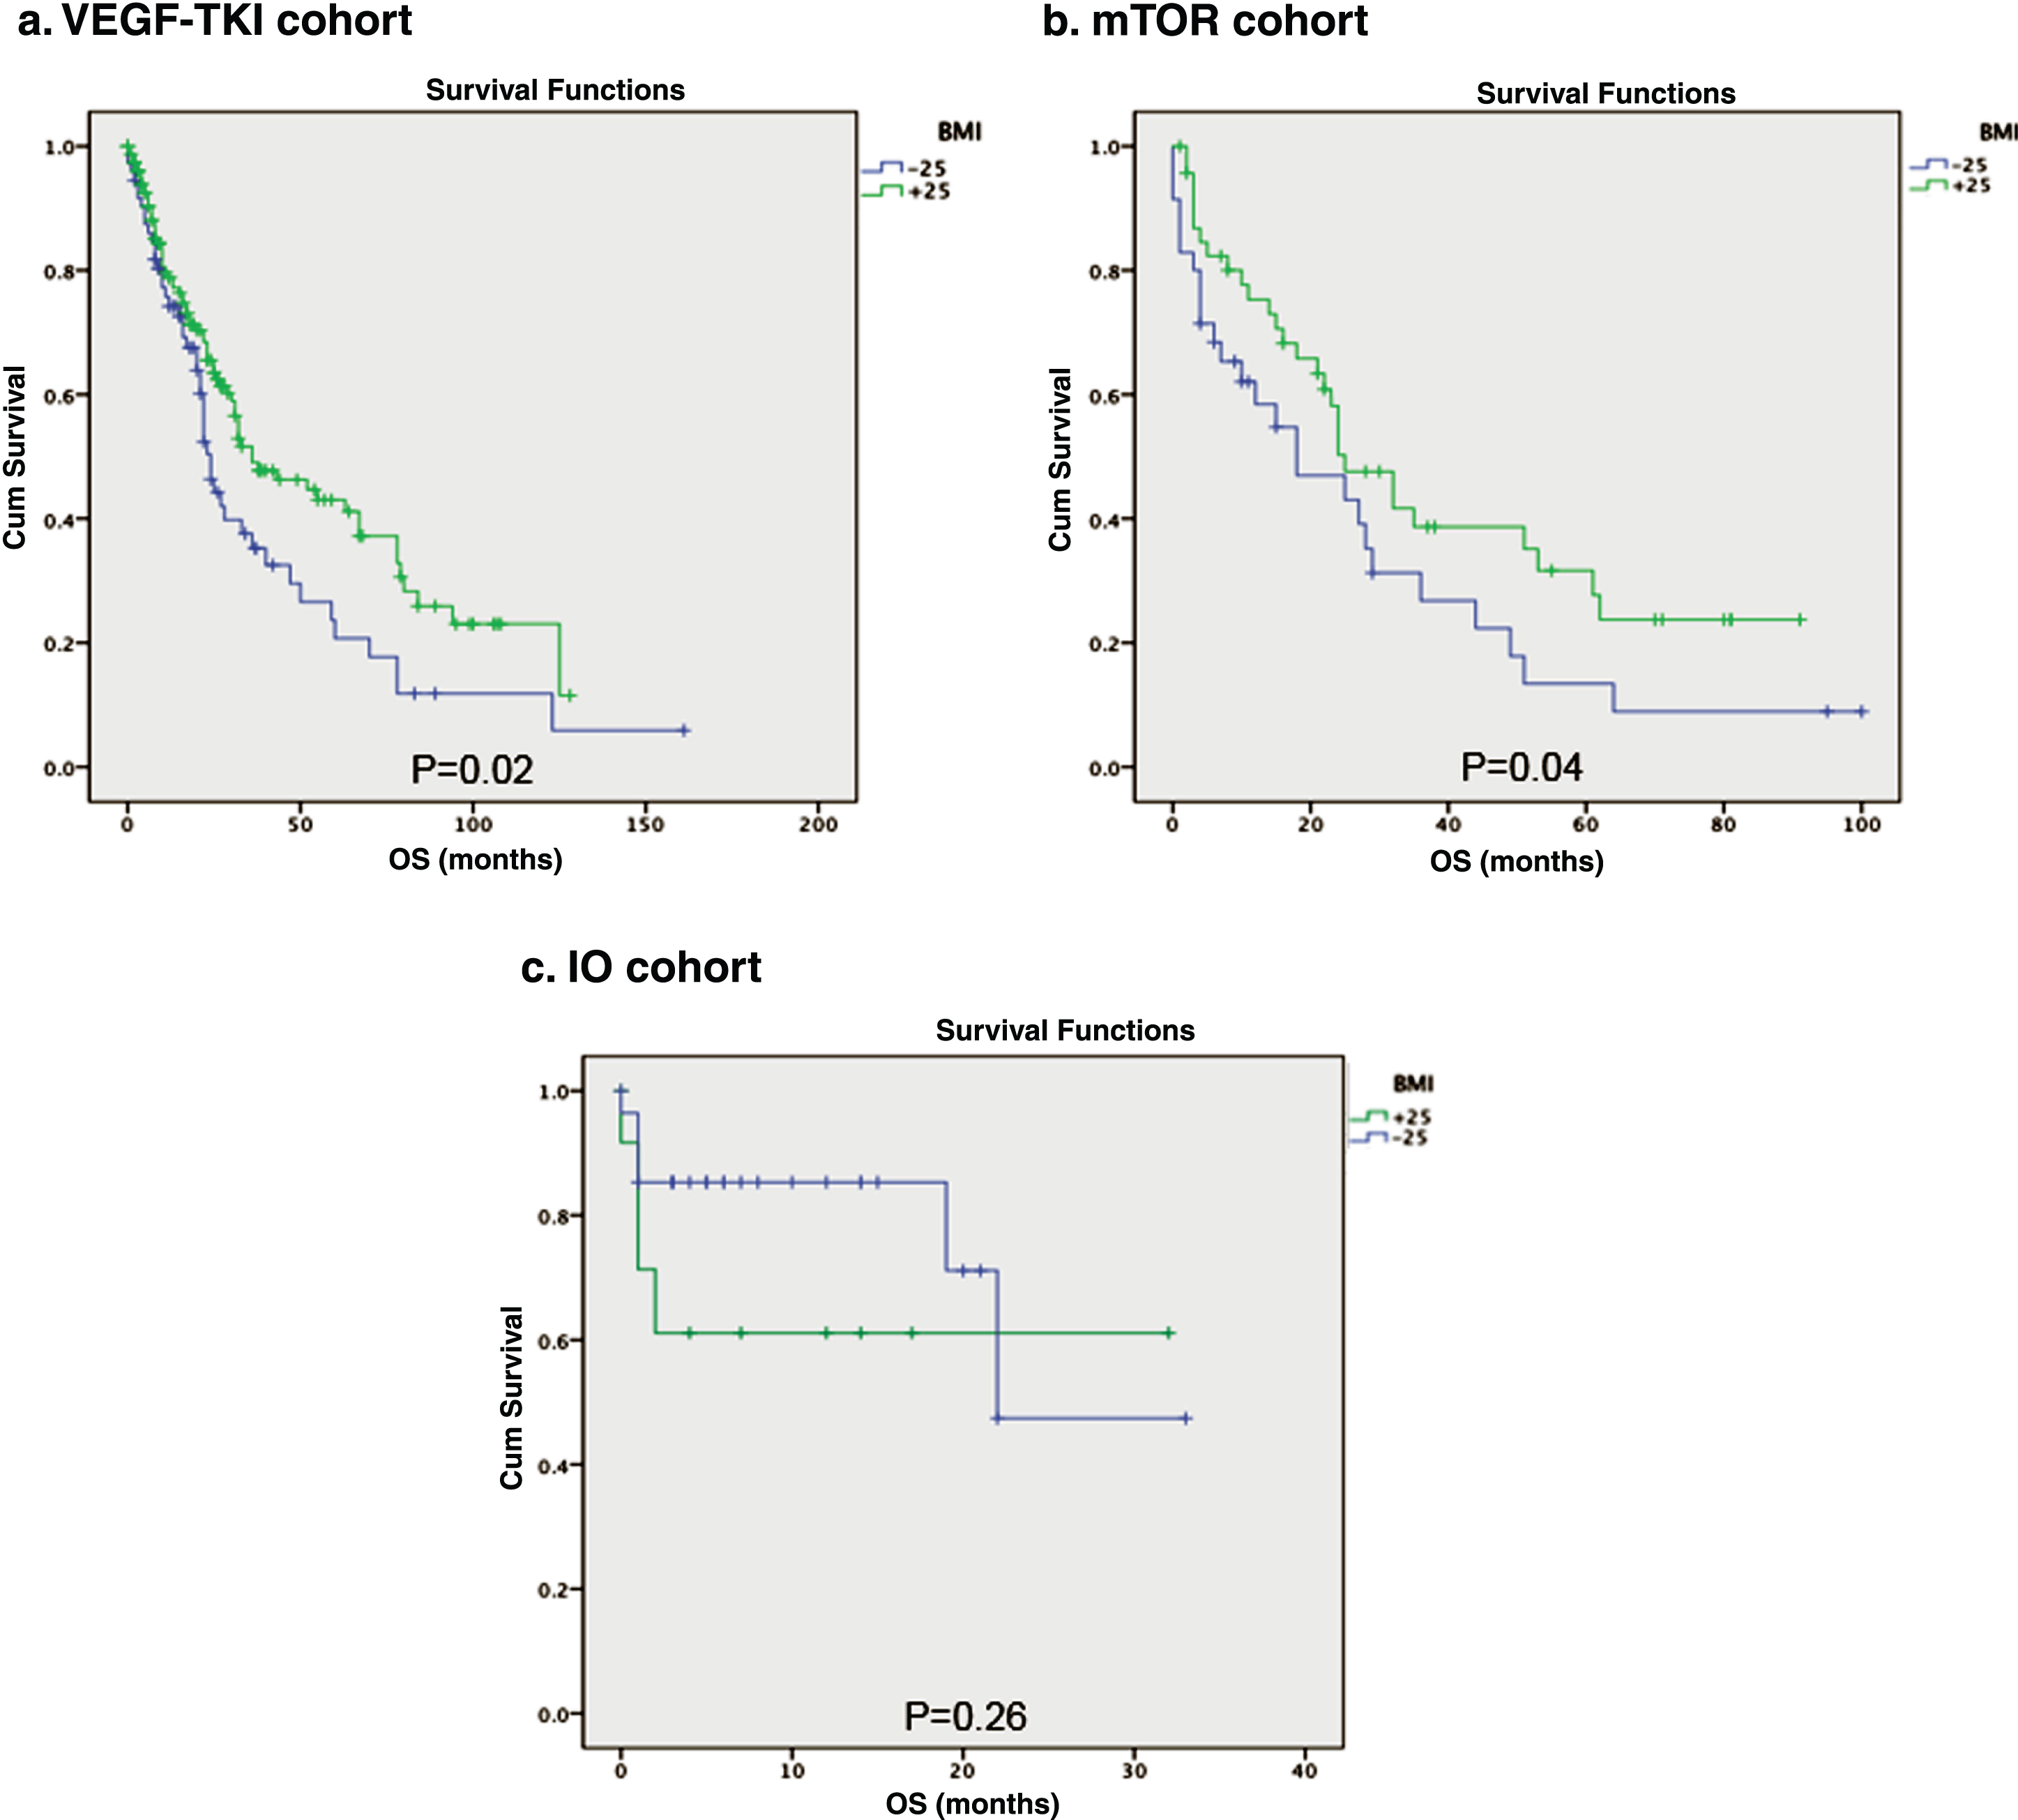
Table 2
Univariate and multivariate Cox proportion hazard analysis of treatment groups
| Variable | Cox Regression when a single explanatory is included | Multivariable Cox Model Including all explanatory variables | ||
| HR (95% CI) | P | Adjusted HR (95% CI) | P | |
| VEGF-TKI | ||||
| Gender (0 = female/1 = male) | 0.82 (0.55–1.20) | 0.30 | 0.81 (0.54–1.22) | 0.33 |
| Race (0 = non white/1 = white) | 1.02 (0.86–1.21) | 0.78 | 0.98 (0.83–1.16) | 0.87 |
| Histology (0 = non clear cell/ 1 = clear cell) | 0.69 (0.43–1.10) | 0.12 | 0.77 (0.47–1.28) | 0.32 |
| IMDC | 2.42 (1.70–3.43) | 0.001 | 2.39 (1.69–3.37) | 0.001 |
| mTOR | ||||
| Gender (0 = female/1 = male) | 0.90 (0.48–1.67) | 0.74 | 0.51 (0.25–1.03) | 0.06 |
| Race (0 = non white/1 = white) | 0.88 (0.69–1.13) | 0.34 | 0.81 (0.62–1.05) | 0.11 |
| Histology (0 = non clear cell/ 1 = clear cell) | 0.77 (0.40–1.47) | 0.43 | 0.72 (0.37–1.41) | 0.35 |
| IMDC | 2.56 (1.61–4.07) | 0.001 | 2.84 (1.77–4.57) | 0.001 |
| IO | ||||
| Gender (0 = female/1 = male) | 1.17 (0.29–4.55) | 0.82 | 1.02 (0.24–4.20) | 0.97 |
| Race (0 = non white/1 = white) | 1.27 (0.80–2.01) | 0.30 | 1.21 (0.75–1.95) | 0.43 |
| Histology (0 = non clear cell/ 1 = clear cell) | 3.58 (0.44–29.12) | 0.23 | 2.66 (0.29–24.32) | 0.38 |
| IMDC | 0.44 (0.11–1.77) | 0.24 | 0.46 (0.11–1.97) | 0.29 |
DISCUSSION
The current retrospective analysis examined the prognostic significance of BMI among patients with metastatic RCC treated with three different classes of drugs, VEGF-TKI, mTOR inhibitors, and immune check point inhibitors. The rates of overweight and obesity mirrored those of the general population across each of the three treatment subgroups of this cohort [5, 6]. Demographic characteristics were also in relative accordance with previous research in this clinical domain. However in contrast to the literature, a greater proportion of men were observed in the V-L (45% female versus 55% male) and IO-L (44% female versus 56% male) subgroups [8]. Whereas the vast majority of patients where white, we did note a relatively high proportion of Asian patients in many of the low-BMI subgroups, which could reflect the impact of cultural differences in diet or exercise habits on body weight [22]. The distribution of histologic subtypes and metastasis was consistent with past studies [9, 23], and thus our study cohort appears representative of the broader RCC patient population recruited in empirical studies.
The prognostic significance of BMI in terms of OS is aligned with the literature demonstrating that patients with high BMI have better OS when treated with VEGF-TKI in the first or second line settings. Notably, mTOR inhibitor presented a similar survival outcome for patients with high BMI. These findings reinforce the positive prognostic role that a high BMI can serve, particularly among patients being treated with targeted therapies. Interactions between molecular pathways such as FASN and VEGF may provide one potential explanation for this association, as they are particularly involved in the neoplastic processes for kidney cancer and for other types of malignancies [20, 24–26]. Particularly among those with RCC, the FASN upregulation can confer a survival growth advantage to tumor cells and thus be predictive of poorer disease outcomes. Notably, this pathway is apparently downregulated in obese patients [27]. The current study findings may raise the question that the differences in the prognosis observed in the different subgroups may be due to an alternative mechanism targeted by certain targeted therapies but not modulated by immunotherapies. However, in the context of IO-based regimens, the association was not significant, which highlight the need to reassess this phenomenon in order to verify if this alternative mechanism plays a role in those treated with IO.
Unfortunately, our small sample size in the IO subgroup might have been underpowered to show a statistically significant result in this case. Nevertheless, it is an interesting trend which merits further investigation. In a recent study (N = 1,918), using a similar methodology, McQuade et al showed that obese male patients (BMI≥30) with metastatic melanoma, treated with targeted therapies or IO, had improvement in PFS and in OS, compared to patients with normal BMI. The survival benefit was not observed among patients who received chemotherapy [28]. These contradictory results could be associated with the different types of cancer investigated, and emphasizes the need for further research to elucidate the relationship between BMI and treatment response, particularly in the context of immunotherapy in kidney cancer.
Further, we highlight that our IMDC findings in the general cohort reflect that most patients with intermediate-prognosis risk factor, which aligns with previous studies. Nevertheless, in the IO group, we found an intriguingly low number of patients with a poor-prognosis over favorable-prognosis for both IO-L and IO-H subgroups what can be considered paradoxical if we have in mind the use of this class of drug in the metastatic setting for kidney cancer, such as the recently approved combination of ipilimumab/nivolumab [17]. Despite the vast majority of patients in these subgroups being intermediate-risk, the difference between poor and favorable-prognostic risk can be due to the context of a clinical trial or, again, the smaller sample size in this particular subgroup. Another interesting result associated to the IMDC is the high number of patients with intermediate- and poor-prognosis receiving mTOR inhibitors, which is in accordance with the literature regarding the main indication for this class of drug in RC [29].
This study enhances our understanding of RCC and the role of body weight in prognostication, however several limitations should be noted. The retrospective nature of this study may provide difficulty in obtaining potentially relevant information beyond the routine clinical data, such as the immunohistochemistry staining for FASN, or gene expression profiling with focus on the fatty acid metabolism pathway in the TCGA data set, as demonstrated in a previous study [20]. Secondly the fairly small sample size among several subgroups warrants caution in the final results and might have been underpowered to show a statistically significant result for the IO group. Finally, the accuracy of BMI in diagnosing obesity has notable limitations, including the inability for it to account for lean muscle mass and appropriate categorization of the elderly and sick. Despite this, BMI has been used in several related studies and does possess utility in clinical practice [30, 31]. Future studies, with a larger sample size, should examine the association between OS and BMI as a quartiles instead of a binary variable. In addition, Steffens et al. showed that the relationship between obesity and prognosis in RCC was significant for patients with higher levels of adipose fat, particularly visceral and subcutaneous fat [21].
CONCLUSIONS
In conclusion, utilizing data collected from a single institution over a period of 8 years, our findings suggest an important relationship between BMI and OS in patients treated with VEGF-TKIs and mTOR inhibitors, classes of drugs currently used in the systemic treatment of mRCC. Previous findings were confirmed, with patients with a higher BMI possessing better outcomes when treated with targeted therapies such as VEGF-TKIs or mTOR inhibitors. In contrast, immune-check point inhibitors were associated with an opposite trend, with a lower BMI associated with better OS, although this result was not statistically significant, potentially due to our small sample size. This correlation merits further investigation, as well as the studies of the possible explanatory molecular mechanisms or genomic alterations. These results provide further evidence of the importance of BMI as a clinical biomarker and prognostic tool, as well as possibly playing a role in treatment selection among those diagnosed with mRCC.
FUNDING
None.
SUPPLEMENTARY MATERIAL
[1] The supplementary material is available in the electronic version of this article: http://dx.doi.org/10.3233/KCA-180047.
REFERENCES
[1] | Wolin KY , Carson K , Colditz GA . Obesity and cancer. The Oncologist. (2010) ;15: :556–65. |
[2] | Chow WH , Gridley G , Fraumeni JF Jr , Jarvholm B . Obesity, hypertension, and the risk of kidney cancer in men. The New England Journal of Medicine. (2000) ;343: :1305–11. |
[3] | Chow W-H , Dong LM , Devesa SS . Epidemiology and risk factors for kidney cancer. Nature Reviews Urology. (2010) ;7: :245. |
[4] | Renehan AG , Tyson M , Egger M , Heller RF , Zwahlen M . Body-mass index and incidence of cancer: A systematic review and meta-analysis of prospective observational studies. The Lancet. (2008) ;371: :569–78. |
[5] | Centers for Disease Control and Prevention. Obesity Trends Among US Adults Between 1985 and 2010. |
[6] | Ligibel JA , Alfano CM , Courneya KS , Demark-Wahnefried W , Burger RA , Chlebowski RT , et al. American Society of Clinical Oncology position statement on obesity and cancer. Journal of clinical oncology: Official Journal of the American Society of Clinical Oncology. (2014) ;32: :3568–74. |
[7] | Calle EE , Rodriguez C , Walker-Thurmond K , Thun MJ . Overweight, obesity, and mortality from cancer in a prospectively studied cohort of U.S. adults. The New England Journal of Medicine. (2003) ;348: :1625–38. |
[8] | Surveillance, Epidemiology, and End Results Program. SEER stat fact sheets: Kidney and renal pelvis cancer. Bethesda, MD: National Cancer Institute. |
[9] | Choueiri TK , Motzer RJ . Systemic Therapy for Metastatic Renal-Cell Carcinoma. The New England Journal of Medicine. (2017) ;376: :354–66. |
[10] | Rosenblatt J , McDermott DF . Immunotherapy for renal cell carcinoma. Hematology/Oncology Clinics of North America. (2011) ;25: :793–812. |
[11] | Fyfe G , Fisher RI , Rosenberg SA , Sznol M , Parkinson DR , Louie AC . Results of treatment of 255 patients with metastatic renal cell carcinoma who received high-dose recombinant interleukin-2 therapy. Journal of clinical oncology: Official Journal of the American Society of Clinical Oncology. (1995) ;13: :688–96. |
[12] | Motzer RJ , Bacik J , Murphy BA , Russo P , Mazumdar M . Interferon-alfa as a comparative treatment for clinical trials of new therapies against advanced renal cell carcinoma. Journal of Clinical Oncology: Official Journal of the American Society of Clinical Oncology. (2002) ;20: :289–96. |
[13] | Harshman LC , Xie W , Bjarnason GA , Knox JJ , MacKenzie M , Wood L , et al. Conditional survival of patients with metastatic renal-cell carcinoma treated with VEGF-targeted therapy: A population-based study. The Lancet Oncology. (2012) ;13: :927–35. |
[14] | Singh P , Agarwal N , Pal SK . Sequencing systemic therapies for metastatic kidney cancer. Current Treatment Options in Oncology. (2015) ;16: :316. |
[15] | Pal SK , Quinn DI . Differentiating mTOR inhibitors in renal cell carcinoma. Cancer Treatment Reviews. (2013) ;39: :709–19. |
[16] | Pal SK , Hu A , Chang M , Figlin RA . Programmed death-1 inhibition in renal cell carcinoma: Clinical insights and future directions. Clinical Advances in Hematology & Oncology: H&O. (2014) ;12: :90–9. |
[17] | Motzer RJ , Tannir NM , McDermott DF , Aren Frontera O , Melichar B , Choueiri TK , et al. Nivolumab plus Ipilimumab versus Sunitinib in Advanced Renal-Cell Carcinoma. The New England Journal of Medicine. (2018) ;378: :1277–90. |
[18] | Hakimi AA , Furberg H , Zabor EC , Jacobsen A , Schultz N , Ciriello G , et al. An Epidemiologic and Genomic Investigation Into the Obesity Paradox in Renal Cell Carcinoma. JNCI: Journal of the National Cancer Institute. (2013) ;105: :1862–70. |
[19] | Choueiri TK , Xie W , Kollmannsberger CK , Rini BI , McDermott DF , Knox JJ , et al. The impact of body mass index (BMI) and body surface area (BSA) on treatment outcome to vascular endothelial growth factor (VEGF)-targeted therapy in metastatic renal cell carcinoma: Results from a large international collaboration. Journal of Clinical Oncology. (2010) ;28: :4524. |
[20] | Albiges L , Hakimi AA , Xie W , McKay RR , Simantov R , Lin X , et al. Body Mass Index and Metastatic Renal Cell Carcinoma: Clinical and Biological Correlations. Journal of Clinical Oncology. (2016) ;34: :3655–63. |
[21] | Steffens S , Grunwald V , Ringe KI , Seidel C , Eggers H , Schrader M , et al. Does obesity influence the prognosis of metastatic renal cell carcinoma in patients treated with vascular endothelial growth factor-targeted therapy? The Oncologist. (2011) ;16: :1565–71. |
[22] | Hales CM , Carroll MD , Fryar CD , Ogden CL . Prevalence of Obesity Among Adults and Youth: United States, 2015-2016. NCHS data brief. (2017) :1–8. |
[23] | Gong J , Maia MC , Dizman N , Govindarajan A , Pal SK . Metastasis in renal cell carcinoma: Biology and implications for therapy. Asian Journal of Urology. (2016) ;3: :286–92. |
[24] | Bian Y , Yu Y , Wang S , Li L . Up-regulation of fatty acid synthase induced by EGFR/ERK activation promotes tumor growth in pancreatic cancer. Biochemical and Biophysical Research Communications. (2015) ;463: :612–7. |
[25] | Zaytseva YY , Elliott VA , Rychahou P , Mustain WC , Kim JT , Valentino J , et al. Cancer cell-associated fatty acid synthase activates endothelial cells and promotes angiogenesis in colorectal cancer. Carcinogenesis. (2014) ;35: :1341–51. |
[26] | Zhou Y , Jin G , Mi R , Zhang J , Zhang J , Xu H , et al. Inhibition of fatty acid synthase suppresses neovascularization via regulating the expression of VEGF-A in glioma. Journal of Cancer Research and Clinical Oncology. (2016) ;142: :2447–59. |
[27] | Hakimi AA , Furberg H , Zabor EC , Jacobsen A , Schultz N , Ciriello G , et al. An epidemiologic and genomic investigation into the obesity paradox in renal cell carcinoma. Journal of the National Cancer Institute. (2013) ;105: :1862–70. |
[28] | McQuade JL , Daniel CR , Hess KR , Mak C , Wang DY , Rai RR , et al. Association of body-mass index and outcomes in patients with metastatic melanoma treated with targeted therapy, immunotherapy, or chemotherapy: A retrospective, multicohort analysis. The Lancet Oncology. (2018) ;19: :310–22. |
[29] | Motzer RJ , Jonasch E , Agarwal N , Bhayani S , Bro WP , Chang SS , et al. Kidney Cancer, Version 2.2017, NCCN Clinical Practice Guidelines in Oncology. Journal of the National Comprehensive Cancer Network: JNCCN. (2017) ;15: :804–34. |
[30] | Romero-Corral A , Somers VK , Sierra-Johnson J , Thomas RJ , Collazo-Clavell ML , Korinek J , et al. Accuracy of body mass index in diagnosing obesity in the adult general population. International Journal Of Obesity. (2008) ;32: :959. |
[31] | Choi Y , Park B , Jeong BC , Seo SI , Jeon SS , Choi HY , et al. Body mass index and survival in patients with renal cell carcinoma: A clinical-based cohort and meta-analysis. International Journal of Cancer. (2013) ;132: :625–34. |


