
UBNet: Deep learning-based approach for automatic X-ray image detection of pneumonia and COVID-19 patients
Abstract
BACKGROUND:
Analysis of chest X-ray images is one of the primary standards in diagnosing patients with COVID-19 and pneumonia, which is faster than using PCR Swab method. However, accuracy of using X-ray images needs to be improved.
OBJECTIVE:
To develop a new deep learning system of chest X-ray images and evaluate whether it can quickly and accurately detect pneumonia and COVID-19 patients.
METHODS:
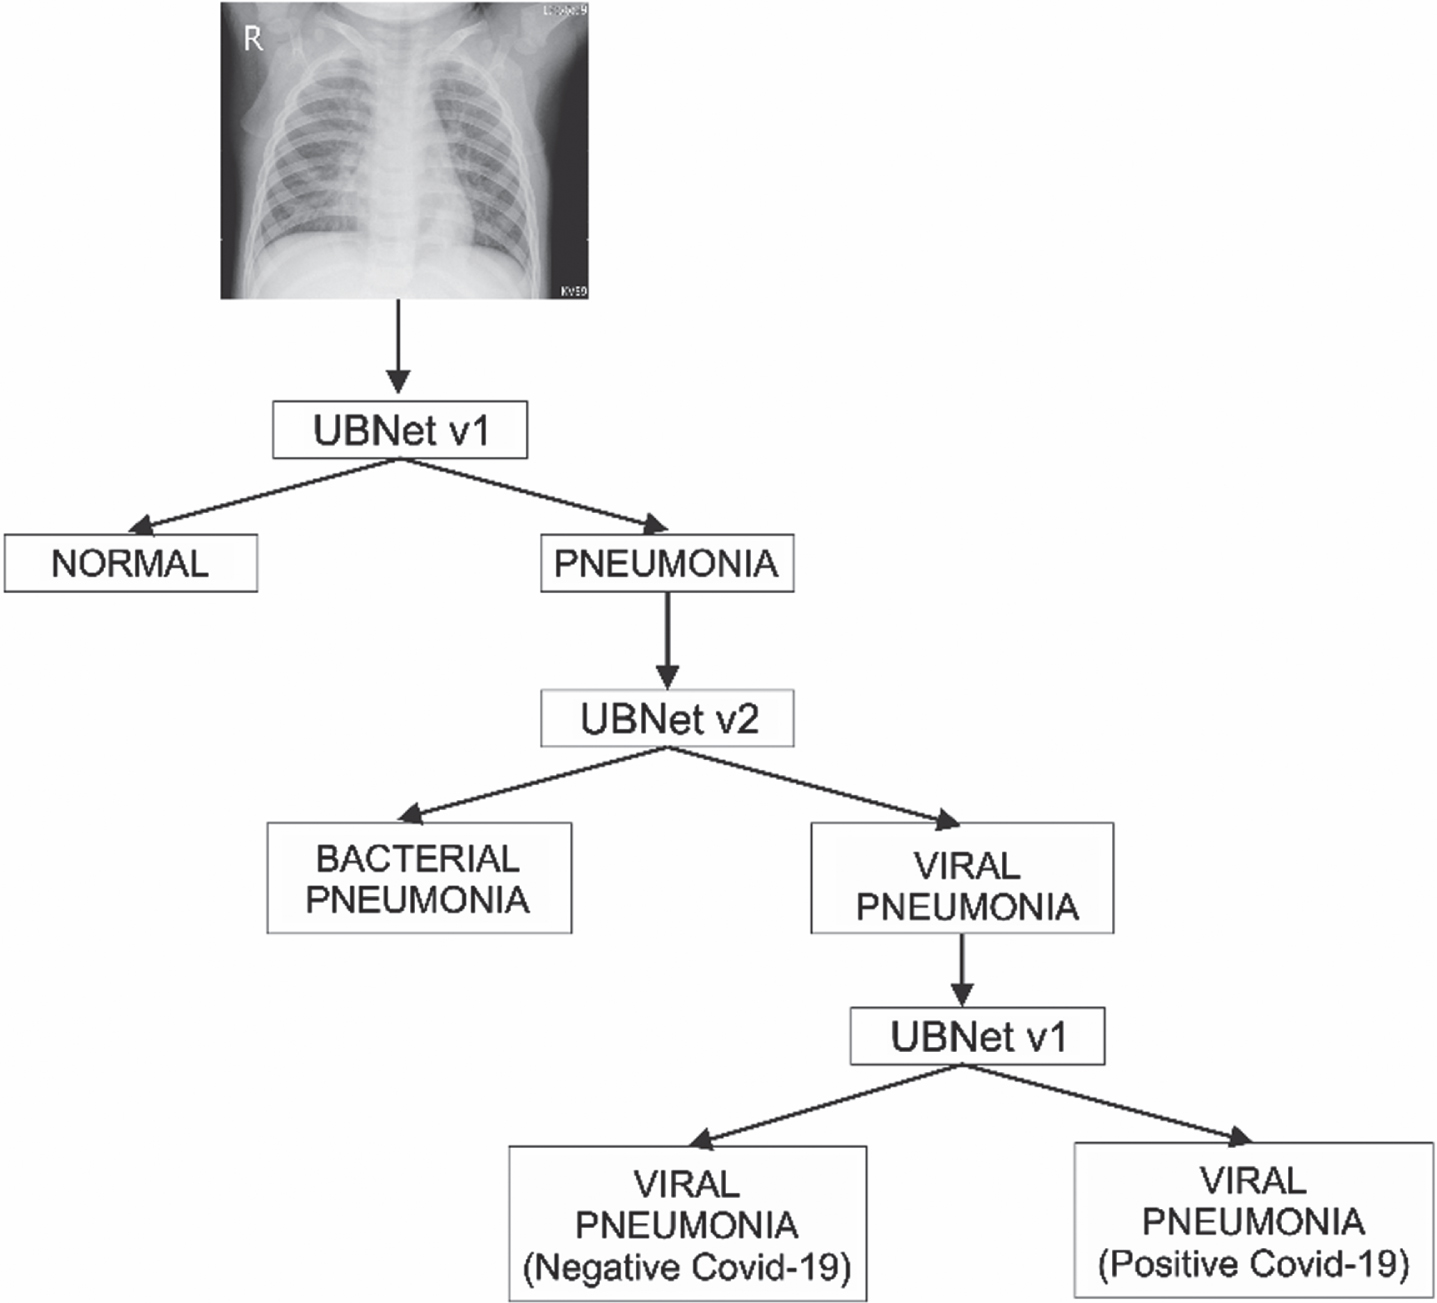
The developed deep learning system (UBNet v3) uses three architectural hierarchies, namely first, to build an architecture containing 7 convolution layers and 3 ANN layers (UBNet v1) to classify between normal images and pneumonia images. Second, using 4 layers of convolution and 3 layers of ANN (UBNet v2) to classify between bacterial and viral pneumonia images. Third, using UBNet v1 to classify between pneumonia virus images and COVID-19 virus infected images. An open-source database with 9,250 chest X-ray images including 3,592 COVID-19 images were used in this study to train and test the developed deep learning models.
RESULTS:
CNN architecture with a hierarchical scheme developed in UBNet v3 using a simple architecture yielded following performance indices to detect chest X-ray images of COVID-19 patients namely, 99.6%accuracy, 99.7%precision, 99.7%sensitivity, 99.1%specificity, and F1 score of 99.74%. A desktop GUI-based monitoring and classification system supported by a simple CNN architecture can process each chest X-ray image to detect and classify COVID-19 image with an average time of 1.21 seconds.
CONCLUSION:
Using three hierarchical architectures in UBNet v3 improves system performance in classifying chest X-ray images of pneumonia and COVID-19 patients. A simple architecture also speeds up image processing time.
1Introduction
Most COVID-19 sufferers experience respiratory problems that affect the lungs’ air sacs, also known as pneumonia. This condition can cause by viral, bacterial, and fungal infections. The lungs of people with pneumonia disturb because the tiny air pockets at the end of the airways fill with pus due to inflammation caused by viruses and bacteria. The causes pneumonia sufferers to experience shortness of breath, cough with phlegm, chills, and even death. Until now, the COVID-19 pandemic outbreak is still not over, so that an effective and accurate COVID-19 patient diagnosis system needs for proper patient handling [1].
Several screening processes for the diagnosis of COVID-19 patients use the RT-PCR, Antigen Swab, and Rapid test methods. The working principle of each screening method is different. RT-PCR detected the presence of SARS-Cov-2 viral RNA in patient samples. Antigen Swab works by detecting specific proteins from the SARS-Cov-2 virus that cause immunity or antibodies. At the same time, the rapid test detects the presence of antigens released by the body because of the SARS-Cov-2 virus. However, the most accurate method used is reverse transcription-polymerase chain reaction (RT-PCR) [1].
Diagnosing pneumonia in COVID-19 methods can also be done by analysing the patient’s chest X-ray image. There are differences between positive and negative patient images to be used for the diagnosis process. An X-ray image is a photo of an organ taken using a beam fired into the patient’s body. The mechanism is that the detector receives x-ray rays, and then its intensity interprets the anatomical shape of the patient’s body [2]. Thus, chest X-ray images are commonly used by radiologists to detect lung diseases including COVID-19 virus infected pneumonia cases [3].
Recently, artificial intelligence technology that uses Convolutional Neural Network (CNN) model with different architectures has been investigated and applied to medical imaging field. CNN has the best performance in image processing, and its architecture significantly affects the performance of the system built. The CNN artificial neural network model to automatically classify pneumonia patients based on chest X-ray images using the VGG16 and Xception architectures obtained good results. However, the error value is still high for the implementation of the medical field, so that it has not been effectively used [4]. Recent studies have demonstrated that classification of pneumonia and analysis of positive images of COVID-19 using variety of CNN architecture, including VGG19, Inception, Residual network, and CovXNet, provided promising results [5–7].
Some prominent differences between CNN architectures in the number and arrangement of layers used. For example, VGG16 uses 16 CNN layers, VGG19 uses 19 CNN layers, Inception uses 48 CNN layers [8], and XCeption uses 72 CNN layers [9]. This difference in the arrangement and number of CNN layers impacts each CNN architecture’s performance in classifying [10]. In developing deep learning architectural models, the performance used as the primary reference in the form of model performance such as accuracy, precision, specificity, and no less important is how to balance the computational load, which affect the speed of analysis. Light computing load requires computer specifications that are not too high.
2Materials and method
2.1Pre-processing data
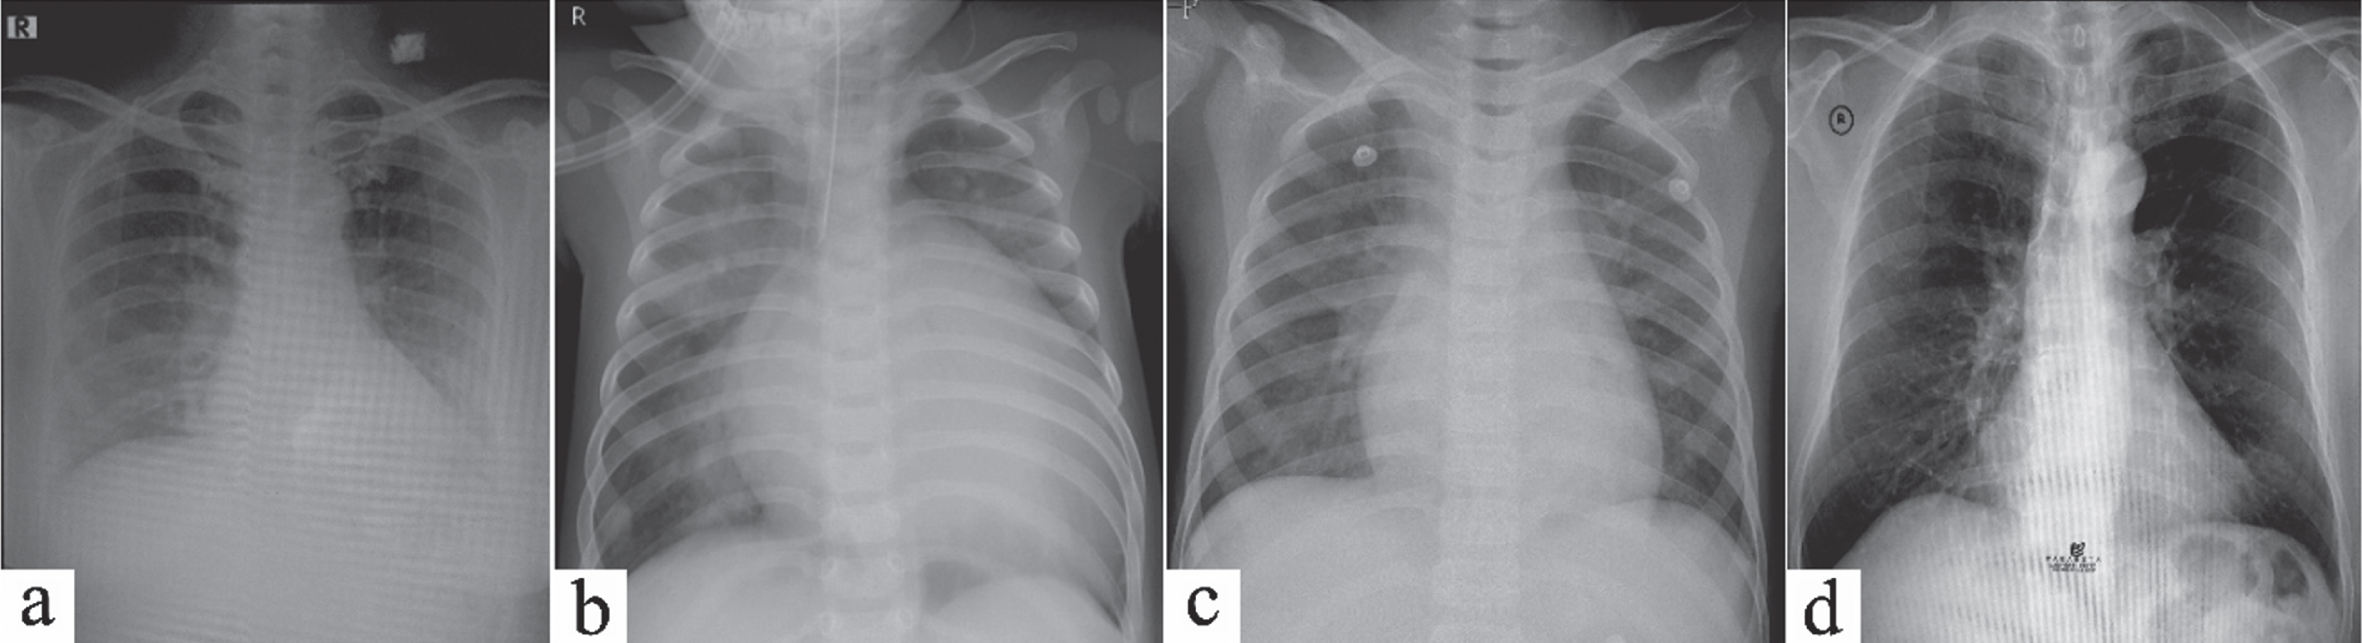
The X-ray image dataset used is open-source data for scientific development purposes obtained from the internal data of the Guangzhou Women and Children’s Medical Center in jpeg format. In addition, X-ray image data of local COVID-19 cases obtained from the internal data of Persahabatan Hospital in Jakarta make use of it to test the diagnosis system. The data taken were 1,583 normal images, 2,730 bacterial pneumonia images, 1,345 viral pneumonia images, and 3592 COVID-19 images [11] as listed in Table 1. The COVID-19 dataset obtains from the published results conducted by Tawsifur Rahman et al. [12]. Figure 1 shows some X-ray image data from various classes.
Table 1
The chest X-ray image dataset
| Class | Total Data |
| Normal | 1583 |
| Bacterial pneumonia | 2730 |
| Viral pneumonia (non-COVID-19) | 1345 |
| Viral pneumonia (positive for COVID-19) | 3592 |
Fig. 1
Chest X-ray image of: (a) Viral pneumonia and Positif COVID-19, (b) Bacterial pneumonia, (c) Viral pneumonia (negative COVID-19), and (d) Normal X-ray image.
Pre-processing data needs to prepare datasets in deep learning training. First, the data is selected from the image that is not cropped in the lungs using data cleansing and data wrangling, then standardizes the various image sizes into a 2D image measuring 400×400 grayscale. Next, normalize the image pixel values in the range 0 to 1.
2.2CNN architecture for pneumonia and normal image classification
In the normal and pneumonia classification, the CNN architecture is named UBNet v1. The UBNet v1 model uses ReLU (Rectified Linear Unit) and Softmax activation functions on neurons. The Softmax activation function determines the output trend in each class, its value between 0 and 1. UBNet v1 architecture uses parameters epoch = 10, Batch Size = 32, Adam’s Optimizer, ReLU activation function, and Categorical Cross-Entropy loss function.
Initial training on the system using the K-fold validation method of 10 folds resulted in the best UBNet v1 architectural structure consisting of 7 convolutions and 3 layers of artificial neural networks, as shown in Table 2. UBNet v1 architecture uses Image input in 2D format with size (400×400). So that the total parameters generated are 20,805,170 with an average layer size (1×80,000), and the last layer corresponds to the number of classes in the classification using two outputs.
Table 2
UBNet v1 architecture
| UBNet v1 | Activation Shape | Activation Size | Parameter |
| Input (400×400×1) | 400×400×1 | 160000 | 0 |
| Convolution (7×7) f = 16 p = 3 | 400×400×16 | 2560000 | 800 |
| Convolution (7×7) f = 16 p = 3 | 400×400×16 | 2560000 | 12560 |
| Maxpool (2×2) | 200×200×16 | 640000 | 0 |
| Convolution (5×5) f = 32 p = 2 | 200×200×32 | 1280000 | 12832 |
| Convolution (5×5) f = 32 p = 2 | 200×200×32 | 1280000 | 25632 |
| Maxpool (2×2) | 100×100×32 | 320000 | 0 |
| Convolution (3×3) f = 64 p = 1 | 100×100×64 | 640000 | 18496 |
| Maxpool (2×2) | 50×50×64 | 160000 | 0 |
| Convolution (3×3) f = 128 p = 1 | 50×50×128 | 320000 | 73856 |
| Convolution (3×3) f = 128 p = 1 | 50×50×128 | 320000 | 147584 |
| Maxpool (2×2) | 25×25×128 | 80000 | 0 |
| Flatten Layer | 1×80000 | 80000 | 0 |
| Fully Connected Layer 1 (n = 256) | 1×256 | 256 | 20480256 |
| Fully Connected Layer 2 (n = 128) | 1×128 | 128 | 32896 |
| Fully Connected Layer 3 (n = 2) | 1×2 | 2 | 258 |
2.3CNN architecture for image classification of bacterial pneumonia and viral pneumonia
The CNN architecture for classifying bacterial and viral pneumonia is a modification of UBNet v1 called UBNet v2. In UBNet v2 architecture, the parameters are 10 epochs, Batch size = 32, Adam’s Optimizer, Activation Function ReLU, and Loss Function with Categorical Cross Entropy. The best architectural structure in UBNet v2 obtains an architecture consisting of 4 convolution and 3 neural network layers. UBNet v2, as shown in Table 3, uses input data in 2D format with a size of 400×400. Therefore, the total parameters generated were 20,610,562 with a flatten layer size (1×80,000). Each class uses one output in the last layer to predict the output value between 0 and 1.
Table 3
UBNet v2 architecture
| UBNet v2 | Activation Shape | Activation Size | Parameter |
| Input (400×400×1) | 400×400×1 | 160000 | 0 |
| Convolution (7×7) f = 16 p = 1 | 400×400×16 | 2560000 | 160 |
| Maxpool (2×2) | 200×200×16 | 640000 | 0 |
| Convolution (5×5) f = 32 p = 1 | 200×200×32 | 1280000 | 4640 |
| Maxpool (2×2) | 100×100×32 | 320000 | 0 |
| Convolution (3×3) f = 64 p = 1 | 100×100×64 | 640000 | 18496 |
| Maxpool (2×2) | 50×50×64 | 160000 | 0 |
| Convolution (3×3) f = 128 p = 1 | 50×50×128 | 320000 | 73856 |
| Maxpool (2×2) | 25×25×128 | 80000 | 0 |
| Flatten Layer | 1×80000 | 80000 | 0 |
| Fully Connected Layer 1 (n = 256) | 1×256 | 256 | 20480256 |
| Fully Connected Layer 2 (n = 128) | 1×128 | 128 | 32896 |
| Fully Connected Layer 3 (n = 2) | 1×2 | 2 | 258 |
2.4CNN architecture for pneumonia and COVID-19 image classification
The classification process for viral pneumonia (negative COVID-19) and viral pneumonia (positive COVID-19) uses a combined architecture of UBNet v1 and UBNet v2 called UBNet v3. The model consists of 3 architectural models trained with 3 different data variations according to their respective classifications using a decision hierarchy scheme, as shown in Fig. 2.
Fig. 2
The decision hierarchy scheme uses the UBNet v3 architectures.
Evaluation to find out the performance of the model using the confusion matrix method. This method measures the performance of a model in classifying several objects, including accuracy, sensitivity, precision, specificity, and f1 score. Here is the equation of the evaluation metrics:
(1)
(2)
(3)
(4)
(5)
TP, TN, FP, and FN are true positive, true negative, false positive, and false negative values, respectively [13]. The parameters used to evaluate each model are accuracy (A), precision (P), recall (R), specificity (S), and F1-score (F1). Accuracy evaluates the model’s accuracy and describes the ratio of the number of accurately classified images to the total number of test images. The precision of the model represents the ratio of accurately classified images from the predicted composite images of the same class. Recall or sensitivity represents the ratio of accurately classified as first-class images from the total number of predicted images. Specificity is the correctness of predicting negative compared to the overall negative-data.
Meanwhile, the F1-score states the average value of precision and recall. This value can be used for model optimization towards better precision or recall [14]. The parameters used to evaluate each model were accuracy (A), precision (P), recall (R), specificity (S), and F1-score (F1). The training process uses the K-Fold validation method. The validation process repeated with different training and validation data arrangements using 10 Fold and 10 Epoch parameters in each fold [15]. Each UBNet architecture trained with varying dataset variation saved in a file with the extension.h5. The file is called into the main program, containing several UBNet models trained with the decision hierarchy schema. In the next step, the system-trained using new images from various classes. The results of the chest X-ray image analysis and the image classification diagnosis are the system’s output. The analysis result display system was developed based on a GUI with a simple scheme to simplify users or specifically assist radiology doctors in diagnosing COVID-19 patients based on chest X-ray images.
3Results and discussion
The training process on both CNN architectures (UBNet v1 and UBNet v2) with the same parameters to determine the characteristics of each class. Evaluation of model performance uses a total of 1,499 test data images.
3.1Classification of pneumonia –normal
UBNet v1’s test accuracy is up to 91%, a good result, considering that UBNet’s development considerations are on performance, computational load, and execution time. The results of unique feature extraction from images with two different classes with flatten layer visualization follow the number of Flatten Output layers on UBNet v1 architecture of 1×80,000 layers, as shown in Fig. 3.
Fig. 3
(a) Average of 10 Normal chest X-rays dan (b) average of 10 Pneumonia chest X-rays.
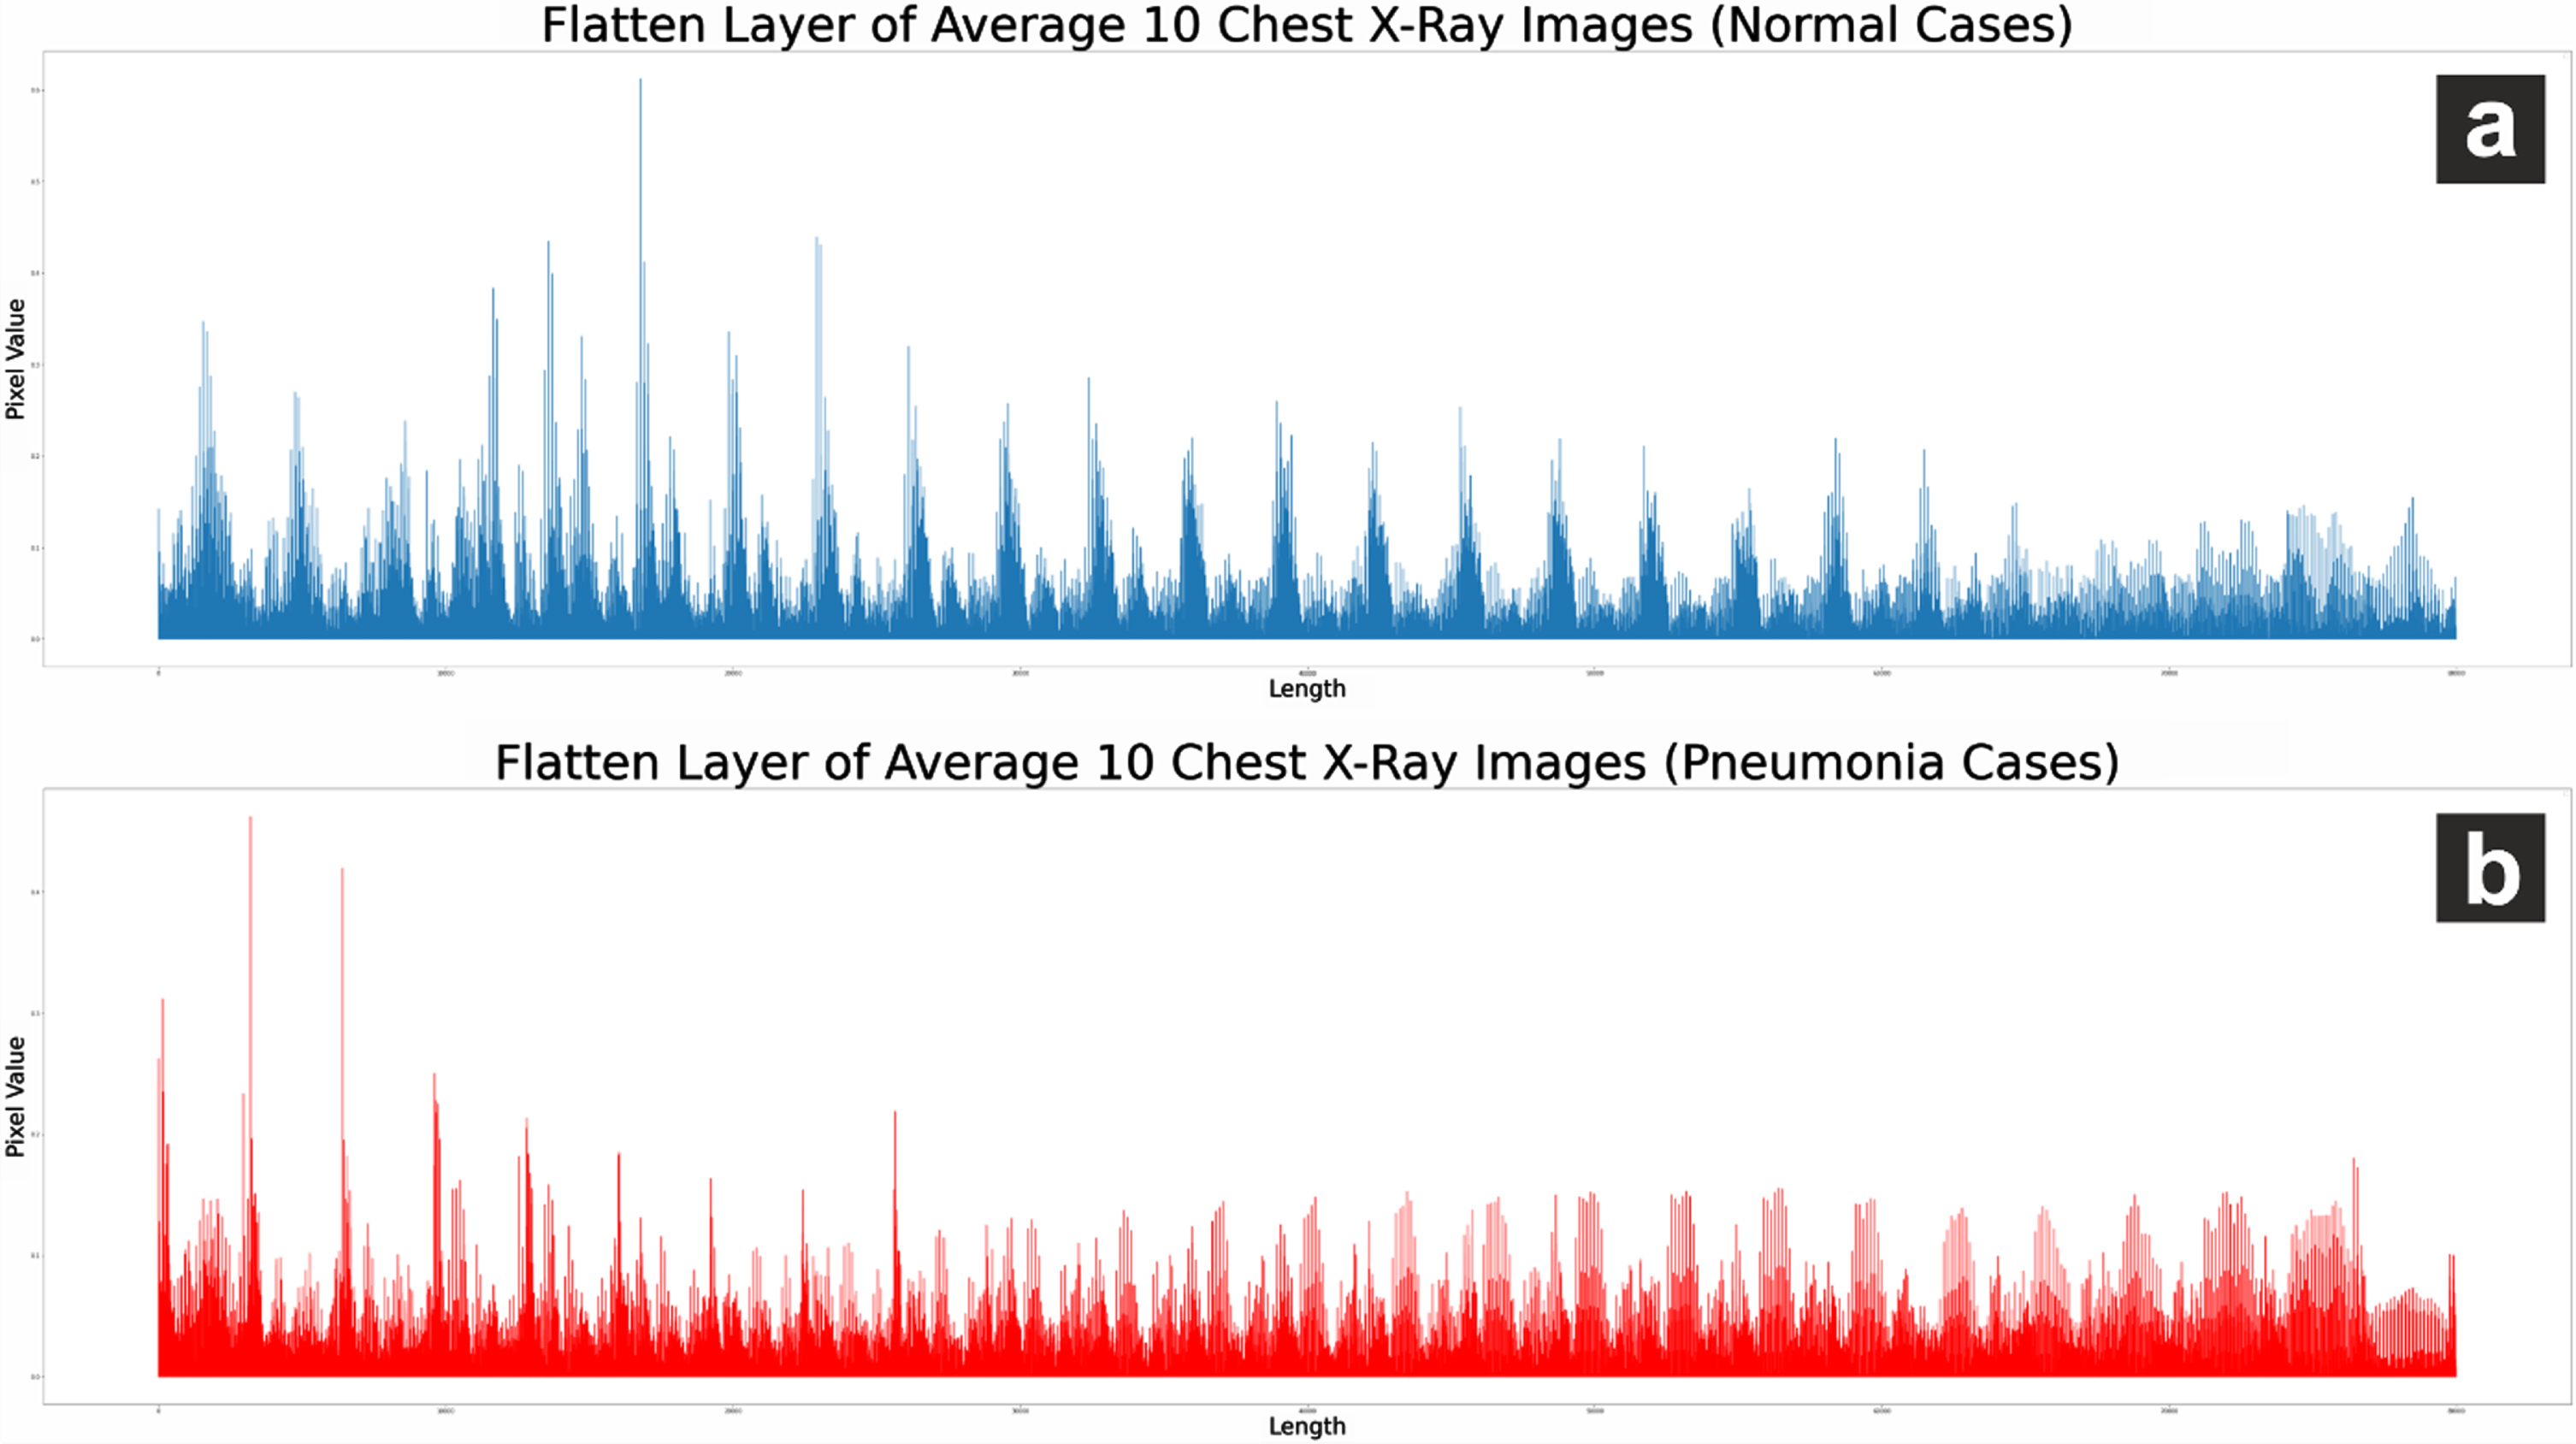
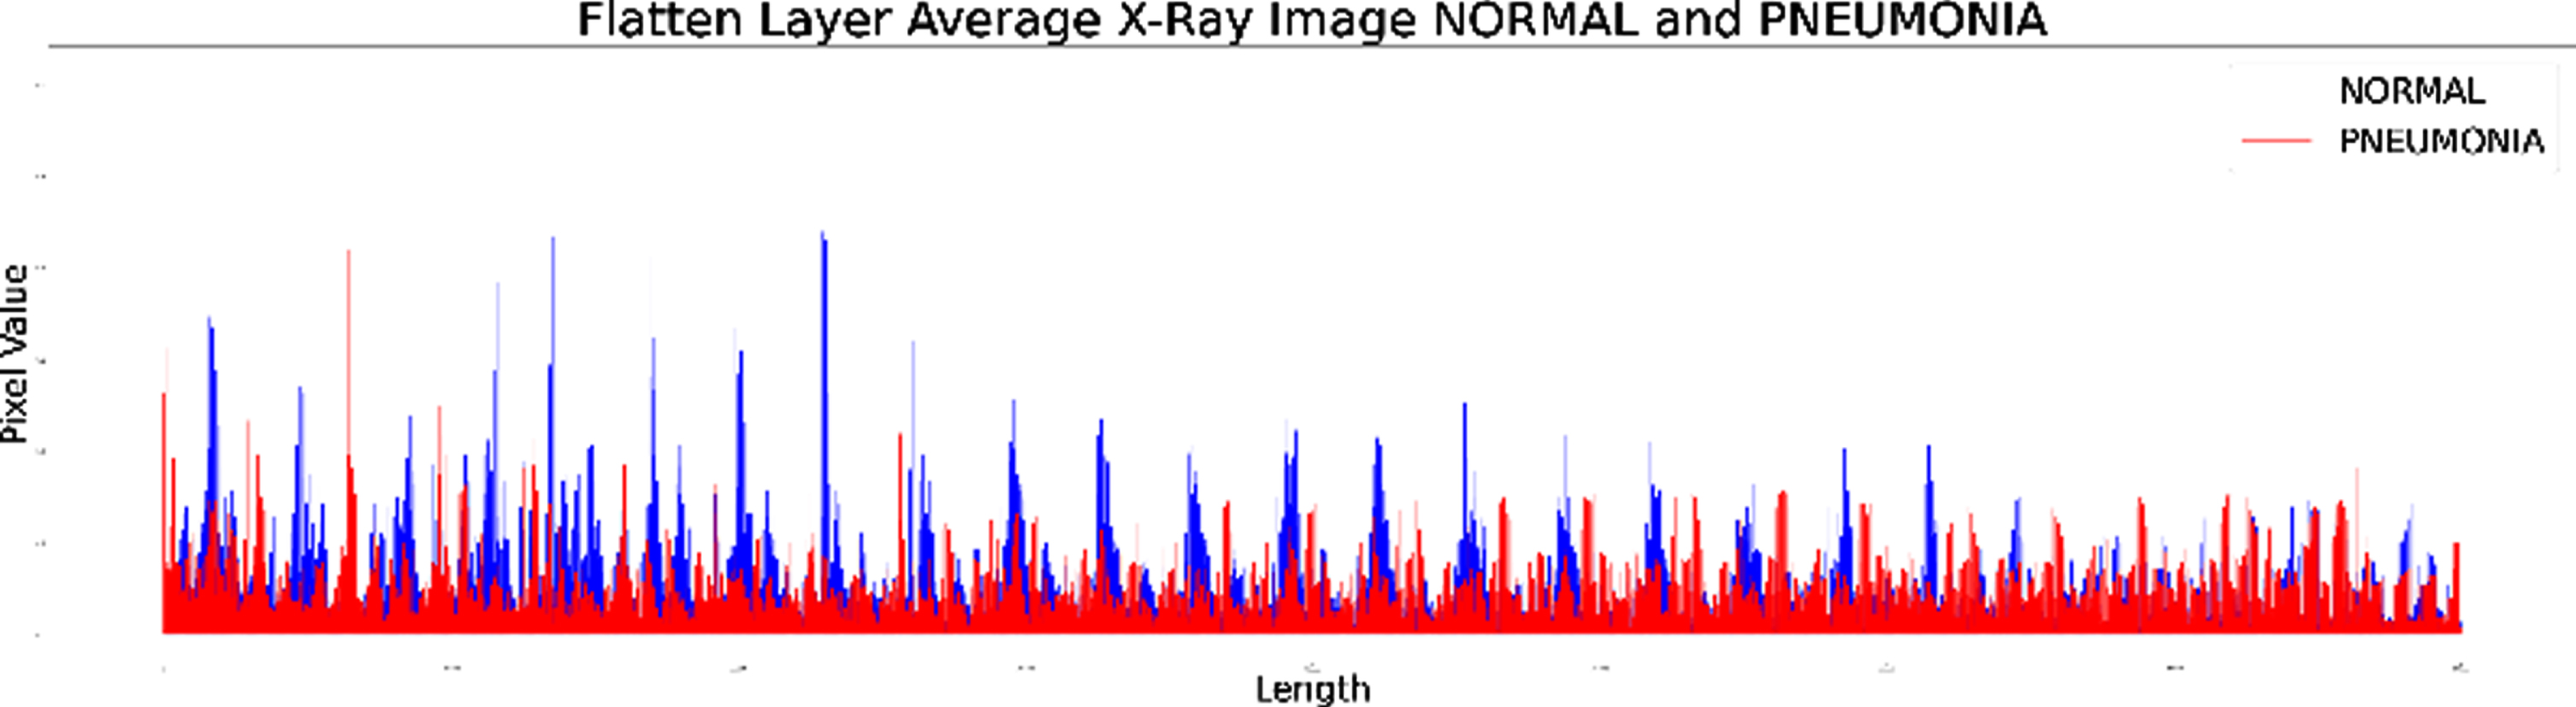
The difference in the Flatten layer graph for sampling 10 images shows that the flatten layer in the pneumonia image has a relatively lower pixel value. These results indicate that the Convolution Layer on CNN UBNet v1 architecture can perform unique feature extraction on normal chest X-ray images and pneumonia.
Fig. 4
Visualization of flatten layer on a chest X-ray image of pneumonia and normal.
The results of the UBNet v1 architecture evaluation on several testing data as shown in Table 4 are displayed in a confusion matrix as shown in Fig. 5 with the performance evaluation parameters as shown in Table 5. In addition to predicting 129 and 421 images, the UBNet v1 architecture also performs 24 misclassifications on image predictions.
Table 4
Data testing
| Class | Total |
| Pneumonia | 149 |
| Normal | 425 |
Fig. 5
Confusion matrix UBNet v1.
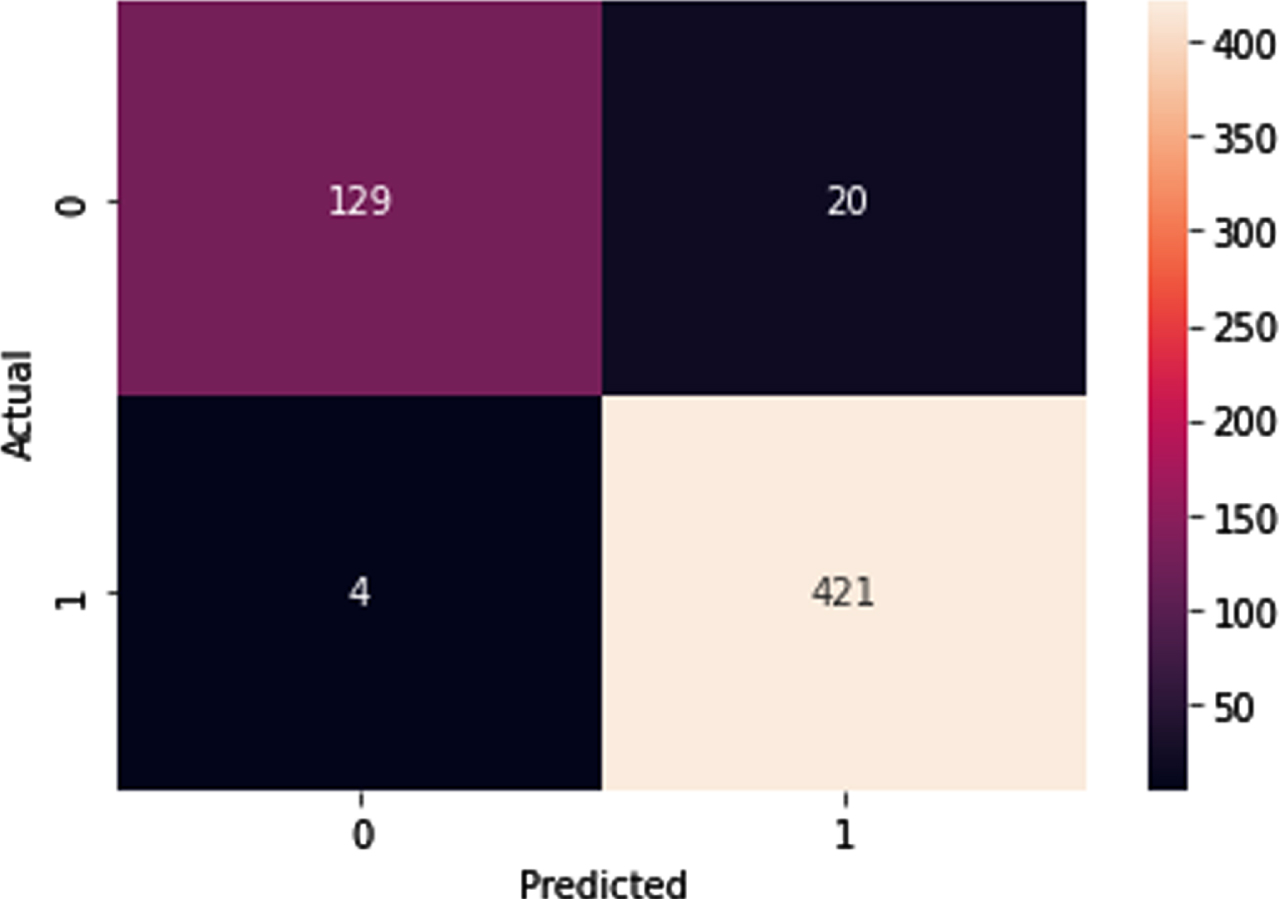
Table 5
UBNet v1 architecture performance
| Metrics | Percentage |
| Accuracy | 95,82% |
| Precision | 86,58% |
| Sensitivity/recall | 96,99% |
| specificity | 95,46% |
| f1 score | 91,49% |
Evaluation of the performance of UBNet v1 using test data following the references in previous studies [4]. It also compares the architecture’s performance with several existing architectures such as CovXNet, Inception, XCeption, VGG16, VGG19, and Residual Network [5]. Table 6 shows a comparison of the evaluation results for several CNN architectures.
Table 6
Comparison of several architectures for the classification of pneumonia and normal
| Architecture | Total Layers | A(%) | P(%) | R(%) | S (%) | f1 (%) |
| UBNet v1 | 10 | 95.8 | 86.8 | 97 | 95 | 91 |
| CovXNet | 40 | 98.1 | 98 | 98.5 | 97.9 | 98.3 |
| Inception | 48 | 88.7 | 88.9 | 94.1 | 80.2 | 91.1 |
| Xception | 71 | 82 | 65 | 85 | 82 | 74 |
| VGG-16 | 16 | 87 | 86 | 82 | 91 | 84 |
| VGG-19 | 19 | 87.2 | 85.6 | 91.1 | 77.9 | 89.3 |
| Residual | 34 | 91.2 | 90.7 | 95.9 | 84.1 | 93.4 |
In general, the UBNet v1 architecture with 10 layers can produce good accuracy performance compared to others and is slightly different from the accuracy results of CovXNet, which uses 40 layers. UBNet v1 has lower total parameters and shorter training time than VGG16 and XCeption in Table 7 and the confusion matrix as in Fig. 6. These results show that the UBNet architecture has a relatively lighter computational load compared to VGGNet and XCeption..
Fig. 6
Confusion matrix UBNet v1, XCeption, and VGG16.
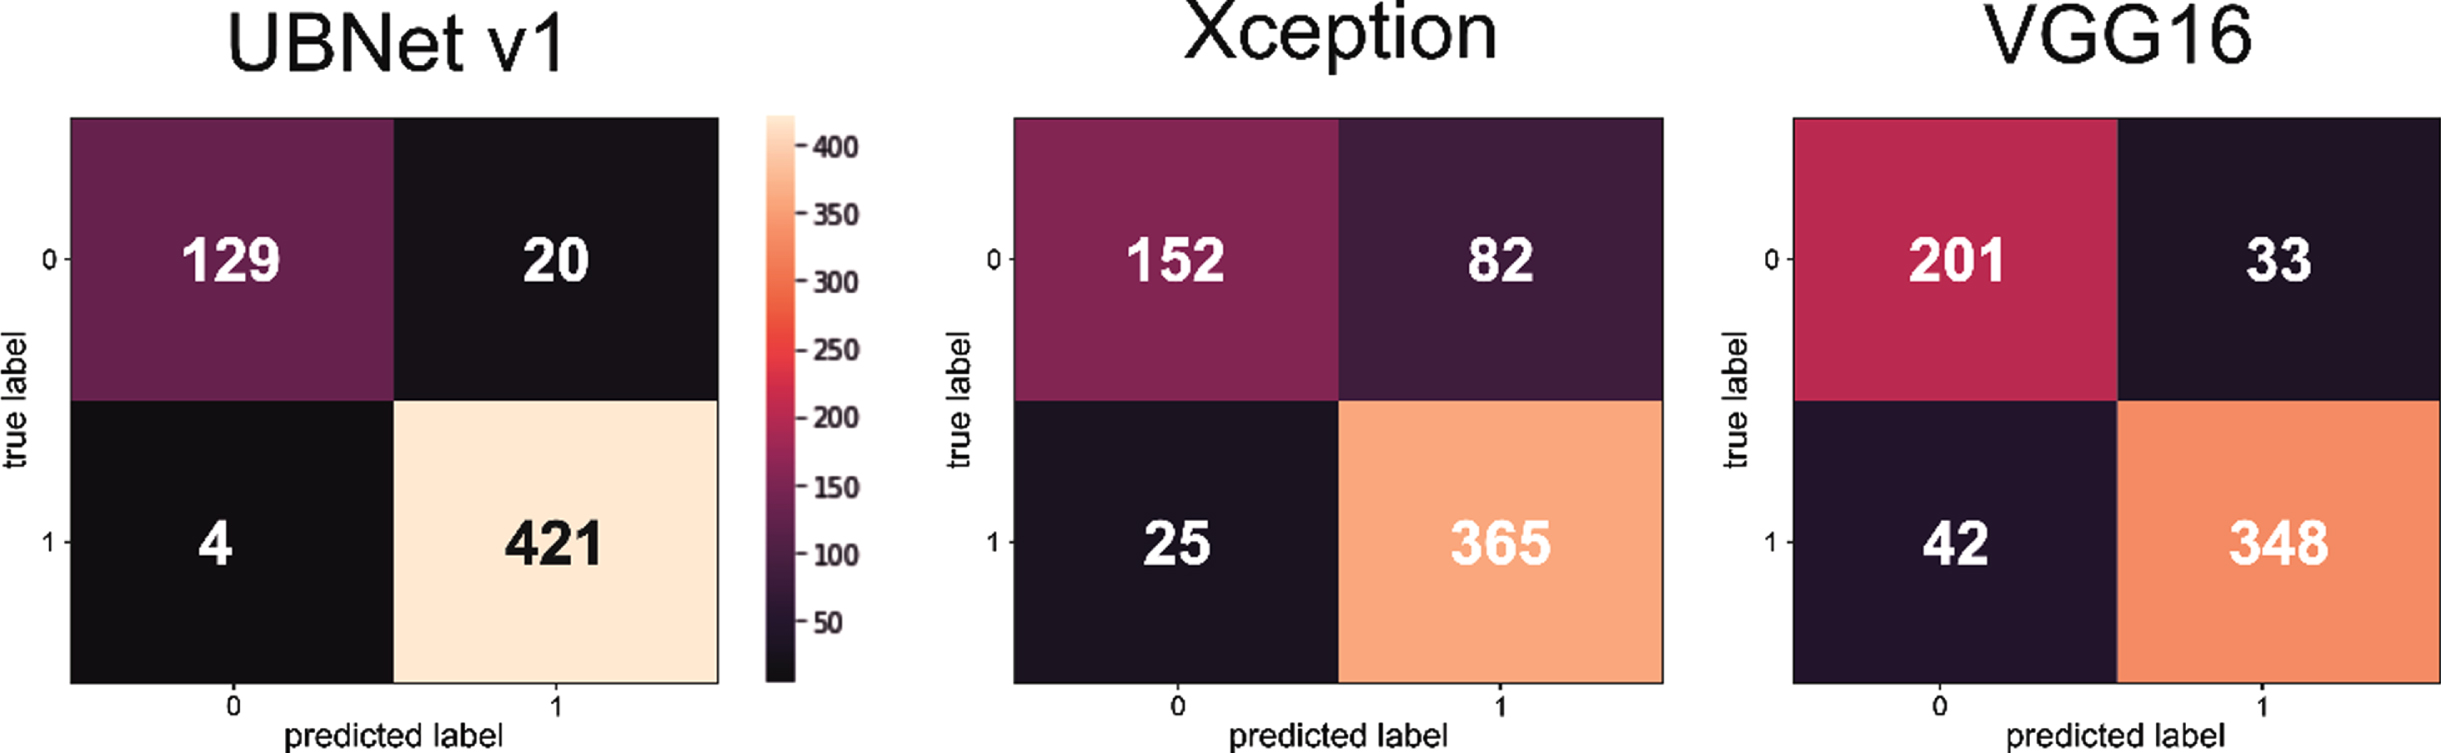
Table 7
Time in training and total parameters
| Architecture | Train time | Total parameters |
| XCeption | 83 minutes | 22,910,480 |
| VGG16 | 100 minutes | 138,357,544 |
| UBNet v1 | 21 minutes | 20,805,170 |
Low computational load can shorten the time required for classification. The typical total parameter influences the relatively lower computational burden as well. This parameter affects the model’s performance, where building a CNN architecture requires an architecture with maximum performance and minimal computational load. The total parameters of UBNet v1 are smaller than XCeption and VGG 16, which means that the computational process of UBNet v1 is more petite than XCeption and VGG16. UBNet v1 training time requires less time and can influence by the hardware conditions used and also the architecture built [4, 9, 16].
3.2CNN architecture for pneumonia and normal image classification
The results of the UBNet v2 architecture, based on the visualization of the convolution layer, showed unique characteristics as a differentiator between pneumonia (bacteria) and pneumonia (virus). After the image extract through the convolution layer, the result converts into 1D data by entering it on a Flatten layer measuring 1×80,000.
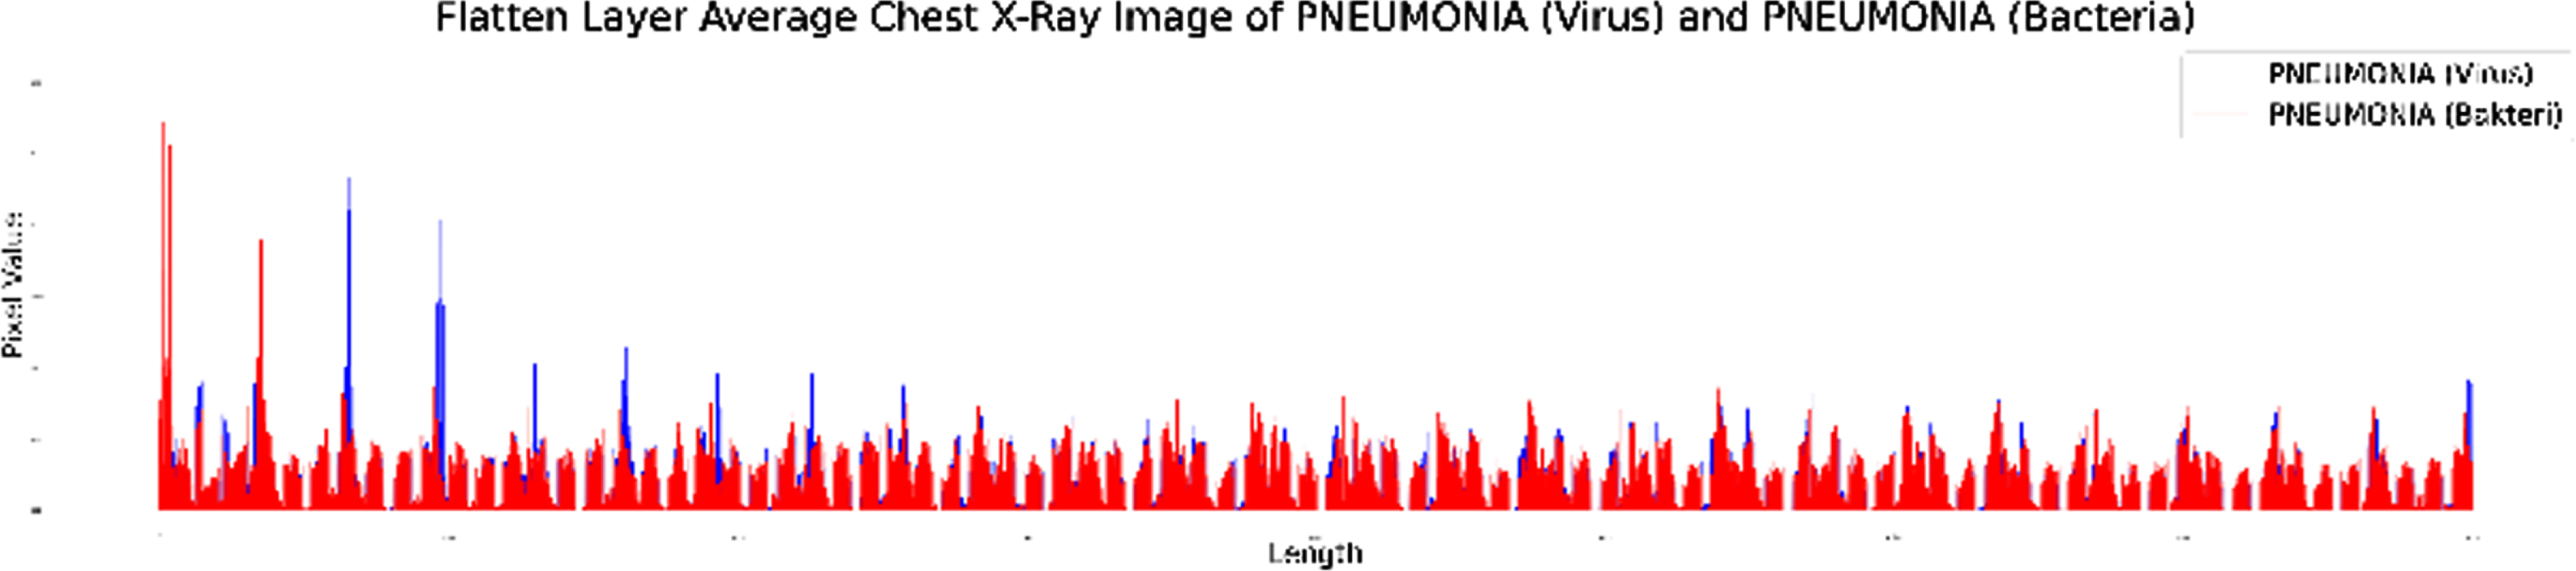
The two flatten layer graphs in Fig. 7. can be combined into the same chart as Fig. 8. The difference shows that the Convolution layer in UBNet v2 can extract the unique features found in chest X-ray images of pneumonia (bacteria) and pneumonia (virus). The red graph shows the Flatten layer of pneumonia (bacteria) X-ray image, and the blue chart shows the Flatten layer of pneumonia (virus) X-ray image. Visualization of the flatten layer UBNet v2 shows the flatten layer graph on the chest X-ray image of pneumonia (virus) having a relatively higher pixel value than the image of bacterial pneumonia.
Fig. 7
(a) Flatten layer graph of an average of 10 chest X-ray images of pneumonia (bacteria) and (b) an average of 10 chest X-ray images of pneumonia (non-COVID-19 virus).
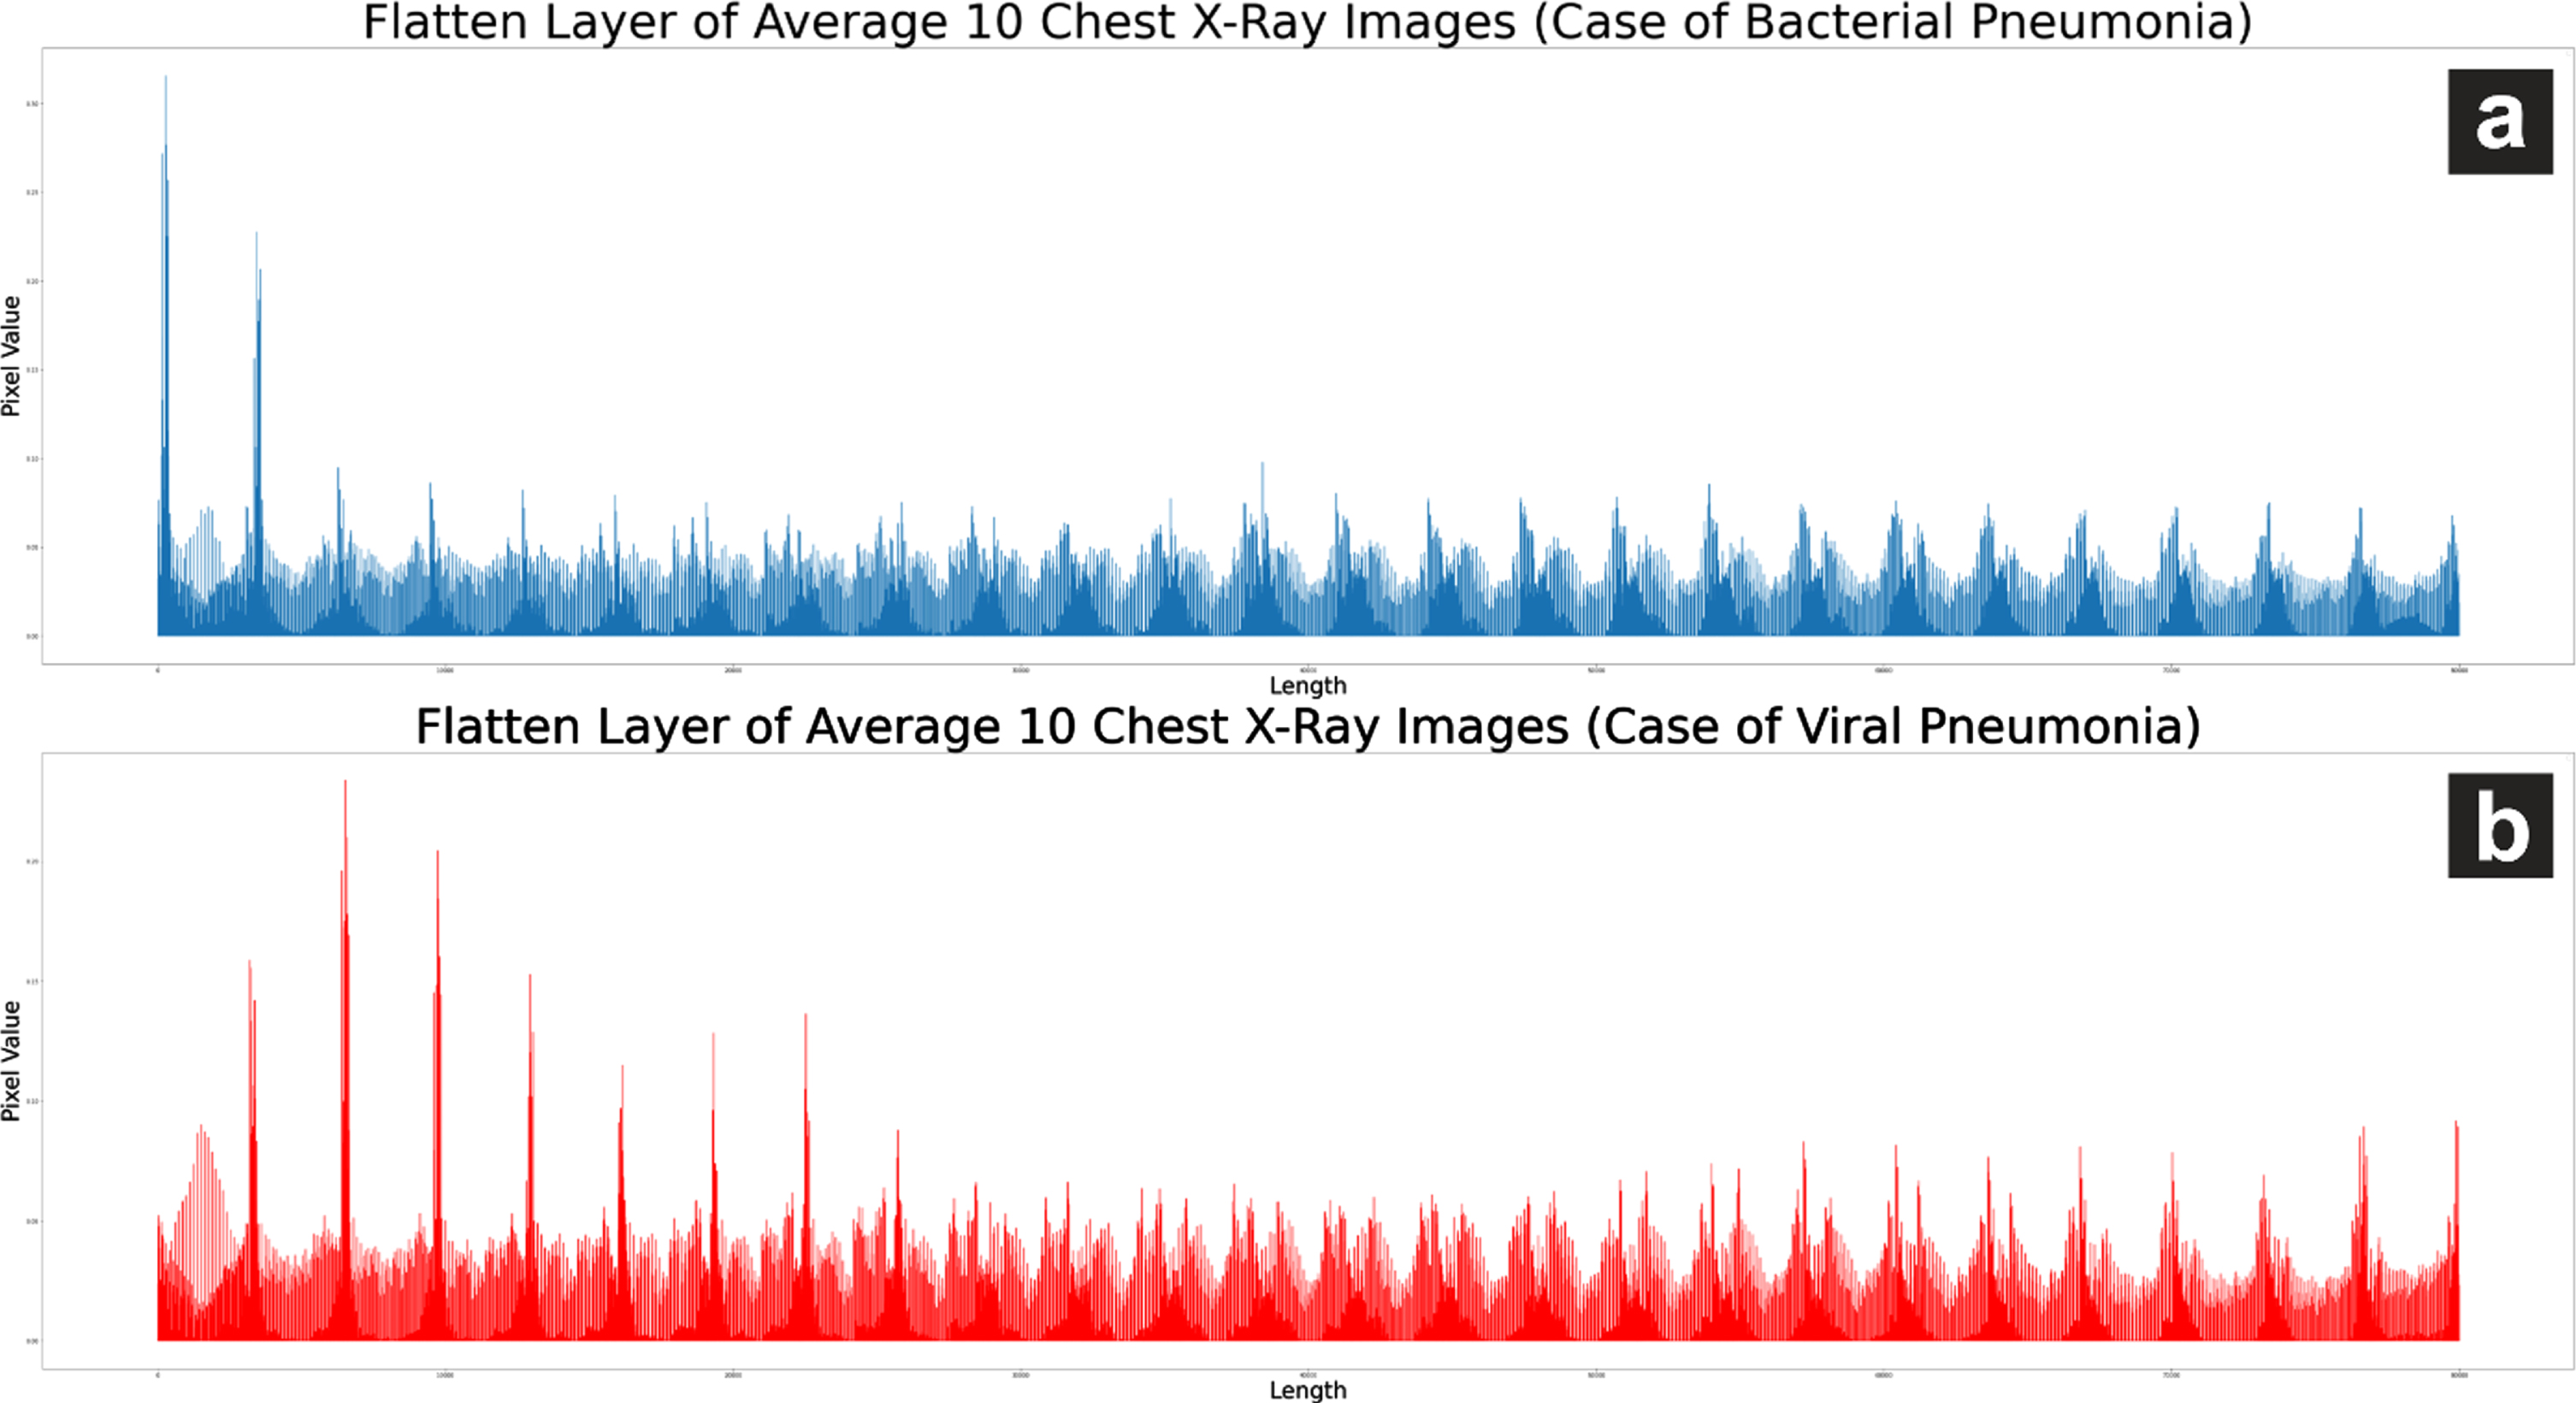
Fig. 8
Flatten layer visualization on chest X-ray images of pneumonia (bacteria) and pneumonia (non-COVID-19 virus).
UBNet v2, with the amount of data shown in Table 8, was able to accurately predict 226 and 114 chest X-ray images of bacterial pneumonia and pneumonia, as in Fig. 9. However, the UBNet v2 architecture made a total of 90 prediction errors in both classes. UBNet v2 achieved 79%accuracy and relatively balanced precision values in predicting pneumonia (bacteria) and pneumonia (virus), as shown in Table 9.
Table 8
Data testing
| Class | Total |
| Pneumonia (virus) | 268 |
| Pneumonia (bacteria) | 162 |
Fig. 9
UBNet v2 confusion matrix for pneumonia classification.
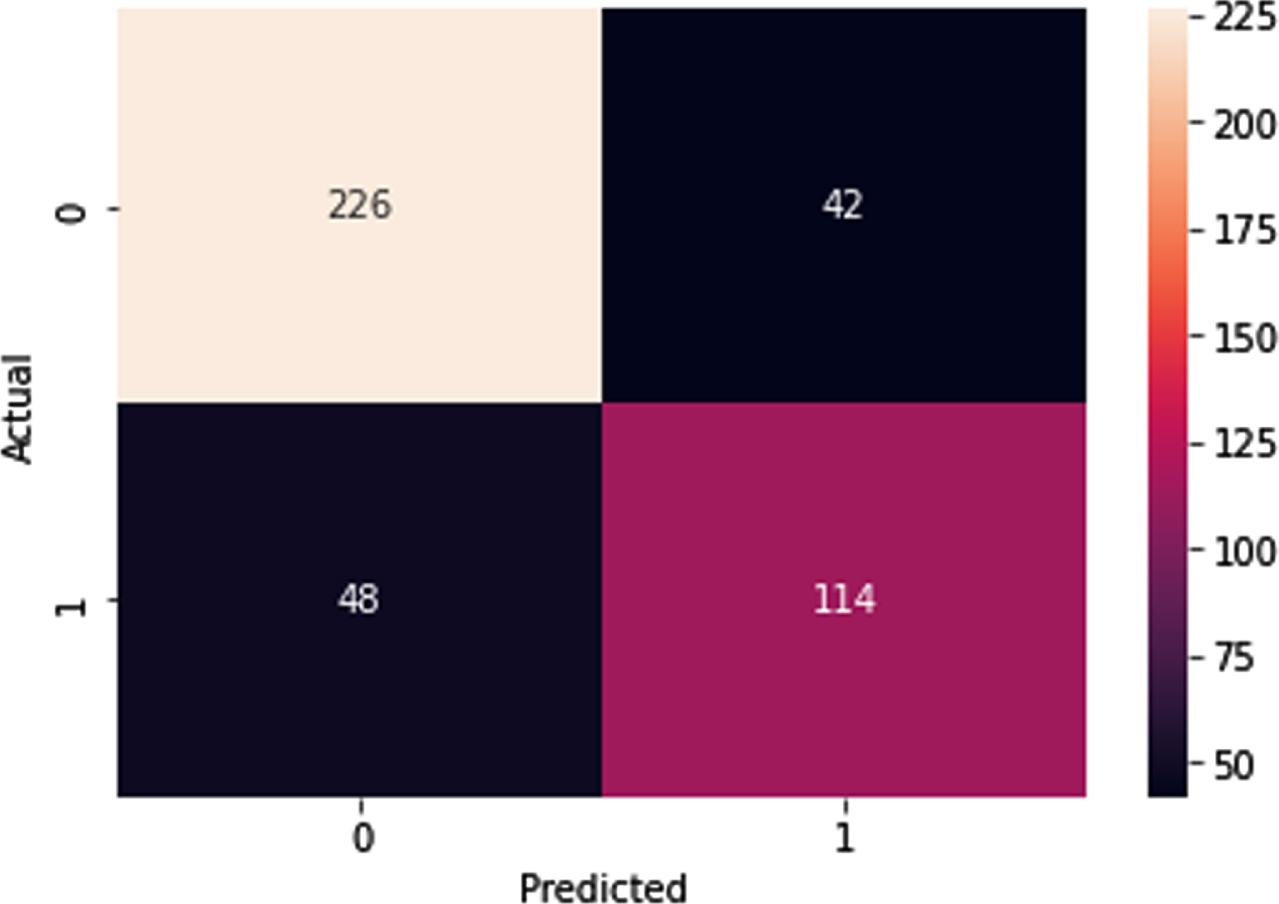
Table 9
Accuracy, sensitivity, and specificity of UBNet v2 Architecture
| Metrics | Percentage |
| Accuracy | 79% |
| Precision | 84% |
| Sensitivity/recall | 83% |
| Specificity | 73% |
| f1 score | 85% |
The performance of UBNet v2 for the classification of viral pneumonia and bacteria can show the model’s performance with an average performance of 80%. This performance is quite good considering its high performance with a low computing load. The evaluation results of UBNet v2 with a total of 7 layers, as shown in Table 10, can match the performance of other models such as those developed by Nguyen et al. [17], Residual, Inception, dan VGG19 [5].
Table 10
Comparison of several architectures for the classification of bacterial and viral pneumonia
| Architecture | Total Layers | A(%) | P(%) | R(%) | S (%) | f1 (%) |
| UBNet v2 | 7 | 79 | 84 | 83 | 73 | 85 |
| Nguyen et. al. | 4 | 80.8 | – | – | – | – |
| CovXNet | 40 | 95.1 | 94.9 | 96.1 | 94.3 | 95.5 |
| Residual | 34 | 89.5 | 88.3 | 96.9 | 78.1 | 92.4 |
| Inception | 48 | 85.8 | 84.5 | 93.8 | 72.1 | 88.9 |
| VGG-19 | 19 | 83.2 | 81.1 | 91.3 | 71.7 | 86.6 |
3.3Classification of viral pneumonia (non-COVID-19) and viral pneumonia (positive COVID-19)
The results from the flatten layer to determine the positive for COVID-19, as shown in Fig. 10, using UBNet v3, can detect well as visualized in Fig. 11. The results reveal striking differences in the characteristics of the chest X-ray image of non-COVID-19 viral pneumonia and COVID-19 positive viral pneumonia.
Fig. 10
(a) an average of 10 chest X-ray images of viral pneumonia (positive for COVID-19) and (b) an average of 10 chest x-ray images for viral pneumonia (negative for COVID-19).
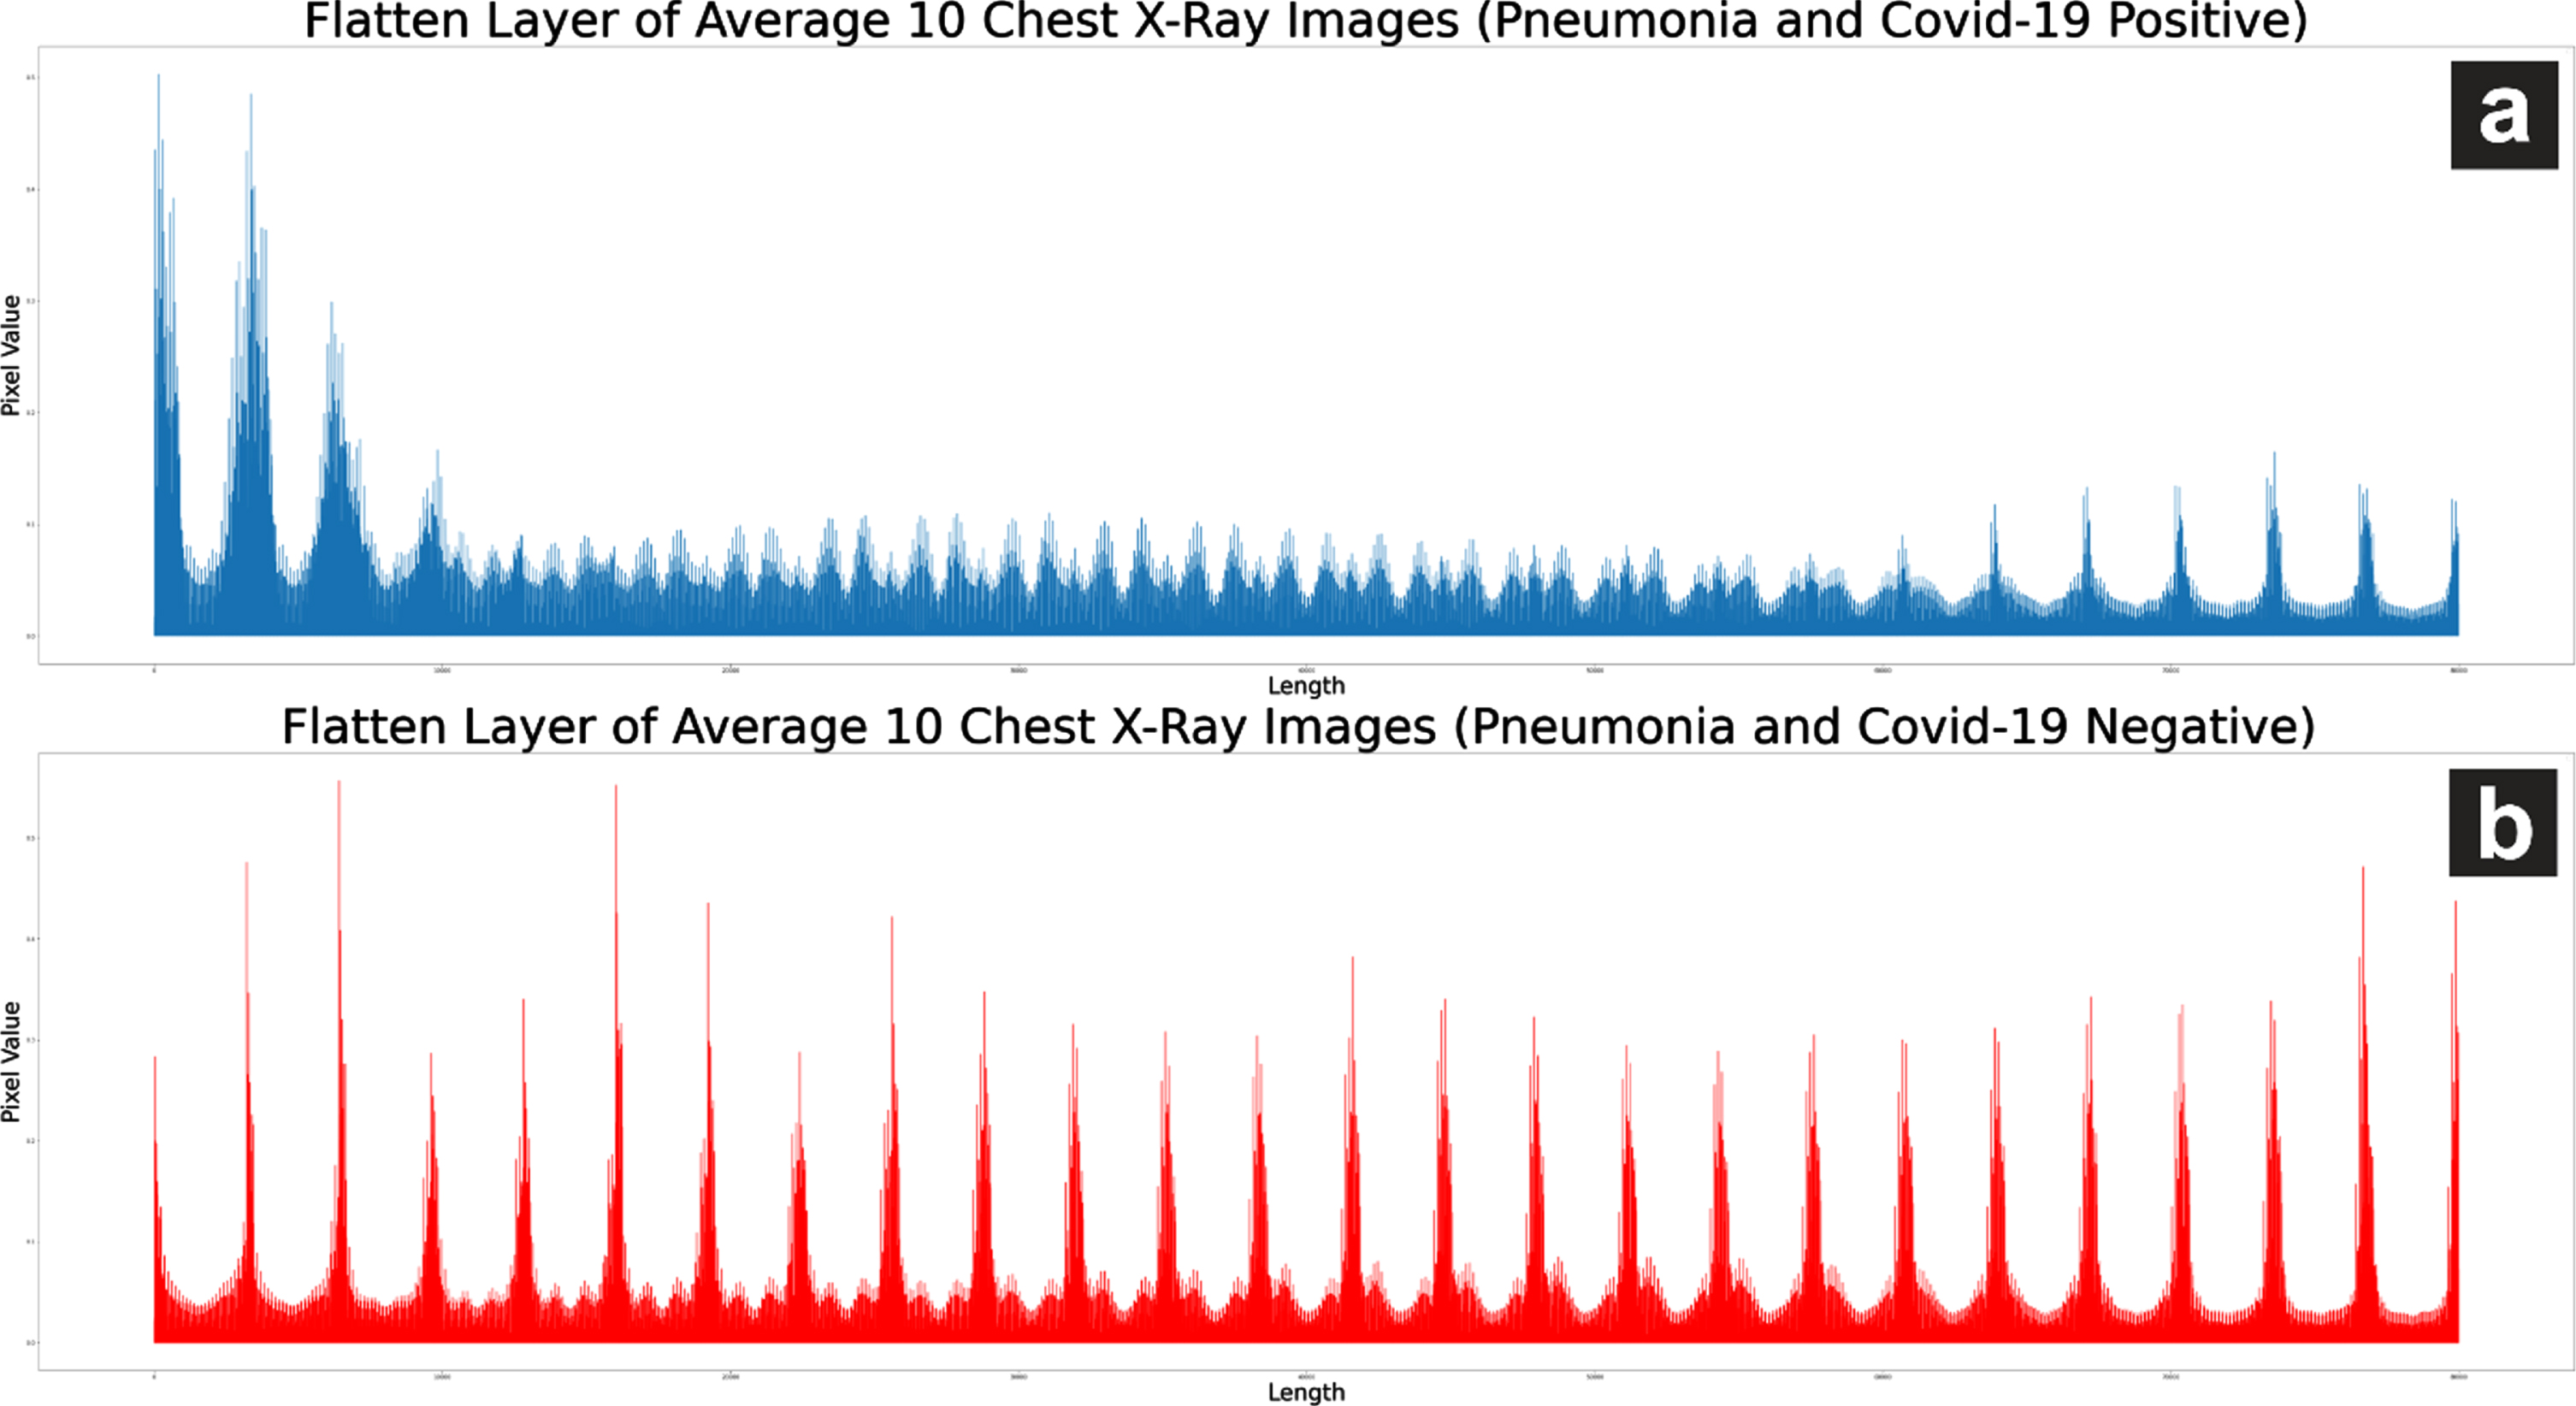
Fig. 11
Visualization of flatten layer on chest X-ray photo of COVID-19 and pneumonia (non-COVID-19 virus).
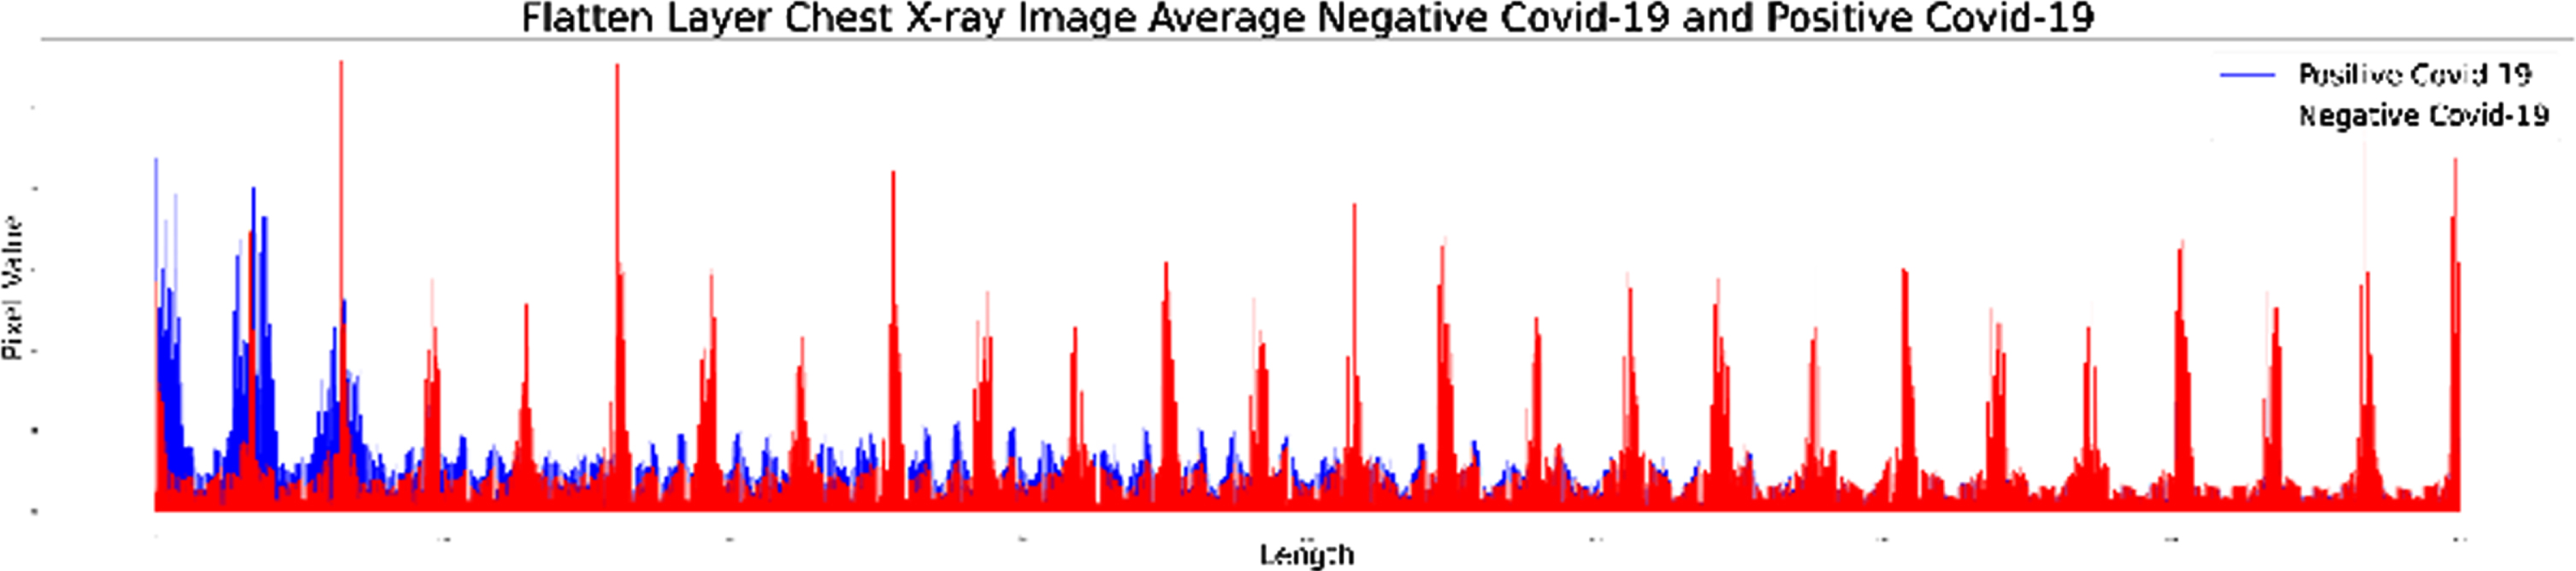
Flatten layer X-ray images of viral pneumonia patients (positive for COVID-19) tend to experience constant fluctuations with lower pixel values than flatten layer X-ray images of viral pneumonia (negative COVID-19). Training on UBNet v3 using data testing, as shown in Table 11, can accurately detect 384 negative-COVID-19 images and 109 positive images of COVID-19 as generated in the confusion matrix in Fig. 12.
Table 11
Data Testing
| Class | Total |
| Pneumonia virus (Negative COVID-19) | 385 |
| Pneumonia virus (Positive COVID-19) | 110 |
Fig. 12
Confusion matrix UBNet v1.
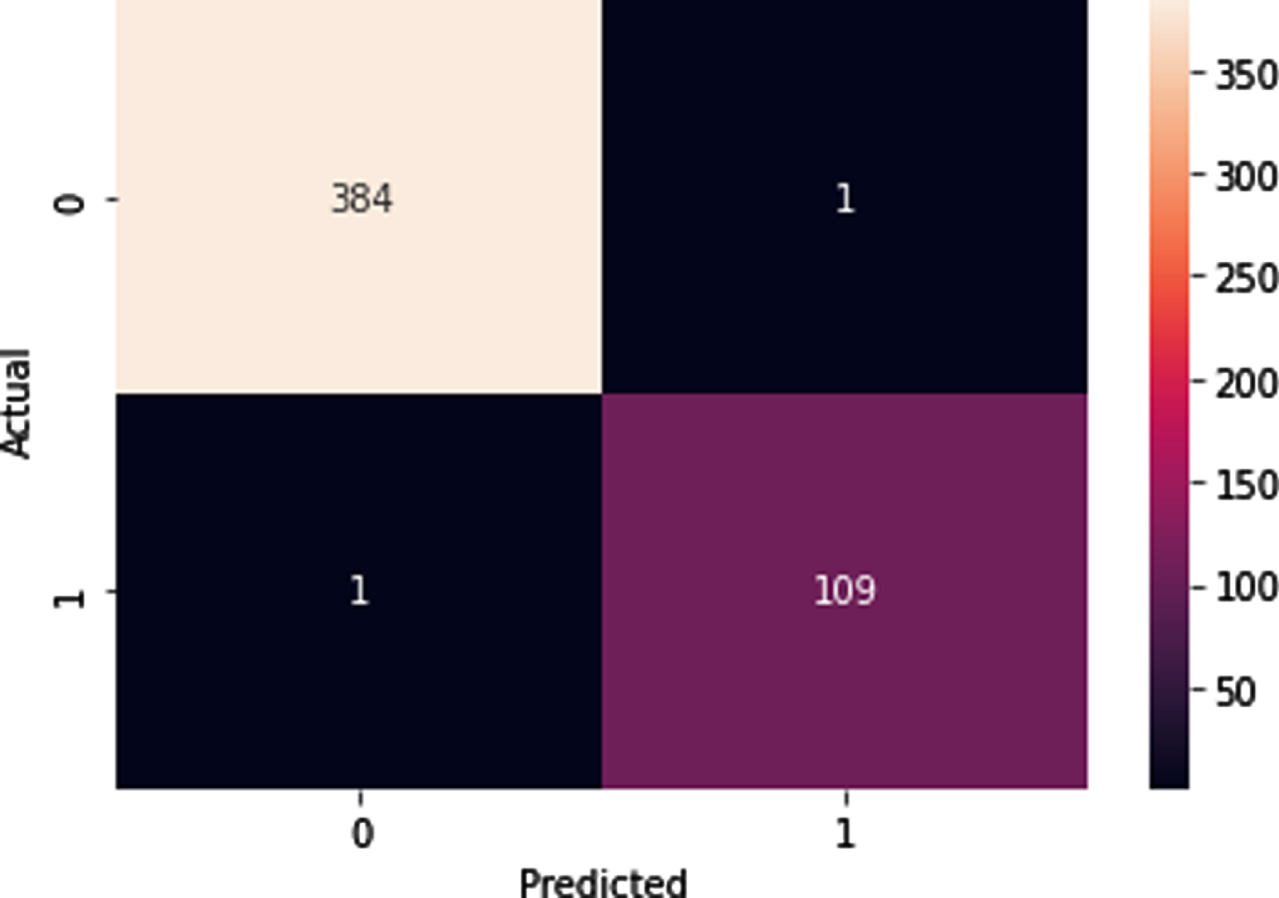
The evaluation results on UBNet v3 showed good performance with up to 99%accuracy and a balanced precision, sensitivity, and F1-score value for classifying viral pneumonia (negative COVID-19) and viral pneumonia (positive COVID-19), as shown in Table 12.
Table 12
Accuracy, sensitivity, precision, and F1-score UBNet v3 Architecture
| Metrics | Percentage |
| Accuracy | 99,60% |
| Precision | 99,74% |
| Sensitivity/recall | 99,74% |
| Specificity | 99,09% |
| f1 score | 99,74% |
UBNet v3’s performance in classifying viral pneumonia (negative COVID-19) and COVID-19 virus (positive COVID-19) is quite good and stable with a light computational load because it uses a few layers. The accuracy of the UBNet v3 architecture exceeds several existing architectures such as CovXNet, Residual, Inception, and VGG19 [5], as shown in Table 13.
Table 13
Comparison of the classification architecture of viral pneumonia and COVID-19 virus (positive COVID-19)
| Architecture | A(%) | P(%) | R(%) | S (%) | F1 (%) |
| UBNet v 3 | 99.60 | 99.67 | 99.74 | 99.09 | 99.74 |
| CovXNet | 87.3 | 88.1 | 87.4 | 85.5 | 87.8 |
| Residual | 80.4 | 81.1 | 79.3 | 77.1 | 80.2 |
| Inception | 78.2 | 76.8 | 79 | 75.4 | 77.9 |
| VGG19 | 72.1 | 70.9 | 74.7 | 69.3 | 72.8 |
Evaluation of the architecture of UBNet v1 and UBNet v2 to classify images of normal (N), bacterial pneumonia (B), viral pneumonia (V), and COVID-19 virus (C) was tested with 4 classes directly and using a hierarchy of 2 classes. The classification results of 4 classes are directly compared with other studies [18], as shown in Table 14.
Table 14
Comparison of several architectures for the classification of normal, bacterial pneumonia, viral pneumonia (non-COVID-19) and viral pneumonia (positive COVID-19)
| Model | Classification | Accuracy |
| UBNet v1 | N-B-V-C | 88,58% |
| UBNet v2 | N-B-V-C | 88,48% |
| MobileNetV2 | N-B-V-C | 81% |
| XCeption | N-B-V-C | 81% |
| ResNet50v2 | N-B-V-C | 81% |
| DenseNet121 | N-B-V-C | 77% |
| InceptionResNetv2 | N-B-V-C | 76% |
| VGG19 | N-B-V-C | 75% |
| NASNetMobile | N-B-V-C | 75% |
| Inceptionv3 | N-B-V-C | 70% |
The performance of UBNet v1 and UB Net v2 has higher accuracy, exceeding 88%, while other architectures are up to 81%. The use of hierarchical architectures such as those developed in UBNet v1, UBNet v2, and UBNet v3 can improve system performance, as listed in Table 15.
Table 15
Comparison of UBNet performance for several classification classes (N is Normal, B is Bacterial Pneumonia, V is Viral Pneumonia (non COVID-1919), C is Viral Pneumonia (positive COVID-1919), and P is General Pneumonia)
| Model | Classification | Accuracy | Precision | Sensitivity | F1 Score |
| UBNet v1 | N-B-V-C | 88,58% | 89,18% | 86,94% | 86,73% |
| UBNet v2 | N-B-V-C | 88,48% | 89,20% | 85,35% | 86,40% |
| UBNet v1 | N-P | 91% | 81% | 94% | 87% |
| UBNet v2 | B-V | 79% | 84% | 83% | 73% |
| UBNet v3 | V-C | 99,60% | 100% | 99,45% | 99,72% |
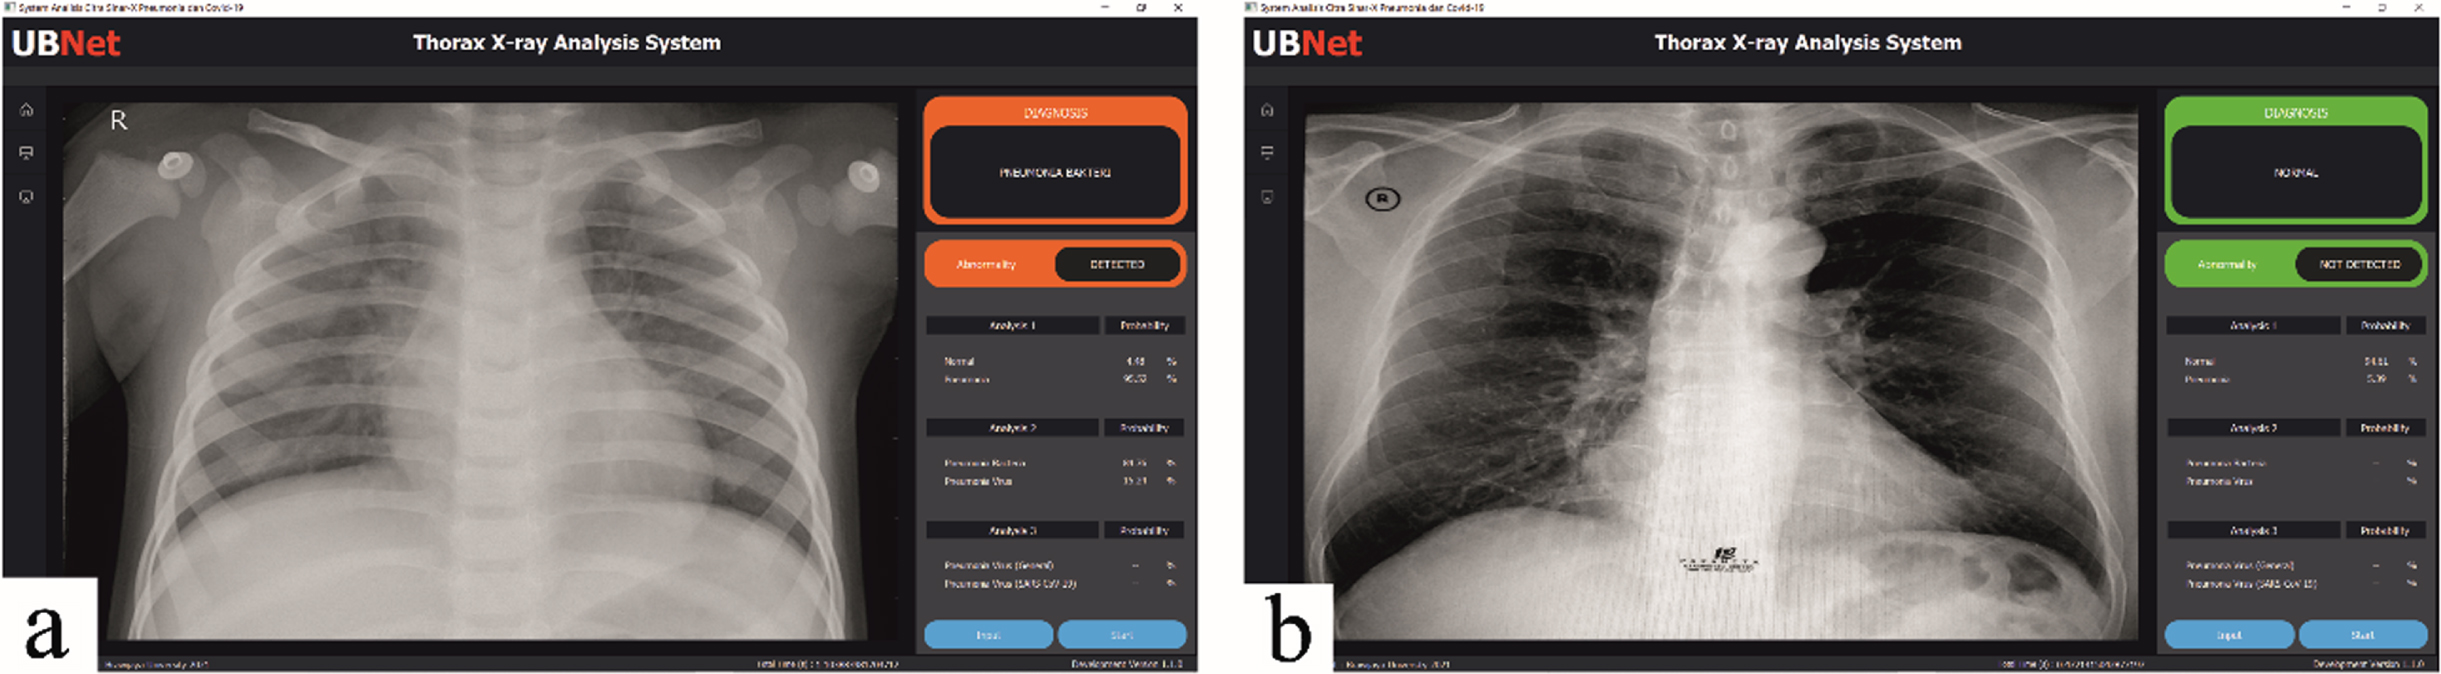
The design of this GUI-based display system has 2 buttons, namely a button to enter X-ray images into the system and a button to start the analysis process, as shown in Fig. 13. This image is the result of testing X-ray images of a patient with bacterial pneumonia and normal. Testing system performance using a laptop with a Ryzen 5 processor, 8GB RAM, without using an external GPU, the average time required to perform the analysis is 1.21 seconds for each image. The GUI develops using the Python language and the PyQt5 library [19].
Fig. 13
Trial of a GUI-based viewer system to analyze images of patients with (a) bacterial pneumonia and (b) normal.
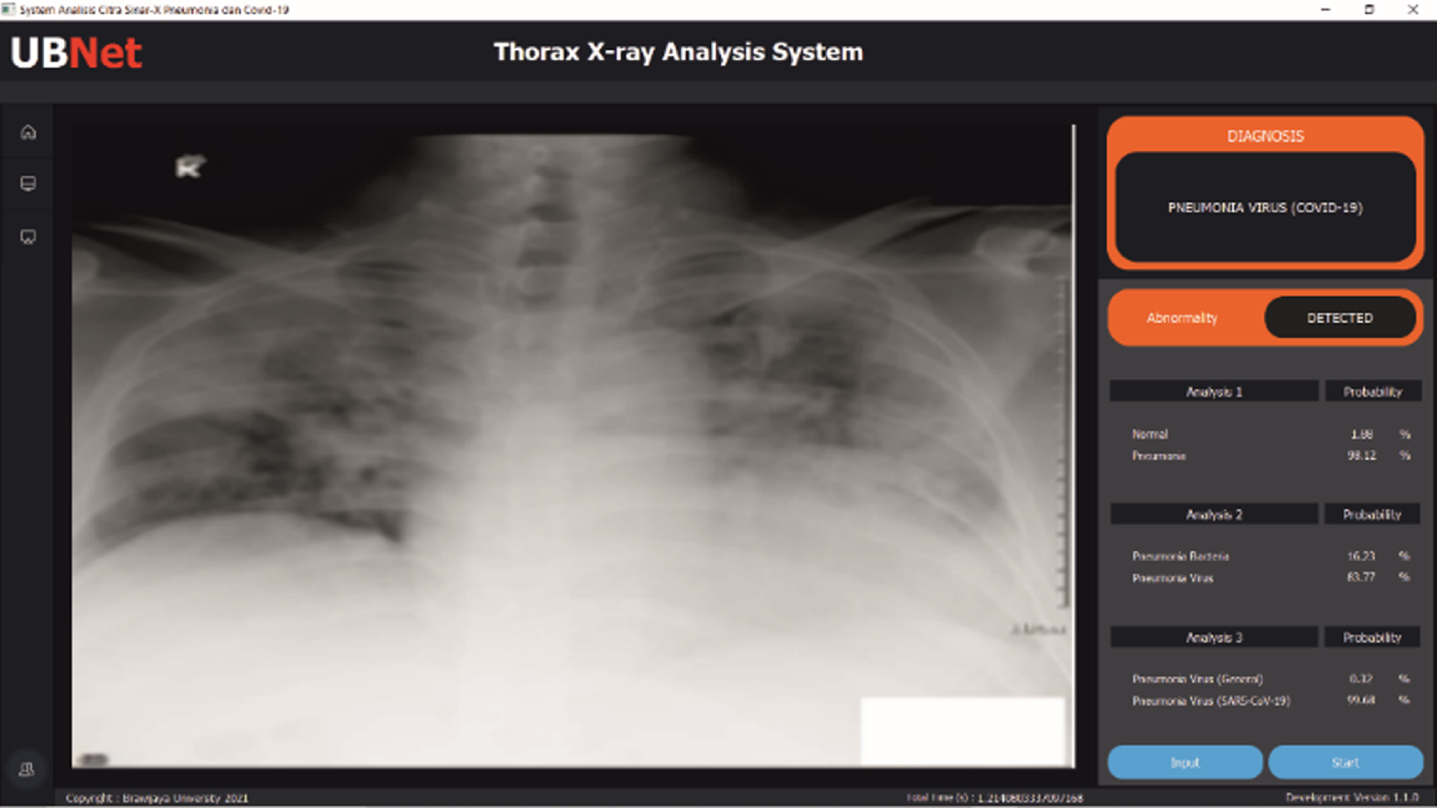
Another test uses chest X-ray image data from local Indonesian patients confirmed positive for COVID-19 [20]. The system can classify the image as a COVID-19 image with an accuracy rate of 99.61%, as shown in Fig. 14. The detailed results are also available at https://github.com/mmasdar/Model-UBNet-Trained.
Fig. 14
Results of chest X-ray analysis of local COVID-19 patients.
4Conclusion
CNN architecture with a hierarchical scheme developed in UBNet v3 using a simple architecture can classify chest X-ray images of COVID-19 patients with performance: 99.60%accuracy, 99.74%precision, 99.74%sensitivity, 99.09%specificity, and f1 score of 99.74%. Using three hierarchical architectures in UBNet v3 improves system performance in classifying images of pneumonia and COVID-19 patients. The simple hierarchical architecture used includes: first, UBNet v1 uses 7 convolution layers and 3 ANN layers to classify normal images and pneumonia images; second, UBNet v2 uses 4 convolution layers and 3 ANN layers to classify bacterial pneumonia images and viral pneumonia images, third, reuse of UBNet v1 to classify viral pneumonia images and COVID-19 virus images. A simple architecture speeds up the diagnostic time of x-ray images of COVID-19 patients; This needs during a pandemic like now.
A desktop GUI-based monitoring and classification system supported by a simple CNN architecture can classify pneumonia and COVID-19 X-ray images with an average time of 1.21 seconds. This monitoring system can help to assist the radiologist in operating the entire UBNet algorithm with ease.
Acknowledgment
This Research is supported by the Ministry of Research and Technology / National Research and Innovation Agency through RISPRO Funding.
References
[1] | Jegerlehner S. , Suter-Riniker F. , Jent P. , et al., Diagnostic accuracy of a SARS-CoV-2 rapid antigen test in real-life clinical settings: Antigen tests in real-life clinical settings, Int J Infect Dis 109: ((2021) ), 118–122. |
[2] | Purwatiningsi P. and Prasetio H.E. , Analisis Sebaran Radiasi Hambur Ct Scan 128 Slice Terhadap Pemeriksaan Ct Brain, Sainstek J Sains dan Teknol 8: (1) ((2017) ), 50. |
[3] | Li Z. , Zeng B. , Lei P. , et al., Differentiating pneumonia with and without COVID-19 using chest CT images: from qualitative to quantitative, J Xray Sci Technol 28: (4) ((2020) ), 583–589. |
[4] | Ayan E. and Ünver H.M. , Diagnosis of pneumonia from chest X-ray images using deep learning, 2019 Sci Meet Electr Biomed Eng Comput Sci EBBT 2019, (2019), 1–4. |
[5] | Mahmud T. , Rahman M.A. and Fattah S.A. , CovXNet: A multi-dilation convolutional neural network for automatic COVID-19 and other pneumonia detection from chest X-ray images with transferable multi-receptive feature optimization, Comput Biol Med 122: ((2020) ), 103869. |
[6] | Rahaman M.M. , Li C. , Yao Y. , et al., Identification of COVID-19 samples from chest X-ray images using deep learning: A comparison of transfer learning approaches, J Xray Sci Technol 28: (5) ((2020) ), 821–839. |
[7] | Yang Y. , Lure F. , Miao H. , et al., Using artificial intelligence to assist radiologists in distinguishing COVID-19 from other pulmonary infection, J Xray Sci Technol 29: (1) ((2021) ), 1–17. |
[8] | Szegedy C. , Vanhoucke V. , Ioffe S. , et al., Rethinking the Inception Architecture for Computer Vision, Proc IEEE Comput Soc Conf Comput Vis Pattern Recognit (2016), 2818–2826. |
[9] | Chollet F. , Xception: Deep learning with depthwise separable convolutions, Proc - 30th IEEE Conf Comput Vis Pattern Recognition, CVPR 2017, (2017), 1800–1807. |
[10] | Basha S.H.S. , Dubey S.R. , Pulabaigari V. and Mukherjee S. , Impact of fully connected layers on performance of convolutional neural networks for image classification, Neurocomputing 378: ((2020) ), 112–119. |
[11] | Kermany D. , Zhang K. and Goldbaum M. , Labeled optical coherence tomography (OCT) and chest X-ray images for classification, Mendeley Data 2: ((2018) ), DOI:10.17632/rscbjbr9sj.2. |
[12] | Rahman T. , Khandakar A. , Qiblawey Y. , et al., Exploring the effect of image enhancement techniques on COVID-19 detection using chest X-ray images, Comput Biol Med 132: ((2021) ), 104319. |
[13] | Patro M. and Ranjan Patra M. , A novel approach to compute confusion matrix for classification of n-class attributes with feature selection, Transactions on Machine Learning and Artificial Intelligence 3: (2) ((2015) ), 52. |
[14] | Hameed Z. , Zahia S. , Garcia-Zapirain B. , et al., Breast cancer histopathology image classification using an ensemble of deep learning models, Sensors (Switzerland) 20: (16) ((2020) ), 1–17. |
[15] | Nurhopipah A. and Hasanah U. , Dataset splitting techniques comparison for face classification on CCTV images, Indonesian J Comput Cybern Syst 14: (4) ((2020) ), 341. |
[16] | Simonyan K. and Zisserman A. , Very deep convolutional networks for large-scale image recognition, 3rd Int Conf Learn Represent ICLR 2015 - Conf Track Proc (2015), 1–14. |
[17] | Nguyen H.T. , Tran T.B. , Luong H.H. , et al., Viral and bacterial pneumonia diagnosis via deep learning techniques and model explainability, Int J Adv Comput Sci Appl 11: (7) ((2020) ), 667–675. |
[18] | Aggarwal S. , Gupta S. , Alhudhaif A. , et al., Automated COVID-19 detection in chest X-ray images using fine-tuned deep learning architectures, Expert Syst (2021), e12749. |
[19] | Fitzpatrick M. , Create Simple GUI Applications with Python & Qt5 - Edition 4. Leanpub, (2019). |
[20] | Icksan T. , et al., The Role of Chest Imaging in Diagnosis of COVID-19 Pandemic in Indonesia Society. Jakarta, (2020). |


