
Finding repeatable progressive pass clusters and application in international football
Abstract
Progressive passing in football (soccer) is a key aspect in creating positive possession outcomes. Whilst this is well established, there is not a consistent way to describe the different types of progressive passes. We expand on the previous literature, providing a complete methodological approach to progressive pass clustering from selection of the number of clusters (k) to risk-reward profiling of these progressive pass types. In this paper the Separation and Concordance (SeCo) framework is utilised to provide a process to analyse k-means clustering solutions in a more repeatable way. The results demonstrate that we can find stable progressive pass clusters in International Football and their efficacy with progressive passes “Mid Central to Mid Half Space” in build-up and “Mid Half Space to Final Central” into the final 3rd having the best balance between risk (turnover) and reward (shot created) in the subsequent possession. This allowed for opposition profiling of player and team patterns in different phases of play, with a case study presented for the teams in the Last 16 of the 2022 World Cup.
1Introduction
Sports analytics is a growing area of research (Swartz, 2018), which has been defined as the pursuit of enhancing performance through data analysis (Baumer, Matthews & Nguyen, 2023). The way in which statistics enhances sports analytics is through deciphering signal from noise (Lopez, Matthews & Baumer, 2017). Specifically in football analytics (or soccer), methods from advanced statistics in both applied settings and research (Memmert, Lemmink & Sampaio, 2017) has evolved to understand tactics (Ötting & Karlis, 2022) and player evaluation (Bornn, Cervone & Fernandez, 2018). This has been driven in part by the evolution of technology to capture data, moving from manual collection of event data that primarily describes on-ball actions to the use of camera systems that can provide live tracking data including the location of all players and the ball at 25 frames per second (Bornn, Cervone & Fernandez, 2018). This has concurrently led to an evolution in methods from summary statistics and modelling techniques to define playing styles (Fernandez-Navarro et al., 2019), to new machine learning algorithms to quantify the effects of passes and ball carries on expected possession outcomes (Fernández, Bornn & Cercone, 2021) and space creation (Fernández & Bornn, 2018).
Football (soccer) analytics is a new discipline that demands the application of methods from advanced statistics in both applied settings and research (Memmert, Lemmink & Sampaio, 2017). There is a significant gap in the availability and use of data collected by third party providers to generate spatiotemporal features relevant to football-specific concepts and terminology. Filling this gap will help coaches evaluate their team strategy from insights through football analytics, made possible from this wealth of data (Bornn, Cervone & Fernandez, 2018). We believe that use of clustering algorithms, which partition datasets into groups with similarities across key features (Chambers et al., 2013), will help us describe key tactical concepts that are intuitive to coaches. However, when using clustering algorithms, there are concerns on the robustness of the groups created. In this manuscript, we explore the Separation-Concordance (SeCo) framework that allows us to improve the repeatability of the clusters generated from clustering algorithms (Chambers et al., 2013). This framework developed and used in the healthcare setting (Lisboa et al., 2013) can be applied to make clustering algorithms both more robust and repeatable, i.e., if multiple analyses were run independently on the same data with the same clustering methods, each of them would retrieve very similar cluster solutions.
Progressive passing is a key area of research (Tenga et al., 2010), however there has not been much literature on ways to define and describe the various subtypes of these progressive passes. In this research study, we seek to define progressive pass types by performing k-means clustering using event data, with the SeCo framework applied to enhance the repeatability of the clusters found. We first describe the creation of features using OPTA event data and explore the structure of the dataset to provide the most robust and repeatable progressive pass clusters. After identifying progressive pass clusters, we explore the applications of cluster allocation to create performance indicators (Hughes & Bartlett, 2002) and to assess the efficacy of each progressive pass cluster, i.e., the assessment of balance between risk and reward.
2Literature Review
Passing is the most frequent event in football (Xie et al., 2020) and forward passing has shown to be the most effective in disrupting the opposition defensive shape (Goes et al., 2018). Penetrative passes are a sub-set of these forward passes, which are a deliberate attempt to play the ball forwards and break a unit in the opposition team shape (Tenga et al. 2010). Tenga and colleagues investigated penetrative passes and reported a positive correlation with penalty box entries with a high degree of control.
Initial research using passing event data described the frequency of passes and carries that started and ended in discretised zones (Lucey et al., 2012), however such zone stratified frequency description meant that similar passes that occurred across the boundaries of different zones were classified as distinct passing types due to the pass starting and ending in different zones. This work was further developed by Power et al. (2017), where he and his colleagues utilised synchronised tracking and event data to analyse the risk and reward of each pass cluster (balance between executing the pass vs creating a shot on goal within 10 seconds). They included all passes that had a reward of 6% or greater and clustered these passes using k-means using start and end coordinates as features. From this, 16 pass clusters were derived and used to measure a passing style of a team, alongside a risk-reward profile of each cluster.
The reward associated to a pass has been measured in multiple ways including the number of opponent players bypassed (Steiner et al., 2019), space creation (Rein, Raabe & Memmert, 2017) and opposition defensive disruption (Goes et al., 2018) caused by the pass. However, the most common measure of reward described in the literature is how a pass increases shot outcomes in the possession subsequent to the pass. In this study, we calculate the reward of progressive pass types by calculating the frequency of shots created (Power et al., 2017), the expected goals (xG) of these shots (Lucey et al., 2015) which is an indicator of the quality of shot (Link, Lang & Seidenschwarz, 2016; Goes et al., 2022) and the proportion of passes that lead to goals (Rein, Raabe & Memmert, 2017; Steiner et al., 2019; Anzer, Bauer & Brefeld, 2021). In terms of measurement of risk associated to a pass, recent development has seen the introduction of expected pass completion models for all available options to the passer using tracking data (Spearman et al., 2017; Anzer & Bauer, 2022). However, in this study we calculate the risk as the actual observed likelihood of not completing the progressive pass to a teammate, which has been widely used (Power et al., 2017; Goes et al., 2022).
3Methodology
3.1Data
Event data was extracted from 763 senior international football matches (competitive and friendly internationals between 2017/2018 and the 2021/2022 season). Opta was the provider of this data with high inter-operator reliability in identifying primary events, with kappa between 0.92 and 0.94 (Liu et al., 2013). Traditional event data consists of on-ball events such as passes and shots, their locations and extra descriptive qualifiers of the events, such where the event began — from a set play or a headed pass.
3.2Defining progressive passes
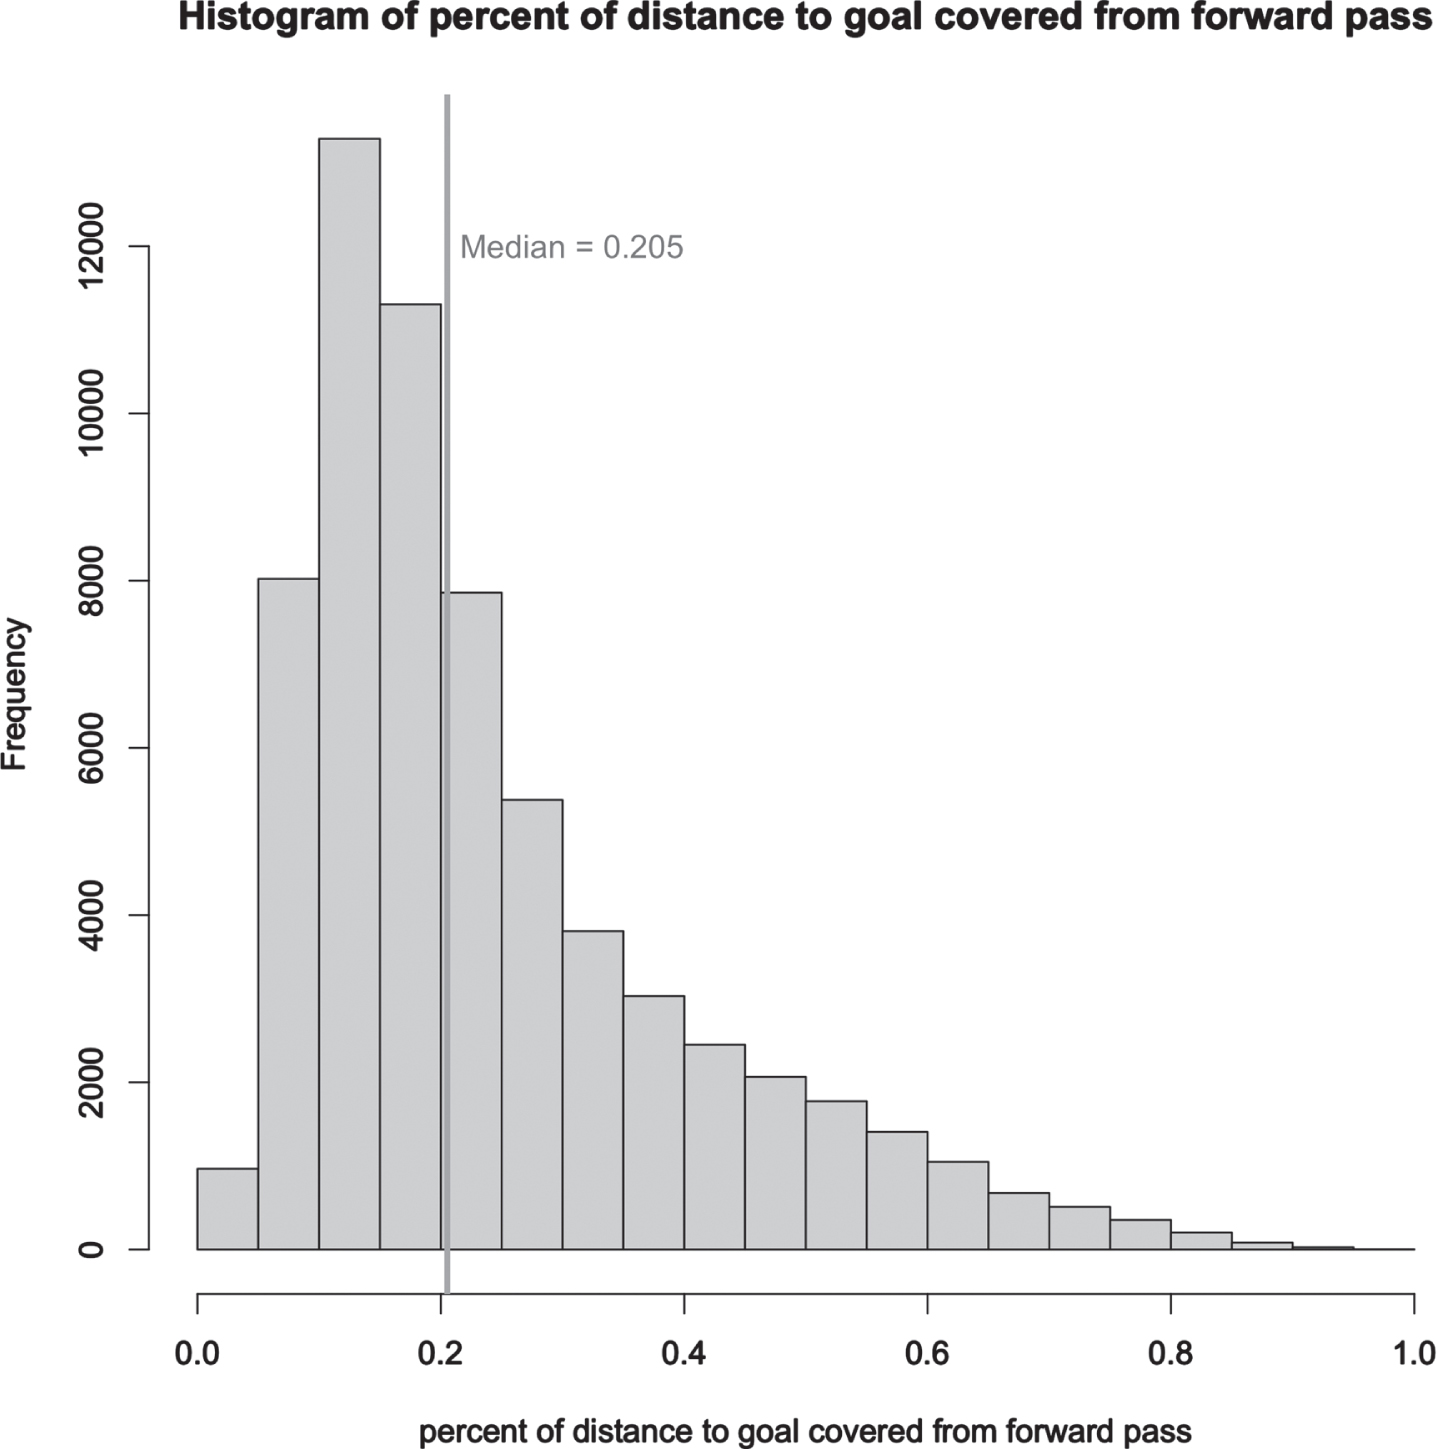
Progressive passes in this study are defined as a sub-set of passes that move the ball forward more than a typical pass towards goal. More specifically, forward passes were defined as passes with a pass angle between –105° and 105° (determined by the start and end x, y coordinates of the pass). Passes labelled as a set play, cross or head pass (see Appendix A) and in an arc between the 2 corners and through to the edge of the box were excluded. We then calculated the percentage distance towards the opposition goal for each pass based on the start and end location. The median percentage distance covered towards the opposition goal amongst the forward passes was 20% (see Fig. 1). Therefore, forward passes with a percentage distance of 20% or more were identified as a progressive pass.
Fig. 1
A Histogram displaying the percent of distance to goal covered from forward passes.
We further stratified progressive passes into two groups that ended outside and inside the penalty box, as penalty box possessions are seen as an unstable game state by English Premier League football coaches (Kim et al., 2019) and these coaches set up their teams’ defensive shape to prevent passes from entering the penalty box.
3.3Model features
Features were extracted and derived from Opta to represent the location and trajectory of these progressive passes; (1) start pass x co-ordinate, (2) modified start pass y co-ordinate, (3) end pass x co-ordinate, (4) modified end pass y co-ordinate, (5) pass distance and (6) pass angle.
Both y coordinates were transformed, so passes were effectively mirrored, i.e., If the y co-ordinate was greater than 50, the value was subtracted from 100. Consistent with previous research (Anzer, Bauer & Brefeld, 2021), we mirrored passes to avoid duplicate symmetrical clusters, and to prevent asymmetrical clusters.
Opta provides the x and y coordinates between axes range from 0–100, so these coordinates were further transformed to reflect typical pitch dimensions (x-coordinates ranging between 0–105 and y-coordinates ranging between 0–68).
Furthermore, to differentiate passes that cross the halfway line i.e., ‘Switch Play’, we included pass distance as a feature in addition to start and end x, y coordinates. The pass distance was calculated from the x, y coordinates prior to mirror transformation using the Euclidian distance formula given below.
Pass angle was calculated to give information about pass trajectory from the x, y coordinates prior to mirror transformation using the formula below.
Where Y = (endy - starty) and X = (endx - startx).
For analysis restricted to progressive passes that ended inside the penalty box (where the endx location is greater than or equal to 83 and the endy location is between or equal to 21.1 and 78.9), the endx and endy coordinates were not used as features, leaving 4 features in the analysis. This would give added importance to the trajectory of the pass for passes ending inside the penalty box. Finally, these features were scaled from 0 to 1 using a min-max standardisation for each feature prior to performing k-means.
3.4Statistical analysis
The data was extracted and stored in Google BigQuery, with further pre-processing performed in R Statistical Software (v4.0.5; R Core Team 2021). We utilised multiple packages including bigrquery (v1.14.1) for data extraction, Tidyverse (v2.0.0), caret (v6.0-93) and FNN (v1.1.3.1) for data preparation and final feature development. To create the elbow plot, both the cluster (v2.1.4) and factoextra (v1.0.7) packages were required, and finally data visualisation was carried out using ggplot2 (v3.4.1) and ggsoccer (v0.1.7). Finally, k-means clustering analysis within the SeCo Framework was performed in MATLAB (R2021b 9.11.0.176996).
3.5K-Means pros and cons
K-means is one of the widely used clustering methods to find latent structures within a large dataset (Lisboa et al. 2013). The major benefit of k-means remains in its simplicity in how data points are assigned to the clusters, by finding the centroid of the cluster with the nearest Euclidian distance. This makes the results found interpretable to the end user, which will have major benefits to describing these progressive pass clusters to a coach. However, there are major issues with the k-means algorithm, that affects the reproducibility of the clusters found. As the k-means algorithm is strongly dependent on the random initialised starting point (Steinley 2006), the running of the algorithm multiple times using the same data is likely to lead to differing results. Whilst this issue can be minimised by determining the “optimal” number of clusters (k), commonly used methods such as the “elbow” plot to determine k have poor performance in maximizing reproducibility (Haslbeck & Wulff, 2020). This meant that the traditionally obtained “optimal” solution using the elbow plot is unable to find the same latent structures within a dataset and reproduce the same cluster centroids, casting doubt on the validity of the clustering solution achieved.
3.6SeCo framework procedure
To overcome this issue, we utilise the Separation and Concordance (SeCo) framework, first developed by Lisboa et al. (2013) and compare these results to the “elbow” method. The separation measure is used to identify well-separated k-means solutions and the concordance measure is used to identify the most repeatable k-means solution from many k-means candidate solutions, obtained from bootstrapping. This framework looks to reduce the dependence on the random initialisation of the k-means algorithm by choosing a stable and well-separated partition from hundreds of potential k-means implementations. The Concordance measure used was Cramér’s V-index, which is a measure of association between two cluster solutions. The Separation measure used was within-cluster sum of squares using the Euclidian distance measures. The resulting analysis produced a two-dimensional plot of Concordance and Separation for the top 10% candidate solutions (determined by their separation) for each k, which allows us to see the repeatability of k-means when changing k. Full details for the SeCo framework and associated formula for creating these measures can be found in the seminal paper (Lisboa et al. 2013).
The SeCo framework is not to be used to determine a single value of k, but to highlight the k values of interest (Chambers et al. 2013). It determines values of k where separation of clusters is robust, but stability of cluster separation is observed through multiple iterations of varying random initialised starting points. These highlighted solutions then require further analysis and domain expertise to explore and validate these solutions, before selecting k. The top two solutions with the highest separation were selected from the solutions where a high level of concordance was achieved. We then created cross-tabulations of the assigned passes between these top two cluster solutions to understand how clusters are re-assigned when k changes. Then we utilise domain knowledge of opposition analysis processes to determine whether the additional progressive pass clusters found provides a greater level of tactical detail or creates duplicates clusters (by assessing the visual representation of the progressive passes clusters), therefore reducing the interpretability of the result.
4Results
After applying the inclusion and exclusion criteria described in the methodology to extract progressive passes, a total of 127,159 progressive passes were included for the analysis. These were stratified into two datasets of (1) 110,565 progressive passes that ended outside the penalty box and (2) 16,594 progressive passes that ended inside the penalty box.
4.1Determination of k from SeCo framework
Separation-Concordance plot or the SeCo map obtained from the SeCo framework applied on the dataset of progressive passes ending outside the penalty box is shown in Fig. 2A. The figure suggests that after k = 15 there is large drop in concordance which does not recede back. Initially the top 10% of k-means solutions where k ranges from 2 to 14 showed almost perfect concordance (Crameérs V-index ∼1) between their centroid values. This slightly drops when k is 15, with a median concordance value of 0.98 (0.97–0.99). Therefore k = 14 was selected as a value of interest and was compared to k = 13, to see if k = 14 provided greater separation, and thereby greater tactical insight. In comparison, the “elbow” method used to determine optimal k shows k = 10 as the ”elbow point”, where the total within sum of squares stops decreasing rapidly (see Fig. 3A).
Fig. 2
[A] An elbow plot for progressive passes ending outside the penalty box; [B] An elbow plot for progressive passes ending inside the penalty box.
![[A] An elbow plot for progressive passes ending outside the penalty box; [B] An elbow plot for progressive passes ending inside the penalty box.](https://ip.ios.semcs.net:443/media/jsa/2023/9-4/jsa-9-4-jsa220732/jsa-9-jsa220732-g002.jpg)
Fig. 3
[A] A Seperation-Concordance (SeCo) plot for progressive passes ending outside the penalty box; [B] A cross-tabulation showing the membership proportion of the 13-cluster solution present in the 14-cluster solution; [C] A plot displaying the most representative (dark grey) and randomly sampled (light grey) passes within the 13- cluster solution for International Matches.; [D] A plot displaying the most representative (dark grey) and randomly sampled (light grey) passes within the 14-cluster solution.
![[A] A Seperation-Concordance (SeCo) plot for progressive passes ending outside the penalty box; [B] A cross-tabulation showing the membership proportion of the 13-cluster solution present in the 14-cluster solution; [C] A plot displaying the most representative (dark grey) and randomly sampled (light grey) passes within the 13- cluster solution for International Matches.; [D] A plot displaying the most representative (dark grey) and randomly sampled (light grey) passes within the 14-cluster solution.](https://ip.ios.semcs.net:443/media/jsa/2023/9-4/jsa-9-4-jsa220732/jsa-9-jsa220732-g003.jpg)
Figure 2B tabulates the percentage of membership of each pass ending outside the penalty box for the 13-cluster solution against the 14-cluster solution. This shows how the 13-cluster solution maps onto the 14-cluster solution, as cluster 1a (Goalkeeper (GK) Central to Mid Central) in the 13-cluster solution splits into 2 clusters 1a and 1b (GK Central to Mid Half Space (44.89%) and Def Central to Mid Central (54.42%)). We can further understand this by looking at the visual representation of the progressive passes for both the 13-cluster solution (Fig. 2C) and the 14-cluster solution (Fig. 2D). The remaining 12 clusters display similar centroid values and identical naming between the 13- and 14- cluster solutions, retaining 95.95% (89.4 to 98.76) of passes.
The SeCo map from the framework applied on the dataset of progressive passes ending inside the penalty box is shown in Fig. 4A, showing minimal within-cluster variation for k ranging from 2 to 8. In addition to these models, models with k values of 10 and 12 represent a high degree of repeatability with a concordance value near 1. Furthermore, the figure shows some degree of repeatability and stability in concordance value when k is 9, 11 and 13 to 18. Amongst the k values with stable concordance, k = 16 exhibits the best solution (with the highest concordance value). Overall, the SeCo framework shows us that k = 10, 12 and 16 are interesting solutions to investigate further to understand whether the greater separation provided by higher values of k are meaningful or not from a tactical perspective. In comparison the “elbow point” in Fig. 3B occurs where k = 7.
Based on visualisation of the progressive pass types observed with higher values of k [k = 12 and k = 16] (Fig. 4C and 4D), we see that both the solutions contain potentially duplicate or extremely similar clusters which have been assigned the same name. For example, pass type ‘Final Half Space to PB 2nd 6 Yd’ and ‘Final Wide to PB Wide 2nd 6 Yd’ are extremely similar clusters, and tactically can be grouped together. Whilst these models [k = 12 and k = 16] are stable, splitting the data into a greater number of clusters does not reveal distinct progressive passing types from a tactical perspective, therefore we reject both k = 12 and k = 16 in favour of a more parsimonious model (k = 10) (Fig. 4E). A cross-tabulation comparing the membership of passes in the 10-cluster solution versus the 12-cluster solution (Fig. 4B) shows us how the 10-cluster solution bifurcates 2 clusters into 4 similar clusters. For the remaining 8 clusters in the 10-cluster solution, we see 82.68% (68.73% to 94.21%) of the passes are represented in the equivalent cluster in the 12-cluster solution.
Fig. 4
[A] A Seperation-Concordance (SeCo) plot for progressive passes ending inside the penalty box; [B] A cross-tabulation showing the membership proportion of the 10-cluster solution present in the 12-cluster solution [C] A plot displaying the most representative (dark grey) and randomly sampled (light grey) passes the 12-cluster solution for International Matches; [D] A plot displaying the most representative (dark grey) and randomly sampled (light grey) passes within the 10-cluster solution.
![[A] A Seperation-Concordance (SeCo) plot for progressive passes ending inside the penalty box; [B] A cross-tabulation showing the membership proportion of the 10-cluster solution present in the 12-cluster solution [C] A plot displaying the most representative (dark grey) and randomly sampled (light grey) passes the 12-cluster solution for International Matches; [D] A plot displaying the most representative (dark grey) and randomly sampled (light grey) passes within the 10-cluster solution.](https://ip.ios.semcs.net:443/media/jsa/2023/9-4/jsa-9-4-jsa220732/jsa-9-jsa220732-g004.jpg)
4.2Risk-reward profiles
For both the 14-cluster and 10-cluster solutions observed as optimal solutions from the SeCo framework for progressive passes ending outside and inside the penalty box respectively, we computed the risk-reward profile (Table 3). For progressive passes ending outside the penalty box, “Mid Central to Mid Half Space” and “Mid Half Space to Final Central” had the best balance between risk and reward, with a risk of 26.3% and 29.9% respectively and a reward of 17.7 and 19.8% respectively. Both these pass types represent a risk to reward ratio of ∼1.5. For progressive passes inside the penalty box, “Final Central to PB Central 1st 6 Yd” had the greatest reward with a shot created in 33% of the possession sequences and an average xG of 0.18. However, these progressive passes came at a greater risk, with a turnover percentage of 49% .
4.3Case study
These progressive pass clusters can be utilised to find patterns across teams to determine progressive passes used with greatest frequency (Bekkers & Dabadghao, 2019) and to determine the efficacy of these passes from subsequent possession outcomes (Power et al., 2017) against competition benchmarks. Applying a similar methodology employed in the aforementioned studies to the analysis of game data of teams that reached the last 16 of the World Cup, we can identify distinct strategies across teams (see Fig. 5). This can range from the most common progressive passes observed amongst these teams in different phases of the game (build up within the team’s own half, entering the final 3rd and entering the penalty box) and whether there was a bias in terms of the side of the pitch (left, right or central) used for different progressive pass types.
Fig. 5
A plot displaying the most frequent penalty box entry (grey), final 3rd entry (dark grey) and build up (light grey) progressive passes (most representative pass on the left, right or both shown only) for each team reaching the last 16 of Qatar 2022 World Cup.
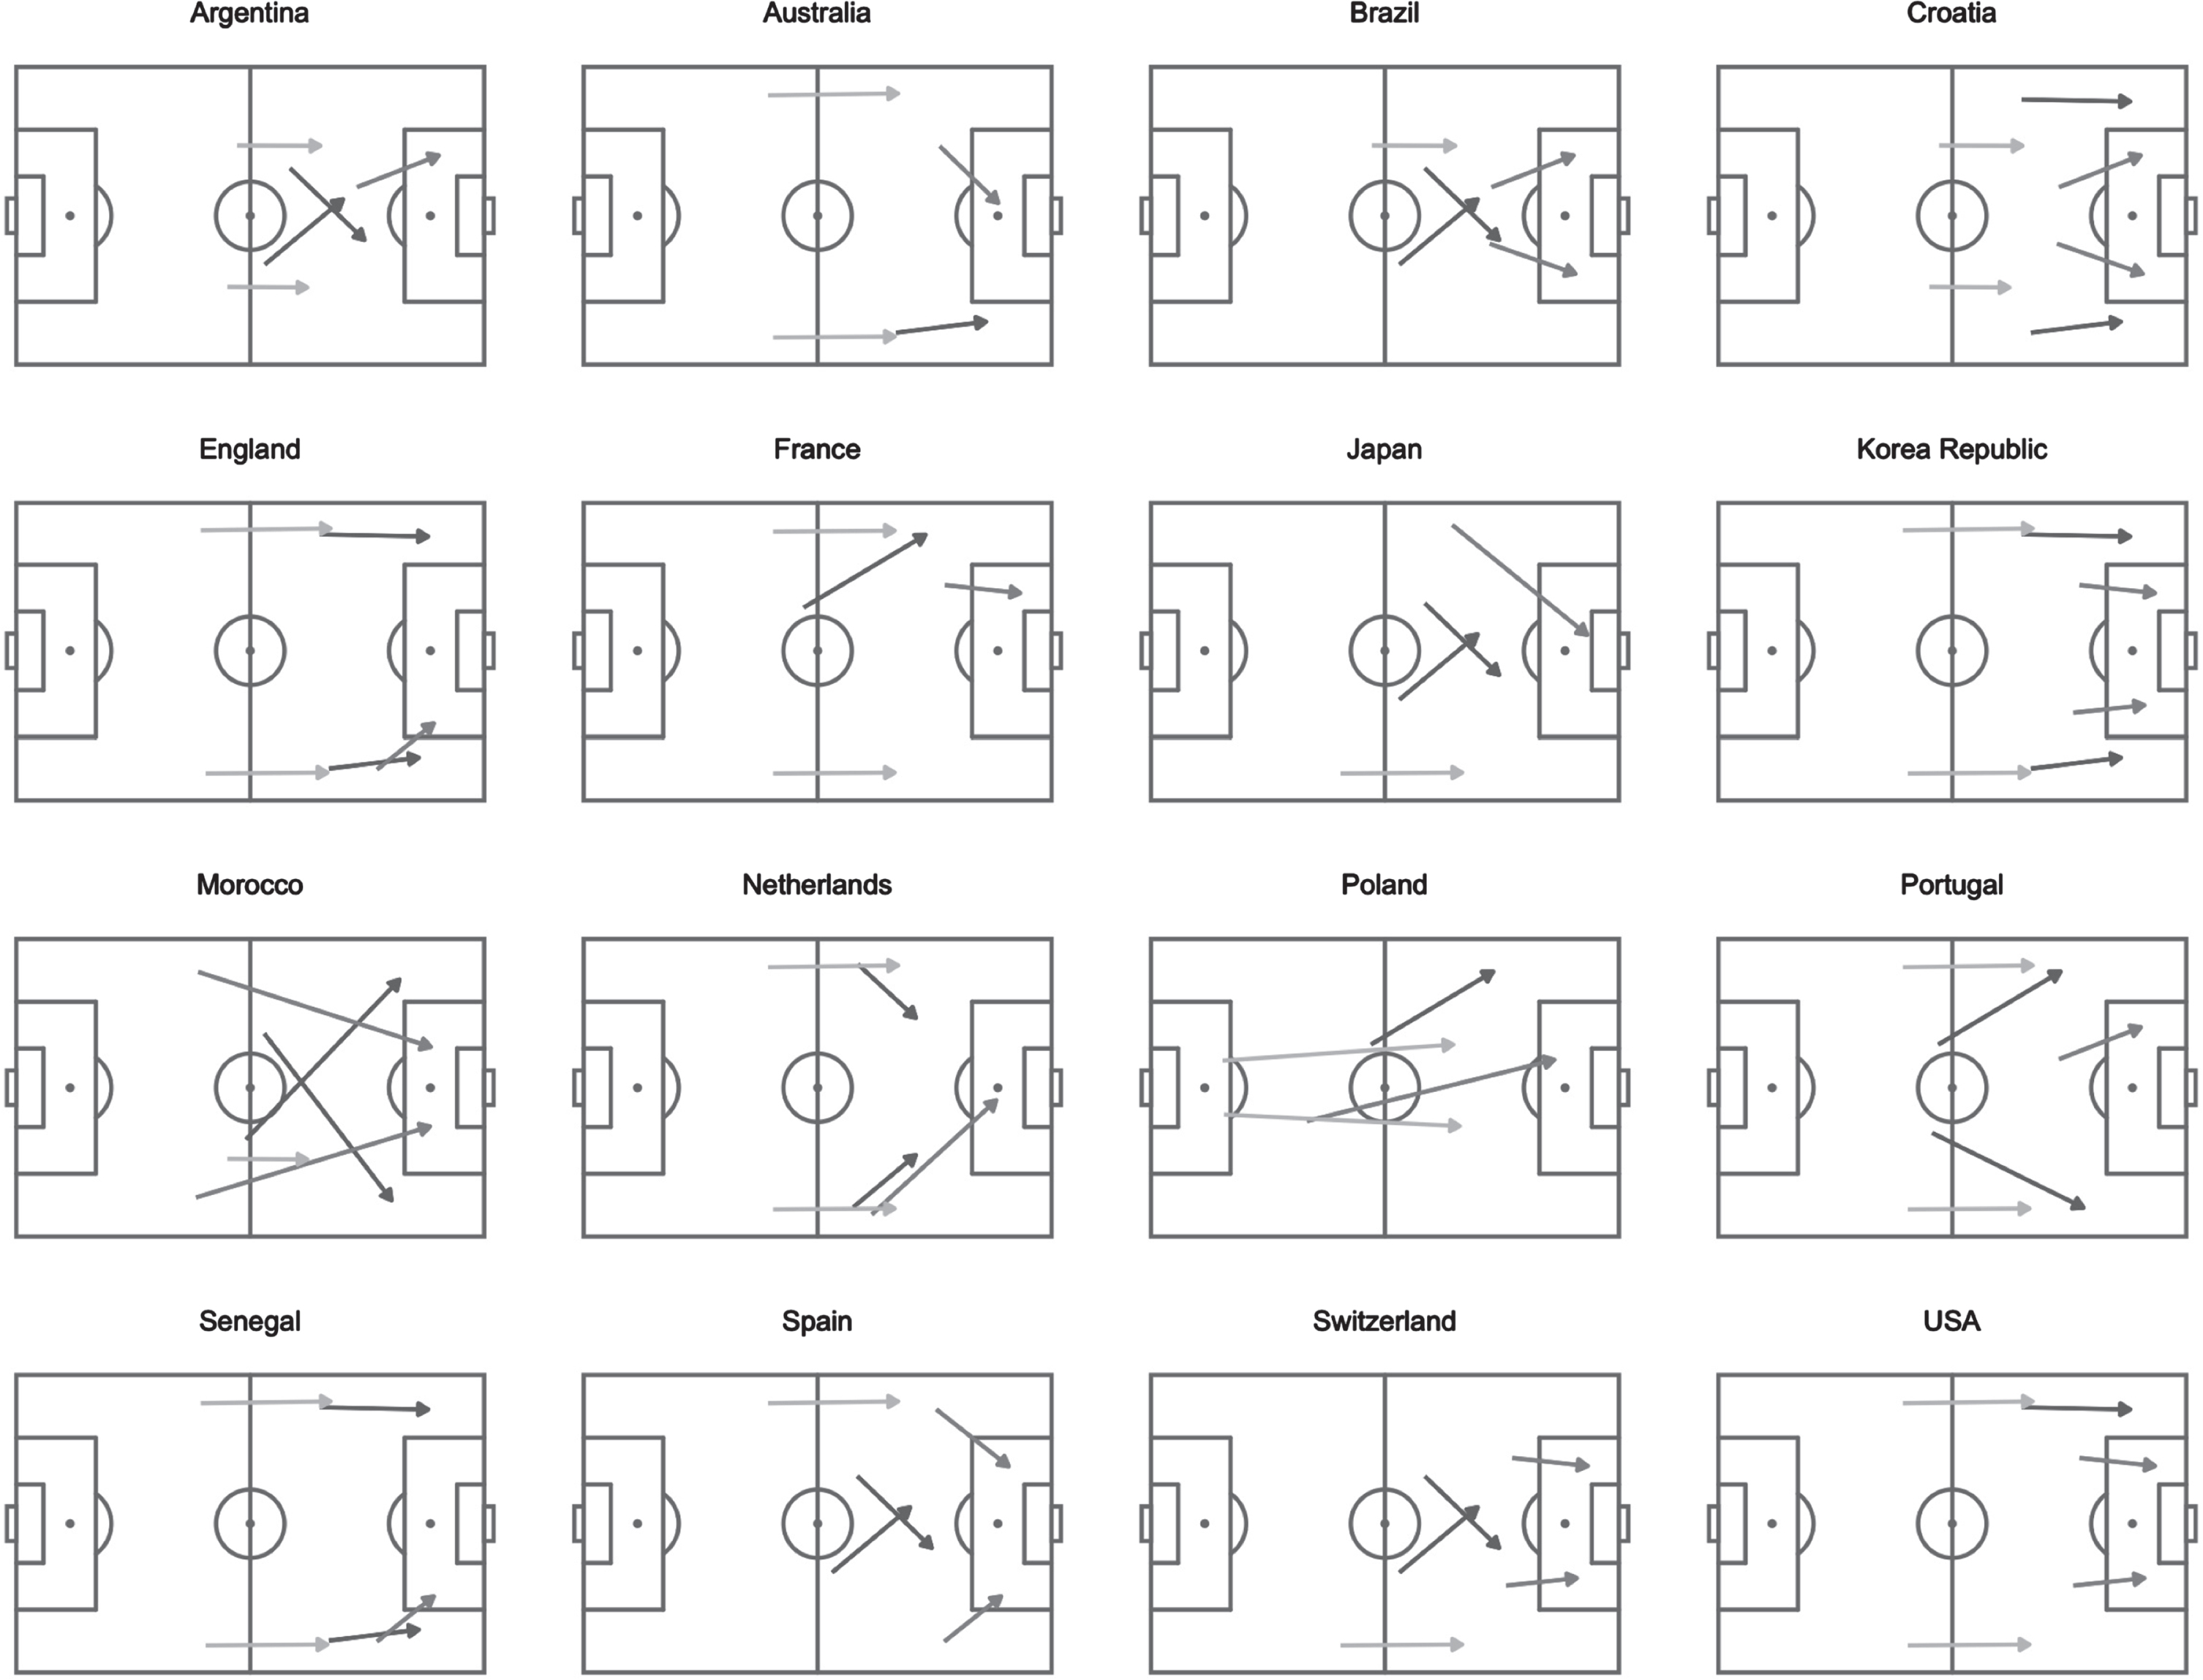
We see that France implements progressive passes that had a bias towards the left side of the pitch when trying to enter the final 3rd or penalty box (see Fig. 5) with Kylian Mbappé and Theo Hernández receiving most of these successful progressive passes. Whilst in build-up play, the progressive pass type “Mid Wide to Mid Wide”, France implements a more balanced approach finding both Kylian Mbappé and Ousamane Dembélé on left and right sides respectively. In contrast Argentina enter the final 3rd more centrally with Lionel Messi and Alexis McAllister receiving majority of “Mid Half Space to Final Central” progressive passes. They also enter the penalty box most predominantly using “Final Central to PB Central 1st 6 Yd”, which we have seen is the progressive pass with greatest efficacy in terms of creating shots and led to 2 goals for Argentina during the World Cup. This location of pass is described as zone 14 by Herold et al., (2019), which has similarly shown to increase goal-scoring opportunities (Brooks, Kerr & Guttag, 2016).
5Discussion
5.1Research and main findings
The aim of the study was to introduce and apply the SeCo framework, for the very first time in sports analytics, particularly in football analytics, to perform clustering that allowed us to define progressive pass methods with a high degree of validity. K-means analysis was used to find the different structures of the progressive passes, and the SeCo framework allowed us to explore how these progressive pass clusters breaks down into granular clusters of progressive passes as we try to increase k. Furthermore, the SeCo framework allowed us to identify the optimal solutions (with the optimal number of distinct pass type clusters). The solutions were then mapped against one another to identify pass structures that were unique or duplicate within the higher k solution. Duplicate structures arising with increasing k was identified in this study with domain knowledge and expertise, and the aid of visual representation of the progressive pass types.
The strength of the SeCo framework employed in this study is that it provides a repeatable cluster-solution utilising a large dataset. In contrast to comparator method using the “elbow” plot, the SeCo framework suggested using a higher value for k and therefore revealed a greater number of progressive pass types, whilst retaining the robustness of the overall solution. From the cross-tabulations of cluster allocations compared between cluster solutions when k = 13 and k = 14, we observe the stability of both the solutions, and how the cluster “GK Central to Mid Central” split into two, to reveal another distinct progressive pass type - “GK Central to Mid Half Space”.
Table 1
A table showing the absolute centroid values and standard deviation for every feature for each progressive pass cluster in the 14-cluster solution for progressive passes ending outside the penalty box
| Cluster name | n (%) | Euclidian | Cluster features [mean±SD] | |||||
| distance | Start x1 | Mod Start y2 | End x1 | Mod End y2 | Pass Angle (°)3 | Pass Distance (m) | ||
| 1a. GK Central to Mid Half Space | 6726 (6.1%) | 0.26±0.08 | 16.8±9.2 | 5.9±4.4 | 66.6±8.3 | 10.2±5.2 | 2.5±13.0 | 52.7±8.4 |
| 1a. GK Central to Mid Wide | 7397 (6.7%) | 0.29±0.08 | 16.9±10.6 | 8.1±5.1 | 53.2±11.9 | 27.1±4.7 | –28.7±10.6 | 47.7±11.7 |
| 1b. Def Central to Mid Central | 7675 (6.9%) | 0.29±0.08 | 20.7±11.1 | 8.1±5.0 | 46.1±8.2 | 7.7±4.8 | 9.6±17.7 | 28.8±8.9 |
| 1b. Def Central to Mid Wide | 3489 (3.2%) | 0.30±0.09 | 23.8±13.0 | 5.1±4.2 | 57.5±13.0 | 25.8±5.3 | 43.7±10.4 | 59.4±11.3 |
| 1b. Def Wide to Mid Half Space | 7743 (7.0%) | 0.30±0.08 | 32.7±11.1 | 25.9±4.4 | 61.2±11.9 | 10.3±5.0 | 34.8±14.8 | 42.3±13.2 |
| 1b. Def Wide to Mid Wide | 7054 (6.4%) | 0.26±0.08 | 51.3±12.6 | 26.5±4.4 | 45.2±8.3 | 24.7±5.2 | 4.4±12.7 | 29.9±8.8 |
| 2a. Mid Half Space to Final Wide | 8143 (7.4%) | 0.29±0.09 | 48.8±11.7 | 11.6±5.2 | 80.2±11.9 | 27.0±4.2 | –29.5±10.5 | 38.5±12.1 |
| 2a. Mid Half Space to Mid Half Space | 9866 (8.9%) | 0.23±0.07 | 40.4±9.0 | 16.0±3.4 | 68.1±8.9 | 16.2±3.4 | –0.1±12.2 | 20.22±8.2 |
| 2b. Mid Wide to Mid Wide | 11720 (10.6%) | 0.24±0.08 | 57.1±11.4 | 27.6±3.6 | 68.0±8.7 | 27.8±4.0 | –0.2 s±12.2 | 28.9±11.2 |
| 2b. Mid Central to Mid Half Space | 6414 (5.8%) | 0.26±0.08 | 59.7±11.2 | 5.1±3.3 | 72.8±8.4 | 9.2±4.6 | –12.5±17.0 | 18.1±7.5 |
| 2b. Mid Half Space to Final Central | 10292 (9.3%) | 0.27±0.07 | 52.8±11.5 | 11.4±5.1 | 74.4±8.1 | 6.1±4.0 | 39.1±15.1 | 24.4±10.4 |
| 2b. Mid Half Space to Final Wide Diagonal | 5219 (4.7%) | 0.31±0.11 | 62.8±9.0 | 12.2±6.6 | 82.9±10.6 | 25.6±5.0 | 52.1±10.8 | 66.6±12.3 |
| 2b. Mid Wide to Final Half Space | 8921 (8.1%) | 0.24±0.08 | 69.5±9.7 | 27.4±3.6 | 75.1±7.3 | 15.7±4.7 | 45.2±14.4 | 23.5±10.1 |
| 2b. Mid Wide to Final Wide | 9906 (9.0%) | 0.24±0.08 | 39.0±12.17 | 27.2±4.2 | 90.1±8.4 | 25.8±3.5 | 5.8±14.3 | 21.9±10.0 |
1scale: 0–105 distance from team’s own goal line. 2scale 0–34 distance from centre of pitch. 3scale: Angles are inverted from the left side, so a pass away from the centre is always a negative value.
We also found that of the progressive passes ending outside the penalty box in the defensive and middle 3rd, the most effective progressive passes originated in central areas. This was also the case for progressive passes ending inside the penalty box. More specifically, the greatest efficacy of progressive passes originating in central areas was for those that ended in wide areas of the penalty box. But this led to a sacrificed chance quality, i.e., mean xG per shot was lower than progressive passes that ended in central areas of the penalty box. Progressive passes entering the penalty box originating from deeper areas created a higher chance quality, but lower shot creation and a higher turnover rate, making this an ineffective strategy. It should be noted that a limitation in these findings is that we do not know the intended target and location of passes that are not received by a teammate. Therefore, this leads to a dilution of the efficacy of passes entering the penalty box from deeper areas, due to passes being overhit and running through to the goalkeeper.
Table 2
A table showing the absolute centroid values and standard deviation for every feature for each cluster in the 10-cluster solution for progressive passes ending inside the penalty box
| Cluster Name | n (%) | Euclidian | Cluster features [mean±SD] | |||
| distance | Start x1 | Mod Start y2 | Pass Angle (°)3 | Pass Distance (m) | ||
| 1. Def Central to PB Wide 1st 6 Yd | 1038 (6.3%) | 0.23±0.08 | 39.0±12.4 | 7.8±4.6 | 6.2±13.1 | 59.0±11.4 |
| 1. Def Wide to PB Wide 1st 6 Yd | 897 (5.4%) | 0.19±0.07 | 42.0±8.1 | 25.2±4.6 | 18.0±10.4 | 60.2±9.4 |
| 2. Mid Half Space to PB Wide 2nd 6 Yd | 1445 (8.7%) | 0.16±0.05 | 63.1±7.0 | 16.6±3.8 | 11.0±10.6 | 35.0±6.7 |
| 2. Mid Half Space to PB Wide 2nd 6 Yd Across | 1684 (10.1%) | 0.16±0.06 | 71.3±7.4 | 15.1±3.6 | 48.1±10.6 | 48.2±7.7 |
| 2. Mid Wide to PB Wide 2nd 6 Yd Across | 1564 (9.4%) | 0.18±0.06 | 66.5±6.8 | 28.3±2.9 | 37.7±14.6 | 46.3±10.5 |
| 3. Final Central to PB Central 1st 6 Yd | 1606 (9.7%) | 0.18±0.05 | 74.5±6.7 | 5.0±2.9 | 32.6±13.4 | 27.4±9.9 |
| 3. Final Central to PB Wide 1st 6 Yd | 2134 (12.9%) | 0.17±0.06 | 76.6±6.4 | 5.4±3.2 | –21.5±13.4 | 21.1±8.2 |
| 3. Final Half Space to PB Central 1st 6 Yd | 1571 (9.5%) | 0.15±0.05 | 80.8±4.8 | 14.9±2.9 | 46.7±12.1 | 24.0±7.4 |
| 3. Final Half Space to PB Wide 2nd 6 Yd | 2493 (15.0%) | 0.14±0.05 | 79.5±4.9 | 14.8±3.1 | 3.0±11.1 | 16.3±5.4 |
| 3. Final Wide to PB Wide 2nd 6 Yd | 2162 (13.0%) | 0.16±0.05 | 81.6±5.9 | 26.0±3.2 | 41.0±14.4 | 23.8±6.5 |
1scale 0–34 distance from centre of pitch. 2scale: 0–105 distance from team’s own goal line. 3scale: Angles are inverted from the left side, so a pass away from the centre is always a negative value.
Table 3
A table showing the frequency of progressive pass clusters and their associated risk-reward profile (outcomes)
| Cluster name | |||||
| Progressive Passes Ending Outside Penalty Box | n (%) | Ball Loss (%)1 | Shot (%)2 | xG per Shot3 | Goal (%)2 |
| 1a. GK Central to Mid Half Space | 1720 (5.0%) | 74.9% | 4.2% | 0.13 | 0.9% |
| 1a. GK Central to Mid Wide | 2120 (6.1%) | 49.3% | 5.2% | 0.14 | 1.1% |
| 1b. Def Central to Mid Central | 2043 (5.9%) | 37.2% | 7.8% | 0.15 | 1.1% |
| 1b. Def Central to Mid Wide | 1031 (3.0%) | 39.7% | 8.2% | 0.16 | 1.8% |
| 1b. Def Wide to Mid Half Space | 1987 (5.7%) | 52.0% | 8.0% | 0.13 | 1.0% |
| 1b. Def Wide to Mid Wide | 1923 (5.5%) | 58.8% | 4.1% | 0.15 | 0.9% |
| 2a. Mid Half Space to Final Wide | 2349 (6.8%) | 26.7% | 16.1% | 0.14 | 2.0% |
| 2a. Mid Half Space to Mid Half Space | 2665 (7.7%) | 26.6% | 12.8% | 0.14 | 2.3% |
| 2b. Mid Wide to Mid Wide | 2976 (8.6%) | 42.6% | 7.4% | 0.15 | 1.5% |
| 2b. Mid Central to Mid Half Space | 1785 (5.1%) | 26.3% | 17.7% | 0.14 | 2.9% |
| 2b. Mid Half Space to Final Central | 2747 (7.9%) | 29.9% | 19.8% | 0.14 | 3.6% |
| 2b. Mid Half Space to Final Wide Diagonal | 1399 (4.0%) | 32.5% | 14.9% | 0.14 | 2.8% |
| 2b. Mid Wide Final Half Space | 2470 (7.1%) | 30.9% | 15.5% | 0.14 | 3.3% |
| 2b. Mid Wide to Final Wide | 2707 (7.8%) | 26.9% | 15.9% | 0.15 | 2.5% |
| Progressive Passes into Penalty Box | |||||
| 1. Def Central to PB Wide 1st 6 Yd | 291 (0.8%) | 81.1% | 7.9% | 0.24 | 2.1% |
| 1. Def Wide to PB Wide 1st 6 Yd | 256 (0.7%) | 86.7% | 5.9% | 0.14 | 2.3% |
| 2. Mid Half Space to PB Wide 2nd 6 Yd | 409 (1.2%) | 64.5% | 16.1% | 0.17 | 2.7% |
| 2. Mid Half Space to PB Wide 2nd 6 Yd Across | 417 (1.2%) | 54.7% | 24.5% | 0.15 | 2.9% |
| 2. Mid Wide to PB Wide 2nd 6 Yd Across | 411 (1.2%) | 70.8% | 16.1% | 0.20 | 4.1% |
| 3. Final Central to PB Central 1st 6 Yd | 467 (1.3%) | 49.0% | 33.0% | 0.18 | 5.1% |
| 3. Final Central to PB Wide 1st 6 Yd | 623 (1.8%) | 38.4% | 32.4% | 0.16 | 6.7% |
| 3. Final Half Space to PB Central 1st 6 Yd | 461 (1.3%) | 60.3% | 30.4% | 0.18 | 6.9% |
| 3. Final Half Space to PB Wide 2nd 6 Yd | 802 (2.3%) | 34.8% | 28.7% | 0.18 | 6.2% |
| 3. Final Wide to PB Wide 2nd 6 Yd | 664 (1.9%) | 34.9% | 23.8% | 0.17 | 3.2% |
1progressive passes that were unsuccessful. 2progressive passes that led to a shot/goal in the possession. 3average xG value of shots created in the possession.
5.2Research in the context of existing literature
The k-means clustering employed in our study aligns with the methodology used by Power et al. (2017), However, in this study, we report a detailed methodology on feature selection, use of SeCo framework to explore various k of interest, and mapping of the solutions with various k of interest, to find the most optimal solution. In this study, feature selection allowed us to group symmetrical passes into the same cluster to prevent duplicate symmetrical clusters, allowing us to find more distinct clusters, and improve the interpretability of the final solutions. The interesting observation from the risk-reward profiles conducted for this study - that passes originating in the final 3rd were most effective in creating shot opportunities concurs with observation from the study by Power et al. (2017). The stratification of clustering by progressive passes ending outside and inside the penalty box can be justified from the observation in Table 2, as we found that progressive pass types ending inside the penalty box had overall greater efficacy (Goal %) than progressive pass types ending outside the penalty box. In contrast to our findings, the Power et al. (2017), study did not find any progressive pass cluster that ended inside the penalty box. This is likely because (1) they did not stratify the data into passes ending inside and outside the penalty box, (2) they did not perform a mirror transformation of the some of the features such as the start and end coordinates. This meant that progressive passes entering the penalty box in their study are represented in a cluster where the centroid value ends outside the penalty box.
5.3Implications for future research
With the wide availability of tracking data through computer vision (Bornn, Cervone & Fernandez, 2018), future research should expand on our approach utilising tracking data, allowing spatio-temporal features to be created in relation to the opposition defensive shape. This would allow us to detect and describe penetrative passes, which are passes towards goal going past an opponent player (Tenga et al., 2010). Fernández, Bornn and Cervone (2021) have laid the groundwork for this research by detecting opposition defensive lines by clustering the x co-ordinate. Development of a comprehensive rules-based methodology in this area of research would aid standardised evaluation of penetrative passes.
5.4Practical implications
For Researchers: The SeCo framework can be applied to other clustering problems in football to determine k of interest and create clusters in a systematic and repeatable way. Also, the code available in this Github repository allows reproducibility of these progressive pass clusters for further areas of research in different phases of play.
For Practitioners: The progressive pass clusters in combination with their risk reward profiles generated in this study can be used: (1) to create performance indicators on team style and efficacy in comparison to competition benchmarks and (2) to perform opposition analysis to understand the types of progressive passes that are made and received by opposition players and relationships between players.
6Conclusion
The SeCo Framework for k-means clustering has provided us with a robust and superior method in identifying progressive pass clusters in comparison to commonly used methods to determine the optimal number of clusters. These progressive pass clusters have been shown to have multiple applications in evaluating teams’ style of play and efficacy amongst wide ranging practical implications for both sports analytics practitioners and researchers.
References
1 | Anzer G. , Bauer P. Expected passes, Data Mining and Knowledge Discovery 36: (1), pp. 295–317. Available at https://doi.org/10.1007/s10618-021-00810-3 |
2 | Anzer G. , Bauer P. . , Brefeld U. The origins of goals in the German Bundesliga, Journal of Sports Sciences 39: (22), pp. 2525–2544. Available at https://doi.org/10.1080/02640414.2021.1943981 |
3 | Baumer B.S. , Matthews G.J. , Nguyen Q. 2023, Big ideas in sports analytics and statistical tools for their investigation, WIREs Computational Statistics, n/a(n/a), p. e1612.Available at: https://doi.org/10.1002/wics.1612. |
4 | Bekkers J. , Dabadghao S. Flow motifs in soccer: What can passing behavior tell us? Journal of Sports Analytics 5: pp. 299–311. Available at https://doi.org/10.3233/JSA-190290 |
5 | Bornn L. , Cervone D. , Fernandez J. Soccer analytics: Unravelling the complexity of “the beautiful game”’, Significance 15: (3), pp. 26–29. Available at https://doi.org/10.1111/j.1740-9713.2018.01146.x |
6 | Brooks J. , Kerr M. , Guttag J. Using Machine Learning to Draw Inferences from Pass Location Data in Soccer, Stat. Anal. Data Min. 9: (5), pp. 338–349. Available at https://doi.org/10.1002/sam.11318 |
7 | Chambers S., et al. Inference of number of prototypes with a framework approach to K-means clustering, International Journal of Biomedical Engineering and Technology 13: pp. 323. https://doi.org/10.1504/IJBET.2013.058538 |
8 | Fernández J. . , Bornn L. 2018, Wide Open Spaces: A statistical technique for measuring space creation in professional soccer. |
9 | Fernández J. , Bornn L. , Cervone D. 2021, A framework for the fine-grained evaluation of the instantaneous expected value of soccer possessions, Machine Learning, 110. Available at: https://doi.org/10.1007/s10994-021-05989-6. |
10 | Fernandez-Navarro J. et al. Evaluating the effectiveness of styles of play in elite soccer, International Journal of Sports Science & Coaching 14: pp. 174795411985536. https://doi.org/10.1177/1747954119855361 |
11 | Goes F. et al. A risk-reward assessment of passing decisions: comparison between positional roles using tracking data from professional men’s soccer, Science and Medicine in Football 6: (3), pp. 372–380. Available at https://doi.org/10.1080/24733938.2021.1944660 |
12 | Goes F.R. et al. Not Every Pass Can Be an Assist: A Data-Driven Model to Measure Pass Effectiveness in Professional Soccer Matches, Big Data 7: (1), pp. 57–70. Available at https://doi.org/10.1089/big.2018.0067 |
13 | Haslbeck J.M.B. , Wulff D.U. Estimating the number of clusters via a corrected clustering instability, Computational Statistics 35: (4), pp. 1879–1894. Available at https://doi.org/10.1007/s00180-020-00981-5 |
14 | Herold M. et al. Machine learning in men’s professional football: Current applications and future directions for improving attacking play, International Journal of Sports Science & Coaching 14: (6), pp. 798–817. Available at https://doi.org/10.1177/1747954119879350 |
15 | Hughes M. , Bartlett R. The use of performance indicators in performance analysis, Journal of Sports Sciences 20: pp. 739–754. |
16 | Kim J. et al. Determining unstable game states to aid the identification of perturbations in football, International Journal of Performance Analysis in Sport 19: (3), pp. 302–312. Available at https://doi.org/10.1080/24748668.2019.1602439 |
17 | Link D. , Lang S. , Seidenschwarz P. Real Time Quantification of Dangerousity in Football Using Spatiotemporal Tracking Data, PLOS ONE 11: pp. e0168768. https://doi.org/10.1371/journal.pone.0168768 |
18 | Lisboa P.J.G. et al. Finding reproducible cluster partitions for the k-means algorithm,, BMC Bioinformatics 14: (1), p. S8. https://doi.org/10.1186/1471-2105-14-S1-S8 |
19 | Liu H. et al. Inter-operator reliability of live football match statistics from OPTA Sportsdata, International Journal of Performance Analysis in Sport 13: (3), pp. 803–821. Available at https://doi.org/10.1080/24748668.2013.11868690 |
20 | Lopez M. , Matthews G. , Baumer B. How often does the best team win? A unified approach to understanding randomness in North American sport, The Annals of Applied Statistics, 12. Available at: https://doi.org/10.1214/18-AOAS1165 |
21 | Lucey P., et al. 2012, Characterizing Multi-Agent Team Behavior from Partial Team Tracings : Evidence from the English Premier League. |
22 | Lucey P. et al. 2015, “‘Quality vs Quantity”: Improved Shot Prediction in Soccer using Strategic Features from Spatiotemporal Data’, in. |
23 | Memmert D. , Lemmink K.A.P.M. , Sampaio J. Current Approaches to Tactical Performance Analyses in Soccer Using Position Data, Sports Medicine 47: (1), pp. 1–10. Available at https://doi.org/10.1007/s40279-016-0562-5 |
24 | Otting M. , Karlis D. Football tracking data: a copula-based hidden Markov model for classification of tactics in football, Annals of Operations Research 325: pp. 1–17. Available at https://doi.org/10.1007/s10479-022-04660-0 |
25 | Power P. et al. 2017, Not All Passes Are Created Equal: Objectively Measuring the Risk and Reward of Passes in Soccer from Tracking Data. Available at: https://doi.org/10.1145/3097983.3098051 |
26 | Rein R. , Raabe D. , Memmert D. “‘Which pass is better?” Novel approaches to assess passing effectiveness in elite soccer’, Human Movement Science 55: pp. 172–181. Available at https://doi.org/10.1016/j.humov.2017.07.010 |
27 | Spearman W. et al. 2017, Physics-Based Modeling of Pass Probabilities in Soccer. |
28 | Steiner S. et al. 2019, ‘Outplaying opponents—a differential perspective on passes using position data’, German Journal of Exercise and Sport Research, 49. Available at: https://doi.org/10.1007/s12662-019-00579-0. |
29 | Steinley D.L. Profiling local optima in K-means clustering: developing a diagnostic technique, Psychological methods 11: (2), pp. 178–92. |
30 | Swartz T. Where Should I Publish My Sports Paper? The American Statistician 74: pp. 1–18. Available at https://doi.org/10.1080/00031305.2018.1459842 |
31 | Tenga A. et al. Effect of playing tactics on goal scoring in Norwegian professional soccer, Journal of Sports Sciences 28: (3), pp. 237–244. Available at https://doi.org/10.1080/02640410903502774 |
32 | Xie X. et al. 2020, PassVizor: Toward Better Understanding of the Dynamics of Soccer Passes. |
Appendices
Appendix A
| Provider | Event Type | |
| OPTA | Set Play Pass | When a player takes a goal kick, free kick, corner or restart. |
| Head Pass | A pass that is made with a player’s head | |
| Cross | A ball that is played in from wide areas into the penalty box | |
| OPTA event x, y locations with internal definitions applied | Forward Pass | A pass angle between 105° to –105° towards goal |
| Progressive Pass | A forward pass that travels 20% closer to goal and at least 5 m forward and excluding set play passes, crosses, head passes and passes that start in the opposition penalty box |

