
Quantitative analysis of professional basketball: A qualitative discussion
Abstract
Quantitative analysis of professional basketball become an attractive field for experienced data analysts, and the recent availability of high-resolution datasets pushes data-driven basketball analytics to a higher degree. We present a qualitative discussion on quantitative professional basketball. We propose and discuss the dimensions, the levels of granularity, and the types of tasks in quantitative basketball. We review key literature in the past two decades and map them into the proposed qualitative framework, with an evolutionary perspective and an emphasis on recent advances. A list of questions around professional basketball that could be approached with quantitative tools is displayed, pointing to directions for future research. We touch on the new landscapes of virtual basketball at enriching the space for quantitative analysis. This report serves as a qualitative primer for quantitative analysis of professional basketball, exhibiting the growing prospect of the promising research area.
1Introduction
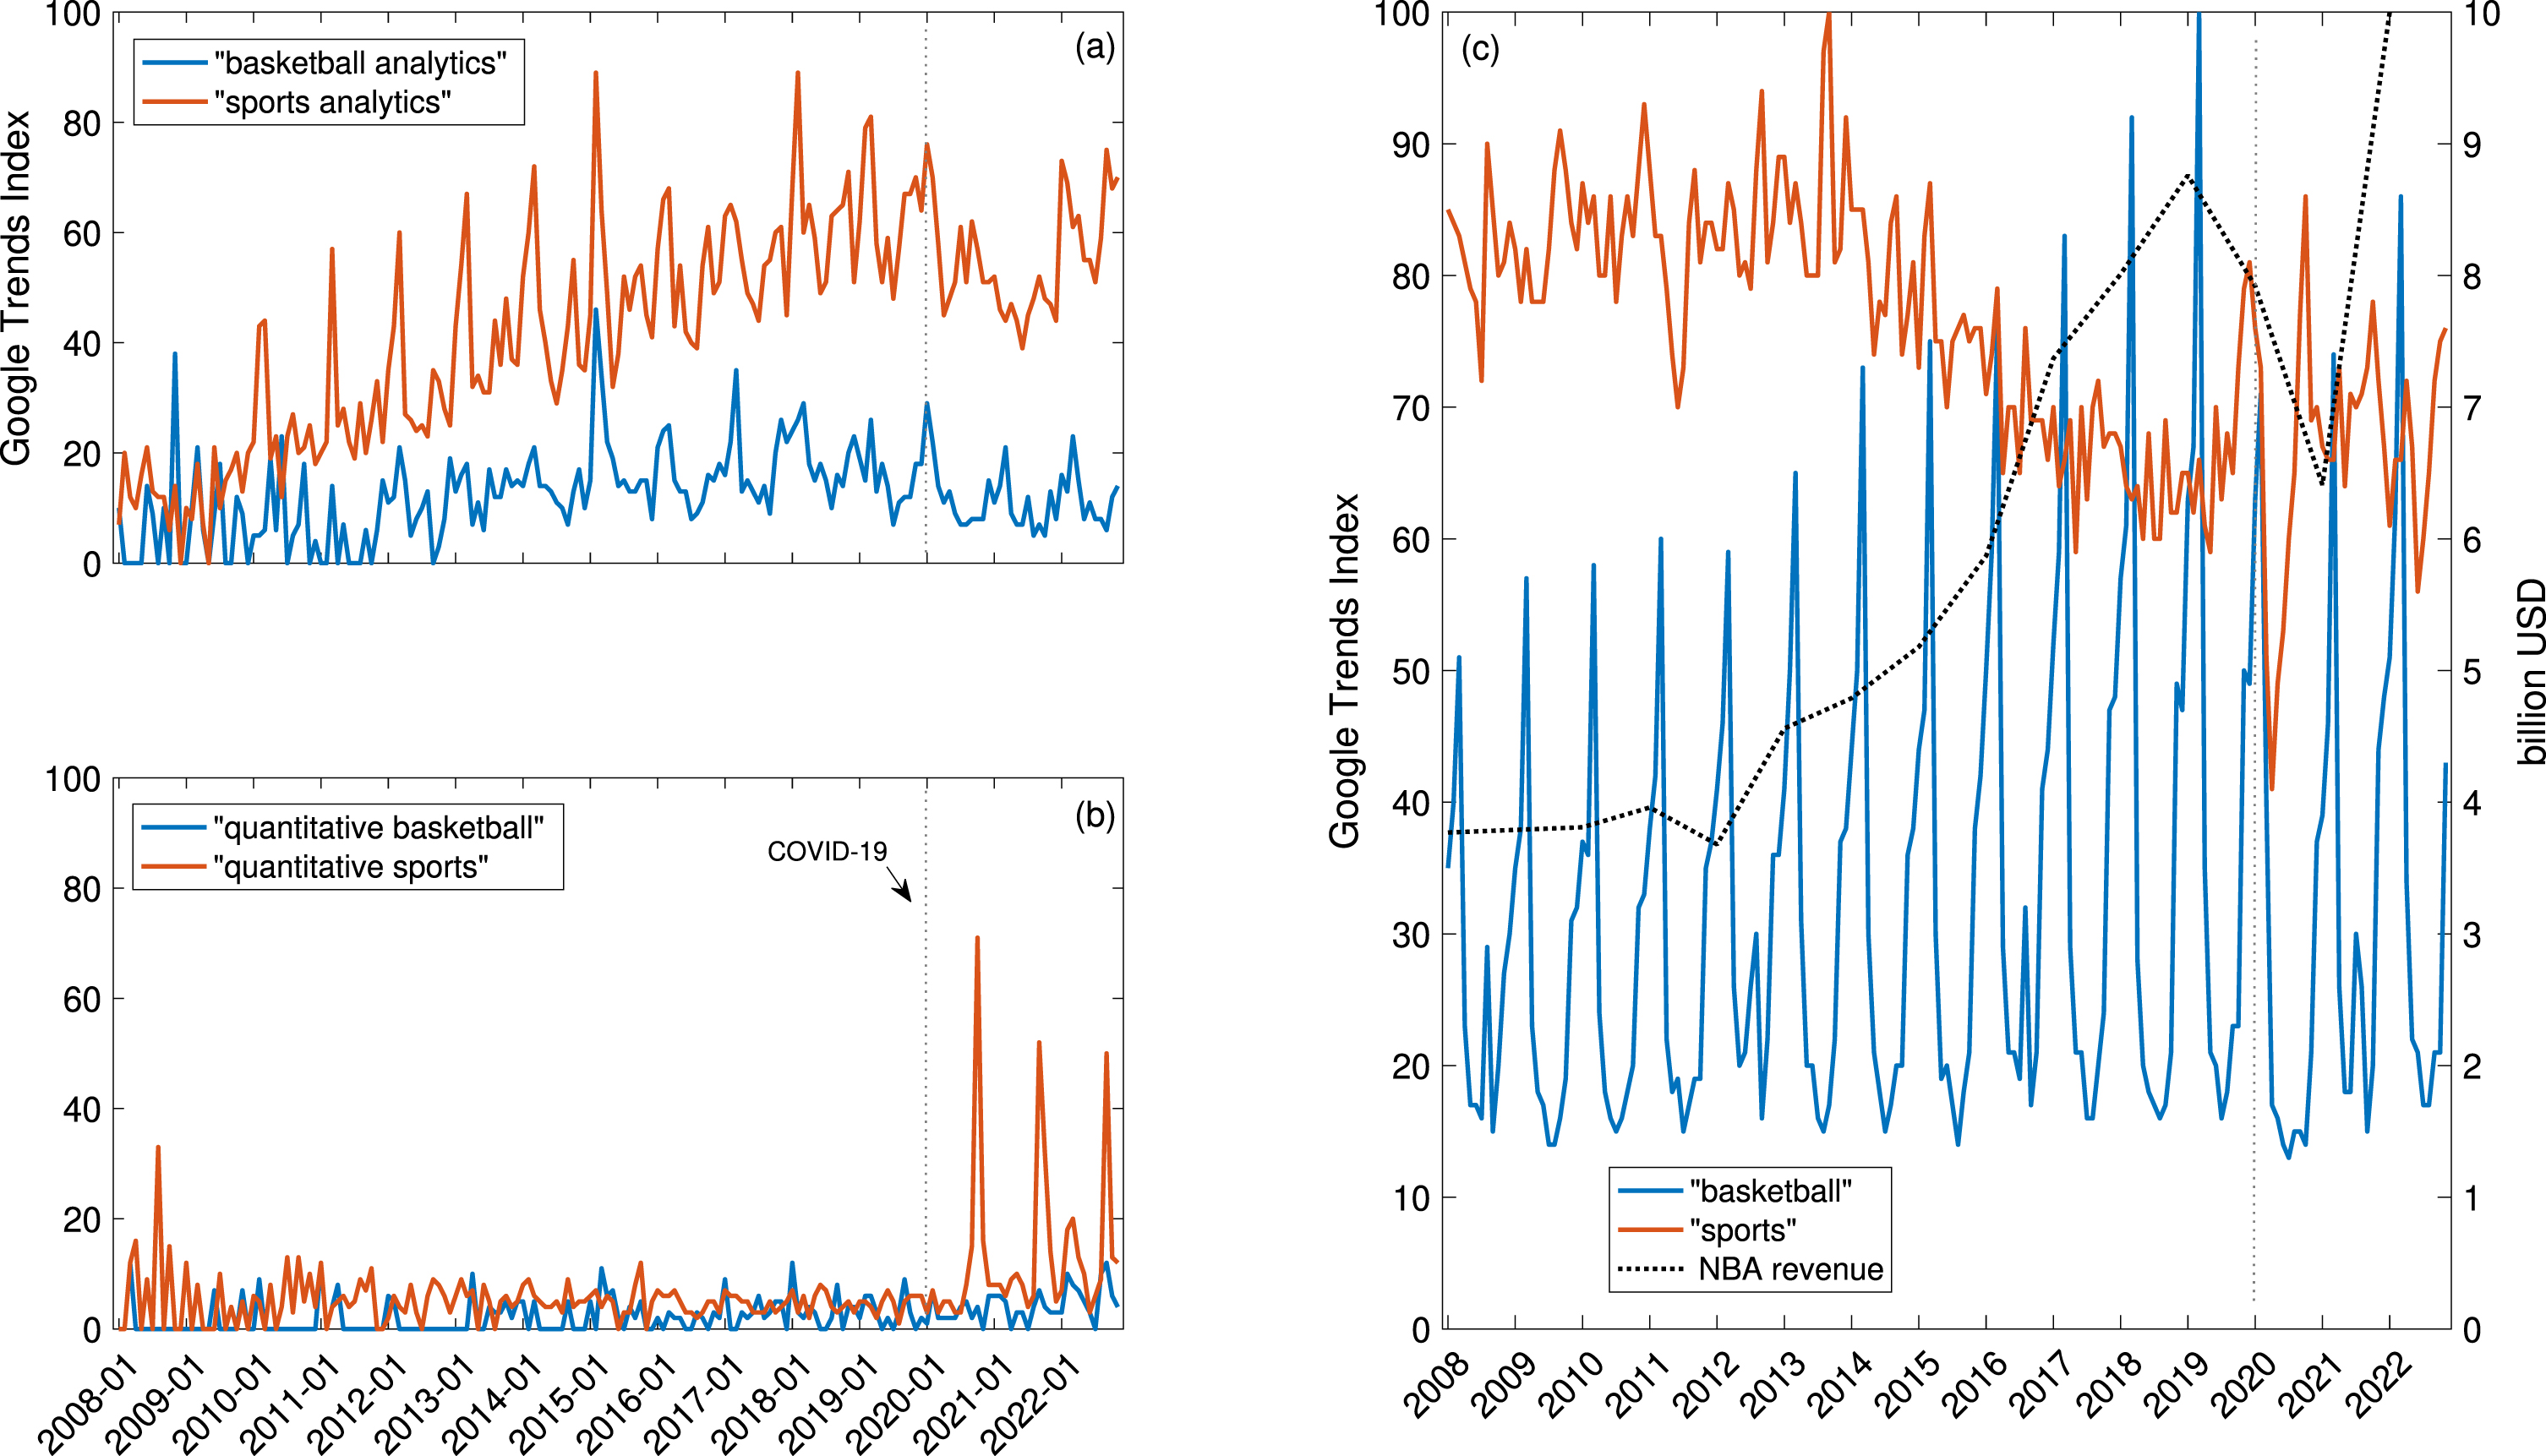
Basketball is among the most popular sports in the world with fans of all ages (Hulteen et al., 2017). The International Basketball Federation (FIBA) estimates that around 450 million people participate in this dynamic and fluid team sport1, which attracts 125 million fans in China (according to the Chinese Basketball Association (CBA)), and ranks the second most popular sport in the United States2. Professional basketball has flourished rapidly in various countries, especially during the past two decades. The National Basketball Association (NBA) in the United States, so far the most successful professional basketball league (according to Forbes Magazine, the top five NBA teams are worth 16.8 billion USD in total), has witnessed steady revenue increase in recent years3; hit hard by the COVID-19 pandemic during 2019 to 2021, NBA revenue soon recovers in 2022 (Figure 1c). This increase in popularity is supported by Google Trends (Da et al., 2011): the search strength of the keyword “basketball” has seen a steady growth (noting the seasonal pattern), despite that the search strength of “sports” is experiencing a decline from around a decade ago.
This upward trend of basketball’s popularity is currently not accompanied by a sufficient trending of its analytics. As the search strength of “sports analytics” is gaining clear momentum, the focus on “basketball analytics” sees a large potential (Figure 1a); after COVID-19, the new fervor on “quantitative sports” is soon to be diffused to “quantitative basketball” (Figure 1b). The field of quantitative basketball is in great demand and in good progress, which can benefit from recent years’ fast development of data sciences (software) and game-tracking devices (hardware) as well as other technologies.
Fig. 1
Trends in popularity during 2008 to 2022 around basketball/basketball analytics and sports/sports analytics, and trend of NBA revenue (data source: Google Trends, statista.com).
In this essay, we review key scientific literature on quantitative professional basketball published in the past two decades. We summarize popular topics in existing studies, focusing on game-play-related topics rather than topics in psychological, physiological, or social domains. Inspired by existing works, we propose the multiple dimensions (time, space, static and dynamic strategy at in-game analysis, season and league at cross-game analysis) and multiple levels of granularity (second-level, possession-level, game-level, season-level) in quantitative basketball; reviewed literature are mapped into the proposed qualitative framework. Based on this framework, we present 32 research questions around professional basketball, and summarize four types of analytical tasks that could help answer these questions: metric design, inference, evaluation system engineering, and game decision-making. During the literature review, we note the application of the newly available optical player-tracking data that provide hide-resolution materials for quantitative analysis; comparison between this novel dataset and traditional game statistics underlines their suitability for different analytical subjects.
We provide suggestions on future research directions of quantitative basketball. It is foreseeable that quantitative tools from various engineering fields will be further adopted in future analysis. Some emerging technologies, including e-game and augmented/virtual reality, have started to empower basketball analytics with novel elements and broader potential. Nonetheless, although the reviewed publications are well-cited, the majority of which are published in top sports journals and conferences, we are by no means presenting an exhaustive literature summary in this qualitative discussion. We try to balance the ideas and convey useful information on a limited scale. Besides, as basketball teams and organizations may possess massive internal data, methodologies, and strategies that are not openly shared, and team operations and analytics often rely much on information, tactics, and technologies that remain private, there is a large portion of literature missing from the current discussion. That said, we believe that the proposed qualitative framework for quantitative basketball well applies to those contents.
2Popular topics in existing literature
Quantitative analysis of professional basketball maintains a short research history yet has been drawing increasing attention in the past two decades (e.g., Huyghe et al., 2022). In the vast research space, several key topics emerge from existing literature, including outcome prediction, behaviors in games, game statistics, and team interaction. Studies forge close ties with industry groups and have witnessed successful applications, on par with other fields of data analytics. The recent availability of high-resolution optical data makes quantitative professional basketball more attractive to experienced data analysts than ever. Below we introduce important research topics in the field, which is by no means close to a comprehensive review of the literature. In particular, we focus on game-play-related analytics and leave out the majority of studies related to sports medicine/physiology/psychology.
•Given the obvious economic incentive, a large portion of research efforts in basketball analysis focus on the prediction of game outcomes. Models from multiple streams, including analytical models and expert models, have been proposed to conduct (normally probabilistic) sports forecasts, in particular on the win-lose result or the point spread (typical in basketball betting odds) of games (e.g., Strumbelj, 2014). One could see reviews on sports game prediction over the past two decades in Stekler et al. (2010) (2010s) and Horvat and Job (2020) (2020s). Regarding analytical approaches, machine learning techniques, statistical/econometric analysis, optimization methods, game theoretical attempts, and network science techniques are summoned to address the problem; a partial list of sports forecast models includes Markov models (e.g., on game outcome (Strumbelj and Vracar, 2012) or shoot strategy (Sandholtz and Bornn, 2020)), state-space models (e.g., on game outcome (Manner, 2016) or player’s hot hand (Mews and Otting, 2021)), synergy graph models (e.g., on game outcome (Liemhetcharat and Luo, 2015)), neural networks (e.g., on game outcome (Loeffelholz et al., 2009) or physical fitness evaluation (Yuan et al., 2021)), classification trees (e.g., on performance indicators (Zuccolotto et al., 2021, 2023)), and statistical regression models (e.g., on performance statistics (Song et al., 2018)) etc. Over the years, game prediction has become an active playground for data scientists from various expertise.
Agreements and Disagreements. Research on game outcome analysis concentrates on a predictive focus and outputs straightforward deliverables for readers to use, despite the complexity in modeling and estimation. Diverse analytical or semi-analytical approaches are adopted or experimented with, based on different data and modeling assumptions, as the problem is open-ended.
•Another popular line of research in quantitative basketball pays attention to behavioral phenomena in sports games, some of which are unique in basketball, including the home advantage (Ribeiro et al., 2016; Leota et al., 2021), the hot (and cold) hands in general (Yaari and Eisenmann, 2011; Stone and Arkes, 2018) or at free-throws (Arkes, 2010), effective strategies for underdogs (Skinner, 2011), the price of anarchy in basketball (Skinner, 2010), the comparison of starters and non-starters (Gonzalez et al., 2013), the comparison of all-stars and non-all-stars (Sampaio et al., 2015), the relationship between coach gender and team performance (Smittick et al., 2019), the link between fans’ age and team identity (Toder-Alon et al., 2019), the driving factor of coach dismissal (Wangrow et al., 2018), the attachment of fans upon team’s geographical proximity, local superstar recognition and team success (Grimshaw and Larson, 2021) etc. These research works investigate the existence of the target phenomena, attempt to model and explain them, and further try to extrapolate the phenomena to a broader context beyond basketball. Studies in this category have less predictive power and are not directly applicable to the industry, yet the identification and quantitative discussion of behavioral phenomena in basketball can be substantially useful for the team and the game-play.
Agreements and Disagreements. Core findings from these studies have critical implications on player management, fan engagement, team morale, and strategic marketing. They consider different stakeholders and are concerned with important human factors. An overarching theoretical framework on game psychology is currently not clear, as these works extend different behavioral and cognitive theories to study the effects.
•Both in academia and in industry, people spend efforts studying game statistics, a most straight-forward topic for the general sports audience. People discuss well-established metrics for basketball games (e.g., the four factors; see a classic summary in Kubatko et al. (2007)), study the effects that may influence existing metrics (Sampaio et al., 2010), explore ways to combine basic metrics (e.g., box scores) into advanced statistics, and try to devise new metrics of higher resolution, in most cases with abstract meanings (Franks et al., 2016). Recently, there has been an interest in metrics that characterize players’ defense skills (Franks et al., 2015a,b; Keshri et al., 2019), which so far have been underdeveloped compared to offense metrics. Studies dive deep into the strategy space and try to “quantify the unquantified elements” in sports games, such as shot selection (Skinner, 2012), shot quality (Chang et al., 2014) (in particular at free throws (Wolch et al., 2021)), team strategy (considering the decision network (Fewell et al., 2012) or game possession (Miller and Bornn, 2017)), repetitive patterns in play (Miller et al., 2014; Franks et al., 2015b), ball movements (D’Amour et al., 2015; Ma et al., 2018), as well as abstract elements such as team efficiency (in decision making (Goldman and Rao, 2011) or considering the overall game flow (Moreno and Lozano, 2014; Villa and Lozano, 2018)) and player’s performance (Neiman and Loewenstein, 2011; Sarlis and Tjortjis, 2020) in particular the shooting performance (Zuccolotto et al., 2018, 2021). With these quantitative progress, traditional box scores have advanced companions in the near future.
Agreements and Disagreements. Studies contribute concerted efforts to linking diverse and narrative game elements to straightforward statistics that can be used in ranking players, teams, or games. Different metrics compete in accurately reflecting the game narrative and notably in uncovering its hidden aspects. Metrics maintain a predictive potential, and the development of high-level metrics catalyzes the improvement of team tactics.
•Since sports game-play depends a lot on the interaction between players of the same team and of competing teams, among different lines of sports studies (including and beyond basketball) there is a particular and emerging focus on using graph theory/network science as a core element in analysis (e.g., Onody and de Castro, 2004; Yamamoto and Yokoyama, 2011; Pena and Touchette, 2012; Fewell et al., 2012; Brandt and Brefeld, 2015; Skinner and Guy, 2015; Oh et al., 2015; Ahmadalinezhad et al., 2019). Models based on the PageRank have been widely proposed (Mukherjee, 2012; Hu et al., 2015; Brown, 2017; Zhou et al., 2022), which are used to rank teams, captains (Mukherjee, 2012), or coaches (Hu et al., 2015). This is a sophisticated approach compared with traditional ranking methods based on game results (see a meta-study on comparing game ranking methods: the “ranking of ranking” (Barrow et al., 2013)). A network data envelopment analysis model for basketball games is proposed (Moreno and Lozano, 2014; Li et al., 2021); an adversarial synergy graph model is constructed for game outcome prediction (Liemhetcharat and Luo, 2015); centrality is frequently addressed in performance rankings (Piette et al., 2011; Reed et al., 2018); and finally, the link prediction problem finds interesting applications in sports games (Zhang et al., 2013). In general, network sciences are pinning down a broader context for sports analysis, especially in studying team/player interactions, and basketball emerges as one suitable field of application.
Agreements and Disagreements. Studies using graph theoretical tools build a game network for analysis. The network around basketball games can be constructed in multiple ways. In a game-play network, nodes are players, in one team or both teams, sometimes plus the referees and the ball (as in spatial movement networks); edges can be the ball passing, the defense configuration, the position switching, or other player interactions. In a league network, nodes are teams, and edges can be their play records, team interactions, or player transfers.
•Finally, with the availability of high-resolution optical player tracking data since around 2010s (Terner and Franks, 2021), a growing number of studies are considering using this new big data. Several studies published in engineering journals work on the visualization of sports games based on abundant datasets (Du and Yuan, 2021), trying to design new engineering techniques for tasks such as event detection (Xu et al., 2003; Lee et al., 2018), game narrative (Chen et al., 2016), and play retrieval (Sha et al., 2016). As for modeling and analysis, given the improved granularity of these new data, studies address the spatial dimension of the game and decompose the court into different regions (e.g., Miller et al., 2014; Franks et al., 2015b; Miller and Bornn, 2017; Cervone et al., 2014, 2016b,a; Sandholtz and Bornn, 2018). With the help of big data, more sophisticated models are developed, which try to quantify the latent states of the game, such that one could simulate the play in a finer view (Oh et al., 2015; Sandholtz and Bornn, 2018) and therefore study the performance of players/teams with a closer look (Skinner and Guy, 2015), for example, by partitioning the game court into different performance areas (Zuccolotto et al., 2021, 2023). It is evident that optical data of basketball games serve as a good companion to traditional game statistics, and embody great potential for future research.
Agreements and Disagreements. The utilization of finer data in sports analytics is prominent in quantitative basketball, as the basketball game is sensitive to decision-making at a small time and spatial scale. Granular data can be used in different ways, complementing, overriding, or completely replacing the traditional coarse data. In practice, however, the resolution of data should be commensurate with the model resolution, so that “bigger” data bring greater utilities.
3Dimensions of quantitative professional basketball
The full solution to quantitative basketball is multi-dimensional. A comprehensive modeling of basketball games needs to consider the temporal dimension (the clock), the spatial dimension (the court), both static strategies (line-ups, substitutions, defense matchings) and dynamic strategies (shot choices, team tactics). Game events (shots, turnovers, fouls, substitutions, etc.) derive from outcomes of interactions between those dimensions. Besides these in-game dimensions, two cross-game dimensions, the season (e.g., 82 games plus pre-season and playoffs in NBA) and the league (e.g., 30 franchises from two conferences in NBA), are to be considered in a complete quantitative model space, where individual games are organized into sequences. Most studies focus on one or two of these six dimensions; it is demanding yet useful to consider multiple dimensions of professional basketball games in modeling and analysis.
Quantitative tools borrowed from various fields can help address different dimensions of the game. Time series analysis and spatial decompositions are necessary for untangling the temporal-spatial complexity; game strategies can be formulated as optimization problems, and dynamic strategies could rely on Markov state-space models; the strategy space is also a suitable playground for machine learning techniques, game theories, and network science applications. Further, the season and the league can be viewed as the temporal-spatial coupling on a larger scale, which interacts heavily with the strategy space and calls for aggregate quantitative tools. These six dimensions are explicit to the general audience through game broadcasting; training (Schelling and Torres-Ronda, 2013) and health (Dijkstra et al., 2014) are two off-game dimensions that have a fundamental impact on professional basketball (Figure 2). These two dimensions are intertwined as training and the recovery/maintenance of players’ health depend on each other (Cervone et al., 2016b; Calleja-González et al., 2018). The off-game factors determine that quantitative analysis along the six on-game dimensions embodies great variance. Yet this pity in quantitative analysis is necessary for sports games: games are not appealing to audiences if their outcomes are highly predictable or if game states can be sufficiently simulated, as we may sometimes find in e-sports (Cunningham et al., 2018; Funk et al., 2018).
Fig. 2
Dimensions and granularity levels of quantitative professional basketball.
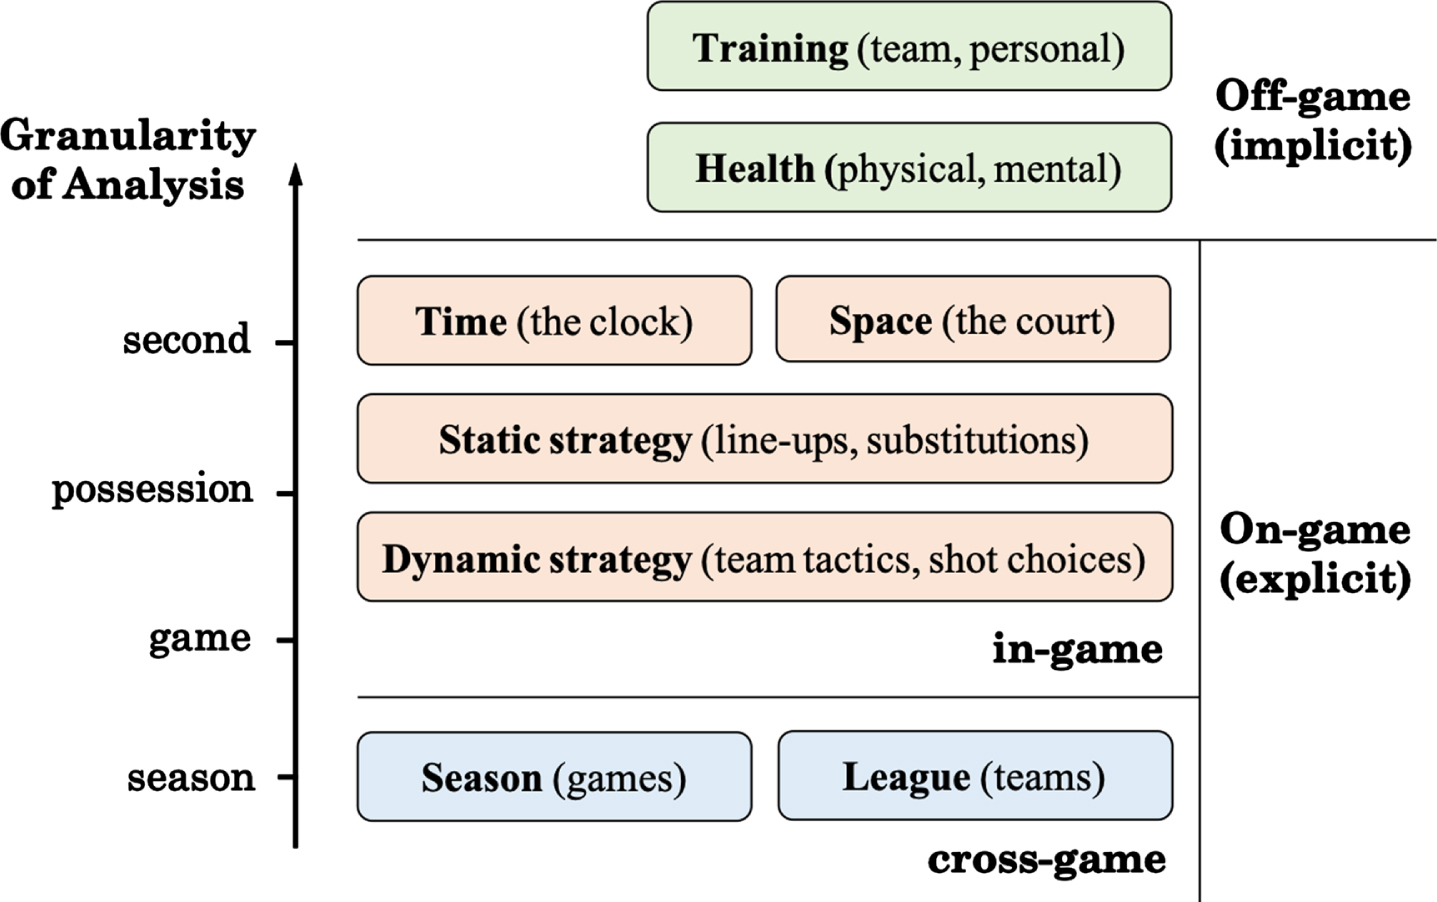
Dimensions of analysis go with the granularity of analysis at quantitative basketball, which essentially depends on the type of data used in the analytics. In general, the granularity of quantitative basketball is cut into four levels (Figure 2). The most granular analysis could be carried out on each second (even millisecond) of the game, e.g., when utilizing the optical tracking data having a sampling rate as high as 25 per second. Studies on this time scale are difficult but can be extremely useful, e.g., for winning decisions in the last minutes, or for learning good real-time defensive strategies (Wang et al., 2018). The second level is ball possession, a natural and effective cut of the continuous game flow; people found it surprising that possession was not an officially tracked statistic in basketball (Kubatko et al., 2007). Analysis targeted at every possession of the ball (or on the same level, every touch of the ball/every game event) become popular in recent years with the availability of optical data. The next level is individual games, and a major body of sports studies rely on the statistical summary of games, e.g., box scores. Analysis on this level is the most straightforward to the industry and the general audience. Finally, we could conduct season-wise or across-season analysis at the highest research granularity. On this level, observers may identify patterns using data across games or seasons, and may study overarching phenomena intrinsic to basketball games (e.g., the hot hand).
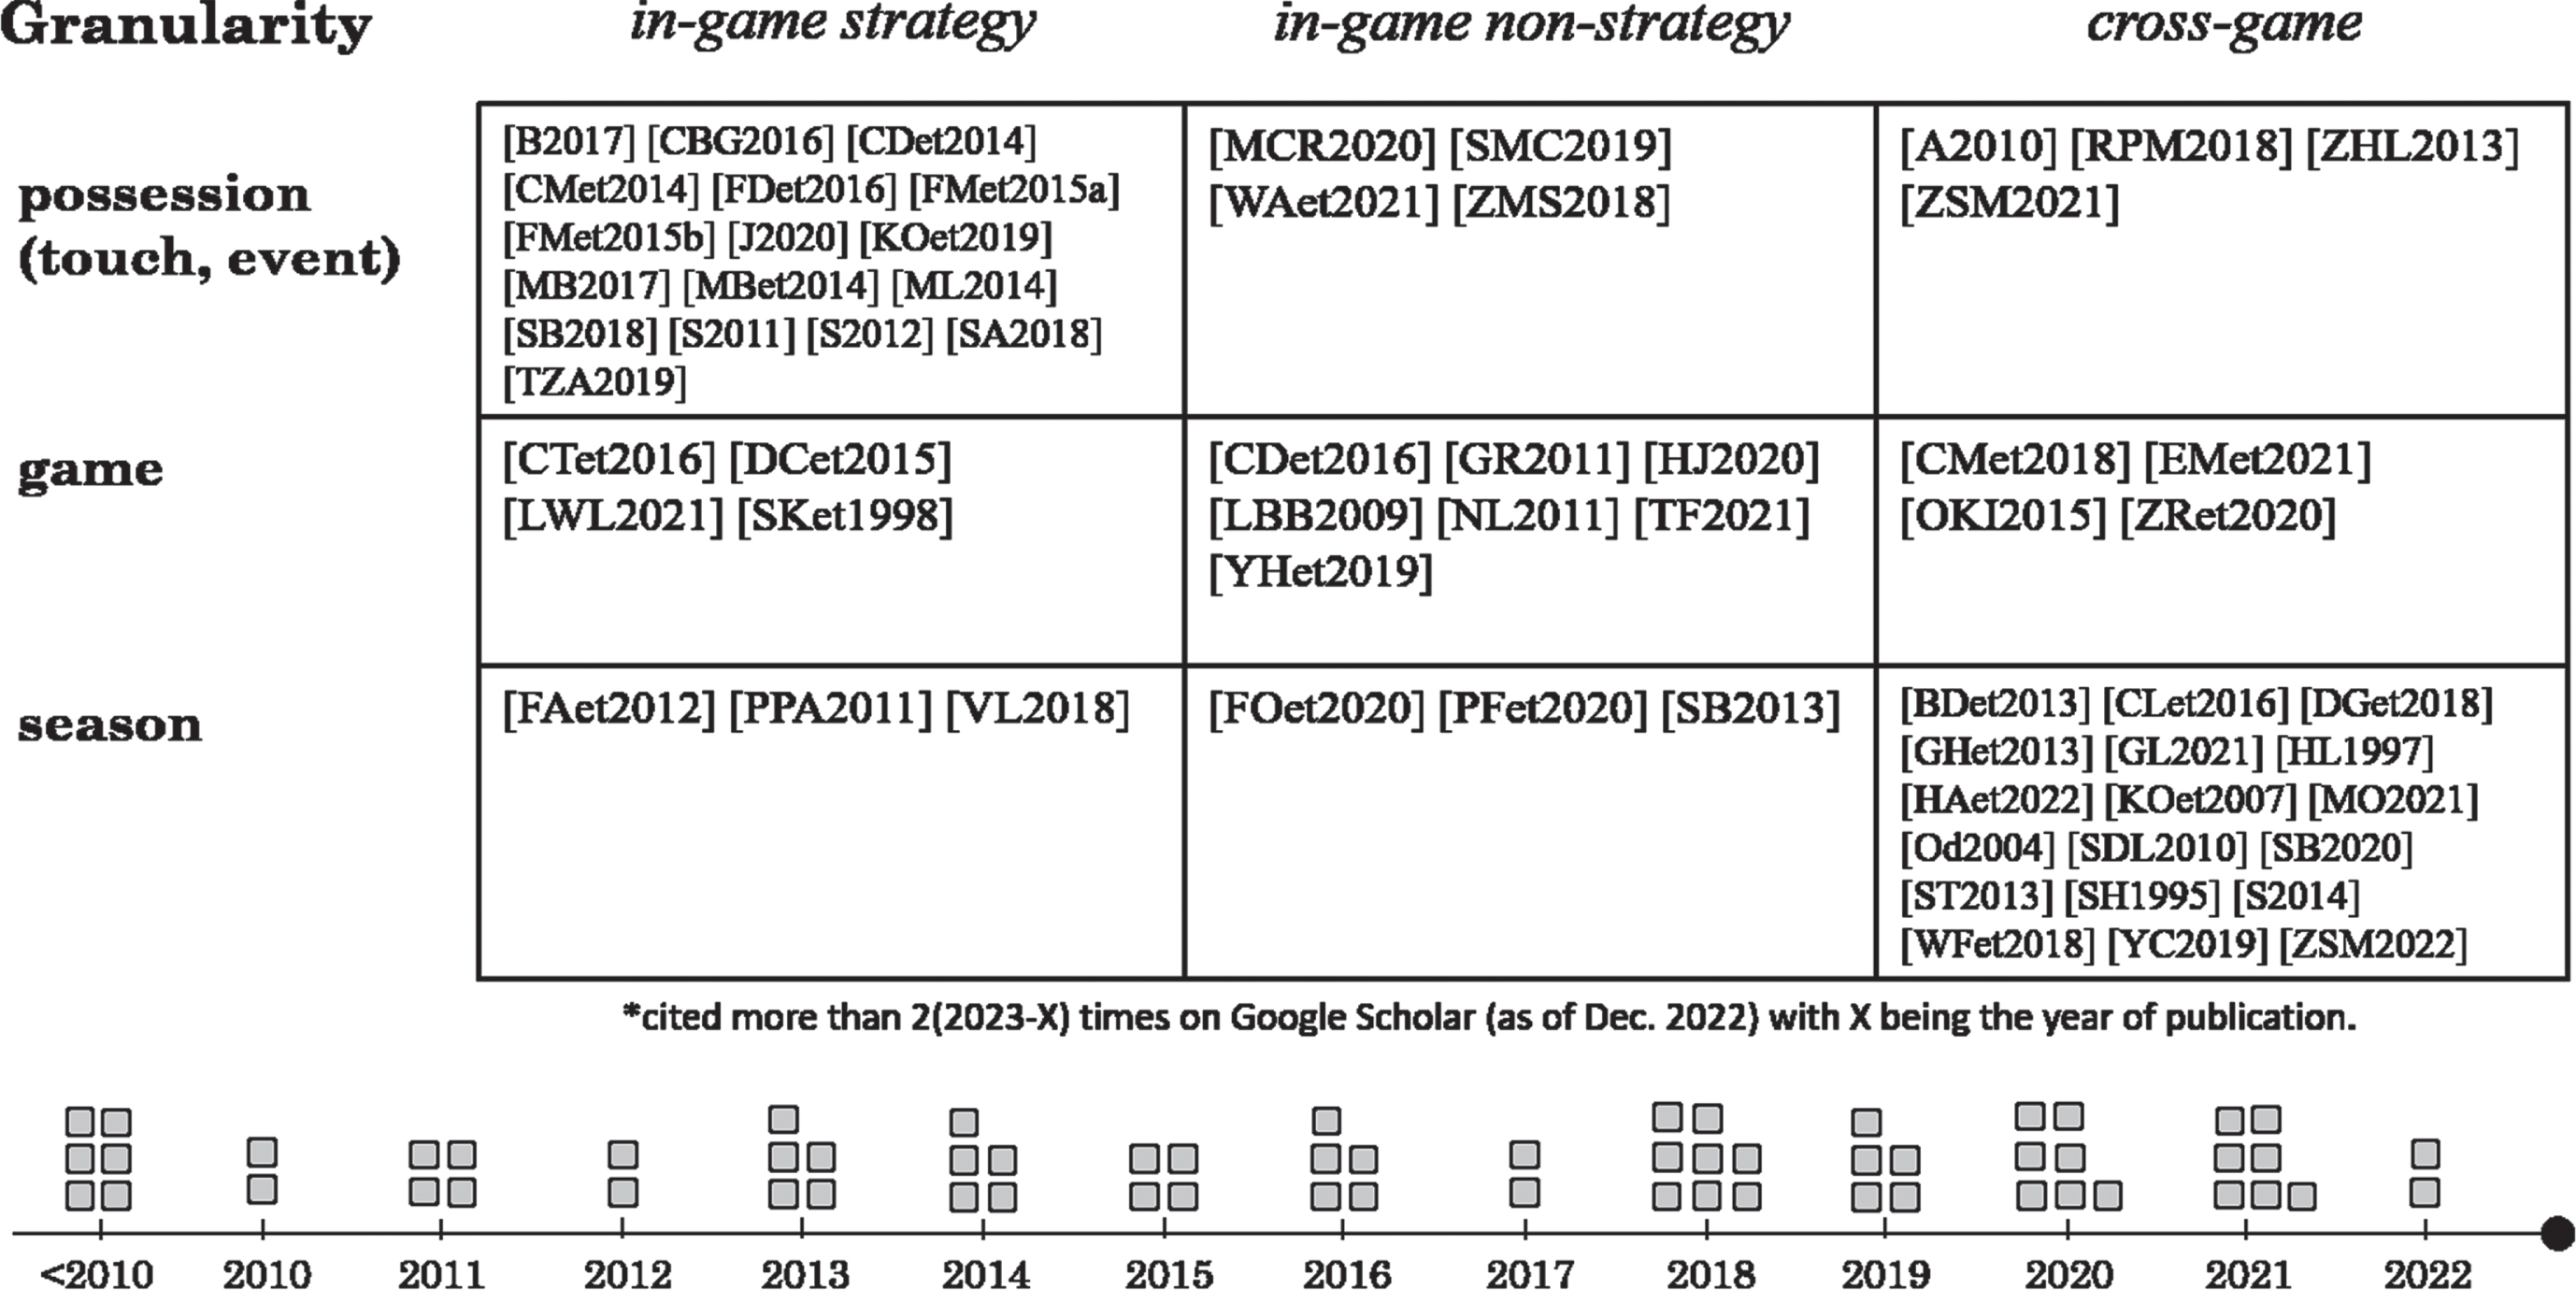
64 well-cited studies from 2010 to 2022 (including 6 before 2010; the year of recent publications are subject to updates) on quantitative basketball (studies cited more than 2 (2023 - X) times on Google Scholar (as of Dec. 2022) with X being the year of publication) are mapped onto the dimensions and granularity levels of analysis (Figure 3). Consider three levels of granularity (possession, game, and season), and three aggregate dimensions (in-game strategy: static or dynamic, in-game non-strategy, and cross-game). Consistently, most studies focusing on in-game strategies conduct analysis at the ball possession level; game-level analysis are sufficient for discussions around individual games but not on game-play strategies; season-level or more general analysis are suitable for addressing cross-game phenomena.
Fig. 3
Mapping existing studies on quantitative professional basketball into dimensions and granularities of analysis. Consider studies cited more than 2 (2023 - X) times on Google Scholar (as of Dec. 2022) with X being the year of publication (updates may apply to recent publications). Indicate the publication with the capital letters of authors (for 1, 2, or 3 authors) or the first two authors and ‘et’ (for more than 3 authors) plus the publication year.
4Tasks at quantitative professional basketball
In sports analysis, questions are asked by multiple parties related to the game –leagues, teams, players, audiences, sponsors, etc.; they concern different aspects of the game and ask questions at various levels. From the perspectives of different parties, we recommend a list of questions on professional basketball, at the league, the team, and the player level, that quantitative analysis could help answer (Table 1). Questions in psychological, physiological (medical), and social domains (e.g., how to encourage players, how to release fatigue after a game, how to build up a good team atmosphere), are excluded from the list; generalizing questions are also excluded (e.g., what is a better way to predict game outcomes), as they concern with multiple levels of analysis and multiple categories of tasks in delivering answers to the complex problem. Some questions (or rather, their potential solutions) are specific to basketball (henceforth S.B. in Table 1); others may apply to other sports. Among the 32 questions, some have been extensively addressed by existing research (Y in Column E.A.; see discussion in Starting Points for Future Analysis), while a non-trivial fraction wait for considerable quantitative efforts. Consistent with the framework (Figure 2), questions in the list concern different granularities of basketball games, and address different dimensions of analysis in professional basketball.
Table 1
List of questions on quantitative professional basketball. S.B.: specific to basketball. E.A.: extensively addressed. See text for the description of Task I to IV
| Ind. | Level | Question | Task | S.B. | E.A. |
| 1 | league, player | Who will be the next superstar? | II | N | |
| 2 | league, team | How could drafts be quantitatively decided? Who should we draft? | III | N | |
| 3 | team, player | Is there a better way to quantify players’ defense skills (Franks et al., 2015a,b)? | I | Y | |
| 4 | team, player | Is there a better way to demonstrate players’ off-ball impact? | I | Y | |
| 5 | team, player | Is there a better way to demonstrate players’ performance stability? | I | N | Y |
| 6 | team, player | Is there a better way to demonstrate players’ adaptability after the transaction? | I | N | |
| 7 | league | Can positions in the traditional sense still well classify players today? | II | Y | |
| 8 | team | What is the best line-up strategy, against different opponents, and who should be guarding whom? | IV | Y | Y |
| 9 | team | What is the right time to make substitutions? | III | N | |
| 10 | team | How to measure and then maximize the economic efficiency of line-ups? | IV | N | |
| 11 | league | Does the league attract less audience in recent years? | II | N | |
| 12 | league, team | How can players’ progress be better visualized, and how to predict the future value of players? | II | N | |
| 13 | team, player | How important is a player relative to the other four players in a line-up? | III | Y | |
| 14 | team, player | How likely must the shot be to go in before players should take it (i.e., optimal stopping) (Skinner, 2012)? | IV | Y | |
| 15 | team | What are repetitive strategies (motifs) in team tactics, and are they effective? (Miller and Bornn, 2017) | II | N | |
| 16 | team | When is ball-movement good and when is it wasteful? i.e., What is the optimal use of the clock? | II | Y | Y |
| 17 | team | What play patterns could lead to specific events (e.g., corner threes) (Franks et al., 2015b)? | II | N | |
| 18 | team | Which areas of the court are more valuable for different teams (Cervone et al., 2016a)? | II | Y | |
| 19 | team, player | How to evaluate players’ counterfactual impact (e.g., how is Lakers without Lebron)? | III | N | |
| 20 | team | Are specific team tactics effective (e.g., Moreyball)? | III | N | |
| 21 | league, team | How to quantify team’s overall (latent/intrinsic, as opposed to exhibited) strength factor? | I | N | |
| 22 | team | How to quantify the team’s interaction intensity in the game (e.g., the fluency of ball movements)? | I | N | |
| 23 | team, player | What is a player’s performance curve as a function of minutes? What are his optimal minutes? | III | N | |
| 24 | team, player | How to accurately visualize the change in players’ shooting ability (in-game or cross-game)? | II | Y | Y |
| 25 | team, player | How to identify and classify players’ shooting habits (e.g., area, speed, dribble, height of shot point)? | II | Y | |
| 26 | league, team | How does (e.g., the frequency/quality of) transactions affect players’ ability and career performance? | II | N | |
| 27 | league, team | How does the background before joining the league matter in players’ career performance? | II | N | |
| 28 | team | What are effective quantitative frameworks for designing new team tactics? | IV | N | |
| 29 | team, player | How to get shot hands properly “heated up” during the initial stage of the game? | IV | Y | |
| 30 | team | When is the right time to call timeouts? | III | Y | |
| 31 | team | How to detect (abnormal) signals from players’ box scores? | II | N | |
| 32 | team | How to signify players’ devotion in the game in real-time? | III | N |
The solution to each question derives from certain quantitative tasks, thus the question can be approached with corresponding analytical instruments. In general, tasks beneath these questions may fall into four categories: (I) metric design, dealing with visualization and quantification of game performance, (II) inference, including detection, classification, regression, and pattern recognition, (III) advisory system engineering, concerning evaluation system, recommendation system, alert system, etc., (IV) strategy design and decision-making, considering optimization problems. The desired properties of the solution differ at each task, depending on the type of quantitative analysis being carried out, the type of data utilized, and the application of analytic outputs.
(I) For metric design, the desired properties of game metrics include discriminativeness, independence, and stability (Franks et al., 2016).
• Discriminativeness: Does the metric reliably differentiate players?
• Independence: Does the metric provide new information?
• Stability: Does the metric measure a quantity that is stable over time?
(II) For quantitative inference, the desired properties of solutions include significance, robustness, and causality.
• Significance: Are detection/classification results significant, with signals well separated from noise?
• Robustness: Does the inference scheme work in different settings and/or on different datasets?
• Causality: Could causal links be established from the results? How to explain the observed patterns?
(III) For the engineering of advisory systems, both in-game (e.g., alert system, response system) and off-game (e.g., recommendation/evaluation system), the merited features include real-timedness, accuracy, and adaptiveness.
• Real-timedness: Could the system continuously track game flow and provide a fast response upon inquiry?
• Accuracy: Are the system’s response and the output game instructions accurate and reliable?
• Adaptiveness: Could the system be used in different settings, accommodating various (noisy) inputs?
(IV) For strategy design and game decision-making, good solutions are expected to highlight novelty, effectiveness, and availability.
• Novelty: Is the strategy new, so that it will take time for others to learn to adopt it?
• Effectiveness: Are certain team tactics effective in games, and under which conditions are they effective?
• Availability: To what extent is a specific team strategy feasible and applicable?
The four quantitative tasks are interdependent. The design of effective game metrics provides quantitative scales for advisory systems and game decision-making; the identification and classification of players, game patterns, and team tactics advance game strategy design. From task I to IV, arguably, the degree of quantitative sophistication increases; solutions of low-level tasks bring insights to the solution of high-level tasks. Due to the complexity of quantitative basketball analysis, several tasks on multiple dimensions of the game often need to be considered at the same time.
5Box score statistics vs. optical tracking data
Box score –structured summaries of outcomes (of diverse types) from a sports competition, tabulating individual players’ or the entire team’s performance –is the most commonly used data in sports analyses. Statistics are often obtained after the game and are straightforward to the audience, rather than employing complex analytical properties. Analysis of box score statistics is thus the starting point in quantitative basketball. For example, using Pearson’s chi-square test and logistic regression, box score was analyzed and results showed that the probability of winning increases significantly from playing back-to-back games to having one day rest in between (Esteves et al., 2021). Conceptually, almost every statistic can be counted as a box score, and more and more such scores have been invented and utilized in analysis. This reflects the dynamic nature of quantitative basketball, where analytics are conducted with more data, and decision-making is performed at increasing granularities.
The availability of optical player tracking data from basketball games provides data scientists with new arsenals to address quantitative questions, some of which are not able to be approached with traditional game statistics. For example, the SportVU framework (Yu and Chung, 2019) provides additional features for data analytics, such as animated court visualization, and employs end-to-end functions to enable in-depth basketball analysis. Typically, the player tracking data records the (x, y) position of each player and the (x, y, z) position of the ball, from which the velocity and acceleration of objects (player or ball) can be calculated. These large continuous datasets are not directly interpretable to the general audience, yet such a granular representation of the basketball game undoubtedly embodies the great potential for professional analysis from experienced data analysts.
Box score statistics and optical tracking data have different pros and cons in usage. Optical data are very useful for in-game analysis, e.g., for the build-up of advisory systems (task III) and in-game strategic decision-making (task IV). Nevertheless, to provide real-time utilities, large datasets require substantial processing efforts which entail large computational costs, and the separation of signal from noise in massive data is a daunting task (Silver, 2012). On the contrary, game statistics are tighter and cleaner, effective for after-game or cross-game analysis, e.g., season- or league-wise analysis. For example, using traditional statistical methods to process season data, it is found that coaches must strictly manage training loads to improve team performance and reduce the risk of injury (Esteves et al., 2021). Game statistics nonetheless help less with in-game analysis and are futile when the question calls for a fast response or sophisticated tactics.
Among the 32 questions in the list, 7 are not in-game, where traditional game statistics can be sufficiently useful; the optical tracking data could be used in answering another 15, some of which are difficult to answer without such high-resolution data; 10 questions can be asked in two ways, both in-game and after/cross-game, whose answer may require two types of data (Table 2). Overall, the availability of optical data provides clear opportunities for the analysis of professional basketball; many questions that traditional game statistics have largely addressed are still under-resolved, and call for improved solutions with the new data. Indeed, the application of novel analytical methods such as machine learning on the new data category, can considerably advance the solutions to open problems such as game prediction (Thabtah et al., 2019).
Table 2
Suitability of using box score statistics and/or optical tracking data in solving questions in Table 1
| Data | Type of Analysis | Question Index |
| Game statistics | after/cross-game | 6. 10-12. 26. 27. 31. |
| Optical data | in-game | 3. 4. 9. 14-18. 22. 23. 25. 28. 29. 30. 32. |
| Game statistics + Optical data | in-game & after/cross-game | 1. 2. 5. 7. 8. 13. 19-21. 24. |
6Starting points for future analysis
Within a short research history, the four tasks in quantitative basketball (metric design, inference, evaluation system, game strategy) have been studied abundantly, through analysis at different levels of granularity, concerning different dimensions of the game.
From the reviewed literature, several questions in Table 1 are extensively addressed in particular: For question (5), graph tools (e.g., PageRank (Brown, 2017)), statistical network models (Piette et al., 2011), and player tracking data (Sampaio et al., 2015) are used to assess players’ performance; studies focus on players’ scoring abilities, which is highly valued in the public. For question (8), Ahmadalinezhad et al. (2019) used network analysis to evaluate team lineup, and Skinner (2011) provided a method for instant strategic planning on the court in a specific situation (underdog). For question (16), Cervone et al. (2014) and Yoon et al. (2019) discussed adopting real-time tracking data, possibly supplemented with deep learning, to conduct granular analysis on ball movements that consider the strategic use of the clock. For question (24), various approaches have been proposed to visualize players’ ball-shooting, including image feature extraction, machine learning (Ji, 2022), or utilizing the Markov process (Sandholtz and Bornn, 2020); on monitoring players’ shooting habits, efficient shooting and scoring strategies can be derived. Other questions are studied to a certain extent in the collected literature, leaving considerable space for quantitative efforts.
Referring to the many questions on quantitative basketball, several ideas emerge from the literature, implying the starting points for future analysis.
(1) One should acknowledge the nature of basketball games. As an important source of entertainment, games, in general, maintain a rock-paper-scissor structure where for each strategy that one player/team could pursue, the other player/team can have a countermeasure that shuts it down (D’Amour et al., 2015). Game strategy is a rich playground for quantitative modelers, which by nature belongs to zero-sum repeated games (Sorin, 2002): the primary challenge for sports teams on offense is to maximize the value of each opportunity when they possess the ball, and equivalently, to minimize that value when their opponent possesses it (Cervone et al., 2014). The strategy space of team sports is larger than that of individual competitions such as chess or Go, where game theories and machine learning techniques directly apply, with results having been fruitful (e.g., Mnih et al., 2015; Ji, 2022). The complexity of team sports derives from player interactions: in basketball, such player interaction networks contribute to the evolutionary narrative of basketball games, where hubs on the network are dynamically changing in offense, as a result of avoiding certain targeted defense (Yamamoto and Yokoyama, 2011), and the game-play centers largely around the ball passing (Maimón et al., 2020). This network representation of basketball games not only preserves an excellent descriptive power but also largely prescribes the direction of game flow. For example, whether a player takes a shot or not depends not only on his propensity to shoot and his defender, but also on the propensity of his teammates (Oh et al., 2015).
(2) On the interaction network, if players are rational decision-makers, when player i passes to player j, it suggests that j is in a more valuable position than i (Cervone et al., 2016a); based on this basic assumption, pass relationships and ball movements can be analyzed in a dynamic setting with continuous data (Yoon et al., 2019). In real games, however, perfect rationality does not exist, and player interactions are more dynamic and unpredictable. This brings the second component of sports games’ entertainment: one should acknowledge that the flow of sports game-play, substantiated with both individual and team decision-making, is always sub-optimal. Many studies investigate the sub-optimality in sports games particularly in basketball. For example, Staw et al. (1995) showed that teams tend to give their best prospect players more playing time and keep them longer, even after accounting for performance, position, injuries, and trade status. Skinner (2010) suggested that it is possible that removing a key player from a team can result in the improvement of the team’s overall offensive efficiency. Neiman and Loewenstein (2011) investigated the outcome sequence of field goal attempts and found that it considerably influences the rate and success percentage of following shot attempts, an extended argument of the hot hand effect. Skinner (2012) showed that NBA teams may be over-reluctant to shoot the ball early in the shot clock. Strumbelj and Vracar (2012) found that teams often deliberately play below their actual strength, especially when the lead is large. Franks et al. (2015a) noted that the defender closest to the shot attempt is frequently not the most responsible defender. Petway et al. (2020) showed that elite athletes run shorter distances, have lower average speeds, and have lower maximum and average heart rates than youth athletes, while high-level players seem to be more efficient when moving around the field. The pervasive existence of sub-optimality in the game-play guarantees the entertainment of sports; this allows designing new tactics for sports to remain fruitful.
(3) The imperfectness of game metrics lies alongside the sub-optimality of games. Sports metrics suffer from multiple sources of variance: player’s intrinsic state, game context (e.g., influence from teammates), and pure chance (Franks et al., 2016). Many metrics currently in use are straightforward combinations of box scores and are not theoretically well-grounded, most of which focus on the offensive side of the game. Substantial quantitative efforts have thus been made in evaluating and designing effective metrics for basketball games (Shea and Baker, 2013). Kubatko et al. (2007) pointed out that the drawback of plus/minus statistics, which are among the most advanced basketball metrics, is that they confound a player’s performance with the performance of his teammates (as well as opponents) on the floor. Chang et al. (2014) noted that one should separate the quality of a shot from the ability to make that shot in effective field goal percentage (EFG); a variant of EFG –EFG+ –is designed accordingly. D’Amour et al. (2015) argued that offensive movements should be judged based on their ability to create open shots, whether or not these shots are taken. Franks et al. (2015b) suggested that an offensive player’s shooting habits should be decomposed into his shot frequency and shot efficiency, and correspondingly, a player’s defense ability could be measured by his ability to reduce the shot frequency and shot efficiency of the opponent. Cervone et al. (2016a) suggested that a player’s off-ball impact on offense could be measured by calculating the value of the space cleared up for his teammate. As one would expect, metric design for professional basketball will remain a hot topic; with the availability of high-resolution datasets, basketball game statistics may witness a great leap in progress.
(4) Along with the increasing adoption of optical datasets in sports analysis, a few methodological insights for the representation of basketball games emerge. Miller et al. (2014) proposed that a parsimonious, yet expressive representation of an NBA player’s shooting habits is desirable; that is, it is useful to design methods for quantitatively describing a basketball player’s shooting propensity succinctly. Cervone et al. (2016b) established that a state-space representation of basketball games should contain two scales: one continuous finer scale to describe ball and player movements, and another event-based coarser scale to effectively compress the game flow. For the task of game pattern recognition, Miller and Bornn (2017) suggests a two-step treatment: (1) the identification of action templates that different players share, and (2) the co-occurrence of actions under each possession of the team. Overall, the representation and visualization of basketball games require enormous collective efforts to reach the next level.
7Virtual basketball: E-games and beyond
A new momentum is silently yet drastically changing the landscape of sports. Not only have we established the novel category of virtual sports adhering to video games, but that physical sports are entering the virtual world in an overwhelming manner (Consalvo et al., 2013). In basketball, the NBA (and NCAA) 2K league has become a celebrated e-sport series (Aldridge, 2018), attracting academic efforts from various research perspectives (e.g., matching problems (Schenk and Reed, 2020), gender stereotypes (Darvin et al., 2021), e-game sponsoring (Lopez et al., 2021), motivation differences for traditional vs. virtual game viewers (Rogers et al., 2022)). With the rapid growth of the video game industry (Shankar and Bayus, 2003; Zackariasson and Wilson, 2012; Marchand and Hennig-Thurau, 2013), e-sports has become an important research target.
This change fundamentally broadens the scope of quantitative analysis on (general, if not professional) basketball. Unlike offline games, online basketball games have perfect data availability that supports in-depth data analysis. For example, a novel system has been proposed to 3D-reconstruct a complete model of basketball players (Zhu et al., 2020) using pose estimation, jump estimation, an identity network that morphs the template mesh into the person, and a skin network that granularizes players’ detailed movements. New questions are to be asked, as the source of entertainment shifts from offline to online, combining the entertainment of basketball games and video games.
One important prospect of virtual reality (VR) (Halarnkar et al., 2012; Miles et al., 2012; Faure et al., 2020) application is at player training (Psotka, 1995). Training is an integral aspect of professional sports (Figure 2), which extends to the broader term of (non-professional) physical exercise (Weyerer and Kupfer, 1994; Scully et al., 1998): results suggest that participation in basketball offers both short-term and long-term physical and psychosocial benefits for children and adolescents (DiFiori et al., 2018); the relationships between external/internal workloads and variables in basketball training are important fields of research (Fox et al., 2020). In this background, VR can be used in virtual teaching or training systems, combined with kinematic modeling and multimedia signal processing (Huang et al., 2019). Similar to flight simulators, game simulators can be adopted in daily training for enhancing targeted skills (Santoso, 2018). Conceivably, as VR technologies get mature, virtual basketball training and teaching will substantially complement offline practice, notably in improving game tactics (Tsai et al., 2020) and decision-making (Pagé et al., 2019).
8Concluding remarks
Quantitative analysis of professional basketball is a thriving field. While existing literature concentrates on a handful of directions that heavily rely on traditional game statistics in analysis, there is a vast research space to be opened with various questions to be answered from data-driven perspectives. The recent availability of high-resolution optical datasets considerably facilitates advanced modeling and analytics, fundamentally amplifying the overall research scope.
Quantitative basketball is nevertheless complex and demanding. Multiple dimensions (time, space, static strategy, dynamic strategy, season, league) need to be addressed during the modeling of basketball games, which attends to four categories of analytical tasks (metric design, inference, evaluation system, game strategy). Big data enables sophisticated modeling, and brings the analysis down to more granular levels, from considering seasons and individual games, to considering ball possessions in each game, and further to considering every second of the game. It is foreseeable that in future analyses, quantitative tools from various engineering fields will be adopted, and more experienced data analysts will join the field. Consequently, professional teams and players who equip themselves with advanced data-centered toolkits that help answer various quantitative questions around basketball games, can pin down an important strategic advantage.
Broadly, enhanced data availability and emerging technologies such as VR, open up venues for analysis on non-professional basketball (related to physical exercise), on virtual basketball (related to video games), and on derivative basketball (related to re-created games). These components augment quantitative basketball and bring enormous opportunities for analytics and research.
Acknowledgements
T.L. sincerely thanks Prof. Anette Hosoi and Prof. Munther Dahleh at the MIT Sports Lab for the guidance at the early stage of this essay and the many happy discussions in the good old days. Both authors thank Jianbo Xiao for the substantial help in data collection and analysis, and thank the two reviewers and the Associate Editor for the careful examination of the paper and the invaluable suggestions that substantially helped improve this work.
References
1 | Ahmadalinezhad, M. , Makrehchi, M. , Seward, N. 2019, Basketball lineup performance prediction using network analysis, In Proceedings of the 2019 IEEE/ACM International Conference on Advances in Social Networks Analysis and Mining (pp. 519–524). |
2 | Aldridge, D. 2018, Not just a game: NBA 2K League quickly becoming a serious business for all, NBA website. |
3 | Arkes, J. (2010) , Revisiting the hot hand theory with free throw data in a multivariate framework, Journal of Quantitative Analysis in Sports, 6: (1). |
4 | Barrow, D. , Drayer, I. , Elliott, P. , Gaut, G. , Osting, B. (2013) , Ranking rankings: an empirical comparison of the predictive power of sports ranking methods, Journal of Quantitative Analysis in Sports, 9: (2), 187–202. |
5 | Brandt, M. , Brefeld, U. 2015, Graph-based Approaches for Analyzing Team Interaction on the Example of Soccer, In MLSA@ PKDD/ECML (pp. 10–17). |
6 | Brown, S. 2017, A PageRank Model for Player Performance Assessment in Basketball, Soccer and Hockey, arXiv:1704.00583. |
7 | Calleja-González, J. , Mielgo-Ayuso, J. , Sampaio, J. , Delextrat, A. , Ostojic, S.M. , Marques-Jiménez, D. , Terrados, N. (2018) , Brief ideas about evidence-based recovery in team sports, Journal of Exercise Rehabilitation, 14: (4), 545. |
8 | Calleja-González, J. , Terrados, N. , Ostojic, S.M. (2016) , Evidence-based post-exercise recovery strategies in basketball, The Physician and sportsmedicine, 44: (1), 74–78. |
9 | Cervone, D. , Bornn, L. , Goldsberry, K. 2016, NBA court realty, In 10th MIT Sloan Sports Analytics Conference. |
10 | Cervone, D. , D’Amour, A. , Bornn, L. , Goldsberry, K. 2014, POINTWISE: Predicting points and valuing decisions in real time with NBA optical tracking data, In Proceedings of the 8th MIT Sloan Sports Analytics Conference, Boston, MA, USA (Vol. 28, p. 3). |
11 | Cervone, D. , D’Amour, A. , Bornn, L. , Goldsberry, K. (2016) , A multiresolution stochastic process model for predicting basketball possession outcomes, Journal of the American Statistical Association, 111: (514), 585–599. |
12 | Chang, Y.H. , Maheswaran, R. , Su, J. , Kwok, S. , Levy, T. , Wexler, A. , Squire, K. 2014, Quantifying shot quality in the NBA, In Proceedings of the 8th Annual MIT Sloan Sports Analytics Conference, MIT, Boston, MA. |
13 | Chen, W. , Lao, T. , Xia, J. , Huang, X. , Zhu, B. , Hu, W. , Guan, H. (2016) , Gameflow: narrative visualization of NBA basketball games, IEEE Transactions on Multimedia, 18: (11), 2247–2256. |
14 | Consalvo, M. , Mitgutsch, K. , Stein, A. 2013, Sports videogames (p. 1), New York: Routledge. |
15 | Cunningham, G.B. , Fairley, S. , Ferkins, L. , Kerwin, S. , Lock, D. , Shaw, S. , Wicker, P. (2018) , eSport: Construct specifications and implications for sport management, Sport Management Review, 21: (1), 1–6. |
16 | Da, Z. , Engelberg, J. , Gao, P. (2011) , In search of attention, The Journal of Finance, 66: (5), 1461–1499. |
17 | D’Amour, A. , Cervone, D. , Bornn, L. , Goldsberry, K. 2015, Move or die: How ball movement creates open shots in the NBA, Boston, MA: MIT Sloan Sports Analytics Conference. |
18 | Darvin, L. , Mumcu, C. , Pegoraro, A. (2021) , When virtual spaces meet the limitations of traditional sport: Gender stereotyping in NBA2K, Computers in Human Behavior, 122: , 106844. |
19 | DiFiori, J.P. , Güllich, A. , Brenner, J.S. , Côt'e, J. , Hainline, B. , Ryan, E. , Malina, R.M. (2018) , The NBA and youth basketball: recommendations for promoting a healthy and positive experience, Sports Medicine, 48: (9), 2053–2065. |
20 | Dijkstra, H.P. , Pollock, N. , Chakraverty, R. , Alonso, J. (2014) , Managing the health of the elite athlete: a new integrated performance health management and coaching model, British Journal of Sports Medicine, 48: (7), 523–531. |
21 | Du, M. , Yuan, X. (2021) , A survey of competitive sports data visualization and visual analysis, Journal of Visualization, 24: (1), 47–67. |
22 | Esteves, P.T. , Mikolajec, K. , Schelling, X. , Sampaio, J. (2021) , Basketball performance is affected by the schedule congestion: NBA back-to-backs under the microscope, European Journal of Sport Science, 21: (1), 26–35. |
23 | Faure, C. , Limballe, A. , Bideau, B. , Kulpa, R. (2020) , Virtual reality to assess and train team ball sports performance: A scoping review, Journal of Sports Sciences, 38: (2), 192–205. |
24 | Fewell, J.H. , Armbruster, D. , Ingraham, J. , Petersen, A. , Waters, J.S. (2012) , Basketball teams as strategic networks, PloS One, 7: (11), e47445. |
25 | Fox, J.L. , O’Grady, C.J. , Scanlan, A.T. (2020) , The relationships between external and internal workloads during basketball training and games, International Journal of Sports Physiology and Performance, 15: (8), 1081–1086. |
26 | Franks, A.M. , D’Amour, A. , Cervone, D. , Bornn, L. (2016) , Meta-analytics: tools for understanding the statistical properties of sports metrics, Journal of Quantitative Analysis in Sports, 12: (4), 151–165. |
27 | Franks, A. , Miller, A. , Bornn, L. , Goldsberry, K. 2015, Counterpoints: Advanced defensive metrics for nba basketball, In 9th Annual MIT Sloan Sports Analytics Conference, Boston, MA. |
28 | Franks, A. , Miller, A. , Bornn, L. , Goldsberry, K. (2015) , Characterizing the spatial structure of defensive skill in professional basketball, The Annals of Applied Statistics, 9: (1), 94–121. |
29 | Funk, D.C. , Pizzo, A.D. , Baker, B.J. (2018) , eSport management: Embracing eSport education and research opportunities, Sport Management Review, 21: (1), 7–13. |
30 | Goldman, M. , Rao, J.M. 2011, Allocative and dynamic efficiency in nba decision making, In Proceedings of the MIT Sloan Sports Analytics Conference (pp. 4–5). |
31 | Gonzalez, A.M. , Hoffman, J.R. , Rogowski, J.P. , Burgos, W. , Manalo, E. , Weise, K. , Stout, J.R. (2013) , Performance changes in NBA basketball players vary in starters vs. nonstarters over a competitive season, The Journal of Strength & Conditioning Research, 27: (3), 611–615. |
32 | Grimshaw, S.D. , Larson, J.S. (2021) , Effect of star power on nba all-star game tv audience, Journal of Sports Economics, 22: (2), 139–163. |
33 | Halarnkar, P. , Shah, S. , Shah, H. , Shah, H. , Shah, A. (2012) , A review on virtual reality, International Journal of Computer Science Issues (IJCSI), 9: (6), 325. |
34 | Hausman, J.A. , Leonard, G.K. (1997) , Superstars in the National Basketball Association: Economic value and policy, Journal of Labor Economics, 15: (4), 586–624. |
35 | Horvat, T. , Job, J. (2020) , The use of machine learning in sport outcome prediction: A review, Wiley Interdisciplinary Reviews: Data Mining and Knowledge Discovery, 10: (5), e1380. |
36 | Hu, Z.H. , Zhou, J.X. , Zhang, M.J. , Zhao, Y. (2015) , Methods for ranking college sports coaches based on data envelopment analysis and PageRank, Expert Systems, 32: (6), 652–673. |
37 | Huang, C. , Zhang, Y. , Zhu, C. , Zhang, C. , Meng, H. 2019, Chinese sports basketball teaching tactics training system combined with multimedia interactive model and virtual reality technology, Multimedia Tools and Applications, 1-15. |
38 | Hulteen, R.M. , Smith, J.J. , Morgan, P.J. , Barnett, L.M. , Hallal, P.C. , Colyvas, K. , Lubans, D.R. (2017) , Global participation in sport and leisure-time physical activities: A systematic review and meta-analysis, Preventive Medicine, 95: , 14–25. |
39 | Huyghe, T. , Alcaraz, P.E. , Calleja-Gonz'alez, J. , Bird, S.P. (2022) , The underpinning factors of NBA game-play performance: A systematic review (2001-2020), The Physician and Sportsmedicine, 50: (2), 94–122. |
40 | Ji, R. (2020) , Research on basketball shooting action based on image feature extraction and machine learning, IEEE Access, 8: , 138743–138751. |
41 | Keshri, S. , Oh, M.H. , Zhang, S. , Iyengar, G. (2019) , Automatic event detection in basketball using HMM with energy based defensive assignment, Journal of Quantitative Analysis in Sports, 15: (2), 141–153. |
42 | Kubatko, J. , Oliver, D. , Pelton, K. , Rosenbaum, D.T. (2007) , A starting point for analyzing basketball statistics, Journal of Quantitative Analysis in Sports, 3: (3). |
43 | Lee, J. , Lee, J. , Moon, S. , Nam, D. , Yoo, W. 2018, Basketball event recognition technique using Deterministic Finite Automata (DFA), In 2018 20th International Conference on Advanced Communication Technology (ICACT) (pp. 675–678), IEEE. |
44 | Leota, J. , Hoffman, D. , Mascaro, L. , Czeisler, M. É. , Nash, K. , Drummond, S. , Facer-Childs, E. 2021, Home is where the hustle is: The influence of crowds on effort and home advantage in the National Basketball Association, available at SSRN 3898283. |
45 | Li, Y. , Wang, L. , Li, F. (2021) , A data-driven prediction approach for sports team performance and its application to National Basketball Association, Omega, 98: , 102123. |
46 | Liemhetcharat, S. , Luo, Y. 2015, Adversarial synergy graph model for predicting game outcomes in human basketball, In Proceedings of the International Workshop on Adaptive and Learning Agents. |
47 | Loeffelholz, B. , Bednar, E. , Bauer, K.W. (2009) , Predicting NBA games using neural networks, Journal of Quantitative Analysis in Sports, 5: (1). |
48 | Lopez, C. , Pizzo, A.D. , Gupta, K. , Kennedy, H. , Funk, D.C. (2021) , Corporate growth strategies in an era of digitalization: A network analysis of the National Basketball Association’s 2K League sponsors, Journal of Business Research, 133: , 208–217. |
49 | Ma, R. , Yan, D. , Peng, H. , Yang, T. , Sha, X. , Zhao, Y. , Liu, L. 2018, Basketball movements recognition using a wrist wearable inertial measurement unit, In 2018 IEEE 1st International Conference on Micro/Nano Sensors for AI, Healthcare, and Robotics (NSENS) (pp. 73–76), IEEE. |
50 | Maimón, A.Q. , Courel-Ibáñez, J. , Ruız, F.J.R. (2020) , The basketball pass: A systematic review, Journal of Human Kinetics, 71: (1), 275–284. |
51 | Manner, H. (2016) , Modeling and forecasting the outcomes of NBA basketball games, Journal of Quantitative Analysis in Sports, 12: (1), 31–41. |
52 | Marchand, A. , Hennig-Thurau, T. (2013) , Value creation in the video game industry: Industry economics, consumer benefits, and research opportunities, Journal of Interactive Marketing, 27: (3), 141–157. |
53 | Mews, S. , Otting, M. 2021, Continuous-time state-space modelling of the hot hand in basketball, AStA Advances in Statistical Analysis, 1–14. |
54 | Miles, H.C. , Pop, S.R. , Watt, S.J. , Lawrence, G.P. , John, N.W. (2012) , A review of virtual environments for training in ball sports, Computers & Graphics, 36: (6), 714–726. |
55 | Miller, A.C. , Bornn, L. 2017, Possession sketches: Mapping nba strategies, In MIT Sloan Sports Analytics Conference. |
56 | Miller, A. , Bornn, L. , Adams, R. , Goldsberry, K. 2014, Factorized point process intensities: A spatial analysis of professional basketball, In International Conference on Machine Learning (pp. 235–243). |
57 | Mnih, V. , Kavukcuoglu, K. , Silver, D. , Rusu, A.A. , Veness, J. , Bellemare, M.G. , Hassabis, D. (2015) , Human-level control through deep reinforcement learning, Nature, 518: (7540), 529–533. |
58 | Moreno, P. , Lozano, S. (2014) , A network DEA assessment of team efficiency in the NBA, Annals of Operations Research, 214: (1), 99–124. |
59 | Mukherjee, S. (2012) , Identifying the greatest team and captain— A complex network approach to cricket matches, Physica A: Statistical Mechanics and Its Applications, 391: (23), 6066–6076. |
60 | Neiman, T. , Loewenstein, Y. (2011) , Reinforcement learning in professional basketball players, Nature Communications, 2: , 569. |
61 | Oh, M.H. , Keshri, S. , Iyengar, G. 2015, Graphical model for baskeball match simulation, In Proceedings of the 2015 MIT Sloan Sports Analytics Conference, Boston, MA, USA (Vol. 2728). |
62 | Onody, R.N. , de Castro, P.A. (2004) , Complex network study of Brazilian soccer players, Physical Review E, 70: (3), 037103. |
63 | Pagé, C. , Bernier, P.M. , Trempe, M. (2019) , Using video simulations and virtual reality to improve decision-making skills in basketball, Journal of Sports Sciences, 37: (21), 2403–2410. |
64 | Pena, J.L. , Touchette, H. 2012, A network theory analysis of football strategies, arXiv:1206.6904. |
65 | Petway, A.J. , Freitas, T.T. , Calleja-Gonzalez, J. , Medina Leal, D. , Alcaraz, P.E. (2020) , Training load and match-play demands in basketball based on competition level: A systematic review, PloS One, 15: (3), e0229212. |
66 | Pierson, P. (2000) , Increasing returns, path dependence, and the study of politics, American Political Science Review, 94: (2), 251–267. |
67 | Piette, J. , Pham, L. , Anand, S. 2011, Evaluating basketball player performance via statistical network modeling, In The 5th MIT Sloan Sports Analytics Conference (pp. 4–5). |
68 | Psotka, J. (1995) , Immersive training systems: Virtual reality and education and training, Instructional Science, 23: (5), 405–431. |
69 | Reed, A. , Piorkowski, J. , McCulloh, I. 2018, Correlating NBA Team Network Centrality Measures with Game Performance, In 2018 IEEE/ACM International Conference on Advances in Social Networks Analysis and Mining (ASONAM) (pp. 1291–1294), IEEE. |
70 | Ribeiro, H.V. , Mukherjee, S. , Zeng, X.H.T. (2016) , The advantage of playing home in NBA: Microscopic, team-specific and evolving features, PloS One, 11: (3), e0152440. |
71 | Rogers, R. , Farquhar, L. , Mummert, J. (2022) , Motivational differences among viewers of traditional sports, Communication & Sport, 10: (2), 175–194. |
72 | Sampaio, J. , Drinkwater, E.J. , Leite, N.M. (2010) , Effects of season period, team quality, and playing time on basketball players’ game-related statistics, European Journal of Sport Science, 10: (2), 141–149. |
73 | Sampaio, J. , McGarry, T. , Calleja-González, J. , Sáiz, S.J. , i del Alcázar, X.S. , Balciunas, M. (2015) , Exploring game performance in the National Basketball Association using player tracking data, PLoS One, 10: (7), e0132894. |
74 | Sandholtz, N. , Bornn, L. 2018, Replaying the NBA, In The 12th Annual MIT Sloan Sports Analytics Conference. |
75 | Sandholtz, N. , Bornn, L. (2020) , Markov decision processes with dynamic transition probabilities: An analysis of shooting strategies in basketball, The Annals of Applied Statistics, 14: (3), 1122–1145. |
76 | Santoso, M. 2018, Markerless augmented reality technology for real-space basketball simulation, 2018 IEEE International Conference on Consumer Electronics (ICCE) (pp. 1–3), IEEE. |
77 | Sarlis, V. , Tjortjis, C. (2020) , Sports analytics— Evaluation of basketball players and team performance, Information Systems, 93: , 101562. |
78 | Schelling, X. , Torres-Ronda, L. (2013) , Conditioning for basketball: Quality and quantity of training, Strength & Conditioning Journal, 35: (6), 89–94. |
79 | Schenk, M.J. , Reed, D.D. (2020) , Experimental evaluation of matching via a commercially available basketball video game, Journal of Applied Behavior Analysis, 53: (1), 209–221. |
80 | Scully, D. , Kremer, J. , Meade, M.M. , Graham, R. , Dudgeon, K. (1998) , Physical exercise and psychological well being: a critical review, British Journal of Sports Medicine, 32: (2), 111–120. |
81 | Sha, L. , Lucey, P. , Yue, Y. , Carr, P. , Rohlf, C. , Matthews, I. 2016, Chalkboarding: A new spatiotemporal query paradigm for sports play retrieval, In Proceedings of the 21st International Conference on Intelligent User Interfaces (pp. 336–347), ACM. |
82 | Shankar, V. , Bayus, B.L. (2003) , Network effects and competition: An empirical analysis of the home video game industry, Strategic Management Journal, 24: (4), 375–384. |
83 | Shea, S.M. , Baker, C.E. 2013, Basketball analytics: Objective and efficient strategies for understanding how teams win, Advanced Metrics. |
84 | Silver, N. (2012) , The signal and the noise: the art and science of prediction, Reaction Kinetics Mechanisms & Catalysis, 112: (2), 511–525. |
85 | Skinner, B. (2010) , The price of anarchy in basketball, Journal of Quantitative Analysis in Sports, 6: (1). |
86 | Skinner, B. (2011) , Scoring strategies for the underdog: A general, quantitative method for determining optimal sports strategies, Journal of Quantitative Analysis in Sports, 7: (4). |
87 | Skinner, B. (2012) , The problem of shot selection in basketball, PloS One, 7: (1), e30776. |
88 | Skinner, B. , Guy, S.J. (2015) , A method for using player tracking data in basketball to learn player skills and predict team performance, PloS One, 10: (9), e0136393. |
89 | Smittick, A.L. , Miner, K.N. , Cunningham, G.B. (2019) , The “I” in team: Coach incivility, coach gender, and team performance in women’s basketball teams, Sport Management Review, 22: (3), 419–433. |
90 | Song, K. , Zou, Q. , Shi, J. 2018, Modelling the scores and performance statistics of NBA basketball games, Communications in Statistics-Simulation and Computation, 1–13. |
91 | Sorin, S. 2002, A first course on zero-sum repeated games (Vol. 37), Springer Science & Business Media. |
92 | Staw, B.M. , Hoang, H. 1995, Sunk costs in the NBA: Why draft order affects playing time and survival in professional basketball, Administrative Science Quarterly, 474–494. |
93 | Stekler, H.O. , Sendor, D. , Verlander, R. (2010) , Issues in sports forecasting, International Journal of Forecasting, 26: (3), 606–621. |
94 | Stone, D.F. , Arkes, J. (2018) , March madness? Underreaction to hot and cold hands in NCAA basketball, Economic Inquiry, 56: (3), 1724–1747. |
95 | Strumbelj, E. (2014) , On determining probability forecasts from betting odds, International Journal of Forecasting, 30: (4), 934–943. |
96 | Strumbelj, E. , Vracar, P. (2012) , Simulating a basketball match with a homogeneous Markov model and forecasting the outcome, International Journal of Forecasting, 28: (2), 532–542. |
97 | Terner, Z. , Franks, A. (2021) , Modeling player and team performance in basketball, Annual Review of Statistics and Its Application, 8: , 1–23. |
98 | Thabtah, F. , Zhang, L. , Abdelhamid, N. (2019) , NBA game result prediction using feature analysis and machine learning, Annals of Data Science, 6: (1), 103–116. |
99 | Toder-Alon, A. , Icekson, T. , Shuv-Ami, A. (2019) , Team identification and sports fandom as predictors of fan aggression: The moderating role of ageing, Sport Management Review, 22: (2), 194–208. |
100 | Tsai, W.L. , Pan, T.Y. , Hu, M.C. 2020, Feasibility study on virtual reality based basketball tactic training, IEEE Transactions on Visualization and Computer Graphics. |
101 | Villa, G. , Lozano, S. (2018) , Dynamic Network DEA approach to basketball games efficiency, Journal of the Operational Research Society, 69: (11), 1738–1750. |
102 | Wang, J. , Fox, I. , Skaza, J. , Linck, N. , Singh, S. , Wiens, J. 2018, The advantage of doubling: a deep reinforcement learning approach to studying the double team in the NBA, arXiv:1803.02940. |
103 | Wangrow, D.B. , Schepker, D.J. , Barker III, V.L. (2018) , Power, performance, and expectations in the dismissal of NBA coaches: A survival analysis study, Sport Management Review, 21: (4), 333–346. |
104 | Weyerer, S. , Kupfer, B. (1994) , Physical exercise and psychological health, Sports Medicine, 17: (2), 108–116. |
105 | Wolch, N.J. , Arthur-Cameselle, J.N. , Keeler, L.A. , Suprak, D.N. (2021) , The effects of a brief mindfulness intervention on basketball free-throw shooting performance under pressure, Journal of Applied Sport Psychology, 33: (5), 510–526. |
106 | Xu, M. , Duan, L.Y. , Xu, C. , Kankanhalli, M. , Tian, Q. 2003, Event detection in basketball video using multiple modalities, In Fourth International Conference on Information, Communications and Signal Processing, 2003, IEEE. |
107 | Yaari, G. , Eisenmann, S. (2011) , The hot (invisible?) hand: can time sequence patterns of success/failure in sports be modeled as repeated random independent trials?, PloS One, 6: (10), e24532. |
108 | Yamamoto, Y. , Yokoyama, K. (2011) , Common and unique network dynamics in football games, PloS One, 6: (12), e29638. |
109 | Yoon, Y. , Hwang, H. , Choi, Y. , Joo, M. , Oh, H. , Park, I. , Hwang, J.H. (2019) , Analyzing basketball movements and pass relationships using realtime object tracking techniques based on deep learning, IEEE Access, 7: , 56564–56576. |
110 | Yu, A. , Chung, S. 2019, Framework for analysis and prediction of NBA basketball plays: On-ball screens, In 2019 IEEE SmartWorld, Ubiquitous Intelligence & Computing, Advanced & Trusted Computing, Scalable Computing & Communications, Cloud & Big Data Computing, Internet of People and Smart City Innovation (Smart-World/SCALCOM/UIC/ATC/CBDCom/IOP/SCI) (pp. 1384–1391), IEEE. |
111 | Yuan, B. , Kamruzzaman, M.M. , Shan, S. 2021, Application of motion sensor based on neural network in basketball technology and physical fitness evaluation system, Wireless Communications and Mobile Computing, 2021. |
112 | Zackariasson, P. , Wilson, T.L. (Eds.)., 2012, The video game industry: Formation, present state, and future, Routledge. |
113 | Zhang, T. , Hu, G. , Liao, Q. 2013, Analysis of offense tactics of basketball games using link prediction, In 2013 IEEE/ACIS 12th International Conference on Computer and Information Science (ICIS) (pp. 207–212), IEEE. |
114 | Zhou, Y. , Wang, R. , Zhang, Y.C. , Zeng, A. , Medo, M. (2022) , Improving PageRank using sports results modeling, Knowledge-Based Systems, 241: , 108168. |
115 | Zhu, L. , Rematas, K. , Curless, B. , Seitz, S.M. , Kemelmacher-Shlizerman, I. 2020, August, Reconstructing nba players, In European Conference on Computer Vision (pp. 177–194), Springer, Cham. |
116 | Zuccolotto, P. , Manisera, M. , Sandri, M. (2018) , Big data analytics for modeling scoring probability in basketball: The effect of shooting under high-pressure conditions, International Journal of Sports Science & Coaching, 13: (4), 569–589. |
117 | Zuccolotto, P. , Sandri, M. , Manisera, M. (2021) , Spatial performance indicators and graphs in basketball, Social Indicators Research, 156: , 725–738. |
118 | Zuccolotto, P. , Sandri, M. , Manisera, M. 2023, Spatial performance analysis in basketball with CART, random forest and extremely randomized trees, Annals of Operations Research, 1–25. |

