
Community structure of the football transfer market network: the case of Italian Serie A
Abstract
The men’s football transfer market represents a complex phenomenon requiring suitable methods for an in-depth study. Network Analysis may be employed to measure the key elements of the transfer market through network indicators, such as degree centrality, hub and authority scores, and betweenness centrality. Furthermore, community detection methods can be proposed to unveil unobservable patterns of the football market, even considering auxiliary variables such as the type of transfer, the age or the role of the player, and the agents involved in the transfer flow. These methodologies are applied to the flows of player transfers generated by the 20 teams of the Italian first division (Serie A). These flows include teams from all over the world. We consider the summer market session of 2019, at the beginning of the season 2019-2020. Results also help to better understand some peculiarities of the Italian football transfer market in terms of the different approaches of the elite teams. Network indices show the presence of different market strategies, highlighting the role of mid-level teams such as Atalanta, Genoa, and Sassuolo. The network reveals a core-periphery structure splitted into several communities. The Infomap algorithm identifies 14 single team-based communities and three communities formed by two teams. Two of the latter are composed of a top team and a mid-level team, suggesting the presence of collaboration and similar market behavior, while the third is guided by two teams promoted by the second division (Serie B).
1Introduction
Within the business revolving around men’s football, the transfer market is a specific process in which players are transferred from one club to another club based on the needs of the latter club. These movements, which can also involve negotiations by Sporting Directors and the evaluations of coaches (Parnell, Bond, Widdop, Groom & Cockayne 2021), are usually driven by game strategies with the goal of increasing team performance, financial income, and brand equity (Matesanz et al., 2018). Transfers of players can also play a key role in guaranteeing the financial achievement of football teams (Sæbø & Hvattum, 2019). Therefore, there is a great flow of football players during the transferring window that typically occurs twice in the European markets (Nolasco, 2019). Although this large flow of players occurs across several countries, patterns in each market can be different. The movements are also involved in a complex phenomenon including links between countries or through football leagues that may be influenced by cultural, sociological (McGovern, 2002; Poli, 2010b), and historical reasons (Taylor, 2006). As a consequence of the increasing availability of player attributes (Wakelam et al., 2022), in recent years Network Analysis methods have been proposed to analyze transfer flows (Batagelj et al., 2014; Matesanz et al., 2018).
At a network level, differences arise between countries and football leagues. For example, in the so-called “big five” (England, Germany, Italy, Spain, and France), the movements of players associated with higher costs are more than common. As an example, considering the 4.38 billion euros spent by European top-league clubs in 2015, 81% were from England, Germany, Italy, and Spain (Sefton, 2015). An opposite example is represented by Portugal, which can be considered as an outside country from the big five. The Portugal football market presents a great migration of players in which the strategy is to buy foreign players inexpensively and sell them at higher prices (Nolasco, 2019). Recently, the Union of European Football Association (UEFA) has tried to regulate the market using financial rules, eventually constraining the trade-off between sporting and financial results. In Italy, it was found that Financial Fair Play (FFP) does not improve the average efficiency of the team, although FFP contributed to leveling the playing field, reducing the gap in terms of efficiency between top- and lower-tier teams (Ghio et al., 2019). To compensate for the introduction of financial rules, new patterns of interactions in the transfer market can arise between clubs. These patterns can be analyzed by considering Network Analysis, which helps to identify properties of interactions and classify them based on the relationships within a complex system. In a recent work (Liu et al., 2016), a set of network measures have been proposed to study a sample of 400 clubs in 24 worldwide, top-class leagues from 2011 to 2015. The main finding of the study was that clubs acting as hubs or brokers (central positions) usually achieved better match-related performance in the competitions.
Indeed, considering the transfer market as a community, another contribution found that this phenomenon becomes a small-world structure in which clubs without direct ties can easily engage with each other within a few steps (Matesanz et al., 2018). Thus, it is expectable that cohesive groups and clusters emerge from the interactions in the transfer market (Matesanz et al., 2018). Therefore, interdependency can occur more often than expected, as observed in another study considering the leagues of the big five (Bond et al., 2018; Xu, 2021). In the particular case of the Italian league (Serie A), the loan of players between clubs is a well-established strategy (more than in other markets) that increases the formation of communities and inter-dependencies between teams (Bond et al., 2018, 2020).
In addition, the Serie A case presents some peculiarities. First of all, it has been demonstrated that the financial sustainability of Italian teams is strongly related to player trading with a systematic recourse to capital gains and, in general, creative accounting practices (Baroncelli & Lago 2006; Neri et al., 2021), with a historical background of fraudulent behavior (Carmichael et al., 2017). In this context, the agents play an important role in the Italian transfer market, even from a quantitative point of view (Poli & Rossi 2012), negotiating contracts (and associated wages) for professional footballers1. Indeed, in recent years, the gains of agents are increasing due to the modern bargaining power of elite footballers (Bernardo et al., 2021). Influential agents may become key figures also in determining transfer rights (Poli & Rossi, 2012). The type of relationship between teams and agents (or agencies) could determine the success of a team both in the composition of the roster (usually composed of 25 players) and in pursuing the desired football outcome (i.e. winning a national league or national and international cups). Furthermore, an agent (or an agency) can propose specific players to clubs with which he has commercial relationships based on the clubs’ market needs (demand).
Starting from these considerations, it seems important to detect how communities emerge from the football transfer market and if it is possible to identify recurrent patterns. Thus, the aim of this study is twofold: first of all, meaningful network summary measures are used to map all the possible relationships arising from the Serie A players’ market, even considering auxiliary variables such as the age and the role of players, and the type of transfers. Secondly, a suitable community detection method (Rosvall & Bergstrom, 2008) is proposed for unveiling the structures of first-division teams’ relationships with their commercial partners both in Italian leagues and abroad.
The main innovative contribution of the paper can be essentially summarized in two aspects: firstly, to the best of our knowledge, community detection methods have never been applied to football transfer networks. In this sense, a primer proposal can be found in an unpublished work (Félix et al. 2019). In addition, although the relationships between football agents and players’ transfer networks have been theoretically explored (Poli 2010a; Rossi et al., 2016), there is a lack of empirical applications in the current literature.
To pursue the aim of the paper, we use the network of players’ flows generated by the 20 teams of the Italian first division (Serie A), involving teams from all over the world. We consider the summer market session of 2019, at the beginning of the season 2019-2020. The choice of this case study (Yin, 1994) allows us to make a more “in-depth” analysis since all the recorded transfers take place within the same system, regulated by the same market laws, in almost one of the two possible directions (ingoing and outgoing).
The rest of the paper is organized as follows: the second section regards the Network Analysis and players’ transfer market. Then, the methodology is introduced in Section 3 and is divided into network summary measures and community detection methods. The Serie A summer market session of 2019 and the results of Network Analysis, followed by a discussion of the main findings, are described in Section 4. Finally, in Section 5 are provided some concluding remarks.
2Network analysis and players’ transfer market
In real-world data, the interactions between a set of units can be described through relational data. These types of data can usually be modeled through Network Analysis. One of the main objectives of Network Analysis is to underline the features driven by the connections occurring between units.
Observed networks can be modeled in terms of graph theory. In this framework, a network G is defined as the ordered triple
In our case, the nodes (vertices) represent the n football teams linked by a directed relationship. In the conventional market, the edge eij is generated by the transfer of a player from vi, the selling club, to vj, the buying club.
The generic element of adjacency matrix aij accounts for the number of transfers between teams i and j during the market session, expressing the strength of their connection. The relationship previously described can be graphically summarized through Fig. 1, representing an example of transfers between two teams.
Fig. 1
Example of the market relationship between two teams (commercial partners). Teams vi and vj had mutual transfers, in particular vi transferred ωij players to vj and, vice versa, vj transferred ωji players to vi.
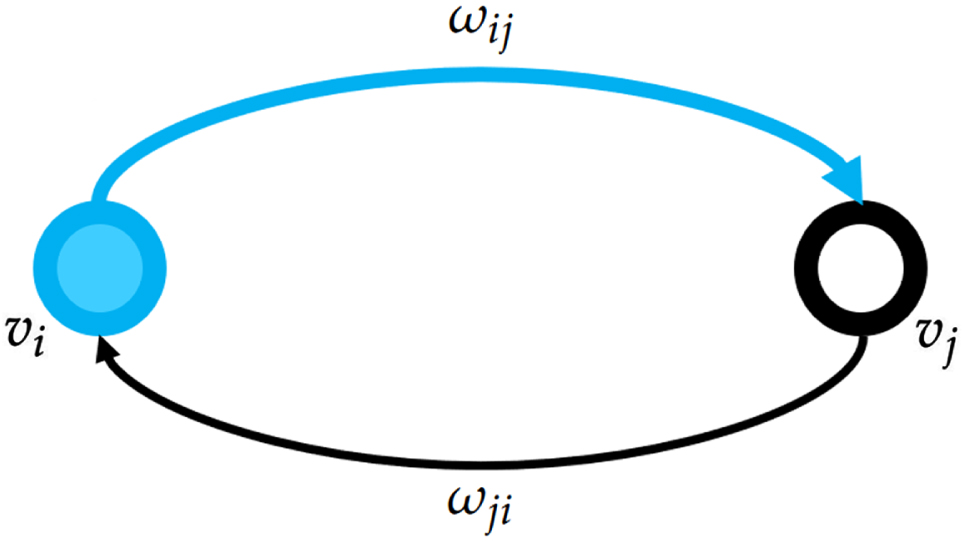
We remark that the values on the main diagonal of A are null because we assume that a team cannot trade a player to himself (this type of connection is usually denoted as a “loop”).
Data Data for the application comes from the 2019 Italian men’s football transfer market session of season 2019-2020, which started on July 1st and ended on September 2nd (the summer transfer window). In particular, the data refer to the 20 Italian Serie A teams and have been gathered from the Transfermarkt2 data page. Some attributes regarding the transactions (link-related) and the involved teams (node-related) can be considered. The following attributes are available at a node-level:
• The selling club name (node from)
• The buying club name (node to)
• Country (and Geographical Area) of selling/loaning out club
• Country (and Geographical Area) of buying/taking on loan club
To recover the market network for each transfer operation (the link), the selling (node from) and buying (node to) team names have been collected. To summarize, for each transfer the following attributes are considered:
[Age:] the age of the transferred player in years
[Height:] the height of the transferred player in meters
[Nationality:] the main citizenship of the transferred player
[Position:] player position on the pitch (Goalkeeper, Defender, Midfielder, Forward)
[Market Value:] the market value defined by the Transfermarkt website
[Type of transfer:] Regular Transfer, Loan, Return from Loan
[Agent:] the transferred players’ agent (or the company)
Undoubtedly, the type of transfer represents a key feature of these data. In our case, a link between two teams is completed either in case of a regular transfer (acquisition) or a loan, regardless of the contractual specifications. For instance, in the case of a loan with a redemption right (buy-back clause), when the loan expires two mutual links are created: the first is generated when the player comes back to the lender team, and the second when he is definitely sold to the borrower team.
3Methodology
Network Analysis is suited to efficiently depict the natural relational structure of complex systems, providing different tools to deeply analyze them at different levels (Clemente et al., 2016): node-based (micro-level), module-based (meso-level) and aggregate structural-based (macro-level). In football, these kinds of measures are mainly used to analyze the passing distribution of players retrieving such variables suitable to model the match outcome (Grund, 2012; Ievoli et al., 2021). In a player-based perspective, team cohesion contributes to the improvement of players’ performances and, consequently, their market value (“A football player improves his individual rating in a stronger team”, Molodchik et al., 2021). Here, to fulfill the aforementioned aim of the paper, we focus on micro- and meso-level measures.
For what concerns the micro-level, there are several properties of the nodes that can be detected. One of them is the important concept of centrality. The most popular measure - which has a noteworthy meaning in our context - is given by the degree centrality. It helps us to understand the main market strategy of a team by considering the number of its partners and traded players (sales or purchases).
At the meso-level, given the overall market structure and the flow of the market operations, the main objective is to extract interesting patterns of teams that have intensive business relationships. These clusters of teams can reveal important mechanisms of the Italian Serie A transfers. To this aim, we employ an algorithm of community detection that, together with the topological structure of relationships, gives relevance to the market flow.
3.1Network summary measures
Despite the wide availability of network summary measures, recent works regarding the football market are mainly focused on the following indicators: degree centrality (Li et al., 2019; Lee et al., 2015), betweenness centrality (Bond et al., 2018), H index and diameter (Lombardi et al., 2020), global clustering coefficient and triad census (Bond et al., 2020). Descriptive measures are also used to identify the action of teams to recruit players all over the world (Velema, 2021).
We focus on a restricted number of indices particularly suitable to capture the relations of each team node and have a meaningful interpretation, especially in the football market perspective (Wasserman & Faust, 1994).
Degree centrality We first consider an unweighted and undirected network having a binary and symmetrical matrix E of links. In this case, degree centrality of a node vi is defined as the number of its adjacent neighbors:
Weighted degree centrality Moving to a weighted directed case, the resulting network can be expressed by using the (not binary and not necessarily symmetrical) adjacency matrix A. Then, the weighted degree centrality is introduced as:
In this case,
Degree centrality ratio While the degree index accounts for the number of team-level relationships for a team, and its weighted version emphasizes the number of movements, further information is given by the ratio between the weighted degree centrality and the degree centrality. Moreover, we are also interested in highlighting the (ingoing and outgoing) average number of player transfers per team. To pursue this aim, a measure named the degree centrality ratio is proposed and can be computed by the following expressions:
Hub and Authority score Hub and Authority scores are calculated as the dominant eigenvectors, respectively, of the AA′ and A′A matrices (Kleinberg et al., 2011). High values of the Hub score indicate a team with a high propensity to sell players; this result is possibly due to economic reasons or to a transfer strategy centered on loaning several young players. On the other hand, a high Authority score defines a team that purchased several players during the market session: they are either attractive teams or trying to buy several players to gain capital.
Betweenness centrality While the previous measures are considered for each Serie A team inside the entire market network, the betweenness centrality is calculated to highlight the most influential player agents. We consider the undirected averaged betweenness centrality of the player agents contained in each community. According to this measure, a node is central if it is located in the largest number of geodesic distances (shorter paths) connecting each pair of not-adjacent nodes. For each node, it is defined in the following way:
(1)
3.2Community Detection
Although the previously introduced indices are very informative at a descriptive micro-level, the relational flows between nodes (teams) induce the formation of subgraphs in the network, which are modules (clusters) that need to be investigated. To this end, there are several methods to identify clusters/groups of nodes that are internally densely connected and sparsely linked to each other.
Existing clustering techniques can be included in two general methodologies: blockmodelling (Doreian et al., 2004; Ziberna, 2007) and community detection (Newman, 2018; Fortunato, 2010). While the former focuses on the equivalence between nodes based on their connections, the algorithms related to the latter make use of the nodes’ relations inside the network to detect relevant patterns of the nodes.
In our case, the Serie A football market transfer is described by a network that is characterized, as aforementioned, by:
• directed and weighted links between teams;
• flow of market operations.
Infomap takes advantage of the parallelism between Huffman binary coding and Shannon’s source coding theorem (Shannon, 1948; Huffman, 1952), with the aim of codifying the network in terms of a cartographic map, as introduced in Guimera & Amaral (2005).
Considering a random walker X, then its n states, occurring with frequencies pi, with i = 1, …, n, are described by binary codewords obtained by using the Huffman exit code on two levels. This code defines a map (also called a codebook) where the communities (groups) are uniquely determined, while the same coding can be used for the nodes belonging to different clusters. It is possible to prove that the average length of the codewords can be no less than the entropy of the random walker (see Shannon, 1948, and references therein), defined as
(2)
For each step the random walker X takes, the expected description length of the partition, L (M), is computed as a weighted average of the entropy of the movement between modules and the entropy of movements within modules, as follows
(3)
4Results
4.1Serie A market descriptive analysis
In Serie A, the overall total market value is over 3.7 billion euros, while the average player market value is 3.1 million (median equal to 0.5 million). The total number of nodes (teams) involved in the transactions is equal to |V|=319, where two further “synthetic nodes” are included: the node of free agents (without a contract) and the node of retired players (at the end of their career). Italian teams represent 44.2% (141) of the nodes including the 20 Serie A teams. These teams also exchange players with foreign clubs, in particular with European teams (in Spain, England, and France), South America (mainly Argentina and Brazil), and rarely with Asian and North American teams. The total number of movements (links) is equal to |E|=1205. Among these links, 299 (24.8%) are outright transfers, 274 (22.7%) are loans and 465 (38.6%) are returns from loans. Five movements regard retired players while 29 concern free players.
The average age of transferred players is 23.5 (sd=3.9, median equal to 22), while the average height is 1.83 meters (sd=0.06). As expected, more than half of the overall movements (691) include players having Italian citizenship while, considering other citizenships, 43 (3.6%) are Brazilian, 35 (2.9%) are Croatian and 34 (2.8%) are Argentinian. Most of the movements (76%) include an agent (or agency of agents), while this information is not available for 21% of the links. Only 3% of the movements are carried out without an agent. For what concerns players’ roles, 120 market movements involve goalkeepers (10%), 400 (33.2%) regard central defenders and left/right backs, 326 (27.1%) are midfielders, 152 (12.6%) are players behind-forwards and wingers. Finally, 207 (17.2%) movements regard forwards.
To summarize, the market relationships between teams, Fig. 2 shows the national (Panel a) and the international (Panel b) network of movements of the 20 Serie A teams. Considering the “domestic” transfers, focusing on the two main professional Italian divisions (i.e. Serie A and Serie B), some comments arise:
• Firstly, the network exhibits a core-periphery structure, where teams of the first division (depicted by the blue triangles) interchange players between them, presenting more “exclusive” relationships with teams of the second division (Serie B, illustrated by the orange circles).
• There is a strong relationship between Genoa and Inter (inbound movements) and Genoa and Juventus (in both directions).
• Northern teams of Atalanta and Sassuolo are able to exchange players with stronger Serie A teams, (e.g. Juventus, Milan, Inter) as well as other “intermediate teams”, such as Genoa, Verona, and Fiorentina. More importantly, Atalanta and Sassuolo show a strong and almost privileged bond with some Serie B teams, such as Spezia, Pescara, Empoli, Pisa and Crotone.
• Lazio, a team of the city of Rome, carries out most of the inbound and outbound movements with the Serie B team of Salernitana, mainly because they share the same property.
• The northern team of Brescia seems the least capable (between Serie A teams) of building market relationships with Italian teams of the first two divisions.
Fig. 2
Network of domestic transfers between Italian Serie A and Serie B teams (panel a) and international transfers obtained by aggregating teams by their nation or geographical area (panel b), excluding retired and free players. Serie A teams are the triangular-shaped nodes while the tie transparency is proportional to the number of transfers (weights ωij).
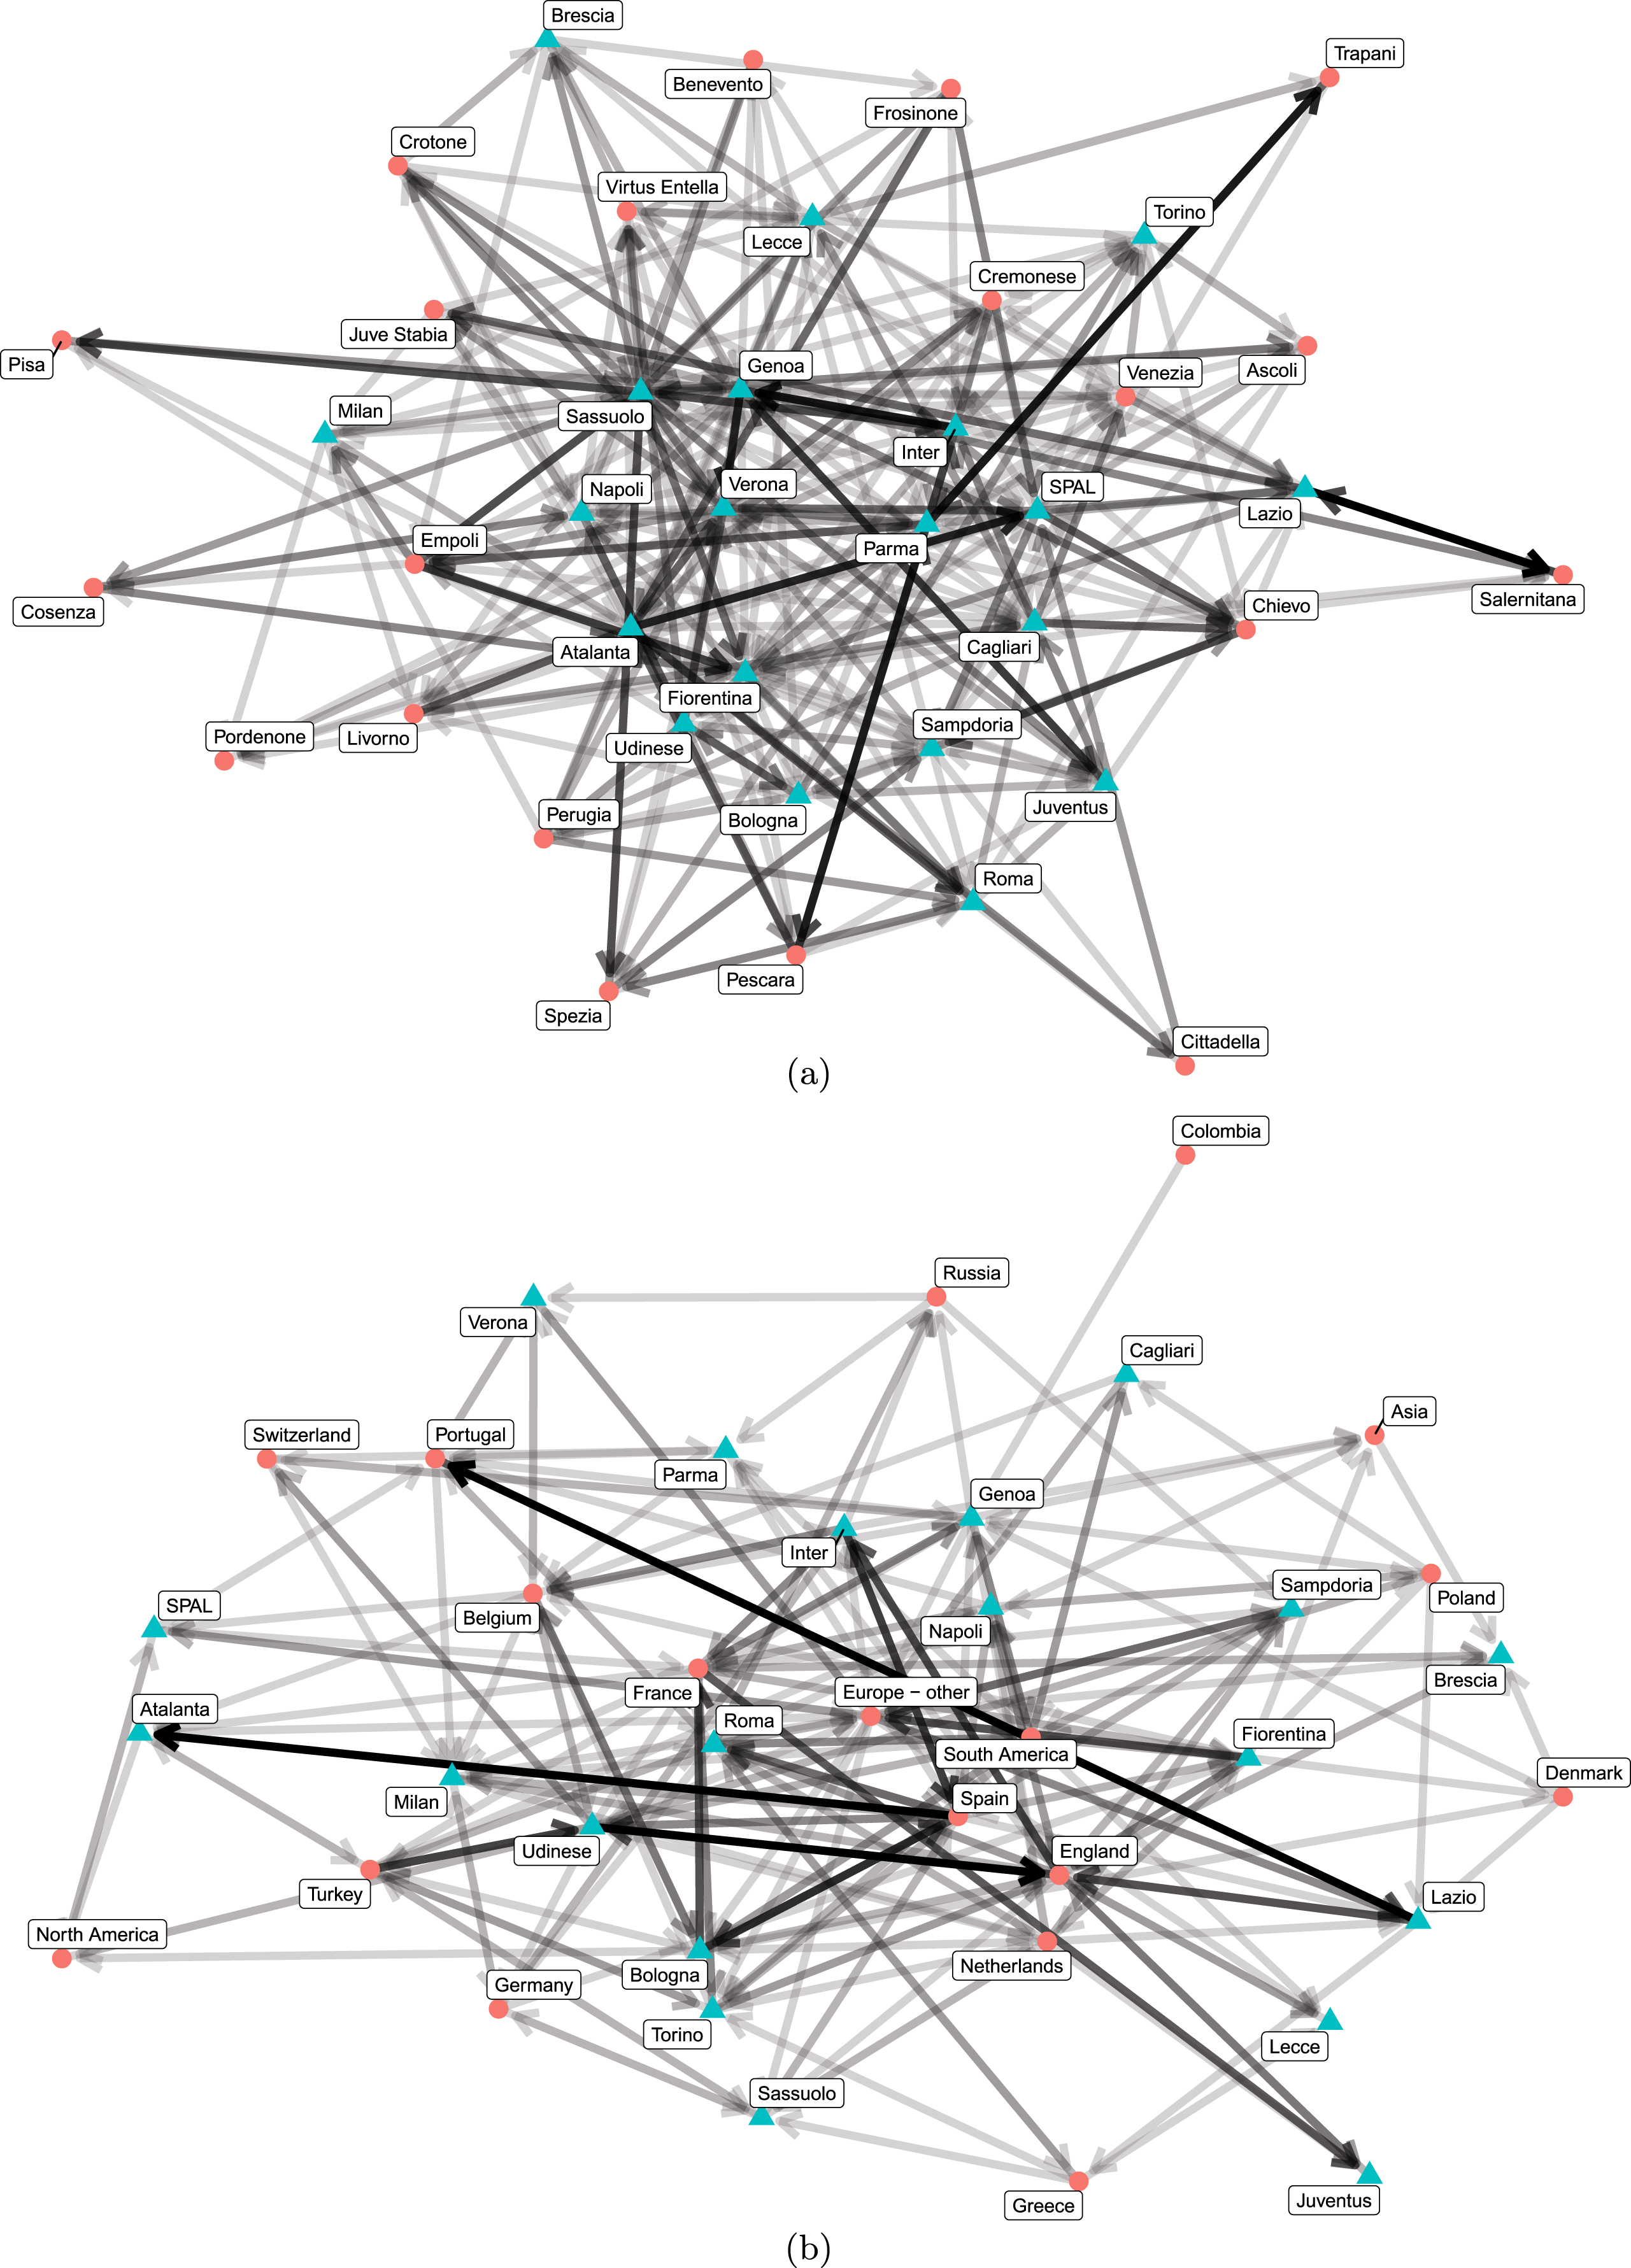
The network of international transfers, illustrated in Fig. 2(Panel b), is obtained by aggregating the foreign teams by their nation or geographical area:
• The core-periphery structure of the Serie A teams is less evident, showing that the Serie A team transfer market is polarised in the European market, with the exception of some South American countries (i.e. Argentina, Brazil, Colombia, and Uruguay).
• Some historical and most competitive teams (i.e. Inter and Roma) seem to play a key role in the international market, in fact, they are placed in a central position in the network. On the contrary, the Udinese team presents a privileged relationship with England, but it is worth remarking that these movements are carried out with Watford, an English team sharing the same property as Udinese.
• Newly promoted teams such as Lecce and Brescia show a limited number of relationships with abroad teams.
4.2Serie A market network results
In this section, we include the results of network summary measures, illustrated in the Methodology part. In Table 1, the descriptive statistics of the 20 Serie A teams are depicted for the three considered indicators (degree centrality, weighted degree centrality, and degree ratio), also divided into indegree and outdegree types. The considered indicators show a substantial balance between inbound and outbound movements. On average, each Serie A team presents 54 commercial relationships (median equal to 56), going from a minimum of 27 (Brescia) to a maximum of 83 (Atalanta). For what concerns the CDout, Genoa is the team presenting the maximum value (41 relationships) among other teams. The average of players exchanged per team is equal to 69 (median equal to 63.5), ranging from a minimum of 29 (Brescia) to a maximum of 121 (Atalanta).
Table 1
Descriptive statistics of the network summary measures.
| Mean | Median | S.D. | Min | Max | IQR | CV | ||
| CD | tot | 53.65 | 56.00 | 15.91 | 27 | 83 | 22.00 | 0.296 |
| in | 27.70 | 27.50 | 8.12 | 13 | 44 | 8.50 | 0.293 | |
| out | 25.95 | 26.50 | 8.12 | 14 | 41 | 11.00 | 0.313 | |
|
| tot | 68.90 | 63.50 | 23.83 | 29 | 121 | 24.50 | 0.346 |
| in | 35.45 | 33.50 | 11.71 | 14 | 61 | 13.50 | 0.330 | |
| out | 33.45 | 31.00 | 12.35 | 15 | 60 | 11.25 | 0.369 | |
|
| tot | 1.27 | 1.26 | 0.12 | 1.07 | 1.51 | 0.15 | 0.098 |
| in | 1.27 | 1.28 | 0.11 | 1.08 | 1.48 | 0.15 | 0.090 | |
| out | 1.28 | 1.26 | 0.18 | 1.03 | 1.75 | 0.14 | 0.138 |
The ratio between weighted and unweighted degrees is practically the same (on average) for both inbound and outbound movements, going from a minimum of 1.07 (Brescia) to a maximum of 1.51 (Lazio), presenting a slightly greater variability for the
Figure 3 compares the individual levels of the 20 Serie A teams in terms of Degree Centrality (panel a), Weighted Degree Centrality (panel b) and Degree Ratio Centrality (panel c), also distinguishing between inbound (light blue bars) and outbound movements (blue bars). There is a substantial balance between the number of inbound and outbound relationships among teams, with some exceptions (see e.g. Lazio and Lecce), where the number of incoming movements is slightly greater than those outgoing.
Fig. 3
Network summary measures of Italian Serie A data: (a) Degree Centrality, (b) Weighted Degree Centrality, and (c) Degree Ratio Centrality.
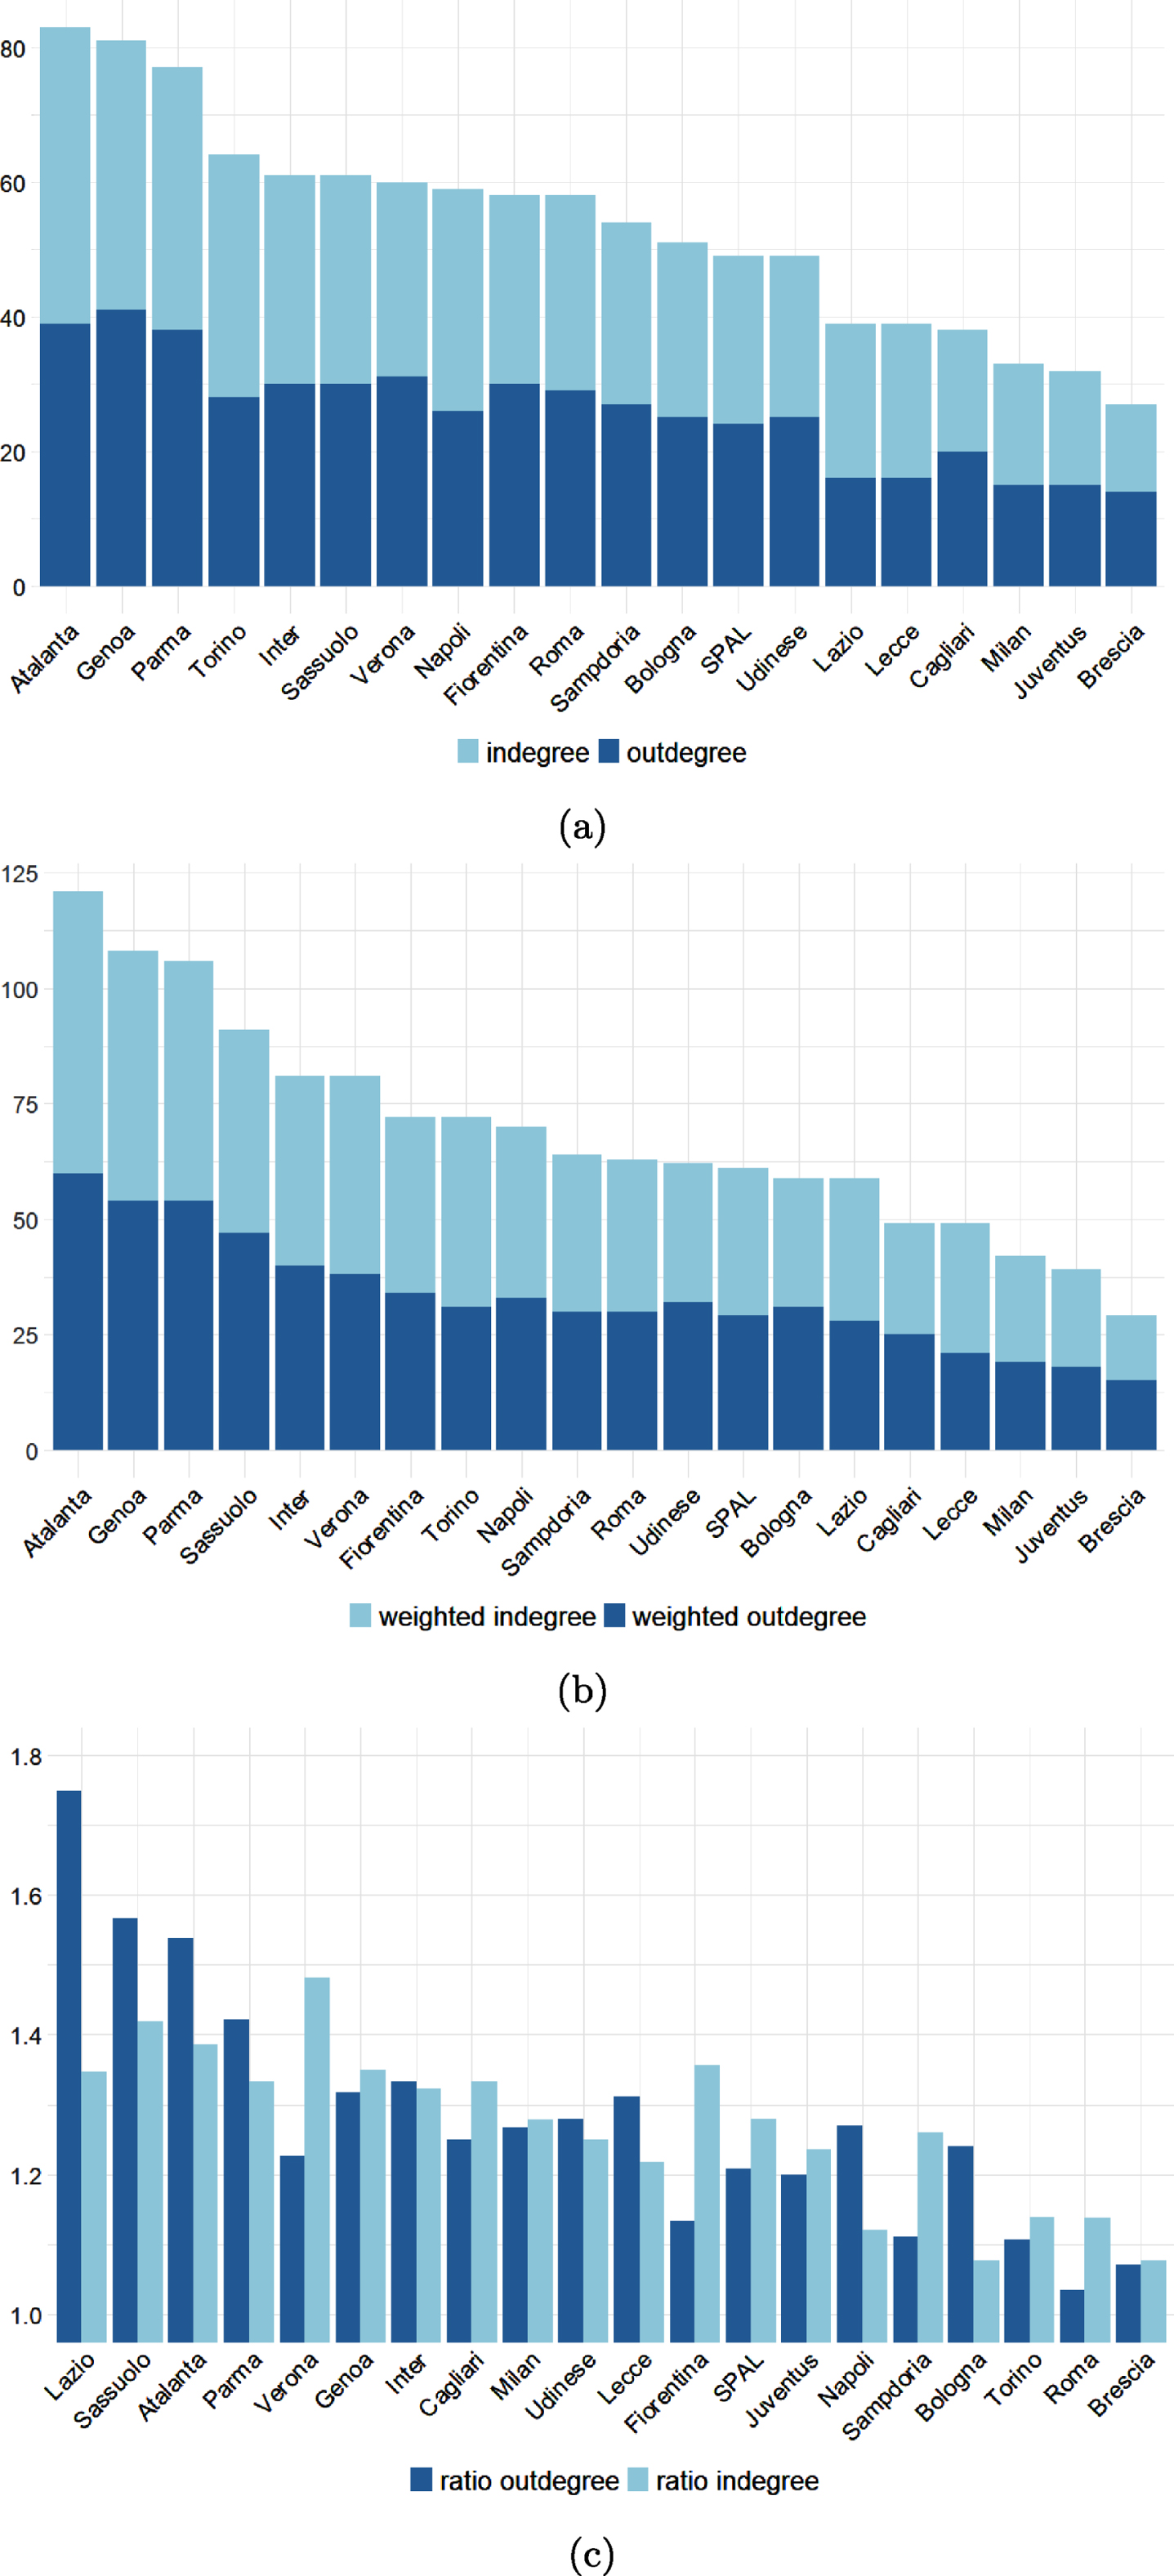
The three northern teams of Atalanta, Genoa, and Parma exhibit the largest degrees and weighted degrees. These teams present a great number of ingoing and outgoing transactions (weighted degree) with many other teams (degree). These links are often due to loan-out or to players back from loans, sometimes involving wonder-kids. Opposite to the three aforementioned northern teams, Milan and Juventus show similar market behavior, performing a small number of movements with a few loyal teams, i.e. Juventus trades with Genoa and Cagliari.
Among the low-degree and low-weighted degree teams, there are Brescia, Lecce, and Cagliari. The strategy of Brescia and Lecce (located in the North-East and in the South, respectively) can be driven by the fact of being newly promoted from the second division (Serie B) to the first Italian division. Conversely, the third promoted team (Verona) appears more capable of creating links with other teams (especially inbound), preferring to exchange more than one player with its partners (mostly loans).
As a particular case, Lazio shows a large difference between the outdegree and indegree ratio. In fact, different wonder-kid players are conveyed to the Serie B southern team of Salernitana (which shares the same ownership as Lazio, as aforementioned), producing the highest outdegree ratio between the considered teams. In this sense, the market strategy of Roma is completely the opposite: this team exhibits one of the lowest degree ratios, exchanging few players with many teams on average, especially from abroad.
The scatter plot of Fig. 4 unveils a linear trend between Hub and Authority scores, reflecting the values of Fig. 3c; in fact, the correlation between the weighted degree centrality and the Hub and Authority scores is on average high (the minimum is 0.72 between the Authority score and outgoing weighted degree, while the maximum is 0.86 between the Hub score and outgoing weighted degree).
Fig. 4
Scatter plot of Authority score against Hub score for the 20 Serie A Teams.
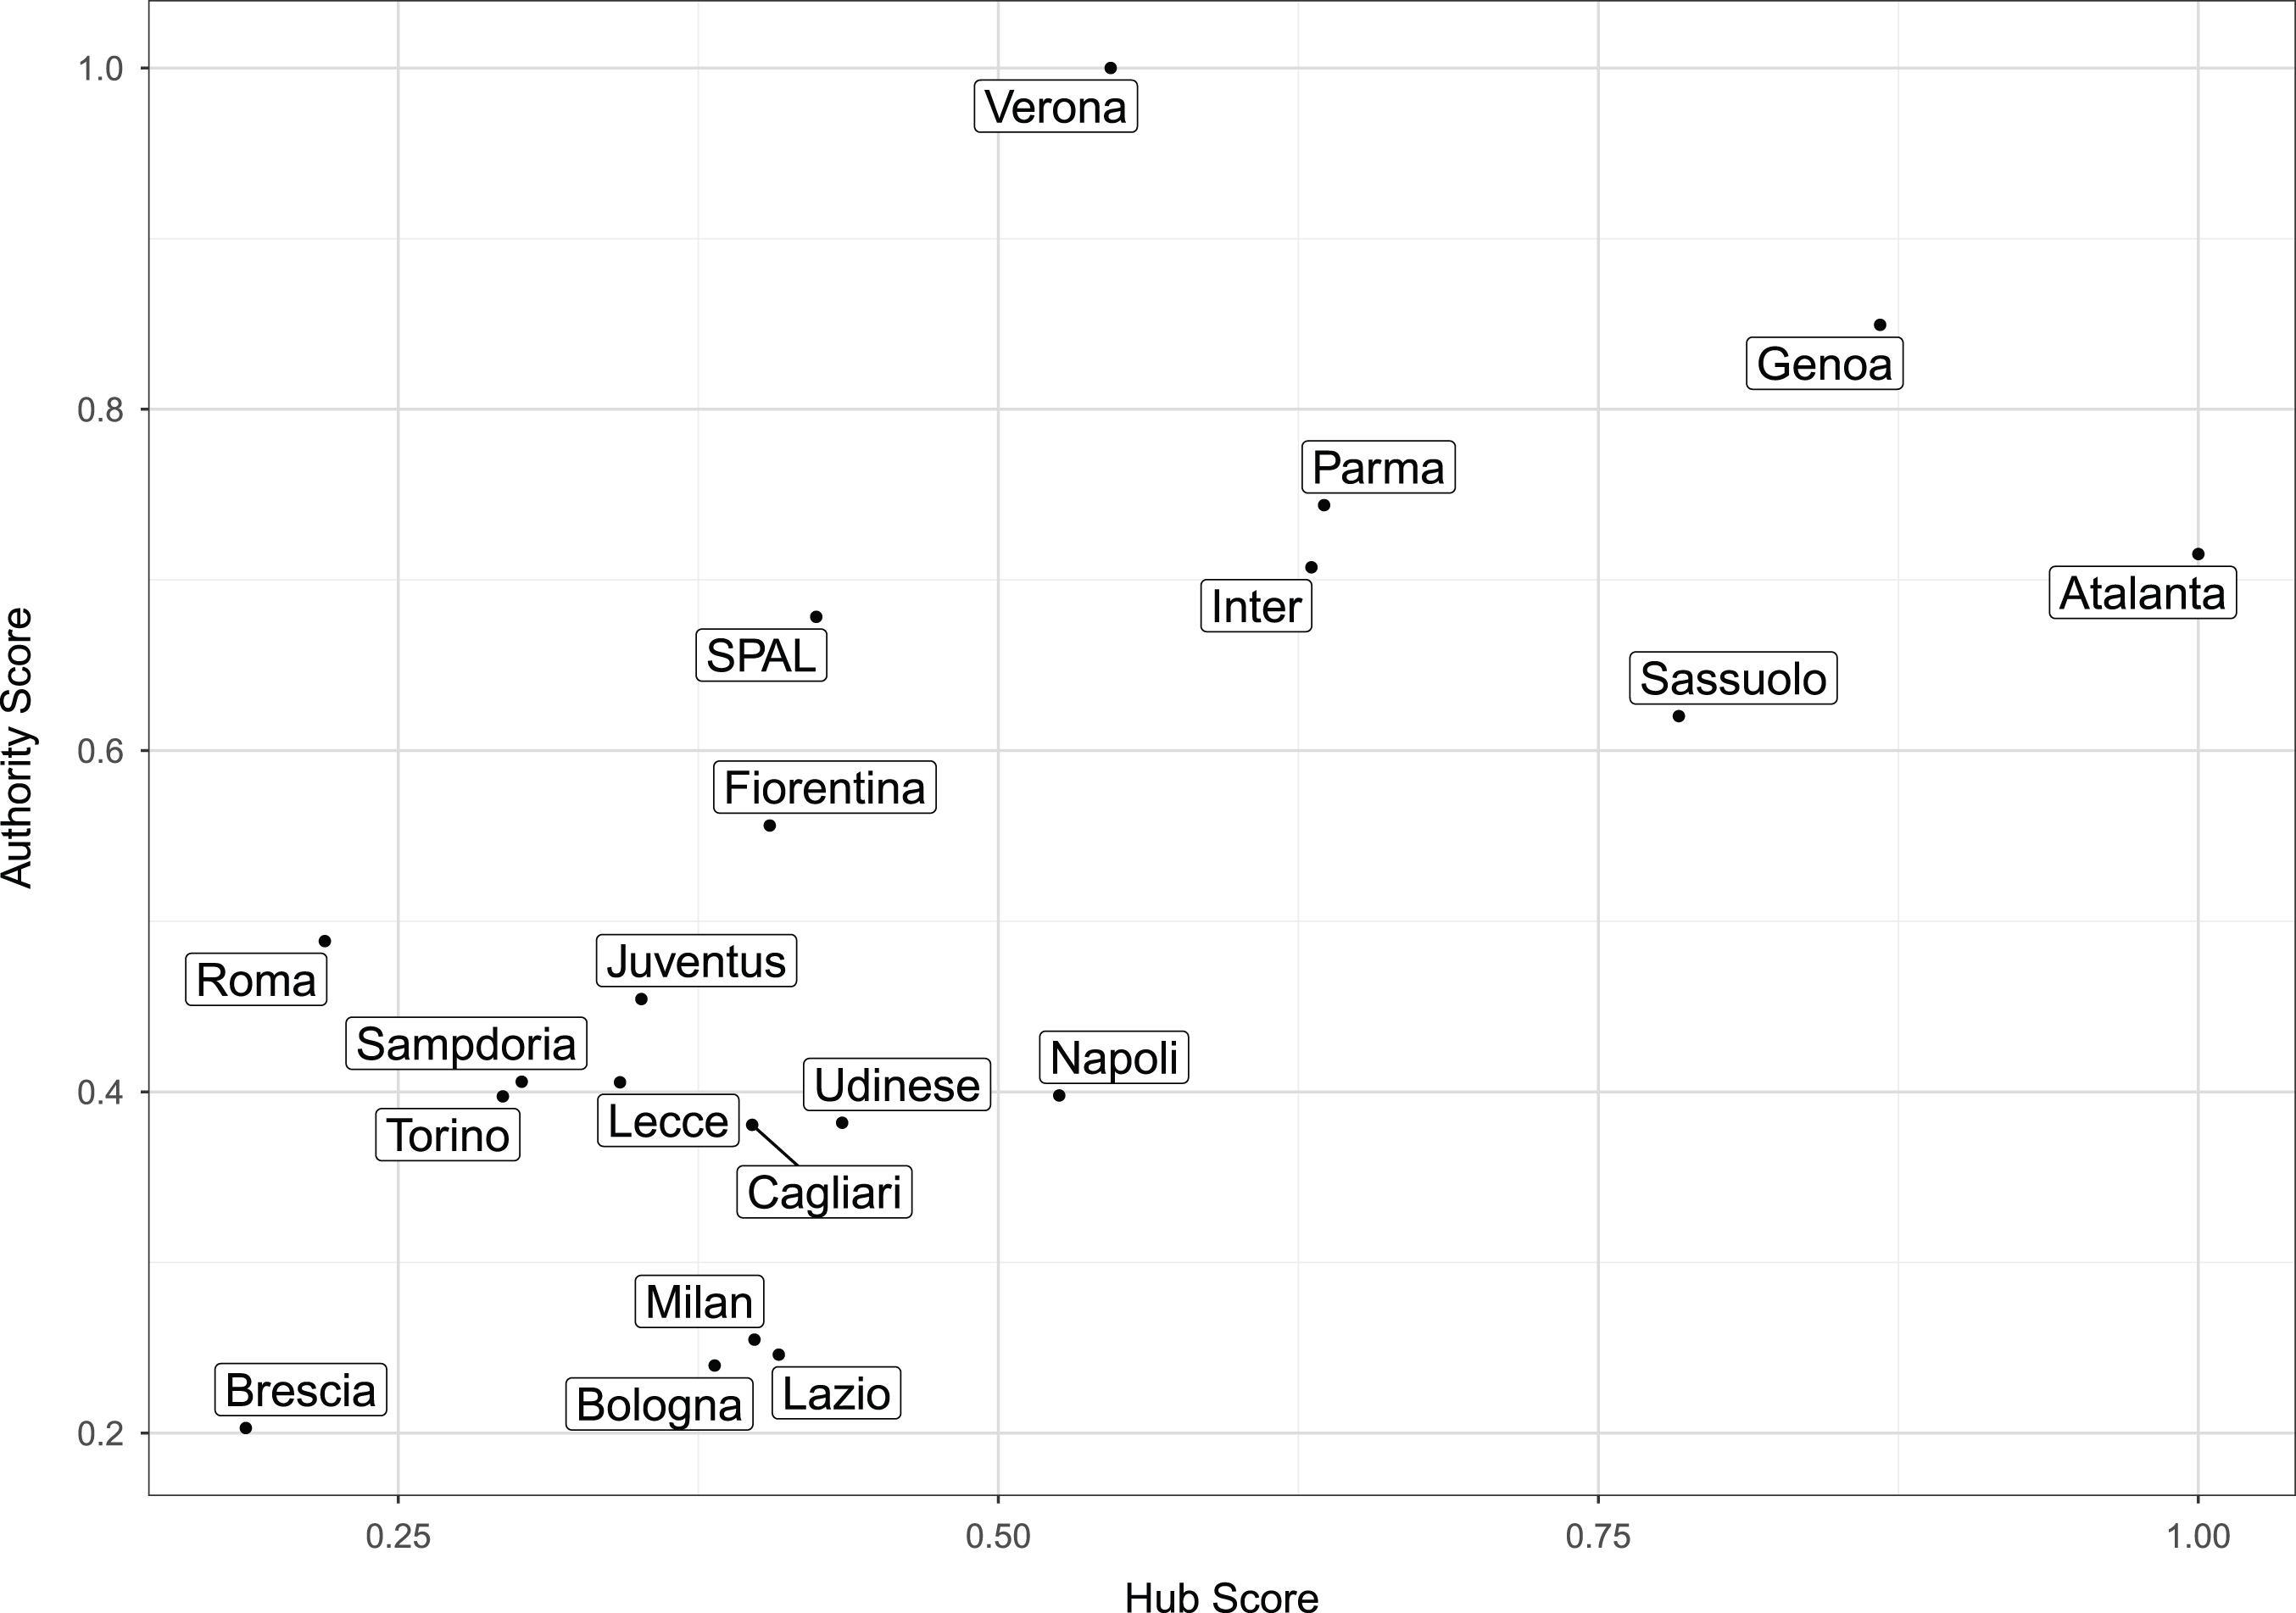
Some interesting cases arise. During the 2019 summer market session, Verona purchased several players to improve the roster level and to make it more competitive to face Serie A. Roma and SPAL act as Verona, but show lower Hub and Authority scores. On the contrary, Atalanta’s Hub score (the highest among the teams) is higher than its Authority score. Atalanta made several outgoing transactions of young players, some of them coming back from loans and others from its youth team. Likewise, also Sassuolo acts as a hub in the network, but its Hub score is lower than that of Atalanta. The lower scores related to Brescia confirm its peripheral role in the network, as already highlighted in Figs. 2 and 3.
4.3Community detection
As a result of the community detection procedure, 17 communities are identified (Fig. 5 panels a and b). This means that 14 groups are constituted by a single Serie A team3 and its market relationships, while three communities composed by two Serie A teams can be observed:
Fig. 5
Teams community network (panel a) and its resulting network of modules (panel b).
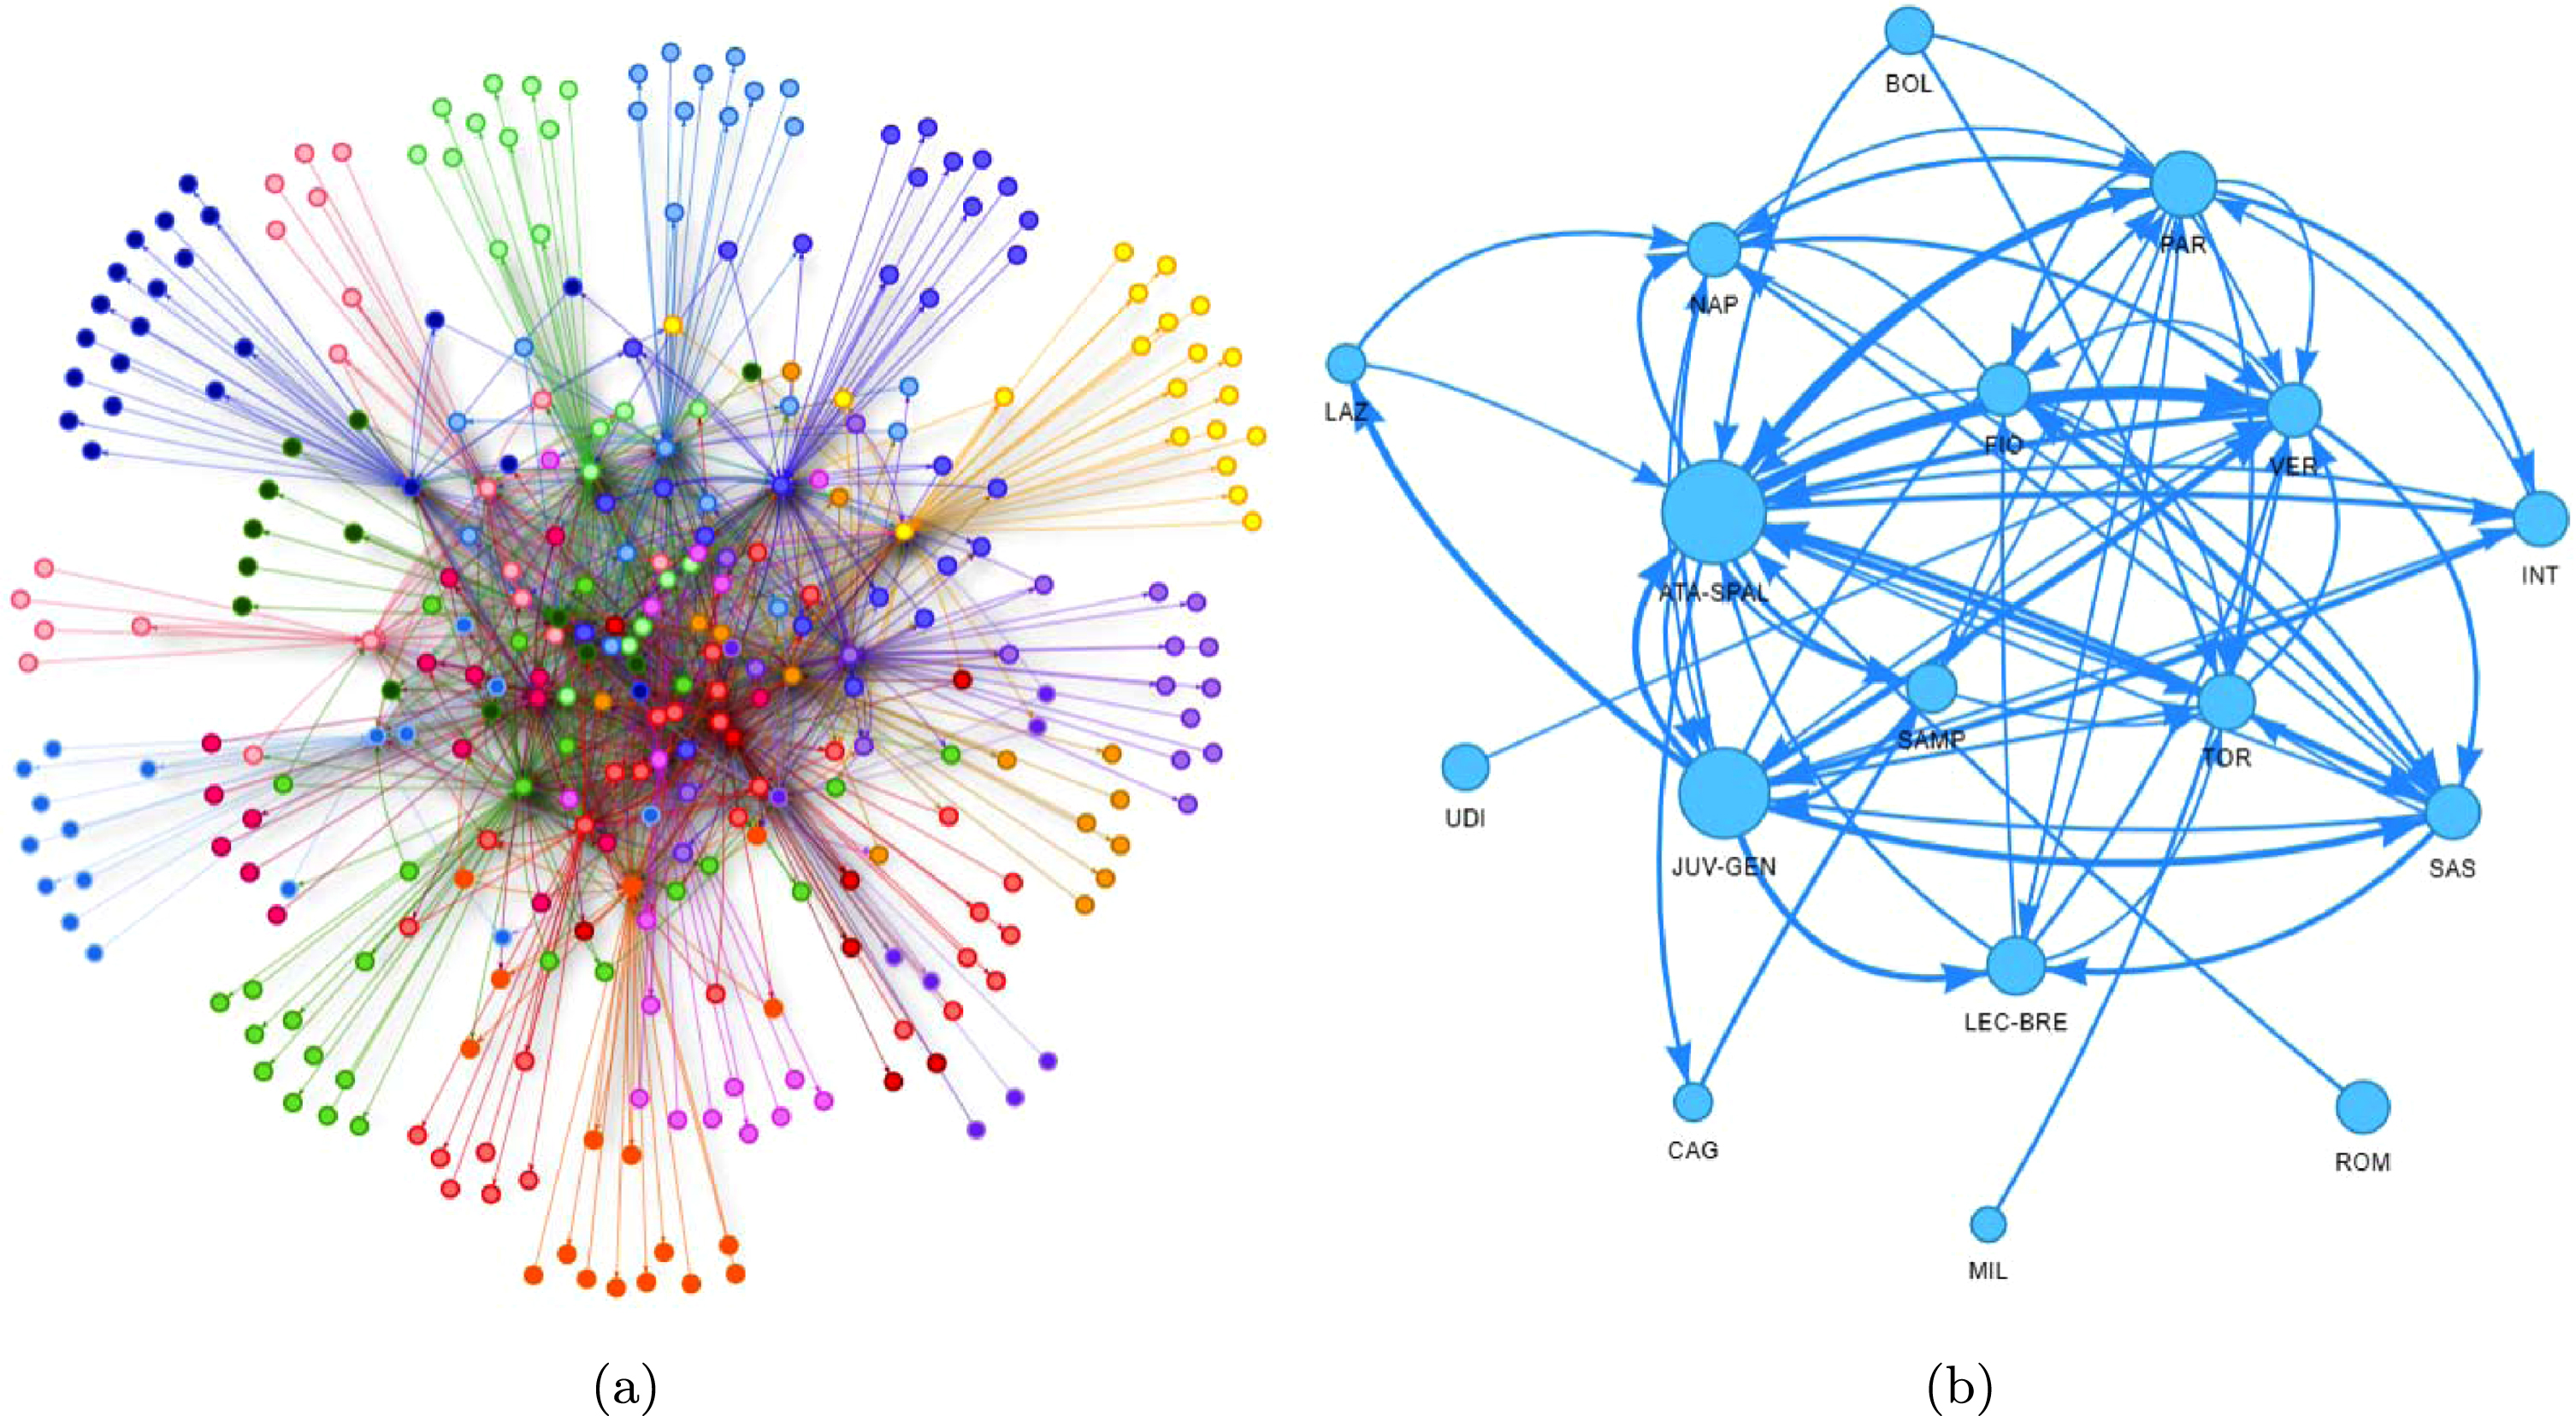
[ATA-SPAL] the community including Atalanta and SPAL,
[LEC-BRE] the community including Lecce and Brescia,
[JUV-GEN] the community including Juventus and Genoa.
Figure 5a shows the community network. From a visual perspective, again the core-periphery structure is evident where the core is populated by the 20 Serie A teams and many Italian teams from the second (Serie B) and third divisions (Serie C).
The periphery is generated by teams presenting fewer relationships (both inbound and outbound) with Serie A teams. These teams, including foreign clubs, youth teams, and clubs from lower Italian leagues, are organized in bunches having exclusive relationships with individual Serie A teams. Indeed, this topology is decisive for the composition of the communities.
Figure 5b shows the network of modules for the 17 communities. The size of each node is proportional to the degree, while the size of each edge is proportional to the number of movements between communities. The most isolated communities are represented by MIL, UDI, and ROM (followed by LAZ, BOL, and CAG); these teams struggle to trade with other Serie A teams and prefer to establish exclusive agreements with teams out of Serie A.
Apart from the main community structure of the network discussed above, there are several attributes of commercial relationships that can characterize the composition of each group. We focus on the physical characteristics (Fig. 6) of the players, their position on the pitch (Fig. 7), the type of transfer (Fig. 8) and the agent involved in the operation (Table 2 and Figs. 10, 11a, 11b, 12a, 12b and 13).
Fig. 6
Distribution of players’ Age (top panel) and Height (bottom panel) by communities. Dashed red lines represent the total averaged values.
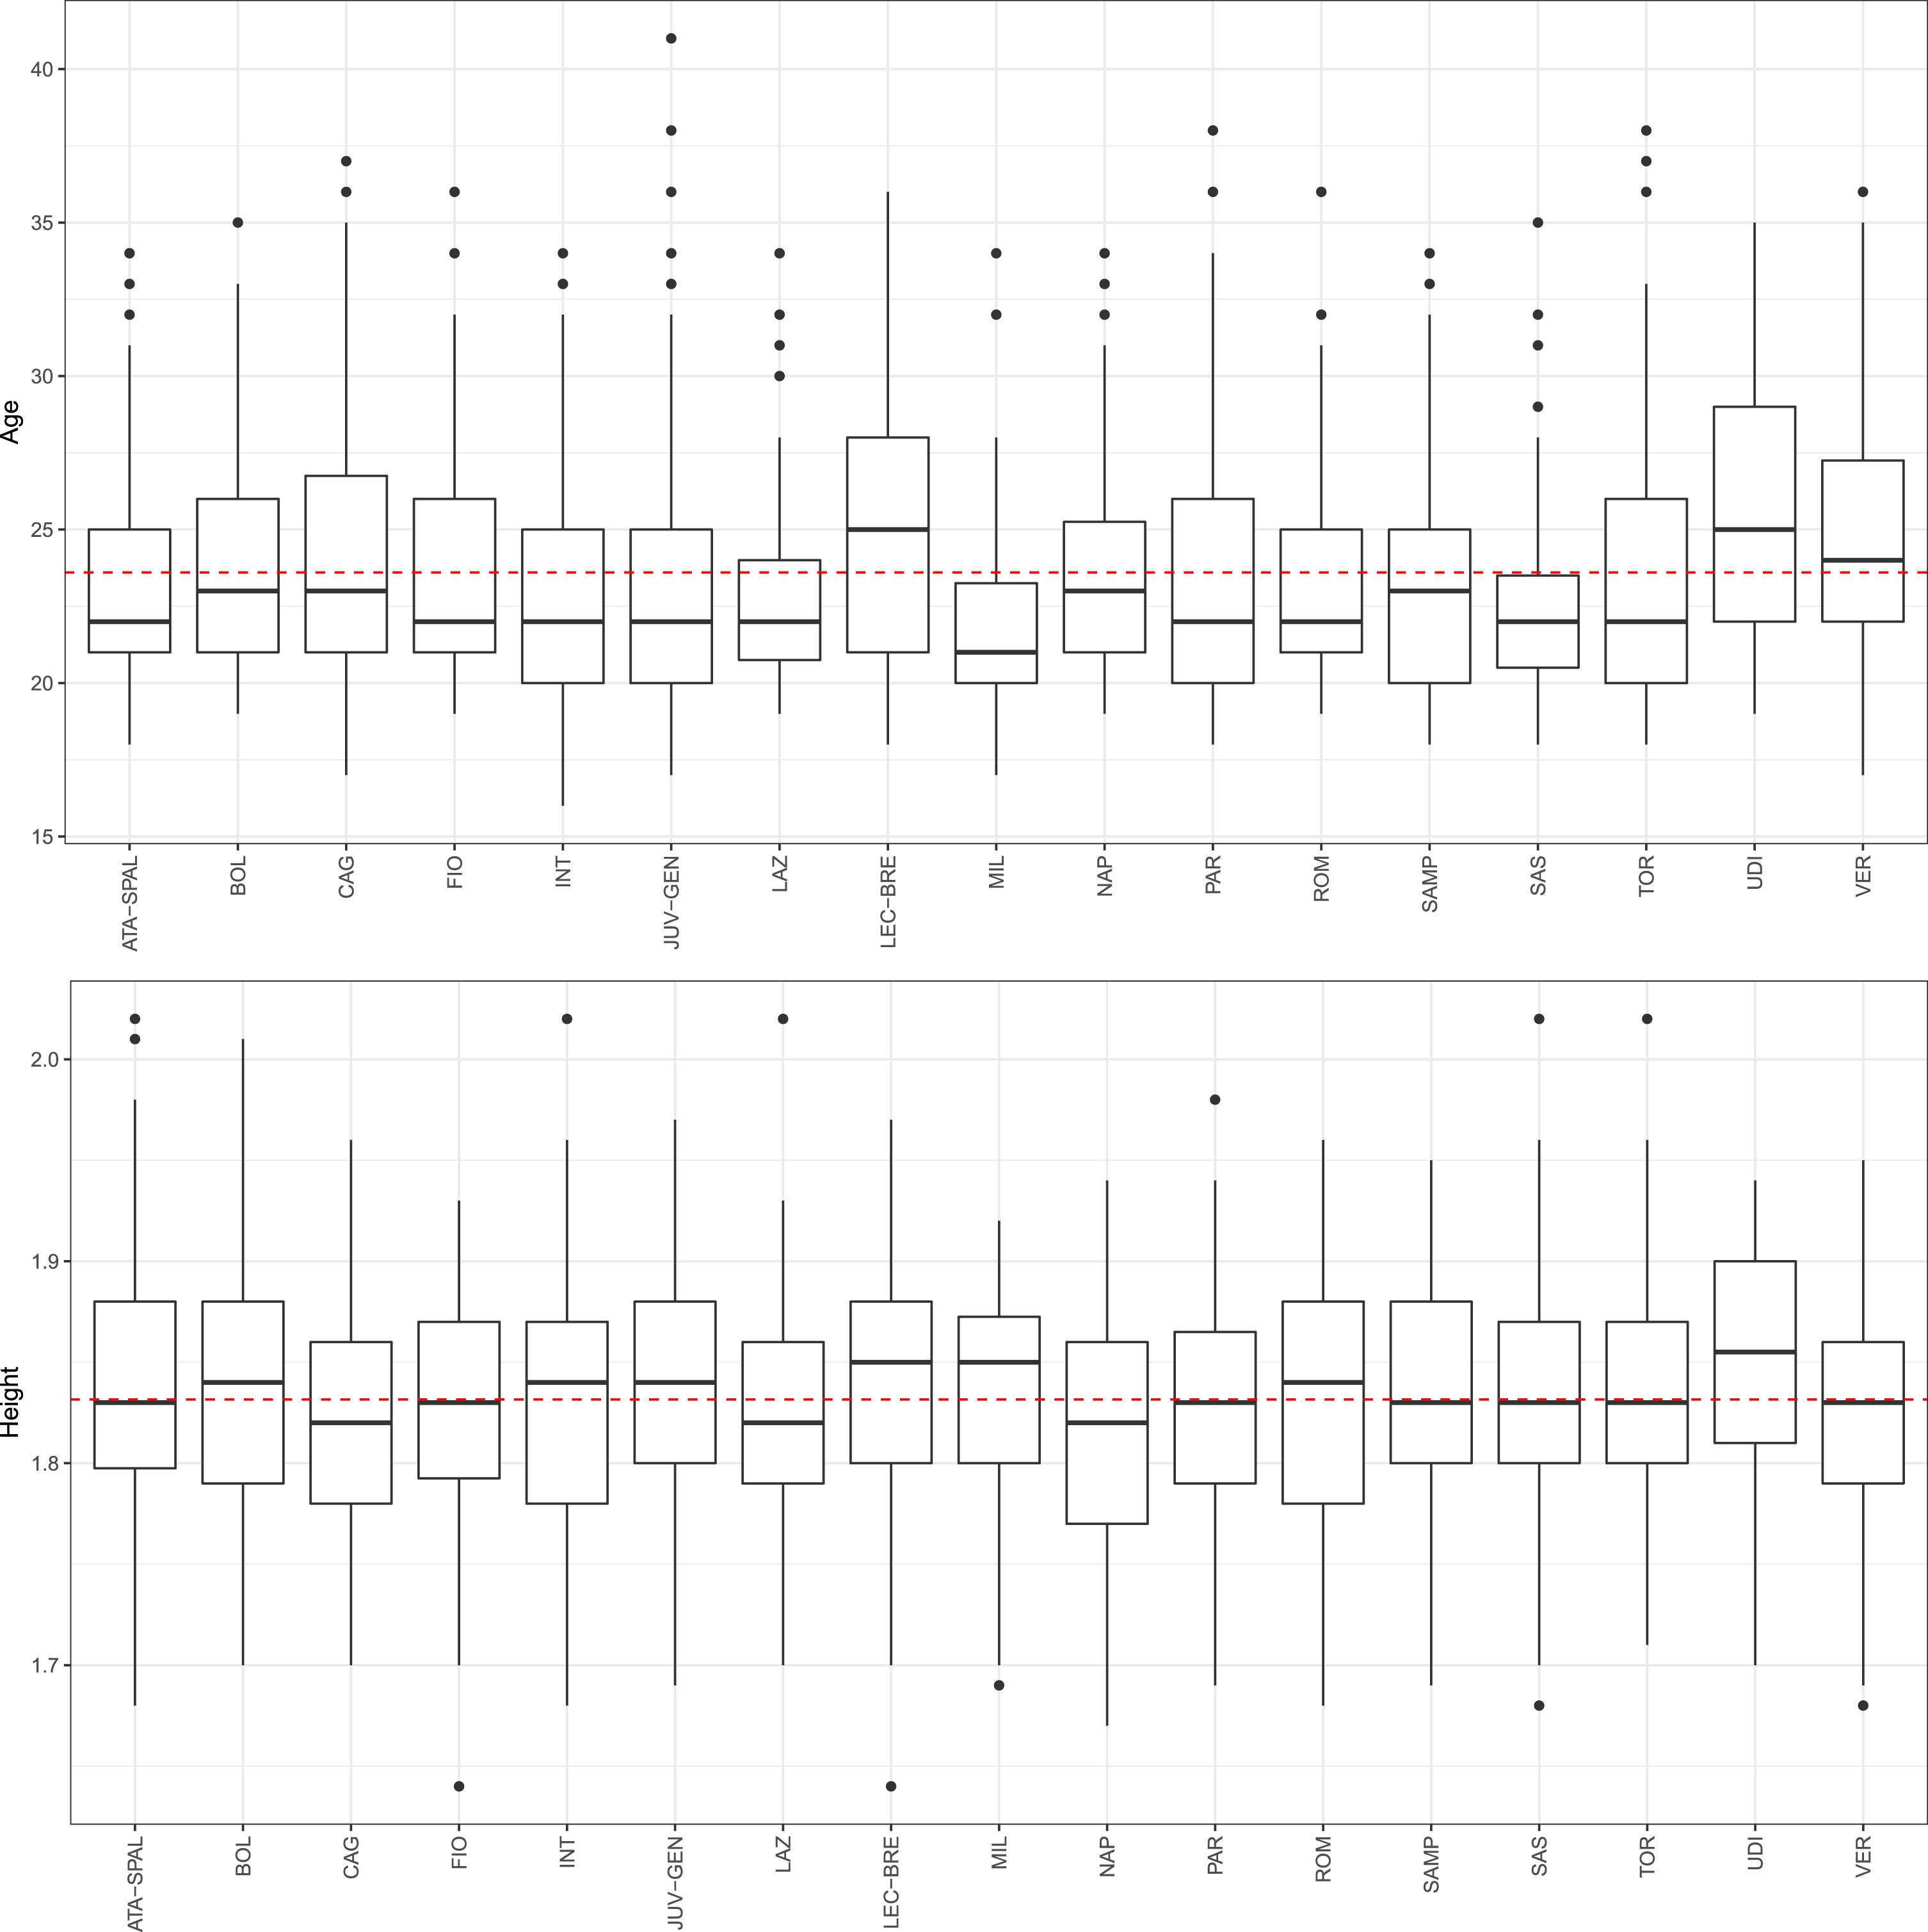
For what concerns the height (Fig. 6 - bottom panel), the distribution of players does not seem to vary among the different communities, while players involved in UDI’s community are the tallest on average. The height of 50% of the players ranges between 1.79 (first quantile) and 1.87 (third quantile) meters.
Fig. 7
Distribution of players’ roles by their position for each community.
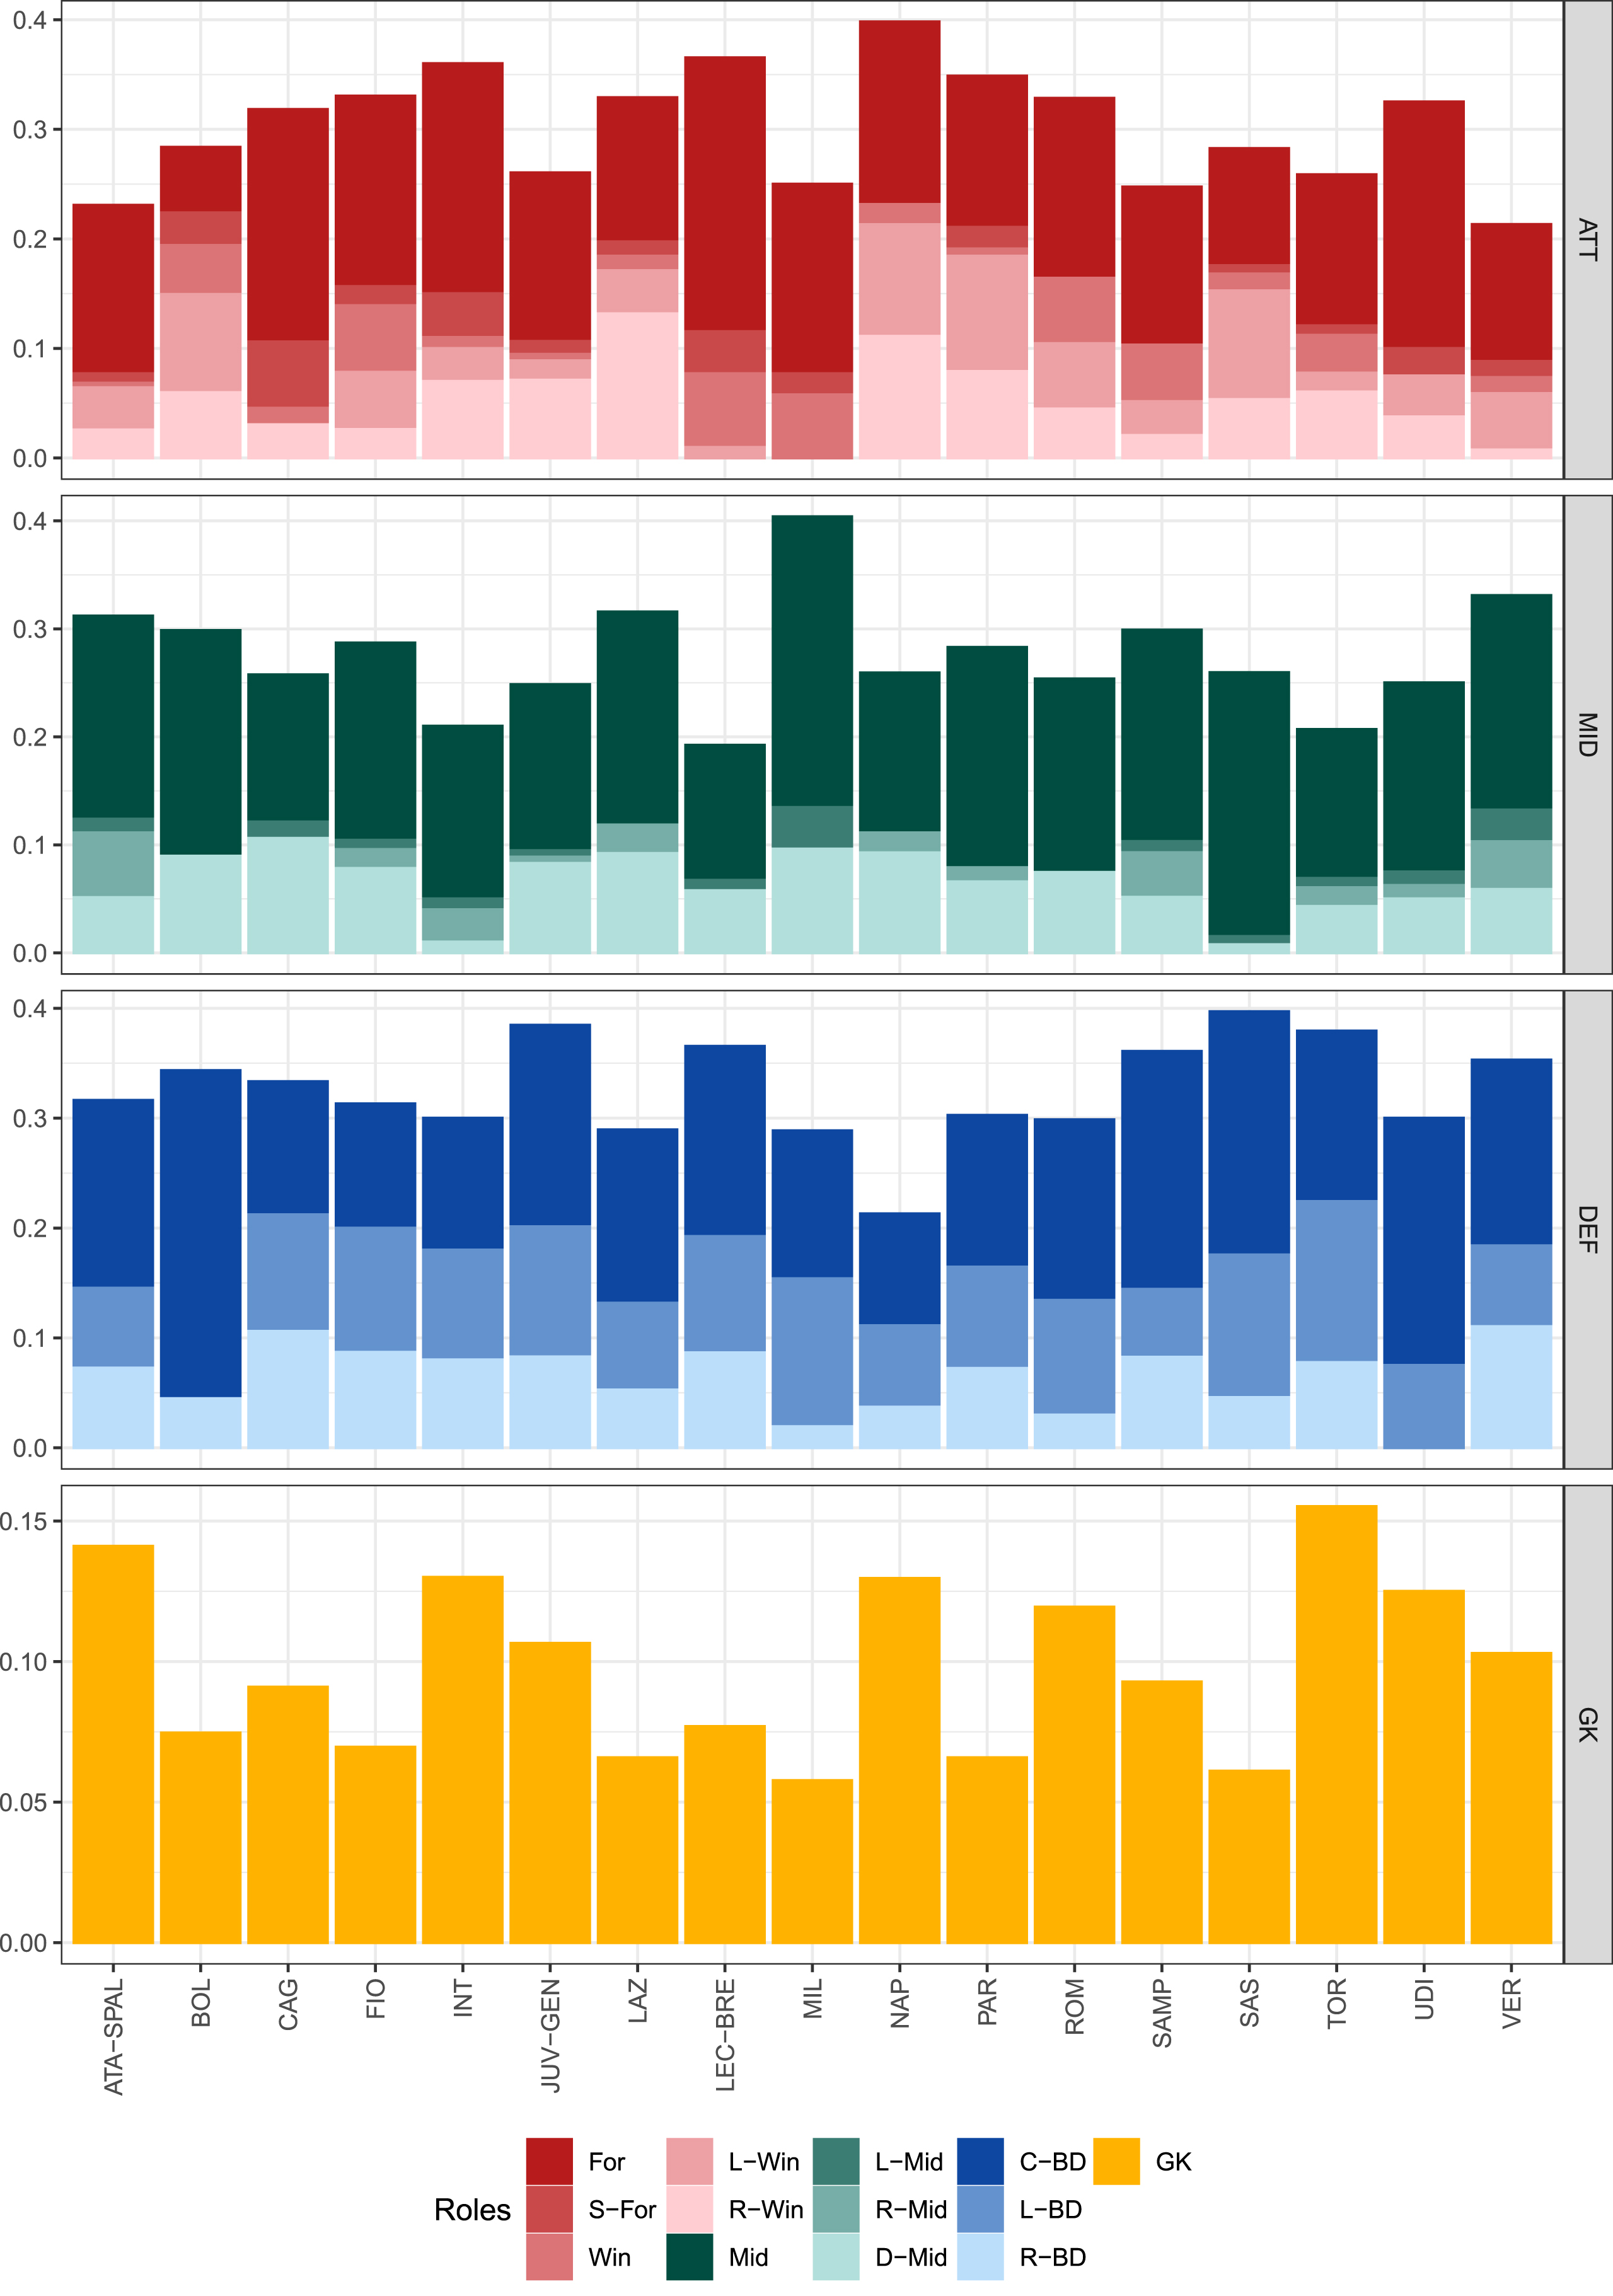
Fig. 8
Distribution of players’ type of transfer for each community.
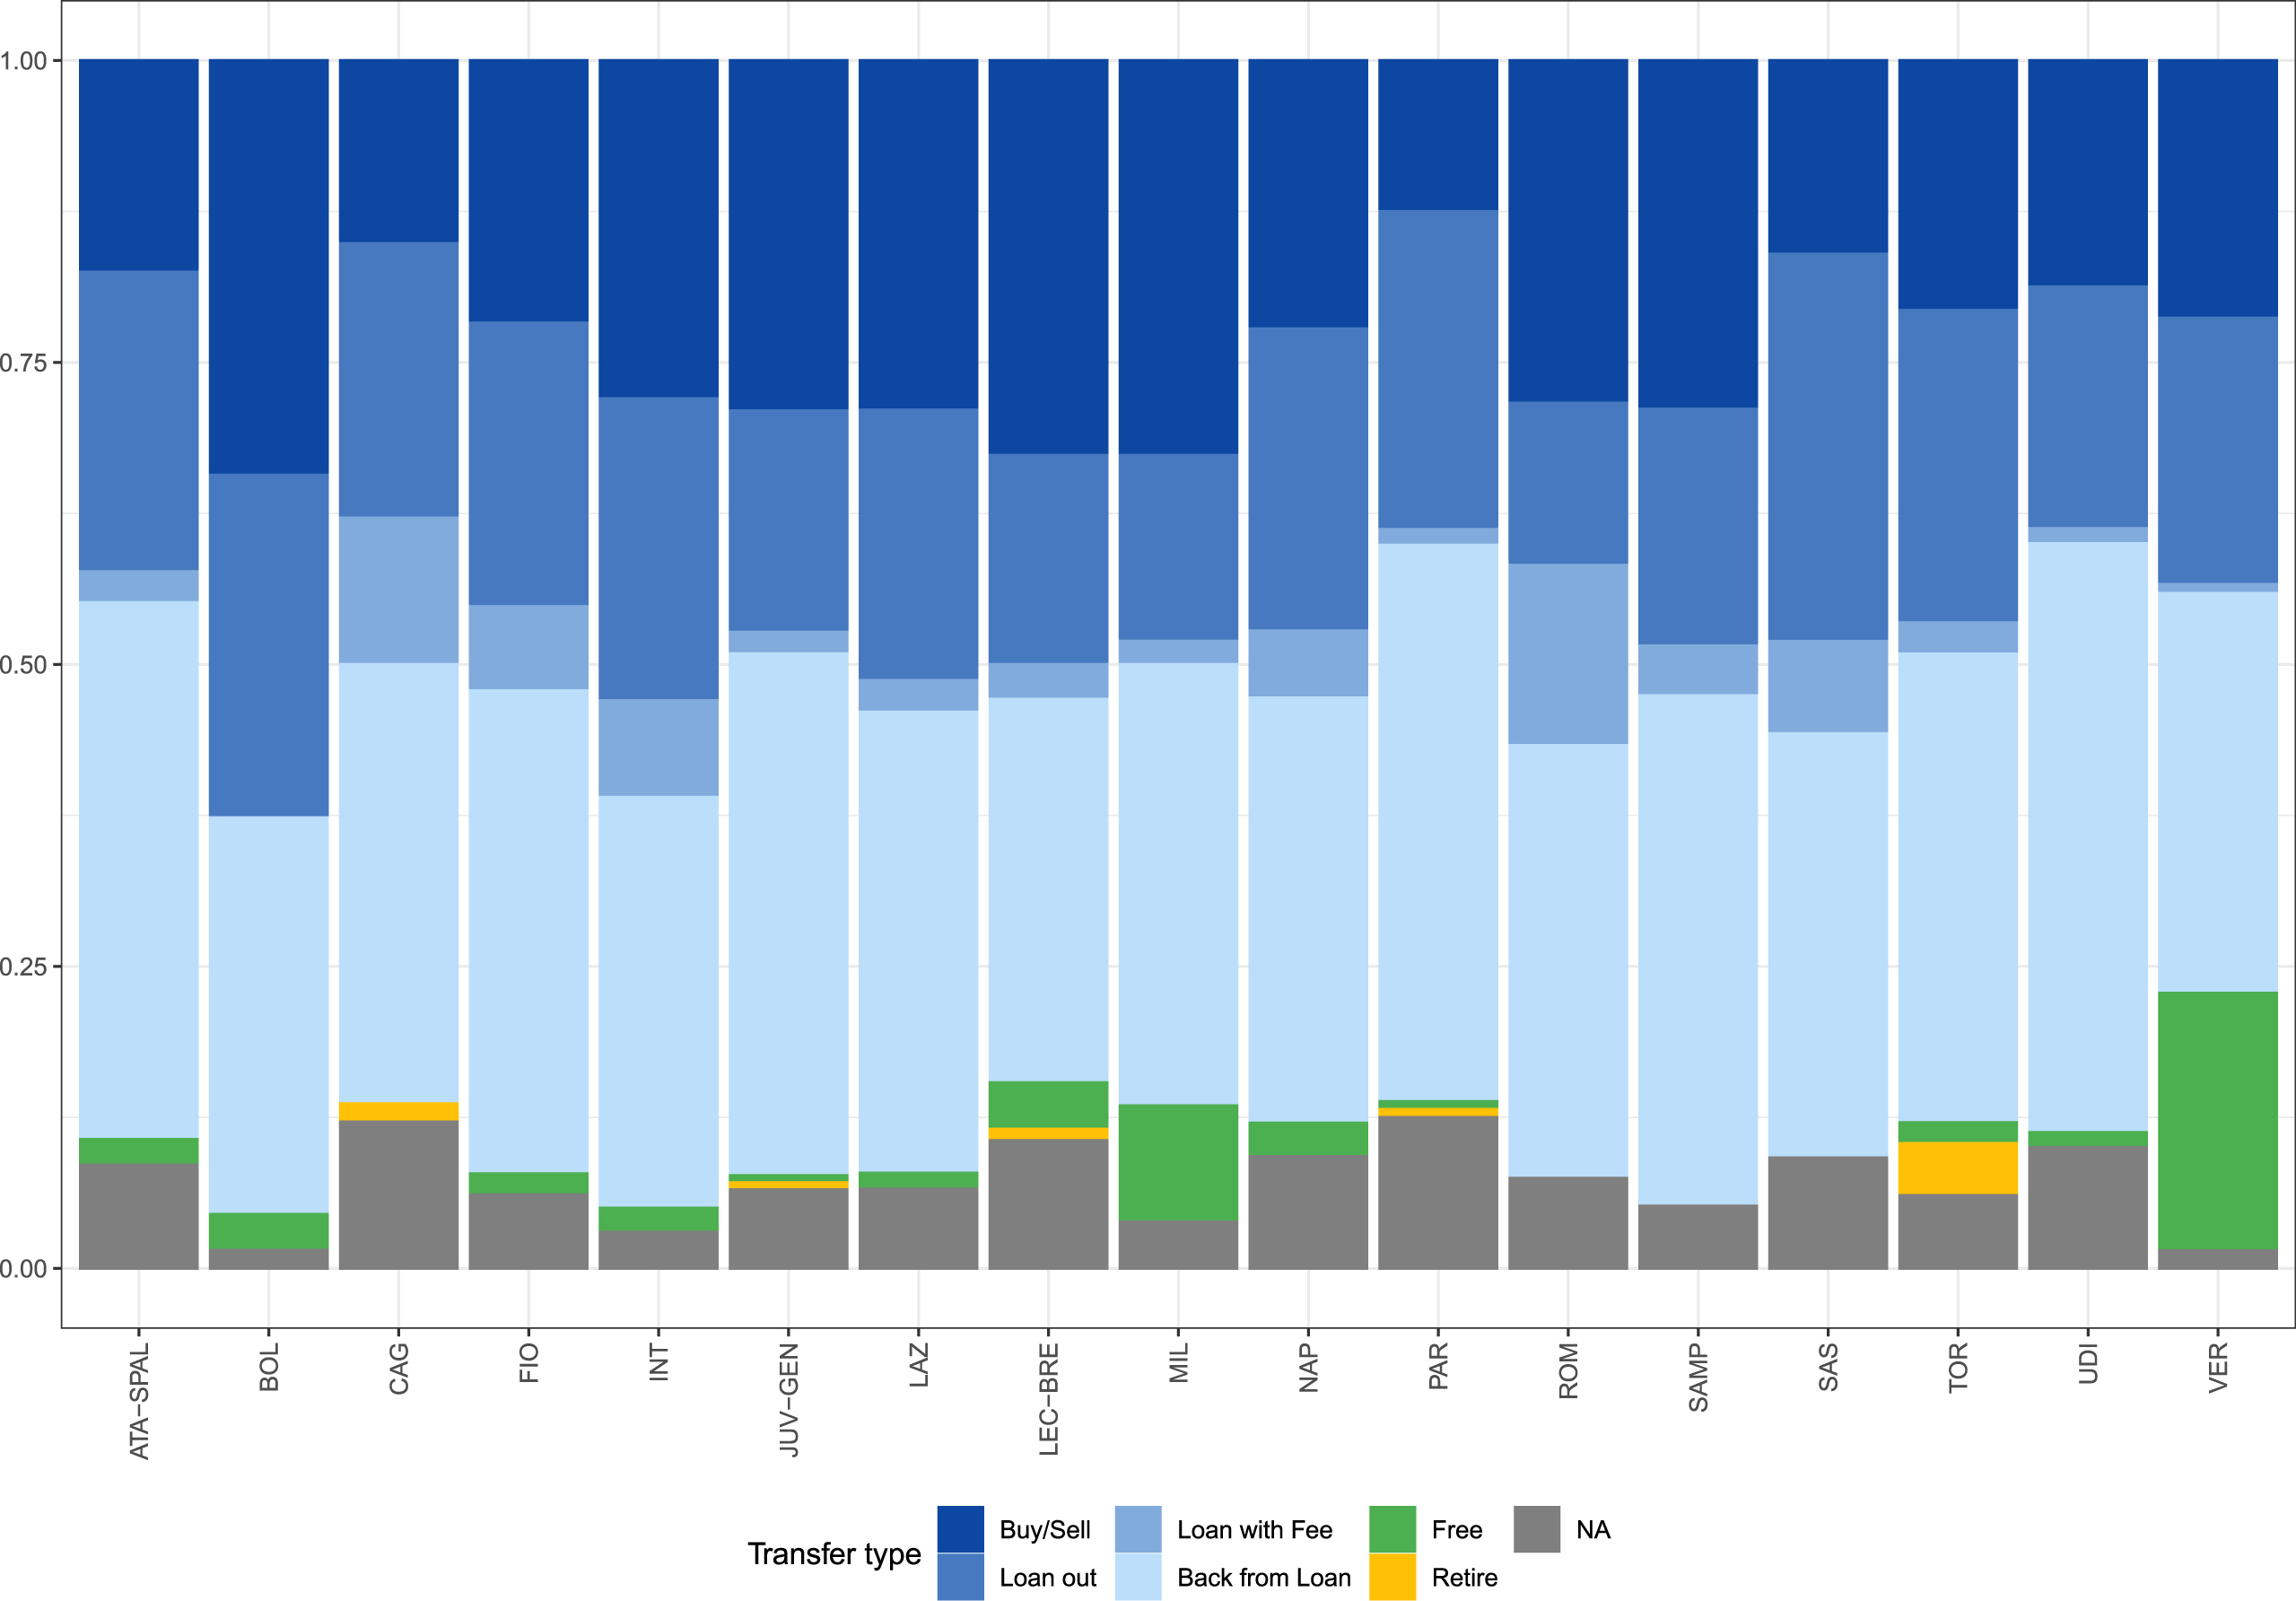
Fig. 9
Scatter plot of Average Betweenness against Gini index for the 20 Serie A Teams, considering the agents involved in each Community.
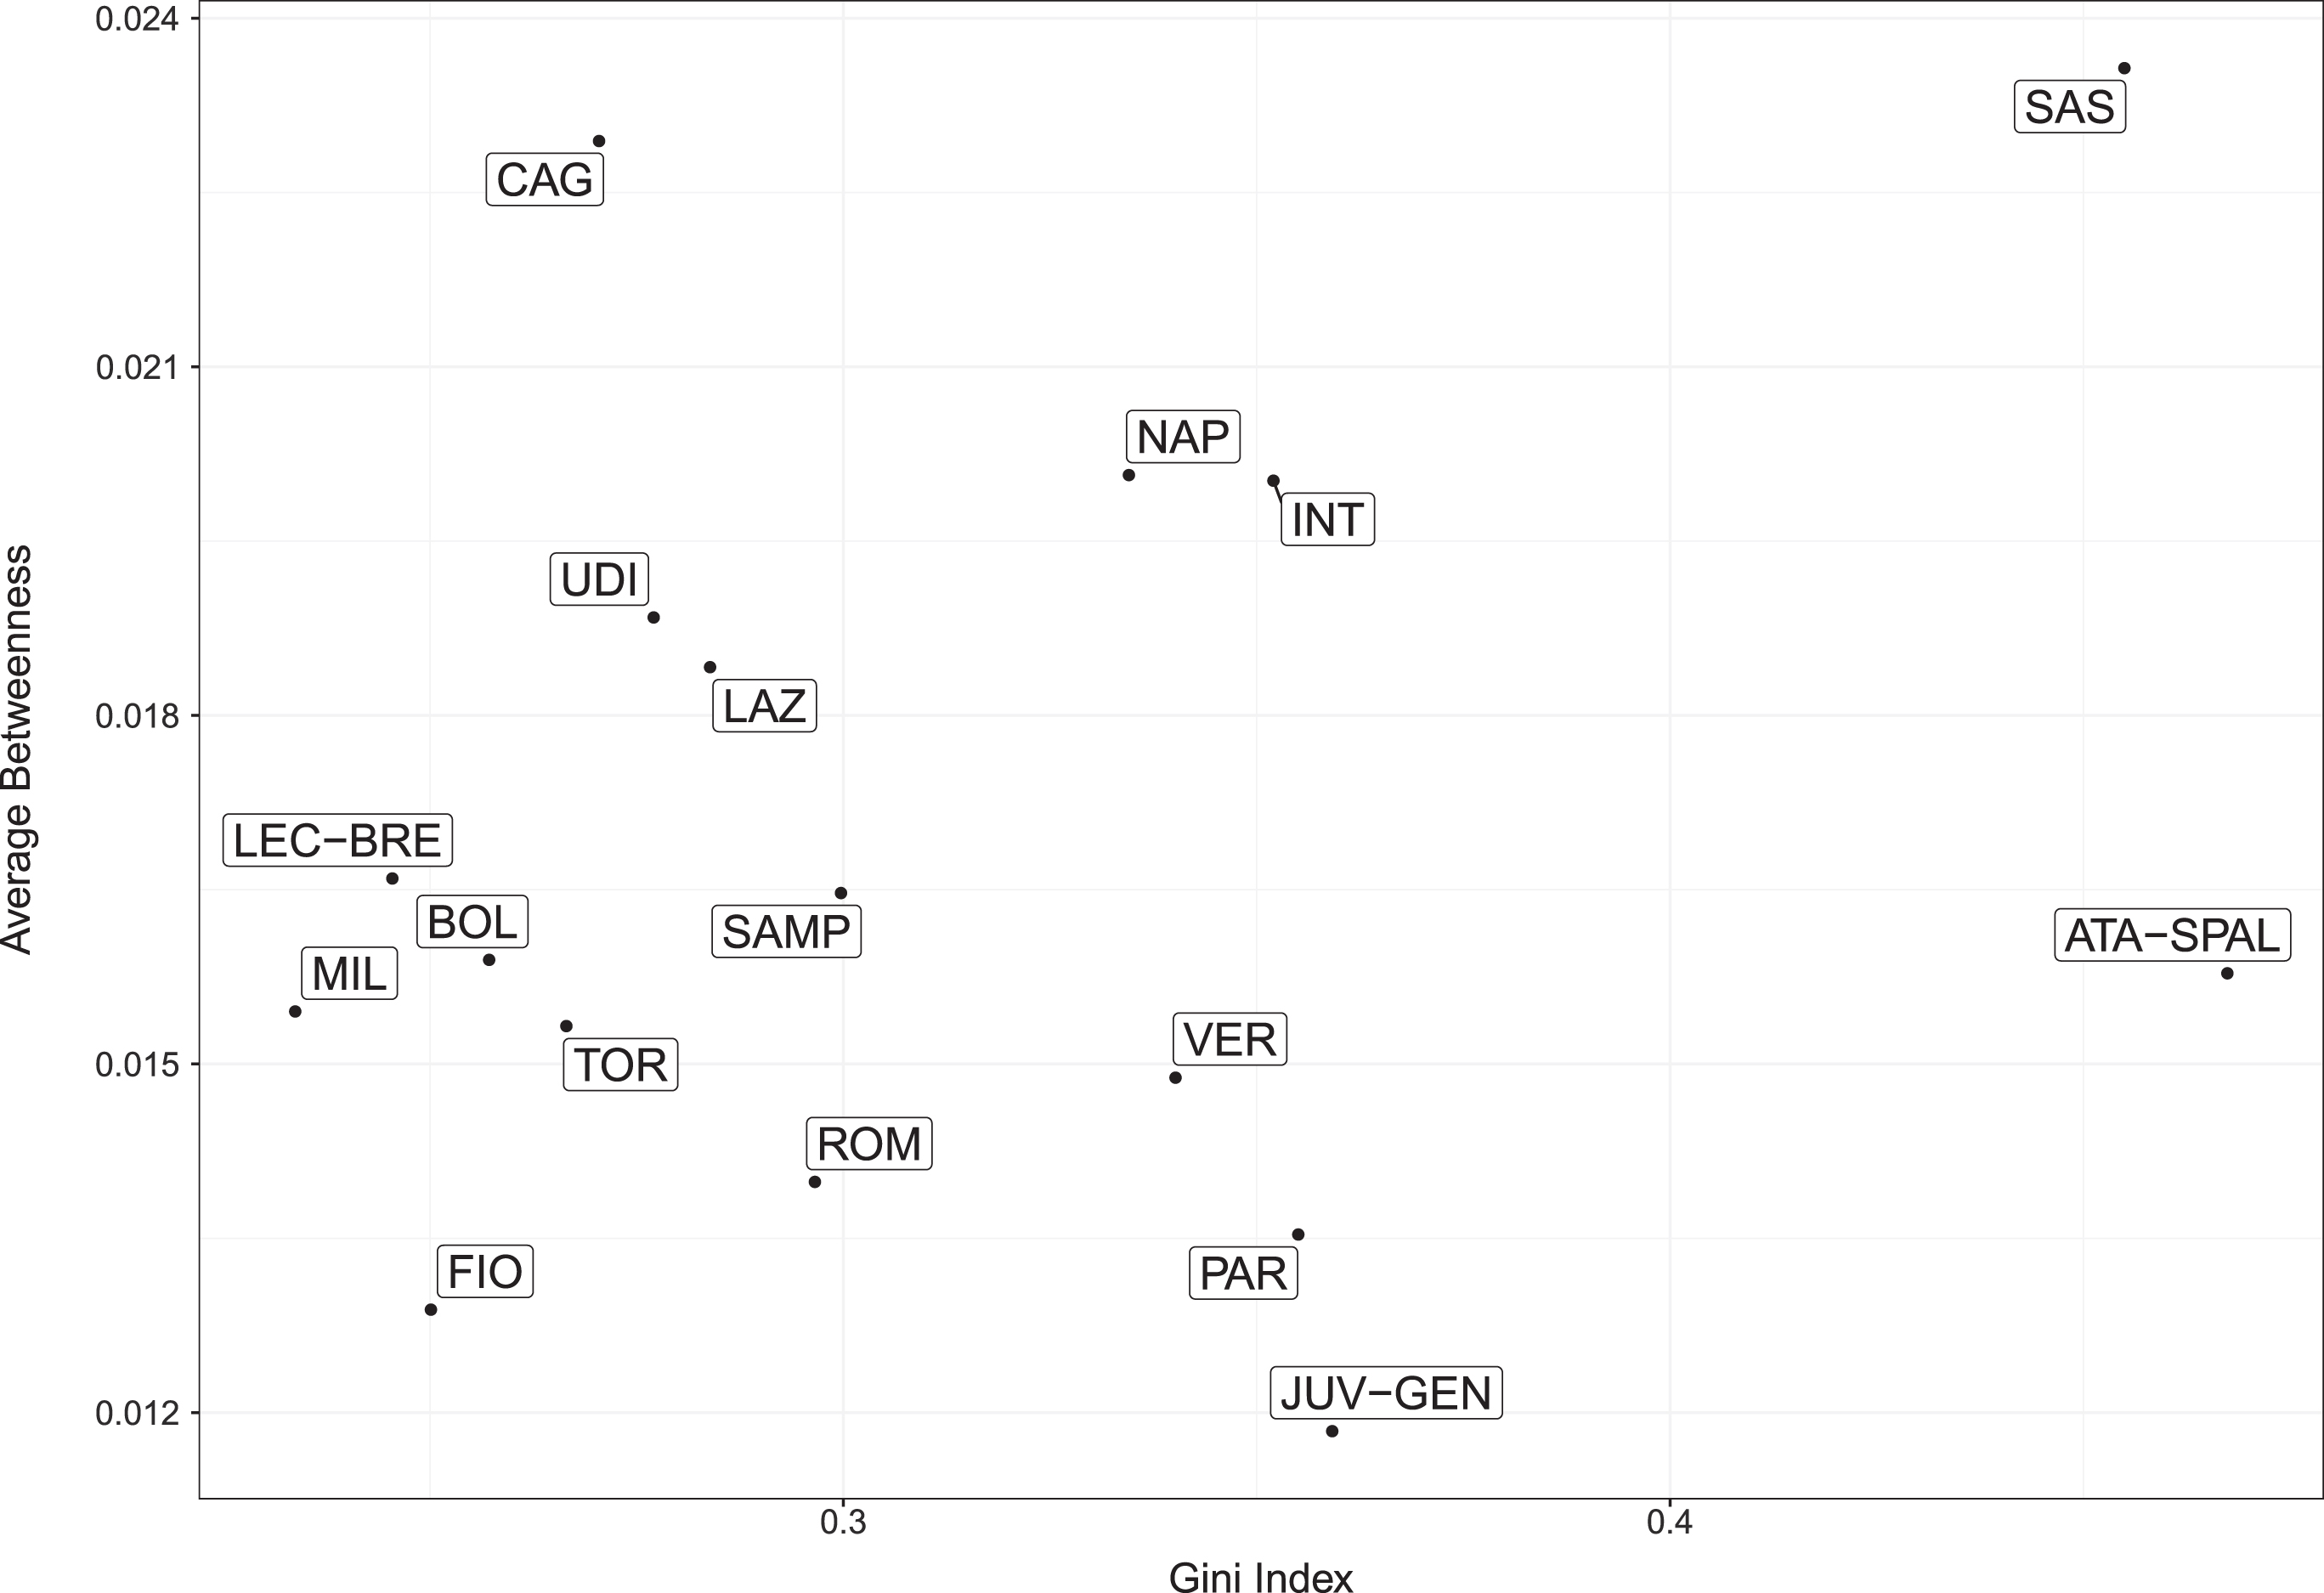
Fig. 10
Communities of transactions. Player agents are depicted in red squares, dark blue dots highlight Serie A teams and light blue dots represent the other teams.
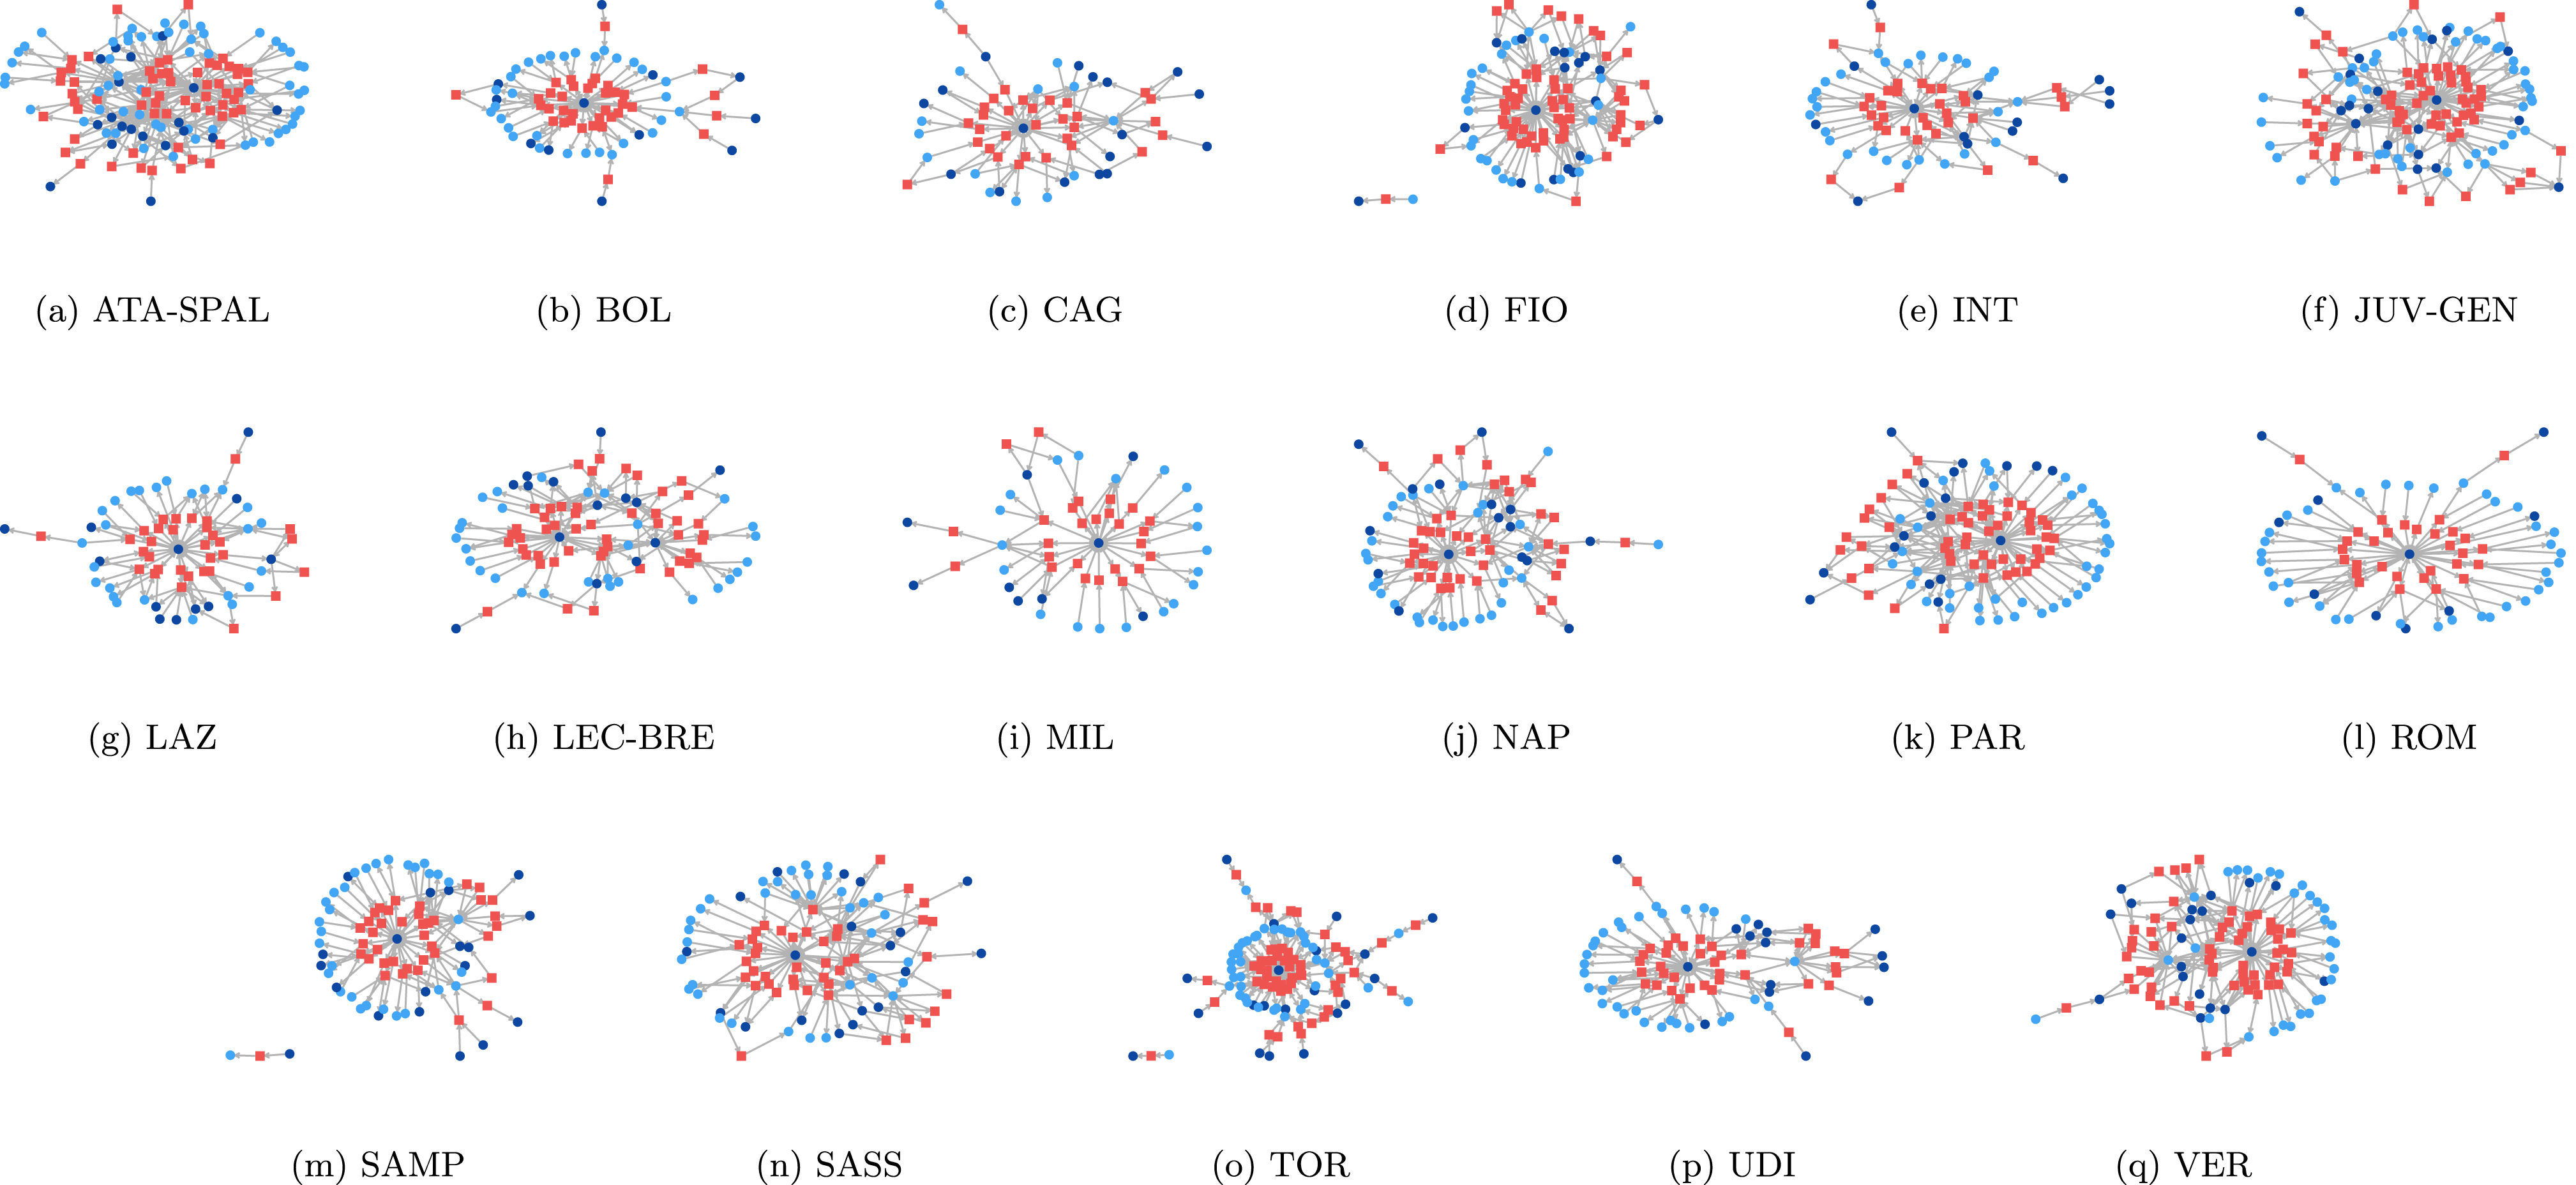
Fig. 11
Focus on the transactions: (a) SAS community, (b) MIL community.
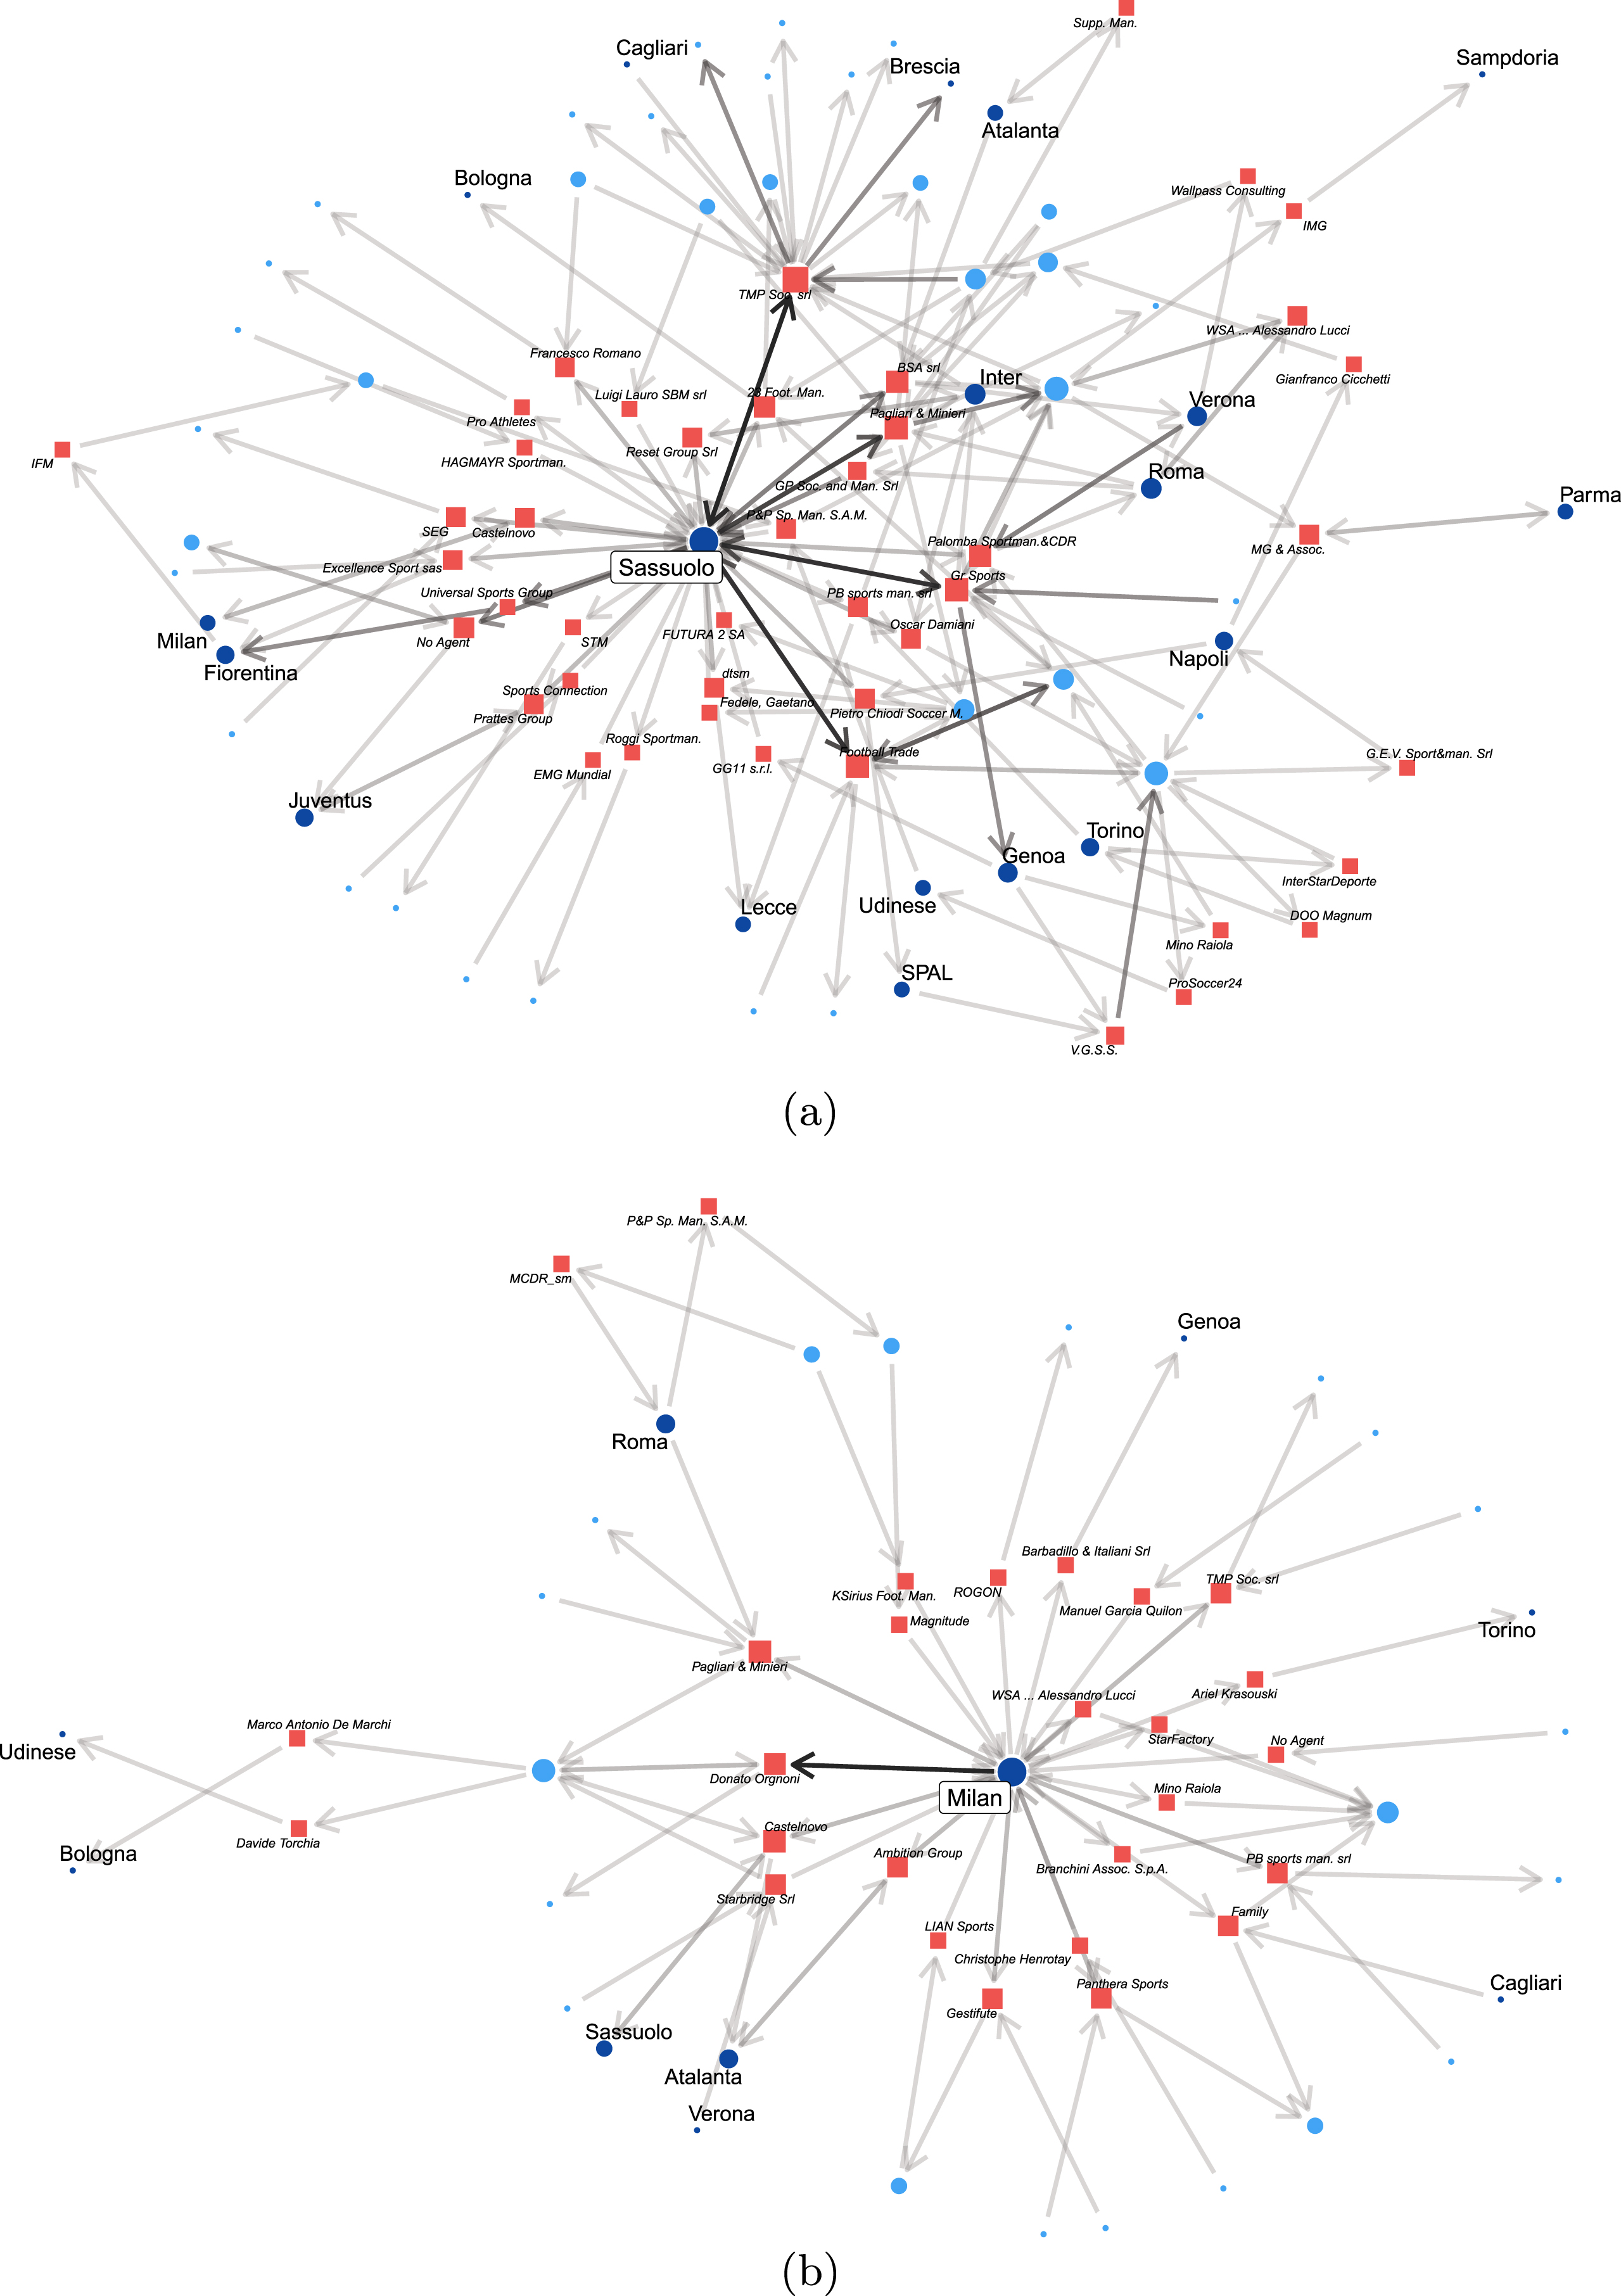
Fig. 12
Focus on the transactions: (a) FIO community, (b) CAG community.
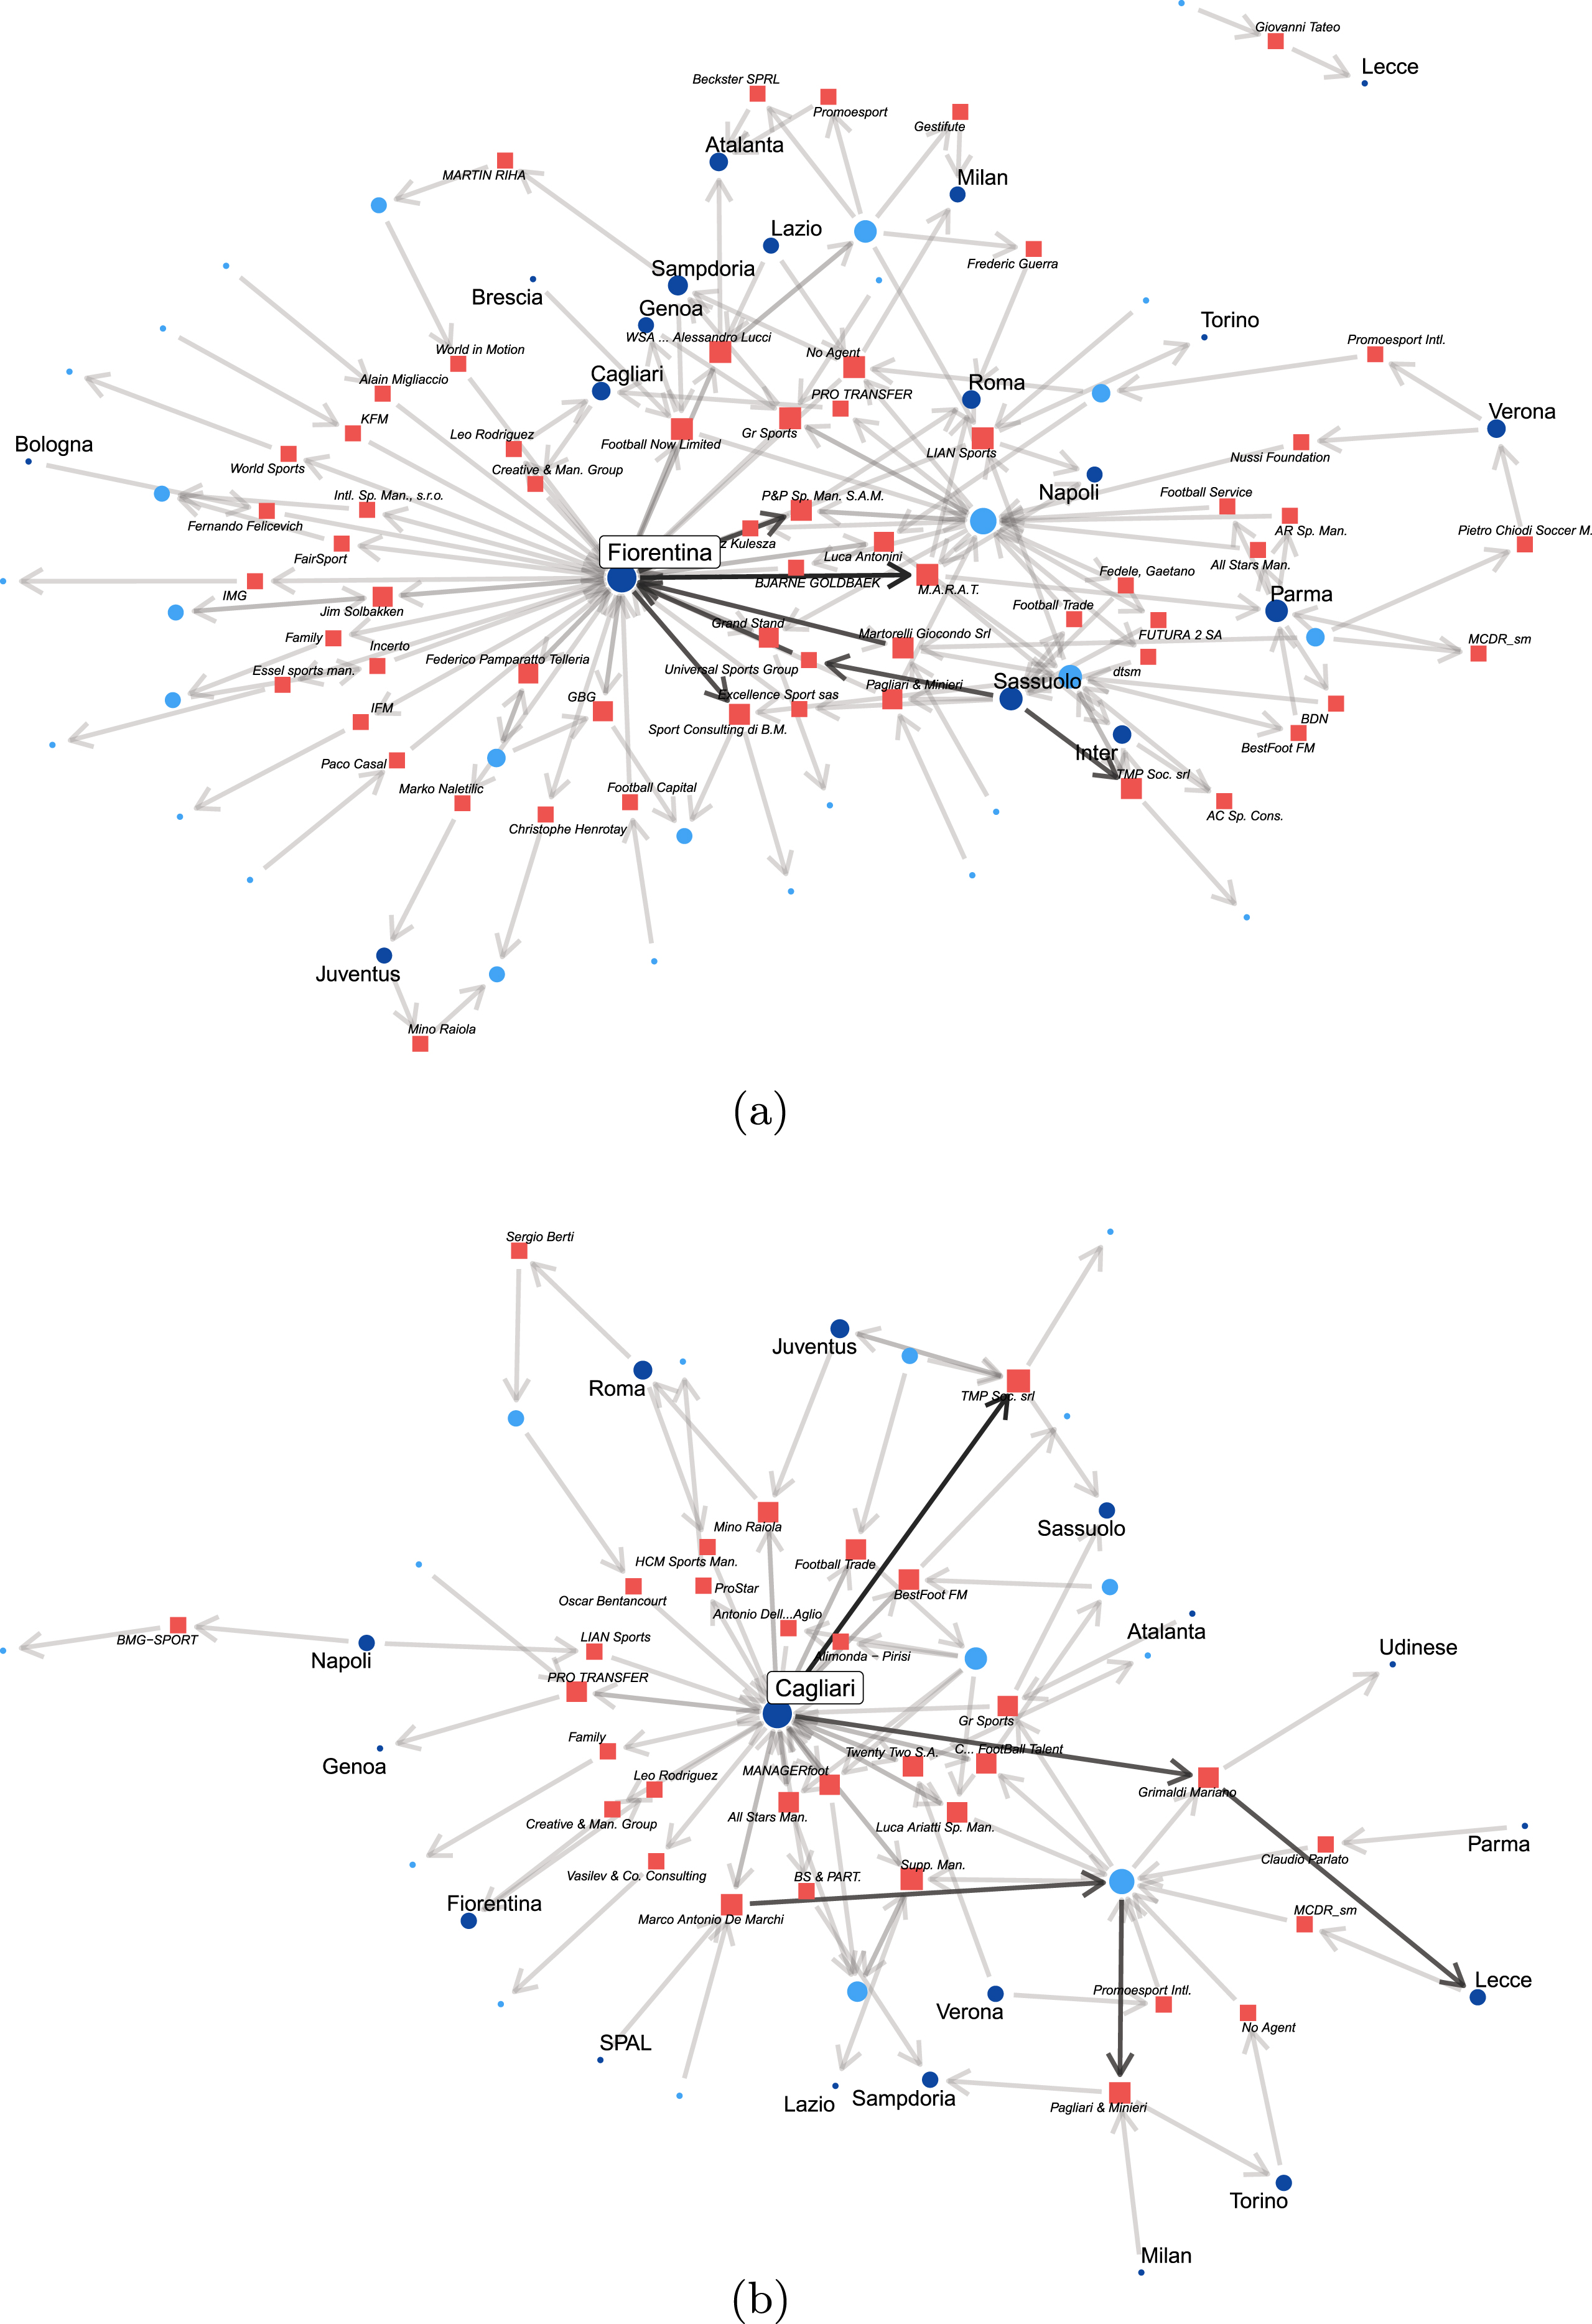
Fig. 13
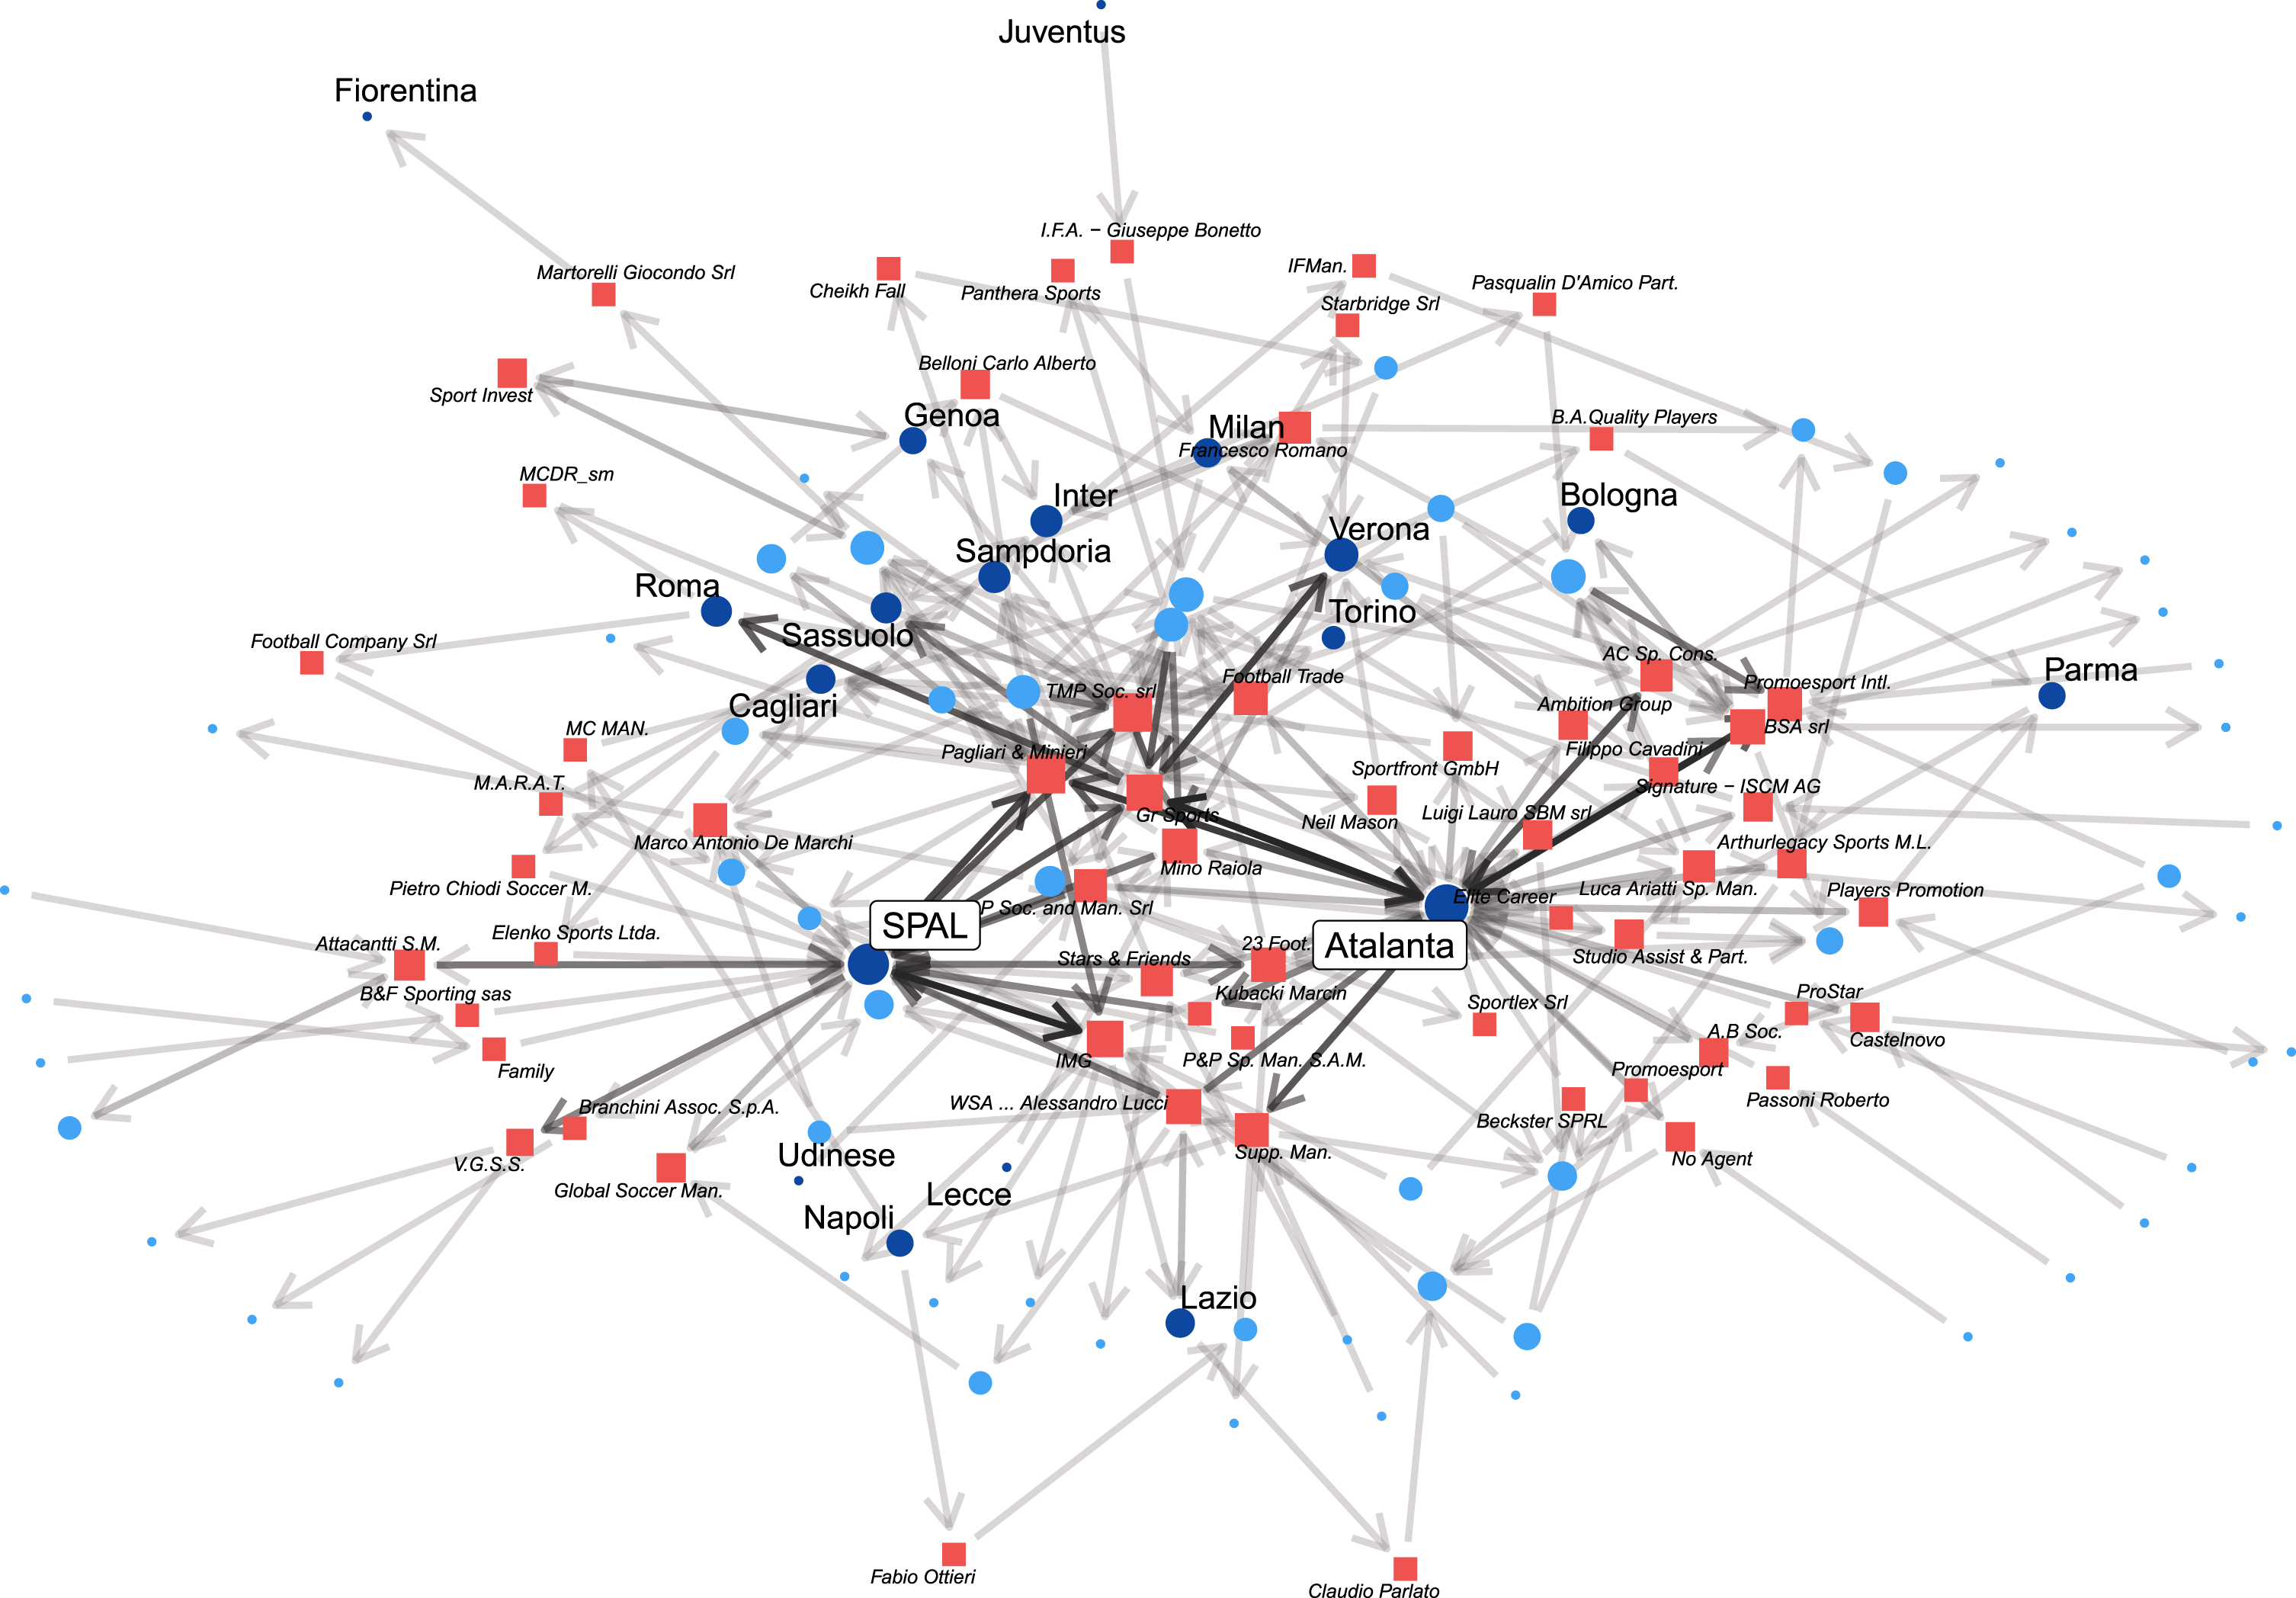
Focus on the transactions of the ATA-SPAL community.
4.3.1Focus on players’ characteristics
Regarding age (Fig. 6 - top panel) the players involved in the MIL, LAZ, and SAS communities are (on average) the youngest, although about 75% of players present an age lower than the general mean. Only two communities (LEC-BRE and UDI) share a median age (of inbound and outbound players) that is greater than the general mean. The community composed of the two promoted teams probably includes more experienced players, who are useful in facing a more competitive league.
Outliers depicted by black dots signify retired players or particular cases, e.g. the famous Italian goalkeeper Gianluigi Buffon (41 years old) who returned to Juventus after a year at Paris Saint-Germain. The youngest player in the Italian market is the forward Sebastiano Esposito (16 years old) of Inter.
4.3.2Focus on players’ role
The role of players seems to be relevant to characterizing the communities. This attribute can be strictly related to the composition of the team roster before the beginning of the market session and the style of play proposed by the coach. In what follows we summarize some evidence regarding the main four roles of footballers (see Fig. 7).
Goalkeepers 15% of inbound and outbound relationships in the TOR community concern the goalkeepers (the highest frequency of the 17 communities). Only 5% of the players involved in the communities of MIL and SAS are goalkeepers. The reason is that these teams have a stable first-choice goalkeeper during the seasons (i.e. Gianluigi Donnarumma and Andrea Consigli).
Defenders The majority of inbound and outbound movements of these players regard central defenders; this evidence can be exacerbated by observing communities generated by the teams of Bologna and Udinese. The former team has made a renewal of the defenders, while the line-up of the latter team usually involves three central defenders.
On the contrary, the community generated by Napoli exhibits the lowest percentage of (ingoing and outgoing) defenders. The CAG, INT, TOR, FIO, and JUV-GEN communities present a non-negligible percentage of fullbacks (right and left backs).
Midfielders The majority of movements in the 17 communities regard central midfielders (mid-wings or “box to box” players). The MIL community presents the highest frequency for these roles, while the lowest percentage can be observed for the community generated by the two newly promoted teams (LEC-BRE). INT and SAS exhibit a low percentage of operations for defensive midfielders, due to the presence of stable first-choice players in that role (e.g. Marcelo Brozovic and Manuel Locatelli, respectively).
Left and right midfielders (also denoted as side-midfielders) cover a lower portion of the market with respect to other midfielders. These players are often used in particular line-ups requiring footballers who are able to cover the entire side of the pitch both in a defensive and attacking way (especially in the case of three central defenders). Movements regarding these players are more frequent in ATA-SPAL and VER communities for the aforementioned reasons.
Forwards Central strikers are very relevant in the market session, in particular for their ability to score goals, especially compared to other players. These footballers are more frequent in communities generated by teams that usually include two forwards in the line-up, e.g. Inter, Lecce-Brescia, and Udinese, and less frequent in communities generated by teams that involve one central striker (e.g. Bologna and Sassuolo).
Right-wing forwards are a peculiarity of the LAZ community. In general, it can be noticed that, when the movements of a given community focus on right-wing forwards, the left wings are not very frequent. Two exceptions are represented by the NAP and PAR communities, especially due to the style of play shared by these teams, involving both right and left-wing forwards on the pitch.
For what concerns second strikers and behind-forwards, such movements are practically not observed in such communities (ATA-SPAL, NAP, UDI, JUV-GEN, LAZ). This is also related to the style of play of the teams generating these communities, which involve wing forwards rather than these particular roles.
4.3.3Focus on the type of transaction
Figure 8 illustrates the types of transactions for the 17 communities. As mentioned, the most frequent movements for all the communities are loans out, loans with fees, and returns from the loan, while regular transfers are less frequent. Moreover, communities are presenting a larger frequency of these types of transfers (approximately 1/3 of the total movements), such as BOL, MIL, and LEC-BRE. Nodes mostly involving free and retired players are included in the communities of VER and TOR, respectively.
4.3.4Focus on players’ agents
In Table 2 the main features that help to characterize the communities in terms of the relationships occurring between teams and agents are summarized. To this aim, the considered indices may help to identify the presence of an influence of the agents in the formation of commercial ties between teams. We excluded all the transfers in which the information about the agent is missing or the agent is a member of the player’s family.
Table 2
Main summary measures regarding agents involved in each community
| Gag |
| Tot | Top agents | fi | |
| ATA-SPAL | 0.47 | 0.0162 | 173 | Gr Sports (16) | 0.09 |
| SAS | 0.45 | 0.0236 | 110 | TMP SOCCER srl (19) | 0.17 |
| JUV-GEN | 0.36 | 0.0114 | 128 | Gr Sports (8) | 0.06 |
| PAR | 0.36 | 0.0138 | 117 | TMP SOCCER srl (8) | 0.07 |
| INT | 0.35 | 0.0211 | 68 | TMP SOCCER srl (8) | 0.12 |
| VER | 0.34 | 0.0155 | 112 | Gr Sports (11) | 0.10 |
| NAP | 0.33 | 0.0213 | 81 | G.E.V. Sport & management srl (8) | 0.10 |
| SAMP | 0.30 | 0.0165 | 72 | Gr Sports (4) | 0.06 |
| ROM | 0.30 | 0.0145 | 55 | Gr Sports (4) | 0.07 |
| LAZ | 0.28 | 0.0184 | 60 | Gestifute (5) | 0.08 |
| UDI | 0.28 | 0.0188 | 72 | P&P Sport Management S.A.M. (6) | 0.08 |
| CAG | 0.27 | 0.0243 | 53 | TMP SOCCER srl (5) | 0.09 |
| TOR | 0.27 | 0.0145 | 84 | Reset Group srl (5) | 0.06 |
| BOL | 0.26 | 0.0159 | 56 | Paco Casal (4) | 0.07 |
| FIO | 0.25 | 0.0126 | 87 | M.A.R.A.T. Football Management (4) | 0.05 |
| LEC-BRE | 0.25 | 0.0166 | 73 | TMP SOCCER srl (5) | 0.07 |
| MIL | 0.23 | 0.0170 | 38 | Castelnovo (3) | 0.08 |
Notes: Gini index of agents (Gag), averaged Betweenness centrality index of the agents (
Gini index Gag measures the level of concentration of the transactions with respect to the agents. High values indicate that most of the operations are managed by a few agents (up to the limit case of one agent), while low values indicate that many agents come into play (up to the limit case in which each operation is managed by a different agent). The betweenness centrality measures
For the considered communities the Gini index never reaches high scores, denoting a general tendency of the Serie A teams to negotiate players having different agents. This is a direct consequence of the high number of agents operating on the player market itself. However, Gini values for the ATA-SPAL and SAS communities (0.47 and 0.45, respectively) suggest that, in this context, several negotiations consist of a group of players assisted by the same agents.
For instance, some top agents play an important role in the community networks: Gr Sports and TMP SOCCER manage the highest number of negotiations in 10 of the 17 considered communities. In addition, such a role is more evident for the above-mentioned communities (ATA-SPAL and SAS), where Gr Sports and TMP SOCCER manage 16 and 19 transactions, respectively, which, in the specific case of SAS, represent about 17% of their total operations.
Figure 9 illustrates the information of the Gini index (Gag) and averaged betweenness (
The network of SAS presents high values for both Gini and Betweenness; it is possible to check in Fig. 11a that few agents are able to manage large groups of operations involving their clients (players). Moreover, some influential agents, i.e. TMP Soccer, act as intermediaries between different teams. They manage negotiations between Sassuolo and other teams that otherwise could be less likely to occur.
The opposite is true for the MIL community (Fig. 11b), where the few transactions (38) are managed by different agents (low concentration index) who, therefore, do not show a particularly high Betweenness nor a high fi.
The network of the FIO community (Fig. 12a) is a more striking example of this attitude. All three indicators Gag,
A combination of the maximum
Finally, the ATA-SPAL network topology (Fig. 13) reflects a cooperation pattern. Between Atalanta and SPAL there is a dense concentration of transactions based on common agents, including Gr Sports, TMP Soccer, and Pagliari & Minieri. Moreover, both teams present two of the most connected networks of agents.
4.3.5Focus on nationality and market value
Considering the players’ nationality, the highest frequency of transfers involving Italian players is found for the ATA-SPAL community (76.5%), confirming their consideration for the development of Italian (mainly youth) footballers. On the contrary, the UDI community shows the lowest frequency (30%) of Italian players, explained by its well-known tendency to buy/sell foreign players, given by their widespread organization of player scouts, and by their direct relationships with foreign teams (e.g., Brazilian players are the 12.5% total players in UDI community). Finally, we remark that Udinese shares the same property as the Watford team, competing in the English Premier League. This led to a sort of internal market. Other noteworthy connections with foreign players are found in the MIL community (here the Croatian players are the 11.5%), the CAG community (Croatian equal to 7.6%), and the ROM community, where players involved in the 7.5% are Argentinian.
Regarding the market value, INT and ROM share the highest median value (two million), followed by BOL (1.7 million) and UDI (1.5 million). According to the medians, lower market values can be found in the TOR (0.23 million), PAR (0.25 million), ATA-SPAL (0.30 million), and LEC-BRE (0.35) communities. The highest variability (in terms of interquartile range) is observed for ROM and MIL communities, while the lower can be viewed by the PAR community.
4.4Discussion
The present study considers more attributes in the same Network Analysis, namely, including information such as age, position, height, nationality, agent, market value, and type of transfer. From the methodological and technical point of view, since transfers of footballers involve at least two parts (three if we consider the agents), their natural representation is through the use of graph theory. Whenever it is more convenient to analyze dyadic properties instead of monadic ones, the methods of Network Analysis are particularly suitable. Beyond the role of individual teams within the market network, which can be identified by calculating one or more measures of different complexities, the analysis of the modular structure (meso-level) of this kind of network helps to discover any hidden market slices, direct relationships between teams or regularities in the market. This analysis is applied to the Serie A market session of the summer of 2019, the last that occurred before the pandemic became widespread, but it can be extended to other European (or international) championships or even to the overall worldwide player transfer market.
Two main objectives were established: (i) identify the centralities in the transfer market, and (ii) detect communities in the transfer market. Among other pieces of evidence, the main findings were that:
i) a core-periphery structure was found (interchanges within Serie A clubs, with more exclusive relationships with Serie B clubs);
ii) there is a greater tendency for an international transfer market to be polarised in European clubs and some specific American countries;
iii) within Serie A, communities were detected, namely, Atalanta-SPAL, Lecce-Brescia, and Juventus-Genoa;
iv) the impact of the agents appears to be relevant to the link formation between teams inside each community.
The use of community detection is driven by the hypothesis of the presence of two main scenarios: Serie A teams may tend to create their own market circle regardless of the other competitors or, under certain conditions, they may exhibit common attitudes and cooperate. According to our results, we identified 14 clubs forming 14 single communities and only 6 clubs forming 3 communities of 2 clubs. In particular, these three communities act as submarkets where two main behaviors arise. In the “newly promoted behavior”, Lecce and Brescia share a common market strategy. Their unique cluster highlights the tendency of these clubs to make transfers with the same teams (e.g. Genoa, Sassuolo, Crotone, and Palermo). As an opposite example, Verona (the third newly promoted) shows a heterogeneous community, denoting a strategy focused on setting up multiple partnerships. Moreover, Atalanta-SPAL and Juventus-Genoa communities identify an “head-to-tail behavior”, where the two Serie A teams have clearly two different seasonal expectations. For what concerns the former community, SPAL (a low-ranked team) shows a subordinate relationship with Atalanta (a top-ranked team), while the latter, Juventus-Genoa, presents a higher level of reciprocity, mainly due to their long-term market relationship. Furthermore, in each of the two communities, a relevant number of transfers involving the same agent can be observed. This is not verified for the Lecce-Brescia community. Finally, the 14 communities including a single Serie A team may indicate a high level of sport competition in Serie A. Each team prefers to establish exclusive agreements (the aforementioned bunches) with teams out of Serie A (mostly foreigners) to avoid favouring their rivals.
Considering the domestic and international networks presented in the current study (Fig. 2), some relevant findings were found related to the fact that, despite normal heterogeneities in indegree and outdegree, the core-periphery structure was evident. As an example, Atalanta was the team with a maximum commercial relationship (83), which resulted from great in- and outdegree levels. Besides these great ingoing and outgoing levels, a great number of transfers with a specific team was found (SPAL) as well as the interactions with common clubs between the elements of this community. This suggests that, despite a great number of transfers (which would imply connections with different nodes), it is clear there is a tendency to make transfers among the same circle of clubs, which constitutes a community in which players circulate over the peripheral clubs. This example, as do others found in this study (Lecce-Brescia, and Juventus-Genoa), confirms previous work comparing the big five leagues in which Serie A presented the greatest global clustering coefficient and generalized global clustering coefficient (Bond, et al., 2020).
One of the causes for this clustering and community strategy can be justified by the number of loans that occur between clubs. In the same study conducted using Network Analysis in the loan transfer market (Bond et al., 2020), it was evident that Italy more often uses strategies related to the loan of talented players than any other league. This can be supported by the evidence that organizations tend to establish specific collaborations and form communities in closed triads (Wäsche, 2015). Possibly, the fact of a loan involving a process of trust in the correct development of the talented player demands a closer relationship and less dispersion across a wide number of clubs (Abbott & Clifford, 2021). Although no substantial amount of money can be exchanged in loans, the functionality of the system requires the loan as a way to strengthen the value of the players and a possible way to ensure close relationships between organizations in the transfer market (Liu, et al., 2016). In these market dynamics, one should not underestimate the intermediary role that agents can play; this aspect would need further investigation.
Some practical implications emerge from the analysis.
1. It is possible to unveil the market strategies and therefore distinguish between winning and unsuccessful strategies after observing the football outcome (e.g. the final or the intermediate ranking). An example can be represented by the three newly promoted teams, where Verona finished the season 2019-2020 in the ninth place and Lecce and Brescia were relegated to the second division (Serie B). It is worth noticing that there may be exogenous factors that influence the market trends and, consequently, the results. The roster-building phase is a project that often lasts years, and can be influenced by several determinants that are beyond the scope of the paper.
2. Similar strategies and close collaborations among the considered teams arise. For instance, we observed that Atalanta and SPAL are pursuing a similar market strategy on a different scale, mainly due to their different economic resources and their different experience in elite football.
3. The knowledge of market behaviors can help a football club to develop and/or its own strategy from a competitive perspective. In addition, a team can decide to change or modify its market behavior inspired by other good practices. For instance, a market session associated with good sports outcomes can also avoid a team to spend more resources in the winter market session.
The present study is not without limitations. Firstly, as described above, the division of the network into groups is delineated by the type of activity or market segment related to the team strategies, but from this analysis, it is not directly possible to identify all the reasons that led a team to trade a certain player. Scouting staff, the level of infrastructure, the development of the youth teams’ and the economic level of the club itself may also play key roles in better understanding the market mechanisms. Secondly, the analysis is cross-sectional and limited to the summer market session of one season (2019-2020). A possible alternative approach could be to aggregate several market sessions in a whole network. However, in this way, the temporal nature of the data is not taken into account. In this sense, temporal networks have been applied in recent years (Matesanz et al., 2018) to analyze the dynamics of relationships between teams. In the present paper, for the sake of clarity, we selected one market session taking place before the spreading of Covid-19 because the pandemic may be affected the player market sessions (Parnell, Bond, Widdop & Cockayne, 2021) starting from the spring and the summer of 2020. The study of the effect of the Covid-19 pandemic on player market sessions could be a topic for further contributions. Thirdly, the topological properties of the network may be modeled altogether to identify what are the key features (i.e. agents’ effect) that increase the probability of creating such links in the market networks. To overcome the third limitation, Exponential Random Graph Models (ERGMs) (Robins et al., 2007) may represent suitable tools with which to make inferences using data from the football market sessions (Xu, 2021). Finally, the transfer type (attribute of the edge) deserves a more in-depth analysis to provide a taxonomy of different strategies (Feuillet et al., 2020).
Moreover, further extension of this work can consider the application of temporal networks, in particular, to establish the association between network properties and team performance (Matesanz et al., 2018) A more detailed analysis of the network structure, the market values of the players, and the type of transaction could also be useful to supervisory bodies to detect any anomaly operations. Even more, if the boundaries of the network are extended to all teams of Italian professional football (i.e. including Serie B and Serie C).
5Concluding remarks
This study focused on identifying the transfer market patterns occurring in Italy’s First Division (Serie A) of men’s football during the summer of 2019. From analyzing the network at the node level, there is a wide gap in terms of the number of market operations and commercial relationships between teams (e.g. Atalanta and Brescia). The same applies to the Hub and Authority scores, which denote the use of different market strategies.
Looking at the overall network, a core-periphery structure is induced by the exclusiveness of some relationships occurring between each Serie A team and other teams. This is also a key factor in the definition of the community structure of the network. Indeed, almost each Serie A team is included in a single community, except for Atalanta-SPAL, Juventus-Genoa, and Lecce-Brescia.
From a descriptive point of view, for each community, it can be noticed that the majority of the transactions involve young players (sometimes with no experience in the first division), generally loaned out. Moreover, the distribution of the type of transaction shows no relevant differences among communities. On the contrary, the distribution of the role of traded players varies between the communities, depending on the style of play adopted by the coach of the Serie A team in question.
Starting from the results of this work, it is worth noticing that, at the community level, agents often cover a fundamental role in the network formation process. Agents, acting as a buffer between players and clubs, through their leverage over contract negotiations can manipulate the sports business and may significantly influence the whole transfer market (Poli & Rossi 2012). From a network perspective, different hypotheses, such as those formulated in Rossi et al. (2016), should be empirically investigated through bipartite networks.
Acknowledgements
The authors would like to thank the anonymous reviewers for their careful reading of our manuscript and their many insightful comments and suggestions.
References
[1] | Abbott, W & Clifford, T. (2021) , Professional academy soccer players’ perceived experiences of loan environments, Soccer Soc, 1–22. |
[2] | Baroncelli, A & Lago, U. (2006) , Italian football, Journal of Sports Economics 7: (1), 13–28. |
[3] | Batagelj, V , Doreian, P , Ferligoj, A & Kejzar, N. (2014) , Understanding large temporal networks and spatial networks: Exploration, pattern searching, visualization and network evolution, Vol. 2: , John Wiley & Sons. |
[4] | Bernardo, G , Ruberti, M & Verona, R. (2021) , Image is everything! professional football players’ visibility and wages: Evidence from the italian serie a, Appl Econ, 1–20. |
[5] | Bond, A.J , Widdop, P & Chadwick, S. (2018) , Football’s emerging market trade network: Ego network approach to world systems theory, Manag Sport Leis 23: (1-2), 70–91. |
[6] | Bond, A.J , Widdop, P & Parnell, D. (2020) , Topological network properties of the european football loan system, Eur Sport Manag Q 20: (5), 655–678. |
[7] | Carmichael, F , Rossi, G & Thomas, D. (2017) , Production, efficiency, and corruption in italian serie a football, J Sports Econom 18: (1), 34–57. |
[8] | Clemente, F.M , Martins, F.M.L , Mendes, R.S. et al. (2016) , Social network analysis applied to team sports analysis. Springer. |
[9] | Doreian, P , Batagelj, V & Ferligoj, A. (2004) , Generalized Blockmodeling, Structural Analysis in the Social Sciences, Cambridge University Press. |
[10] | Félix, L.G , Barbosa, C.M , Vieira, V.D.F & Xavier, C.R. (2019) , A social network analysis of football with complex networks, in ‘Anais Estendidos do XXV Simpósio Brasileiro de Sistemas Multimídia e Web, SBC, pp. 47–50. |
[11] | Feuillet, A , Terrien, M , Scelles, N & Durand, C. (2020) , Determinants of coopetition and contingency of strategic choices: The case of professional football clubs in france, Eur Sport Manag Q, 1–16. |
[12] | Fortunato, S. (2010) , Community detection in graphs, Phys Rep 486: (3-5), 75–174. |
[13] | Freeman, L.C. (1978) , Centrality in social networks conceptual clarification, Soc Networks, 215–239. |
[14] | Ghio, A , Ruberti, M & Verona, R. (2019) , Financial constraints on sport organizations’ cost efficiency: The impact of financial fair play on italian soccer clubs, Appl Econ 51: (24), 2623–2638. |
[15] | Grund, T.U. (2012) , Network structure and team performance: The case of english premier league soccer teams, Soc Networks 34: (4), 682–690. |
[16] | Guimera, R & Amaral, L.A.N. (2005) , Functional cartography of complex metabolic networks, Nature 433: (7028), 895–900. |
[17] | Huffman, D.A. (1952) , A method for the construction of minimum-redundancy codes, Proceedings of the IRE 40: (9), 1098–1101. |
[18] | Ievoli, R , Palazzo, L & Ragozini, G. (2021) , On the use of passing network indicators to predict football outcomes, Knowl Based Syst, 106997. |
[19] | Kleinberg, J.M , Newman, M , Barabási, A.-L & Watts, D.J. (2011) , Authoritative sources in a hyperlinked environment, Princeton University Press. |
[20] | Lee, S , Hong, I & Jung, W.-S. (2015) , A network approach to the transfer market of european football leagues, New Physics: Sae Mulli 65: (4), 402–409. |
[21] | Li, M.-X , Zhou, W.-X & Stanley, H.E. (2019) , Network analysis of the worldwide footballer transfer market, EPL 125: (1), 18005. |
[22] | Liu, X.F , Liu, Y.-L , Lu, X.-H , Wang, Q.-X & Wang, T.-X. (2016) , The anatomy of the global football player transfer network: Club functionalities versus network properties, PLoS One 11: (6), e0156504. |
[23] | Lombardi, R , Trequattrini, R , Cuozzo, B & Paoloni, P. (2020) , Knowledge transfer in the football industry: A sectorial analysis of factors and determinants, Manag Decis. |
[24] | Matesanz, D , Holzmayer, F , Torgler, B , Schmidt, S.L & Ortega, G.J. (2018) , Transfer market activities and sportive performance in european first football leagues: A dynamic network approach,, PloS One 13: (12), e0209362. |
[25] | McGovern, P. (2002) , Globalization or internationalization? foreign footballers in the english league, Sociology 36: (1), 23–42. |
[26] | Molodchik, M , Paklina, S & Parshakov, P. (2021) , Peer effects on individual performance in a team sport, Journal of Sports Economics 22: (5), 571–586. |
[27] | Neri, L , Russo, A , Di Domizio, M & Rossi, G. (2021) , Football players and asset manipulation: The management of football transfers in italian serie a, Eur Sport Manag Q, 1–21. |
[28] | Newman, M.E. (2018) , Networks, Oxford University Press. |
[29] | Newman, M.E & Girvan, M. (2004) , Finding and evaluating community structure in networks, Phys Rev E 69: (2), 026113. |
[30] | Nolasco, C. (2019) , Player migration in portuguese football: A game of exits and entrances, Soccer Soc 20: (6), 795–809. |
[31] | Parnell, D , Bond, A.J , Widdop, P & Cockayne, D. (2021) , Football worlds: Business and networks during covid-19, Soccer & Society 22: (1-2), 19–26. |
[32] | Parnell, D , Bond, A.J , Widdop, P , Groom, R & Cockayne, D. (2021) , Recruitment in elite football: A network approach, Eur Sport Manag Q, 1–17. |
[33] | Poli, R. (2010) a, ‘Agents and intermediaries’, Managing Football: An International Perspective. Oxford: Butterworth Heinemann, pp. 201–216. |
[34] | Poli, R. (2010) b, Understanding globalization through football: The new international division of labour, migratory channels and transnational trade circuits, International Review for the Sociology of Sport 45: (4), 491–506. |
[35] | Poli, R & Rossi, G. (2012) , Football agents in the biggest five European football markets: An empirical research report, CIES Football Observatory Neuchâtel. |
[36] | Robins, G , Pattison, P , Kalish, Y & Lusher, D. (2007) , An introduction to exponential random graph (p*) models for social networks, Soc Networks 29: (2), 173–191. |
[37] | Rossi, G , Semens, A & Brocard, J.F. (2016) , Sports agents and labour markets: Evidence from world football, Routledge. |
[38] | Rosvall, M & Bergstrom, C.T. (2008) , Maps of random walks on complex networks reveal community structure, Proceedings of the National Academy of Sciences 105: (4), 1118–1123. |
[39] | Sæbø, O.D & Hvattum, L.M. (2019) , Modelling the financial contribution of soccer players to their clubs, Journal of Sports Analytics 5: (1), 23–34. |
[40] | Sefton, P. (2015) , The european club footballing landscape, Technical report, UEFA Club Licensing and Financial Fair Play Unit. Also available as, https://www.uefa.com/multimediafiles/download/tech/uefaorg/general/02/42/27/91/2422791_download.pdf. |
[41] | Shannon, C.E. (1948) , A mathematical theory of communication, The Bell System Technical Journal 27: (3), 379–423. |
[42] | Taylor, M. (2006) , Global players? football, migration and globalization, c. ’, HIST SOC RES, 7–30. |
[43] | Velema, T.A. (2021) , Globalization and player recruitment: How teams from european top leagues broker migration flows of footballers in the global transfer network, Int Rev Sociol Sport 56: (4), 493–513. |
[44] | Wakelam, E , Steuber, V & Wakelam, J. (2022) , The collection, analysis and exploitation of footballer attributes: A systematic review, Journal of Sports Analytics 8: (1), 1–37. |
[45] | Wäsche, H. (2015) , Interorganizational cooperation in sport tourism: A social network analysis, Sport Manage Rev 18: (4), 542–554. |
[46] | Wasserman, S & Faust, K. (1994) , Structural Analysis in the Social Sciences, Social Network Analysis: Methods and Applications, Cambridge University Press. |
[47] | Xu, Y. (2021) , The formation mechanism of the player transfer network among football clubs, Soccer Soc 22: (7), 704–715. |
[48] | Yin, R.K. (1994) , Discovering the future of the case study. method in evaluation research, Evaluation Practice 15: (3), 283–290. |
[49] | Ziberna, A. (2007) , Generalized blockmodeling of valued networks, Soc Networks 29: (1), 105–126. |
Notes
1 Note for the U.S. audience: in this paper footballers are intended to be the soccer players, not to be confused with the NFL players.
3 These communities are labeled as follows: Bologna (BOL), Cagliari (CAG), Fiorentina (FIO), Inter (INT), Lazio (LAZ), Milan (MIL), Napoli (NAP), Parma (PAR), Roma (ROM), Sampdoria (SAMP), Sassuolo (SAS), Torino (TOR), Udinese (UDI) and Verona (VER).


