
Randomness, uncertainty, and the optimal college football championship tournament size
Abstract
Every year, there is a popular debate over how many teams should take part in the NCAA’s FBS-level college football championship tournament, and especially whether it should be expanded from 4 teams to 8 or even 12. The inherent tradeoff is that the larger the tournament, the higher the probability that the true best team is included (“validity”), but the lower the probability that the true best team will avoid being upset and win the tournament (“effectiveness”). Using simulation based on empirically-derived estimates of the ability to measure true team quality and the amount of randomness inherent in each game, we show that the effect of expanding the tournament to 8 teams could be very small, an effectiveness decrease of only 2-3% while increasing validity by 1-4%, while a 7-team tournament provides slightly better tradeoffs. A 12-team tournament would decrease effectiveness by 5-6%.
1Introduction
In 2012, the National Collegiate Athletic Association (NCAA) approved using a four-team postseason playoff tournament to determine a national champion in college football at the FBS level (the highest level of intercollegiate competition), starting in 2014. The decision effectively doubled the number of teams involved in the postseason tournament, and there was immediate discussion, which has continued through now, about whether an 8-team tournament (or larger) would be even better. In this paper, we address the question of the optimal size of this postseason tournament.
Each year since at least 1936, a national champion has been chosen among FBS (formerly Division I-A) college football teams. Initially, the champion was chosen by polls of experts. These expert polls included the Associated Press (AP) poll of sportswriters (the first major national poll) from 1936 to 1997, and various polls of coaches from 1950 to 1997 (e.g., United Press International from 1950 to 1990, USA Today/CNN from 1991 to 1996, and USA Today/ESPN in 1997). The highest-ranked team in the polls was declared national champion; in the few years that the AP and coaches’ polls disagreed, the national championship was shared between the two polls’ winners (National Collegiate Athletic Association). In 1998, a new system, the Bowl Championship Series (BCS), was created. In the BCS, expert poll rankings and analytical rankings (called “computer rankings”) were combined to determine a ranking of the top teams. From 1998 to 2005, the BCS-designated national champion was unofficial (and for the 2003 season, the AP poll chose a different champion). From 2005 to 2013, the top two teams in the BCS played in a designated postseason game, with the winner being named the official national champion (National Collegiate Athletic Association). Beginning in 2014, a new system has been in place: A panel of experts selects four teams to play a three-game, two-round single-elimination tournament, the winner of which is named national champion.
The progression from polls (effectively a one-team tournament) to the BCS championship game (a two-team tournament) to a four-team tournament has been motivated partly by economics (the paid attendance and television revenue of playoff games is substantial), but even more so by a grassroots feeling that it is necessary to determine a champion “on the field” (i.e., by playing games) rather than by poll or computer, because neither voters nor algorithms are guaranteed to identify the absolute best team(s). Before the BCS system, the top teams in the polls rarely played each other at the end of the season, and it could be difficult to differentiate between the best teams. The novelty of the BCS system was that the two highest-ranked teams were guaranteed to play each other at the end of the season, and the argument in favor of having even more teams in the championship tournament is that even the top two can be difficult to differentiate from a larger set of very good teams so letting the teams play each other is the most fair way to sort out which one is really the best. (Even in the BCS system, there could be significant disagreement as to the selection of the two playoff teams, for example in 2004 when three major-conference teams (USC, Oklahoma, and Auburn) each won all of their regular-season games.)
On the other hand, the outcomes of sporting events contain enough randomness that the winner of a game is not necessarily the better team, and it is possible that a committee, although it might make mistakes, could have a higher probability of correctly identifying the best team than playoff games that are subject to football’s inherent randomness. Today’s tournament selection committee has two advantages over polls of the past: better information (many more games are televised to a national audience, video recording/playback capability allows them to see multiple games that are played at the same time, and more and deeper statistical information is available about teams and players) and better analytics (many of the top quantitative rating and evaluation systems were not developed in the polling era). As a result, the playoff selection committee is likely to have a smaller error in its evaluation of teams than polls had in the past. The progression of tournament size has actually been opposite what intuition might suggest is optimal: As human experts have been given the tools to make better judgments and decrease their likelihood of error, the tournament size has expanded, increasing the chance that a team correctly identified as the best by the human experts will fail to win the tournament.
In this paper, we investigate the optimal size of the college football national championship tournament by taking into account the relative magnitudes of the randomness inherent in college football and the errors in team evaluation by humans and algorithms.
2Literature review
Optimal tournament design has been studied before, but none of the existing literature is sufficient to answer our research question. One main stream of optimal tournament size research (e.g., Dizdar 2013; Fullerton and McAfee 1999) has focused on the issue of effort, especially in research tournaments. Given assumptions on the technology and knowledge available to each firm that might enter a research competition, and on their probabilities of winning, these papers use game-theoretic models to estimate how much effort each competitor would spend, and use that analysis to determine the optimal number of participants, how to select participants, etc. Others (e.g., Chen, Ham, and Lim 2011; Hochtl et al. 2010; Sheremeta and Wu 2012) try to empirically test such predictions. These papers all start with the basic assumption that firms have more than one way to spend effort, so they might choose to put forth less effort in competitions where they are less likely to win (and thus a firm that is likely to succeed might also not need to put in maximum effort). In our work, we sidestep this issue, presuming that every team in a national championship tournament has just one football goal (to win the tournament) and will put forth maximum effort.
A second stream of research in designing optimal tournaments is not the composition, but rather the structure. Glenn (1960), Marchand (2002), Scarf and Bilbao (2006), and Seals (1963), among others, compare different tournament setups such as round-robin, pure knockout, and hybrids. In our work, we assume that the NCAA will retain its single-elimination (knockout) round-based format. Glickman (2008), Hwang (1982), and Schwenk (2000) look at adaptive approaches where tournaments may be re-seeded between rounds; in our work, we assume that the NCAA will not re-seed, so fans can make travel plans in advance (as is the case currently for the existing 68-team NCAA basketball tournament).
Other research, assuming a non-reseeded knockout tournament, looks at the optimality of the standard seeding of teams into tournament slots. Appleton (1995), Groh et al. (2012), Jennessy and Glickman (2016), Horen and Riezman (1985), Ryvkin (2005), and Vu (2010) investigate how to seed teams so that various objectives are optimized. For example, Horen and Riezman (1985) show that under some assumptions about team strength and head-to-head win probability, for a 3-round, 8-team tournament the standard seeding method does not maximize the probability that the best team will win. Jennessy and Glickman (2016) show the same empirically for 16-team tournaments, using a Bayesian approach that considers uncertainty in team strength. However, we assume that the NCAA will retain standard seeding, to retain fairness properties that Vu (2010) calls envy-freeness (that in every round, each team’s best-possible opponent must be weaker than the best-possible opponent of all lower-seeded teams) and delayed confrontation (that the top 2k teams may not play each other until only 2k or fewer teams remain in the tournament). We also assume that the NCAA will start every game with the standard 0-0 score, rather than giving one team some initial points based on an estimate of how much better they are than their opponent, as in the approach of Paine (2014).
The objective function when referring to an “optimal” tournament can be defined in different ways. Most research assumes a goal of maximizing the probability that the tournament winner will be the best team (Appleton 1995; David 1988; Glenn 1960; Glickman 2008; Jennessy and Glickman 2016; Hwang 1982; Marchand 2002; Schwenk 2000; Seals 1963; Vu 2010); others maximize the probability that the winner will be a certain team (Vu 2010), maximize the quality of the winner’s result in research tournaments (Dizdar 2013; Fullerton and McAfee 1999), minimize the fraction of unimportant games (Scarf and Bilbao 2006; Scarf and Shi 2008), maximize the average rank of the winner (Scarf and Bilbao 2006), maximize the average revenue of the tournament (Vu 2010), maximize the probability of the top two teams meeting in the final (Jennessy and Glickman 2016), maximize the consistency between expected number of wins and team strength (Jennessy and Glickman 2016), etc. Sokol (2010) also considered the number of significant upsets in a tournament as a driver of fan interest. In this paper, we consider two objectives. The primary objective is the probability of correctly identifying the best team, i.e., the probability that the best team wins the tournament; we refer to this as the effectiveness of the tournament. We also discuss secondarily the probability that the best team is selected to play in the tournament; we refer to this as the tournament’s validity.
Finally, and critically for our work, in the previous literature the information about each team, including its strength relative to competing teams, is almost always assumed to be known deterministically. Of all the work cited above, only Glickman (2008) and Jennessy and Glickman (2016) consider uncertainty in the strength of each team; their Bayesian models address how to seed (Jennessy and Glickman 2016) or re-seed (Glickman 2008) a tournament, not how many teams should be included.
So, none of the existing literature exactly addresses the question of how many teams should be in a tournament like the college football championship given both uncertainty in team strength estimation and randomness of game results.
The remainder of the paper is organized as follows: In Section 3, we describe our underlying models of the uncertainty and randomness in the system. In Section 4, we discuss how we populate our model with empirical data and simulate tournament results. Section 5 discusses parameterizing by the relative magnitudes of randomness and uncertainty, and we use the method of Curry and Sokol (2016) to estimate those current relative magnitudes and their effects on tournament outcomes. Finally, in Section 6 we show the simulation results, and in Section 7 we discuss the implications of our work for the optimal size of the national college football championship tournament and conclude with some final remarks.
3Models
In this section, we describe the core model. Here and in the remainder of the paper, we refer to a random variable by an uppercase letter and a specific realization of it by the corresponding lowercase letter (e.g., a would be a single draw from the random variable A).
We let g = (t1, t2) denote a college football game between teams t1 and t2, where the pair of teams is ordered lexicographically. Let
(1)
In other words, in the absence of randomness, team t1 would beat team t2 by
Of course, true team strengths
(2)
We assume that for each observer i, the values of
When teams t1 and t2 play each other in a game g on a neutral field, as is the case in the postseason tournament, the margin of victory predicted by observer i will be
(3)
The outcome of a game is assumed to be based on a random process; even a perfect observer (for whom
(4)
R includes all of the random factors that might affect the outcome of a football game, such as day-to-day performance variation, weather, the direction a loose ball bounces on the ground, etc. We assume that the values of r are independent and identically distributed across games, and that the distribution of
In reality, there is no data to tell us true team strengths sTrue. Rearranging terms in Equation (3) and solving for
(5)
Thus, for game g, observer i’s prediction error
(6)
There are a variety of observers who publish their estimates of team strengths s. In this paper, we first demonstrate the model using the Sagarin ratings from Sagarin as the observer, for two reasons: availability and quality. End-of-season ratings1 for each college football team are available in the format we need (where the difference between two teams’ ratings is the estimate of the margin of victory in a game between those teams) for all years from 1998-2019 (we omit 2020 because of the different schedules and playing conditions in the COVID year), and the empirical standard error in the Sagarin ratings’ margin-of-victory predictions (i.e., the observations of xSag) is less than a point higher than that of the Las Vegas betting line, a common standard for game prediction quality.
As we note in Section 4, both the Sagarin ratings’ predictions LSag and the Las Vegas line LVegas have normally-distributed errors XSag and XVegas with means that are not significantly different from zero. Others have also noted and/or used this normal distribution in football (e.g. Gill 2000; Berry 2003; Fanson 2020). Since X is empirically shown to be normally distributed with mean zero, we make the mild assumption that its components E (error in team-strength estimates) and R (in-game randomness) are also both normally distributed and all independent of each other, with variances
(7)
so
(8)
The fraction of the variance in Xi that is attributable to error in team strength estimates (
4Simulating tournaments
Our tournament simulation has four basic steps:
1. Draw observed team strengths sObs for each team from an empirical distribution of historical ratings. The observed team strengths correspond to the opinions of the tournament selection committee, so the teams chosen for the tournament and their seeding in the tournament are based on the observed team strengths.
2. Generate true team strengths sTrue for each team based on the observed team strength and a randomly-generated observation error from the distribution of E. The sTrue are the teams’ actual strengths, so game outcomes in the simulated tournaments are based on these.
3. Seed the tournament based on observed team strengths sObs.
4. Simulate the winner and loser of each tournament game based on true team strengths sTrue and in-game randomness R.
Types of simulated tournaments
There are four types of tournament setups that we simulate. In some, like the current football playoff system, the top (observed) teams are the tournament participants regardless of whether or not they are champions of their conferences. We refer to this type of tournament as a fully-open tournament. Another approach, like the current NCAA basketball tournament system, is to guarantee participation to conference champions regardless of their ranking. We refer to this type of tournament as a partially-open tournament. For football, most proposals have been to guarantee a spot in the tournament only to winners of the “Power Five” conferences: the Atlantic Coast Conference (ACC), Big 12 Conference (Big 12), Big Ten Conference (Big Ten), Pac-12 Conference (Pac-12), and Southeastern Conference (SEC).
Some proposed tournament setups have included guaranteeing that the highest-ranked non-Power-Five team would be included in the tournament. This guarantee could be included in both fully-open and partially-open tournaments, yielding the full set of four tournament types that we test (see Table 1). The non-Power-Five teams are from the American Athletic Conference (AAC), Conference USA (C-USA), Mid-American Conference (MAC), Mountain West Conference (MWC), and Sun Belt Conference (Sun Belt), which collectively are called the “Group of Five” conferences, plus any teams that are independent (not playing in a conference, but part of the FBS; in our simulations we do not include Notre Dame in this category because they are viewed like a Power-Five team, and in fact they play in a Power-Five conference for non-football sports).
Table 1
Tournament types tested
| Tournament type | Tournament size k | Description |
| Fully-open | 1 ≤ k ≤ 128 | k highest-ranked teams regardless |
| of conference affiliation and conference champion status | ||
| Fully-open with non-Power-Five guarantee | k = 1 | Highest-ranked non-Power-Five team |
| 2 ≤ k ≤ 128 | Highest-ranked non-Power-Five team, and | |
| k - 1 highest-ranked other teams | ||
| Partially-open | 1 ≤ k ≤ 5 | k highest-ranked Power-Five conference champions |
| 6 ≤ k ≤ 128 | All five Power-Five conference champions, and | |
| k - 5 highest-ranked other teams | ||
| Partially-open with non-Power-Five guarantee | 1 ≤ k ≤ 5 | k highest-ranked teams from among the |
| highest-ranked non-Power-Five team and | ||
| the Power-Five conference champions | ||
| k = 6 | All five Power-Five conference champions, and | |
| highest-ranked non-Power-Five team | ||
| 7 ≤ k ≤ 128 | All five Power-Five conference champions, and | |
| highest-ranked non-Power-Five team, and | ||
| k - 6 highest-ranked other teams |
Because we are going to compare different types of tournaments as well as tournament sizes, we split the process into two parts. In each run of the simulation, we first generate a set of teams with observed and real strengths, using Steps 1 and 2. Then, we simulate each type and size of tournament using Steps 3 and 4. We next describe in more detail each of the steps.
Drawing observed team strengths
We use Sagarin rating data for the past eleven years, 2009-2019, as the set of empirically observed team ratings (we use only ratings for teams in the NCAA’s FBS). There were 120 FBS teams in 2009-2011, 124 in 2012, 125 in 2013, 128 in 2014-2016, and 130 in 2017-2019. The ratings varied from a high of 105.35 (Clemson in 2016) to a low of 30.72 (Massachusetts in 2019). The overall distribution of ratings passes the Anderson-Darling and Kolmogorov-Smirnoff tests for normality, but we observed that the tails are not quite a good fit in the normal probability plot. Because the behavior of the upper tail (i.e., the best teams) is a primary focus of this paper, we therefore chose to not model the observed ratings with a normal distribution; instead, we used the eleven years (1383 data points) of Sagarin data as an empirical distribution. Tables 10, 11, and 12 in Appendix 1 show the full set of Sagarin ratings from 2009 to 2019.
For partially-open tournaments, it is important to know which teams are the Power-Five conference champions and which is the top-rated non-Power-Five team. Therefore, we keep that data separate, and draw from those empirical distributions separately. Tables 13 and 14 show the Power Five conference champions and top-rated non-Power-Five teams from 2009-2019.
For each of the simulated data sets (one for each run of the simulation), we draw
Generating true team strengths
To simulate games in a tournament, we need each team’s true strength
Given the set of observed team strengths, we use a conditional probability approach to randomly generate true team strengths. The normality of the overall distribution of Sagarin ratings allows us to model the distribution of team observed strength SObs as the sum of independent draws from two iid normal distributions: the true strength STrue (a normal distribution with mean μSag and variance
In Appendix 3, we show that STrue|SObs is normally distributed, according to
(9)
In Equation (9), μSag and
For a single value of
Seeding the tournament
Because there are approximately 128 teams playing FBS-level football each year, and 128 is a convenient power of 2 for a single-elimination tournament, we use 128-team tournaments in our simulations. In a full 128-team tournament, the teams are seeded into a 7 round single-elimination structure, in order of observed rating. In the first round, the ith-highest-rated team plays against the (27 - i + 1)th-highest-rated team, for every i = 1, …, 27. In subsequent rounds, previous-round winners are matched so that, if higher-rated teams always win, the sum of the ranks of teams playing against each other in round r would always equal 27-r+1 + 1; otherwise, a lower-rated team that beats a higher-rated team would take the higher-rated team’s place in the next round. Figure 1 shows the structure of a 3-round size-8 tournament as an example. This is a common structure for single-elimination tournaments (for example, it is used in the NCAA basketball championship tournament).
Fig. 1
Structure of a 3-round size-8 tournament.
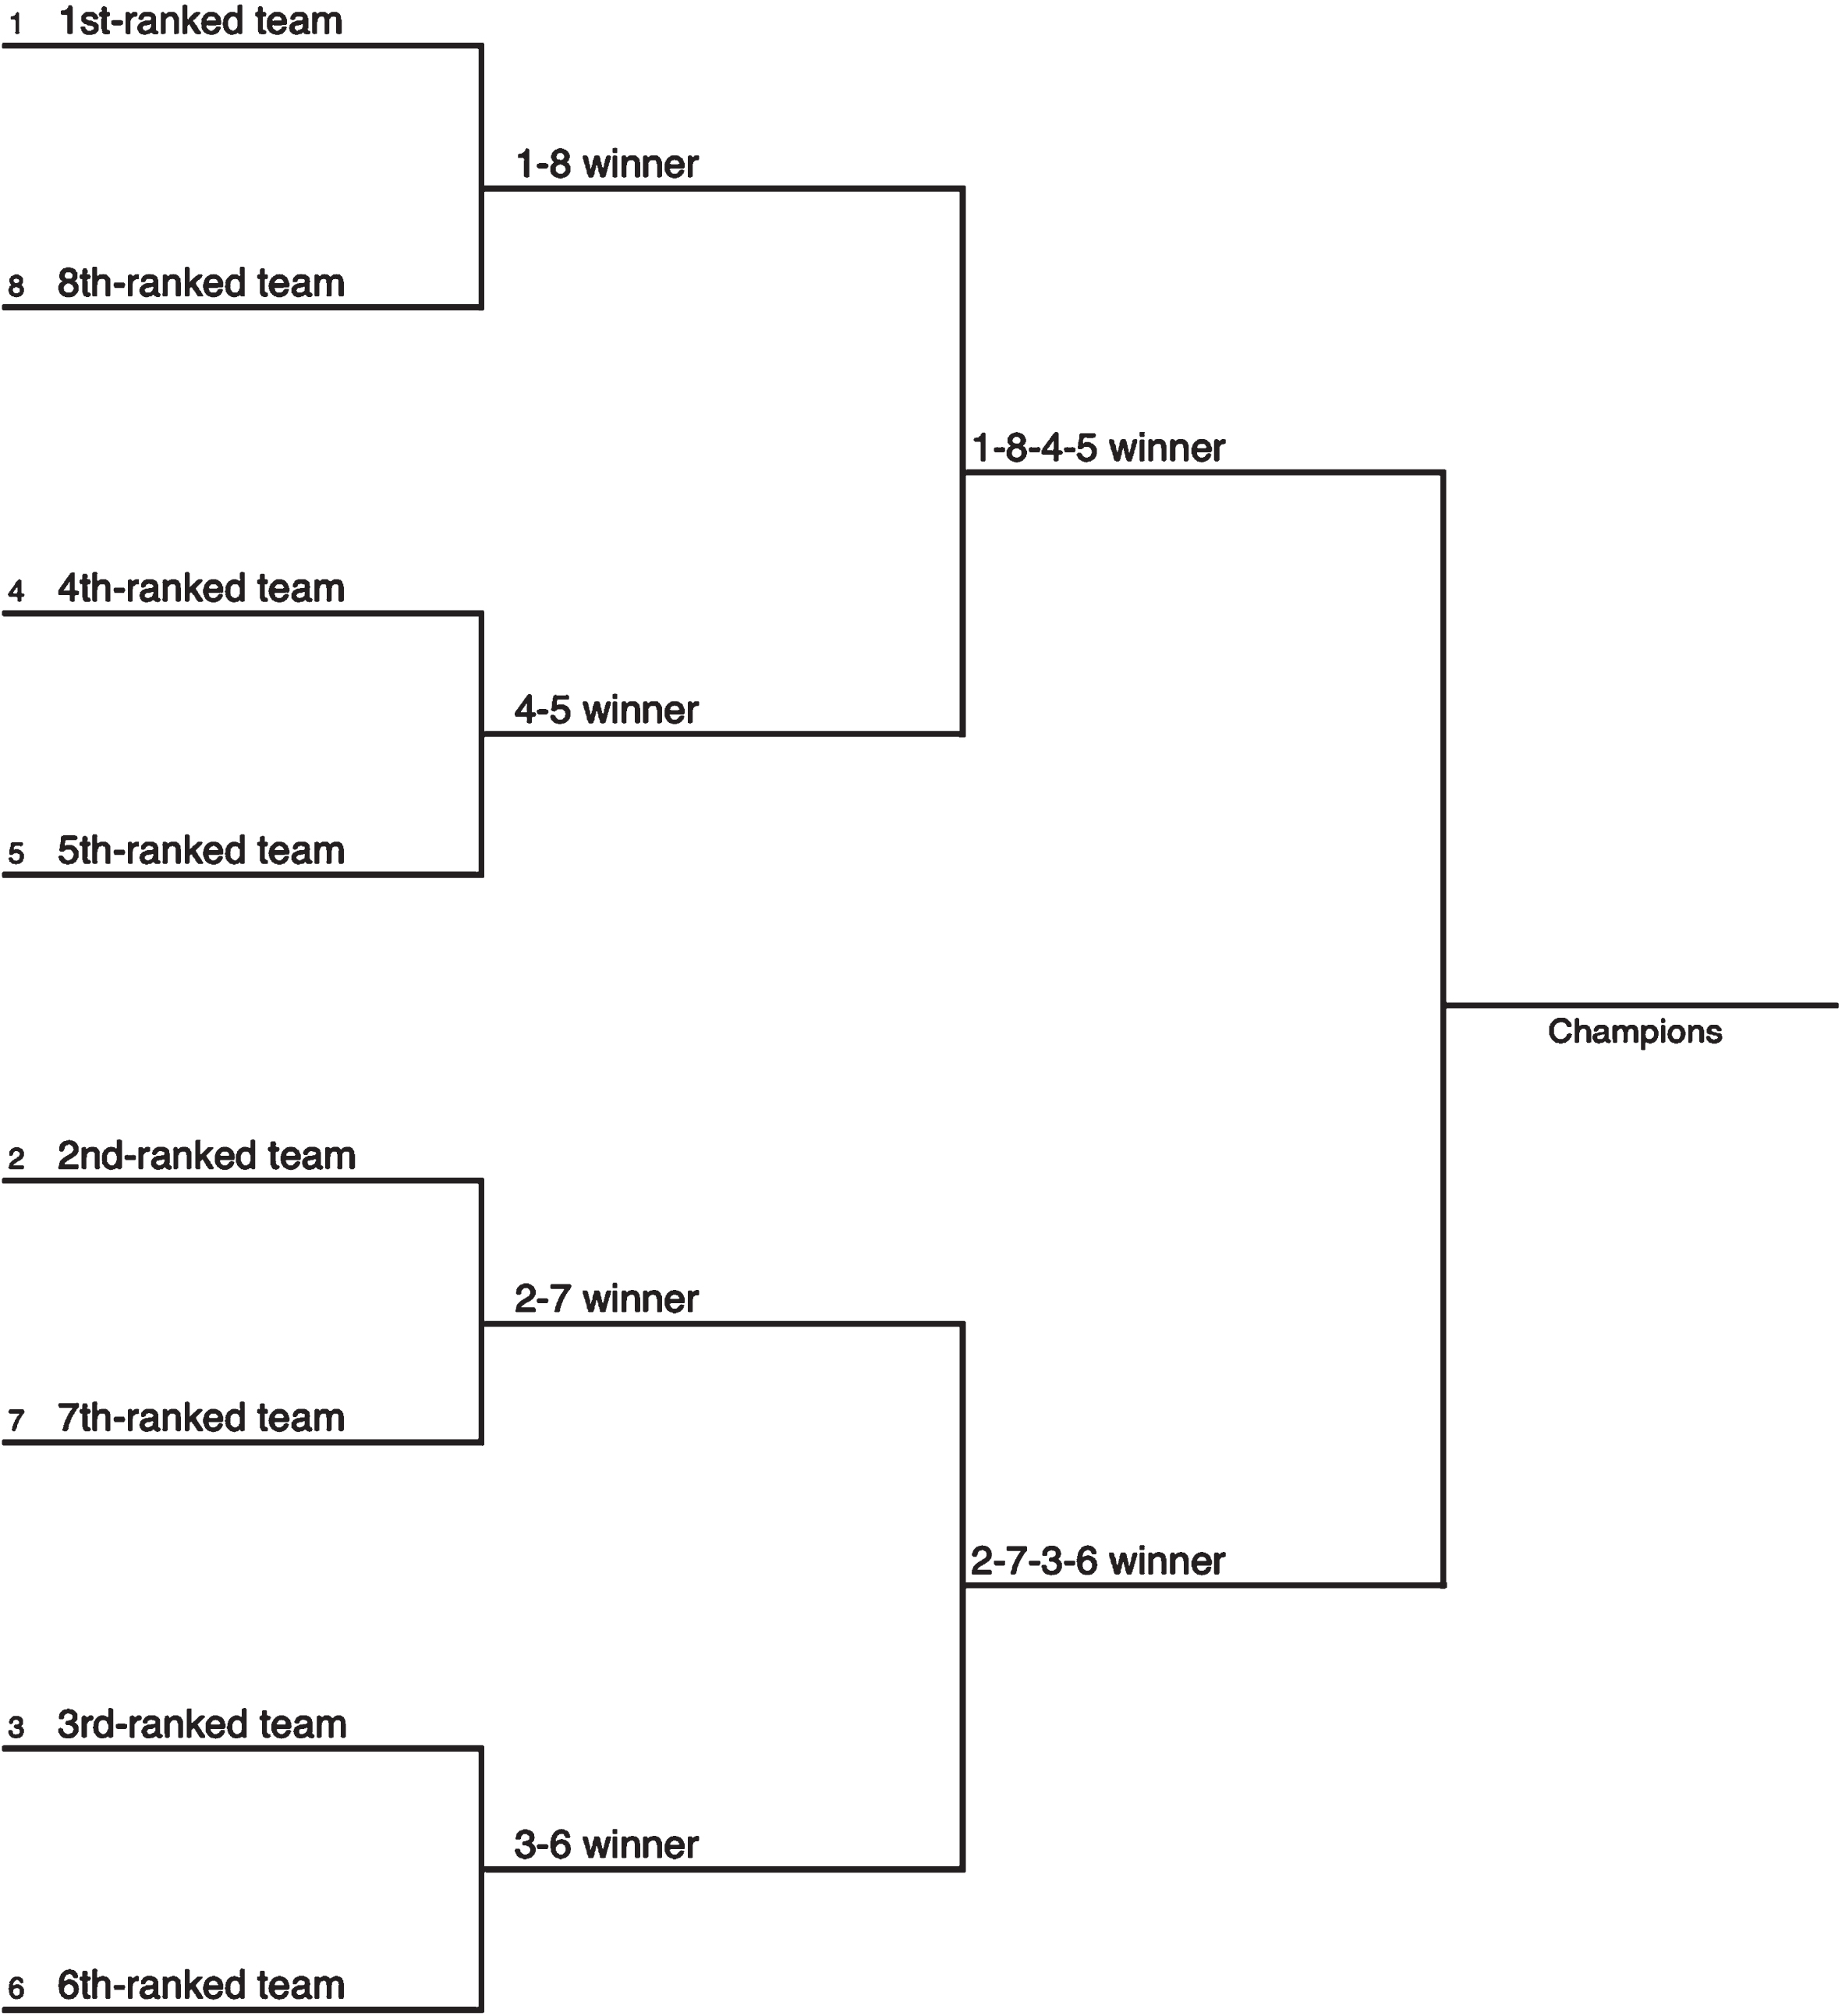
In a size-128 tournament with fewer than 128 teams, a team automatically advances to the next round if it has no opponent in the current round. For example, in Figure 1, if there were only three teams, Teams 1, 2, and 3 would have no opponents in the first round, so they would automatically advance to the second round. In the second round, Team 1 would again have no opponent (since it would normally play the winner of the game between Teams 4 and 5), so it would automatically advance to the third round, where it would play against the winner of the second-round game between Teams 2 and 3. Automatic advancement in the absence of an opponent is called a bye.
The teams that play in the tournament are selected as in Table 1, according to their observed team strengths. For example, in an 8-team partially-open tournament where Power-Five conference champions and the highest-rated Non-Power-Five team are all guaranteed places in the tournament, the eight teams in the tournament would be the five Power-Five conference champions, the highest-rated Non-Power-Five team, and the highest-rated two other teams. In partially-open tournaments, we assume that teams are seeded based on their ratings without regard to conference championship or Power-Five status, similar to the NCAA basketball tournament. For example, if a conference champion team is the 8th-highest-rated team out of those participating in the tournament, then that team will be seeded 8th despite being one of the first five teams that was automatically selected for the tournament.
Simulating the tournament
For each simulated tournament, we calculate the probability of each team winning based on the teams’ true (simulated) team strengths and the variance
(10)
Let Ort be the set of all possible opponents for team t in round r. Then, for each round r and each team t,
(11)
Let t* be the team with the highest true strength among all teams. As defined earlier, each simulated tournament is valid if t* is one of the teams selected to play in the tournament, and the probability that the tournament is effective is equal to p7,t*.
5Parameterizing on randomness
The simulation procedure described above depends on two different parameters: the variance
Bounding and reducing the set of parameter values
The ability to parameterize can be valuable for extending this work to other tournaments; however, for the college football national championship tournament using Sagarin ratings as the observed team strengths, we can significantly reduce the relevant set of parameter values.
First, we deduce an upper bound on σEObs using the fact that each observed team strength is equal to the team’s real strength plus an error term. Because we assume the errors are iid, Equation (2) implies that
(12)
A second upper bound on σEObs can be derived from Equation (8), the distribution of XObs, the error in the observed ratings’ predictions of each game’s margin of victory. Empirically, XSag is normally distributed with variance approximately 262 (ThePredictionTracker.com). Equation (8) implies that
(13)
Equation (8) also provides a value for σR given a value of σESag:
(14)
Finally, we can also derive an approximate lower bound on reasonable values of σEObs. The Sagarin ratings use only game-score information as input2. The margin of victory in each game played by team i gives an observation of team i’s true strength relative to its opponent, but that observation is wrong by some amount equal to the effect of the in-game randomness, i.e., a normal random variable with mean zero and variance
The distribution of the average difference between observed margin mg and true strength difference
(15)
Taken together, the bounds yield 4.5 ≤ σESag ≤ 11.4.
Estimating the actual value of σESag
We know from Equation (8) that our model’s variance in prediction error is equal to
The rematch data is shown in Appendix 4, in Table 15. We first adjust each line and each outcome by 3 points in favor of the road team to account for the value of playing at home, which models generally value at approximately three points (see, for example, (Sagarin)). We then use the models of Curry and Sokol (2016) to estimate the fraction of variance in the line estimation error that is due to randomness. Their models’ maximum likelihood estimates are that approximately 167 or 194 of the variance in the line estimation error is due to
Even having an estimate for the randomness component of total variance and an estimate for the Sagarin ratings’ estimation error, we still do not know the variance contributed by the error in the tournament selection committee’s evaluation of teams. Of course, zero is a (unattainable) lower bound, but we test other values of σE as well. Specifically, we test values of σE equal to 0 (a perfect committee), 7 (approximately equal to the higher estimate of the Sagarin ratings’ error), and every integer in between.
6Results
Tables 6, 7, 8, and 9 show the results of our simulations. The results show the expected tradeoffs: The larger the tournament, the higher the validity, while effectiveness varies depending on how much of the observed prediction error is due to randomness and how much is due to incorrect team strength estimates.
Table 2
Validity of tournaments when σE ∈ {0, 1, 2, 3, 4, 5, 6, 7} and
| Size | Fully-open | |||||||
| 0 | 1 | 2 | 3 | 4 | 5 | 6 | 7 | |
| 1 | 100.0 | 89.0 | 79.6 | 68.4 | 60.2 | 50.9 | 43.8 | 35.2 |
| 2 | 100.0 | 99.1 | 95.6 | 88.3 | 81.5 | 72.0 | 63.1 | 53.3 |
| 3 | 100.0 | 99.9 | 98.6 | 94.6 | 89.2 | 81.1 | 72.5 | 62.3 |
| 4 | 100.0 | 100.0 | 99.6 | 97.2 | 93.8 | 87.5 | 79.2 | 69.8 |
| 5 | 100.0 | 100.0 | 99.8 | 98.5 | 96.1 | 91.3 | 84.1 | 75.6 |
| 6 | 100.0 | 100.0 | 99.9 | 99.1 | 96.7 | 92.4 | 86.2 | 78.8 |
| 7 | 100.0 | 100.0 | 100.0 | 99.4 | 98.1 | 94.5 | 89.3 | 82.8 |
| 8 | 100.0 | 100.0 | 100.0 | 99.8 | 98.9 | 96.3 | 91.8 | 85.8 |
| 9 | 100.0 | 100.0 | 100.0 | 99.8 | 99.3 | 97.0 | 93.0 | 88.0 |
| 10 | 100.0 | 100.0 | 100.0 | 99.9 | 99.5 | 97.8 | 94.1 | 89.9 |
| 11 | 100.0 | 100.0 | 100.0 | 100.0 | 99.7 | 98.2 | 95.3 | 91.3 |
| 12 | 100.0 | 100.0 | 100.0 | 100.0 | 99.8 | 99.0 | 96.4 | 92.6 |
| 13 | 100.0 | 100.0 | 100.0 | 100.0 | 99.8 | 99.1 | 96.9 | 93.6 |
| 14 | 100.0 | 100.0 | 100.0 | 100.0 | 99.8 | 99.1 | 97.2 | 94.3 |
| 15 | 100.0 | 100.0 | 100.0 | 100.0 | 99.8 | 99.4 | 97.9 | 95.2 |
| 16 | 100.0 | 100.0 | 100.0 | 100.0 | 99.9 | 99.6 | 98.5 | 96.1 |
| 17-128 | 100.0-100.0 | 100.0-100.0 | 100.0-100.0 | 100.0-100.0 | 100.0-100.0 | 99.7-100.0 | 98.6-100.0 | 96.4-100.0 |
| Fully-open with non-Power 5 guarantee | ||||||||
| 0 | 1 | 2 | 3 | 4 | 5 | 6 | 7 | |
| 1 | 0.0 | 0.0 | 0.0 | 0.2 | 0.4 | 0.5 | 0.6 | 1.1 |
| 2 | 100.0 | 89.0 | 79.6 | 68.6 | 60.6 | 51.4 | 44.4 | 36.3 |
| 3 | 100.0 | 99.1 | 95.6 | 88.5 | 81.9 | 72.5 | 63.7 | 54.4 |
| 4 | 100.0 | 99.9 | 98.7 | 94.7 | 89.5 | 81.7 | 73.2 | 63.4 |
| 5 | 100.0 | 100.0 | 99.6 | 97.2 | 94.0 | 87.9 | 79.7 | 70.9 |
| 6 | 100.0 | 100.0 | 99.8 | 98.5 | 96.2 | 91.5 | 84.4 | 76.4 |
| 7 | 100.0 | 100.0 | 99.9 | 99.2 | 97.0 | 93.0 | 86.9 | 80.0 |
| 8 | 100.0 | 100.0 | 100.0 | 99.4 | 98.3 | 94.9 | 89.8 | 83.4 |
| 9 | 100.0 | 100.0 | 100.0 | 99.8 | 99.1 | 96.6 | 92.3 | 86.5 |
| 10 | 100.0 | 100.0 | 100.0 | 99.8 | 99.4 | 97.2 | 93.4 | 88.8 |
| 11 | 100.0 | 100.0 | 100.0 | 99.9 | 99.5 | 98.0 | 94.7 | 90.9 |
| 12 | 100.0 | 100.0 | 100.0 | 100.0 | 99.7 | 98.5 | 95.7 | 91.7 |
| 13 | 100.0 | 100.0 | 100.0 | 100.0 | 99.8 | 99.1 | 96.8 | 93.1 |
| 14 | 100.0 | 100.0 | 100.0 | 100.0 | 99.8 | 99.1 | 97.1 | 94.2 |
| 15 | 100.0 | 100.0 | 100.0 | 100.0 | 99.8 | 99.1 | 97.3 | 94.6 |
| 16 | 100.0 | 100.0 | 100.0 | 100.0 | 99.9 | 99.6 | 98.4 | 95.9 |
| 17-128 | 100.0-100.0 | 100.0-100.0 | 100.0-100.0 | 100.0-100.0 | 99.9-100.0 | 99.6-100.0 | 98.5-100.0 | 96.3-100.0 |
| Partially-open | ||||||||
| 0 | 1 | 2 | 3 | 4 | 5 | 6 | 7 | |
| 1 | 84.2 | 76.9 | 70.5 | 61.2 | 54.6 | 46.4 | 39.7 | 31.8 |
| 2 | 84.2 | 83.6 | 81.5 | 75.8 | 70.8 | 63.3 | 55.9 | 47.5 |
| 3 | 84.2 | 84.0 | 82.1 | 78.3 | 74.0 | 67.4 | 60.8 | 53.2 |
| 4 | 84.2 | 84.0 | 82.1 | 78.7 | 74.9 | 69.1 | 63.4 | 56.3 |
| 5 | 84.2 | 84.0 | 82.2 | 79.2 | 75.4 | 69.9 | 64.8 | 57.8 |
| 6 | 100.0 | 99.4 | 98.1 | 95.4 | 91.8 | 86.2 | 80.2 | 72.4 |
| 7 | 100.0 | 100.0 | 99.8 | 98.4 | 95.5 | 91.2 | 85.3 | 77.7 |
| 8 | 100.0 | 100.0 | 99.9 | 98.8 | 96.7 | 93.5 | 88.6 | 82.0 |
| 9 | 100.0 | 100.0 | 100.0 | 99.7 | 98.1 | 95.3 | 91.5 | 86.0 |
| 10 | 100.0 | 100.0 | 100.0 | 99.8 | 98.9 | 96.6 | 93.1 | 88.0 |
| 11 | 100.0 | 100.0 | 100.0 | 99.8 | 99.3 | 97.5 | 94.4 | 90.3 |
| 12 | 100.0 | 100.0 | 100.0 | 99.9 | 99.6 | 98.2 | 95.6 | 91.9 |
| 13 | 100.0 | 100.0 | 100.0 | 100.0 | 99.8 | 98.9 | 96.8 | 93.4 |
| 14 | 100.0 | 100.0 | 100.0 | 100.0 | 99.8 | 99.0 | 97.3 | 94.3 |
| 15 | 100.0 | 100.0 | 100.0 | 100.0 | 99.8 | 99.3 | 98.1 | 95.4 |
| 16 | 100.0 | 100.0 | 100.0 | 100.0 | 99.9 | 99.4 | 98.3 | 95.8 |
| 17-128 | 100.0-100.0 | 100.0-100.0 | 100.0-100.0 | 100.0-100.0 | 99.9-100.0 | 99.6-100.0 | 98.6-100.0 | 96.4-100.0 |
| Partially-open with non-Power 5 guarantee | ||||||||
| 0 | 1 | 2 | 3 | 4 | 5 | 6 | 7 | |
| 1 | 84.2 | 76.9 | 70.5 | 61.2 | 54.6 | 46.4 | 39.7 | 31.8 |
| 2 | 84.2 | 83.6 | 81.5 | 76.0 | 71.0 | 63.2 | 55.8 | 47.3 |
| 3 | 84.2 | 84.0 | 82.1 | 78.5 | 74.3 | 67.5 | 60.9 | 53.3 |
| 4 | 84.2 | 84.0 | 82.1 | 78.8 | 75.2 | 69.3 | 63.4 | 56.5 |
| 5 | 84.2 | 84.0 | 82.2 | 79.4 | 75.8 | 70.3 | 65.2 | 58.5 |
| 6 | 84.2 | 84.0 | 82.2 | 79.4 | 75.8 | 70.4 | 65.4 | 58.9 |
| 7 | 100.0 | 99.4 | 98.2 | 95.7 | 92.3 | 86.8 | 80.9 | 73.5 |
| 8 | 100.0 | 100.0 | 99.8 | 98.4 | 95.7 | 91.5 | 85.7 | 78.5 |
| 9 | 100.0 | 100.0 | 99.9 | 98.8 | 96.9 | 93.8 | 89.0 | 82.9 |
| 10 | 100.0 | 100.0 | 100.0 | 99.7 | 98.2 | 95.6 | 92.0 | 86.7 |
| 11 | 100.0 | 100.0 | 100.0 | 99.8 | 99.2 | 97.0 | 93.7 | 89.1 |
| 12 | 100.0 | 100.0 | 100.0 | 99.8 | 99.4 | 97.7 | 94.9 | 91.0 |
| 13 | 100.0 | 100.0 | 100.0 | 99.9 | 99.6 | 98.3 | 96.0 | 92.4 |
| 14 | 100.0 | 100.0 | 100.0 | 100.0 | 99.8 | 99.0 | 97.1 | 93.8 |
| 15 | 100.0 | 100.0 | 100.0 | 100.0 | 99.8 | 99.1 | 97.6 | 94.9 |
| 16 | 100.0 | 100.0 | 100.0 | 100.0 | 99.9 | 99.4 | 98.3 | 95.8 |
| 17-128 | 100.0-100.0 | 100.0-100.0 | 100.0-100.0 | 100.0-100.0 | 99.9-100.0 | 99.5-100.0 | 98.4-100.0 | 96.1-100.0 |
Table 3
Effectiveness of tournaments when σE ∈ {0, 1, 2, 3, 4, 5, 6, 7} and
| Size | Fully-open | |||||||
| 0 | 1 | 2 | 3 | 4 | 5 | 6 | 7 | |
| 1 | 100.0 | 89.0 | 79.6 | 68.4 | 60.2 | 50.9 | 43.8 | 35.2 |
| 2 | 60.5 | 60.7 | 59.9 | 57.2 | 54.6 | 49.9 | 45.1 | 39.2 |
| 3 | 63.4 | 61.3 | 59.5 | 56.7 | 54.2 | 50.2 | 46.1 | 40.4 |
| 4 | 47.0 | 47.2 | 47.5 | 47.6 | 47.5 | 46.0 | 43.3 | 39.3 |
| 5 | 47.8 | 47.8 | 47.8 | 47.6 | 47.2 | 45.9 | 43.5 | 40.0 |
| 6 | 48.3 | 48.4 | 48.2 | 47.7 | 47.1 | 45.5 | 43.2 | 40.0 |
| 7 | 50.3 | 49.3 | 48.3 | 47.3 | 46.5 | 45.0 | 43.1 | 40.2 |
| 8 | 41.9 | 42.0 | 42.1 | 42.2 | 42.3 | 42.0 | 40.8 | 38.8 |
| 9 | 42.3 | 42.2 | 42.1 | 42.0 | 42.0 | 41.5 | 40.3 | 38.6 |
| 10 | 42.2 | 42.2 | 42.2 | 42.1 | 41.9 | 41.4 | 40.2 | 38.6 |
| 11 | 42.2 | 42.2 | 42.2 | 42.2 | 42.0 | 41.5 | 40.2 | 38.7 |
| 12 | 42.6 | 42.7 | 42.6 | 42.4 | 42.2 | 41.6 | 40.2 | 38.6 |
| 13 | 43.6 | 43.5 | 43.3 | 42.9 | 42.4 | 41.6 | 40.2 | 38.5 |
| 14 | 43.9 | 43.9 | 43.6 | 43.1 | 42.5 | 41.5 | 40.1 | 38.4 |
| 15 | 44.8 | 44.3 | 43.7 | 42.8 | 42.0 | 41.0 | 39.7 | 38.0 |
| 16 | 40.9 | 40.8 | 40.6 | 40.3 | 39.8 | 39.1 | 38.3 | 37.0 |
| 17-128 | 40.7-42.6 | 40.7-42.4 | 40.5-41.9 | 40.0-41.3 | 39.3-40.5 | 38.2-39.4 | 36.8-38.1 | 35.1-36.8 |
| Fully-open with non-Power 5 guarantee | ||||||||
| 0 | 1 | 2 | 3 | 4 | 5 | 6 | 7 | |
| 1 | 0.0 | 0.0 | 0.0 | 0.2 | 0.4 | 0.5 | 0.6 | 1.1 |
| 2 | 88.8 | 79.3 | 71.0 | 61.2 | 54.1 | 45.9 | 39.4 | 32.1 |
| 3 | 64.5 | 63.5 | 61.8 | 58.3 | 55.1 | 49.9 | 44.8 | 38.8 |
| 4 | 56.5 | 55.4 | 54.5 | 52.6 | 50.8 | 47.5 | 43.7 | 38.7 |
| 5 | 49.2 | 49.0 | 49.0 | 48.6 | 48.1 | 46.2 | 43.3 | 39.4 |
| 6 | 48.0 | 48.2 | 48.3 | 47.9 | 47.4 | 45.9 | 43.4 | 40.0 |
| 7 | 49.6 | 49.0 | 48.5 | 47.7 | 46.8 | 45.2 | 42.9 | 39.8 |
| 8 | 45.2 | 44.9 | 44.5 | 44.1 | 43.8 | 42.9 | 41.2 | 38.8 |
| 9 | 43.0 | 42.9 | 42.7 | 42.6 | 42.5 | 41.9 | 40.6 | 38.6 |
| 10 | 42.1 | 42.2 | 42.2 | 42.2 | 42.1 | 41.5 | 40.2 | 38.6 |
| 11 | 42.1 | 42.2 | 42.2 | 42.2 | 42.0 | 41.5 | 40.2 | 38.8 |
| 12 | 42.5 | 42.6 | 42.6 | 42.4 | 42.2 | 41.6 | 40.3 | 38.6 |
| 13 | 43.5 | 43.4 | 43.2 | 42.9 | 42.4 | 41.7 | 40.3 | 38.6 |
| 14 | 43.9 | 43.9 | 43.6 | 43.1 | 42.5 | 41.6 | 40.2 | 38.5 |
| 15 | 44.7 | 44.3 | 43.7 | 42.9 | 42.1 | 41.1 | 39.7 | 38.0 |
| 16 | 41.4 | 41.3 | 41.0 | 40.6 | 40.1 | 39.4 | 38.5 | 37.1 |
| 17-128 | 40.7-42.6 | 40.7-42.4 | 40.5-41.9 | 40.0-41.3 | 39.3-40.5 | 38.2-39.4 | 36.8-38.1 | 35.1-36.8 |
| Partially-open | ||||||||
| 0 | 1 | 2 | 3 | 4 | 5 | 6 | 7 | |
| 1 | 84.2 | 76.9 | 70.5 | 61.2 | 54.6 | 46.4 | 39.7 | 31.8 |
| 2 | 53.4 | 53.5 | 53.0 | 50.4 | 48.4 | 44.5 | 40.3 | 35.2 |
| 3 | 56.4 | 55.1 | 53.4 | 50.4 | 48.0 | 44.1 | 40.3 | 35.6 |
| 4 | 46.6 | 46.4 | 45.6 | 44.1 | 42.6 | 40.2 | 37.5 | 33.9 |
| 5 | 47.8 | 47.4 | 46.4 | 44.6 | 42.9 | 40.3 | 37.6 | 34.0 |
| 6 | 51.0 | 50.7 | 50.1 | 49.0 | 47.9 | 45.6 | 42.9 | 39.3 |
| 7 | 50.3 | 49.7 | 49.1 | 48.2 | 47.2 | 45.4 | 42.9 | 39.4 |
| 8 | 44.9 | 44.8 | 44.6 | 44.2 | 43.6 | 42.5 | 40.9 | 38.4 |
| 9 | 43.7 | 43.6 | 43.3 | 43.1 | 42.7 | 41.8 | 40.6 | 38.7 |
| 10 | 42.5 | 42.6 | 42.5 | 42.4 | 42.2 | 41.5 | 40.3 | 38.5 |
| 11 | 42.2 | 42.2 | 42.2 | 42.2 | 42.1 | 41.5 | 40.3 | 38.7 |
| 12 | 42.5 | 42.6 | 42.6 | 42.4 | 42.2 | 41.5 | 40.3 | 38.7 |
| 13 | 43.5 | 43.4 | 43.2 | 42.9 | 42.4 | 41.6 | 40.4 | 38.8 |
| 14 | 43.9 | 43.9 | 43.6 | 43.1 | 42.5 | 41.5 | 40.2 | 38.6 |
| 15 | 44.7 | 44.3 | 43.7 | 42.9 | 42.1 | 41.1 | 39.9 | 38.3 |
| 16 | 41.3 | 41.3 | 41.0 | 40.6 | 40.1 | 39.4 | 38.5 | 37.1 |
| 17-128 | 40.7-42.6 | 40.7-42.4 | 40.5-41.9 | 40.0-41.3 | 39.3-40.6 | 38.2-39.4 | 36.8-38.1 | 35.1-36.8 |
| Partially-open with non-Power 5 guarantee | ||||||||
| 0 | 1 | 2 | 3 | 4 | 5 | 6 | 7 | |
| 1 | 84.2 | 76.9 | 70.5 | 61.2 | 54.6 | 46.4 | 39.7 | 31.8 |
| 2 | 53.4 | 53.4 | 52.9 | 50.5 | 48.5 | 44.5 | 40.3 | 35.1 |
| 3 | 56.3 | 55.0 | 53.3 | 50.3 | 48.0 | 44.1 | 40.3 | 35.6 |
| 4 | 46.1 | 46.0 | 45.2 | 43.8 | 42.5 | 40.0 | 37.2 | 33.8 |
| 5 | 47.2 | 46.8 | 45.8 | 44.2 | 42.6 | 40.0 | 37.3 | 34.0 |
| 6 | 47.2 | 47.0 | 46.1 | 44.5 | 42.8 | 40.1 | 37.4 | 34.0 |
| 7 | 52.1 | 51.3 | 50.3 | 49.0 | 47.7 | 45.2 | 42.5 | 38.9 |
| 8 | 46.5 | 46.3 | 46.2 | 45.6 | 45.0 | 43.5 | 41.3 | 38.2 |
| 9 | 44.9 | 44.7 | 44.4 | 43.9 | 43.2 | 42.1 | 40.5 | 38.1 |
| 10 | 43.1 | 43.2 | 43.0 | 42.9 | 42.5 | 41.6 | 40.4 | 38.5 |
| 11 | 42.3 | 42.4 | 42.4 | 42.4 | 42.3 | 41.6 | 40.4 | 38.6 |
| 12 | 42.5 | 42.5 | 42.5 | 42.4 | 42.3 | 41.6 | 40.3 | 38.7 |
| 13 | 43.4 | 43.3 | 43.2 | 42.9 | 42.4 | 41.6 | 40.3 | 38.6 |
| 14 | 43.8 | 43.8 | 43.6 | 43.1 | 42.5 | 41.7 | 40.4 | 38.7 |
| 15 | 44.6 | 44.2 | 43.6 | 42.9 | 42.2 | 41.2 | 39.9 | 38.3 |
| 16 | 41.7 | 41.6 | 41.3 | 40.9 | 40.3 | 39.6 | 38.6 | 37.2 |
| 17-128 | 40.7-42.6 | 40.7-42.4 | 40.5-41.9 | 40.0-41.3 | 39.3-40.6 | 38.2-39.4 | 36.8-38.1 | 35.1-36.8 |
Table 4
Validity of tournaments when σE ∈ {0, 1, 2, 3, 4, 5, 6, 7} and
| Size | Fully-open | |||||||
| 0 | 1 | 2 | 3 | 4 | 5 | 6 | 7 | |
| 1 | 100.0 | 89.0 | 79.6 | 68.4 | 60.2 | 50.9 | 43.8 | 35.2 |
| 2 | 100.0 | 99.1 | 95.6 | 88.3 | 81.5 | 72.0 | 63.1 | 53.3 |
| 3 | 100.0 | 99.9 | 98.6 | 94.6 | 89.2 | 81.1 | 72.5 | 62.3 |
| 4 | 100.0 | 100.0 | 99.6 | 97.2 | 93.8 | 87.5 | 79.2 | 69.8 |
| 5 | 100.0 | 100.0 | 99.8 | 98.5 | 96.1 | 91.3 | 84.1 | 75.6 |
| 6 | 100.0 | 100.0 | 99.9 | 99.1 | 96.7 | 92.4 | 86.2 | 78.8 |
| 7 | 100.0 | 100.0 | 100.0 | 99.4 | 98.1 | 94.5 | 89.3 | 82.8 |
| 8 | 100.0 | 100.0 | 100.0 | 99.8 | 98.9 | 96.3 | 91.8 | 85.8 |
| 9 | 100.0 | 100.0 | 100.0 | 99.8 | 99.3 | 97.0 | 93.0 | 88.0 |
| 10 | 100.0 | 100.0 | 100.0 | 99.9 | 99.5 | 97.8 | 94.1 | 89.9 |
| 11 | 100.0 | 100.0 | 100.0 | 100.0 | 99.7 | 98.2 | 95.3 | 91.3 |
| 12 | 100.0 | 100.0 | 100.0 | 100.0 | 99.8 | 99.0 | 96.4 | 92.6 |
| 13 | 100.0 | 100.0 | 100.0 | 100.0 | 99.8 | 99.1 | 96.9 | 93.6 |
| 14 | 100.0 | 100.0 | 100.0 | 100.0 | 99.8 | 99.1 | 97.2 | 94.3 |
| 15 | 100.0 | 100.0 | 100.0 | 100.0 | 99.8 | 99.4 | 97.9 | 95.2 |
| 16 | 100.0 | 100.0 | 100.0 | 100.0 | 99.9 | 99.6 | 98.5 | 96.1 |
| 17-128 | 100.0-100.0 | 100.0-100.0 | 100.0-100.0 | 100.0-100.0 | 100.0-100.0 | 99.7-100.0 | 98.6-100.0 | 96.4-100.0 |
| Fully-open with non-Power 5 guarantee | ||||||||
| 0 | 1 | 2 | 3 | 4 | 5 | 6 | 7 | |
| 1 | 0.0 | 0.0 | 0.0 | 0.2 | 0.4 | 0.5 | 0.6 | 1.1 |
| 2 | 100.0 | 89.0 | 79.6 | 68.6 | 60.6 | 51.4 | 44.4 | 36.3 |
| 3 | 100.0 | 99.1 | 95.6 | 88.5 | 81.9 | 72.5 | 63.7 | 54.4 |
| 4 | 100.0 | 99.9 | 98.7 | 94.7 | 89.5 | 81.7 | 73.2 | 63.4 |
| 5 | 100.0 | 100.0 | 99.6 | 97.2 | 94.0 | 87.9 | 79.7 | 70.9 |
| 6 | 100.0 | 100.0 | 99.8 | 98.5 | 96.2 | 91.5 | 84.4 | 76.4 |
| 7 | 100.0 | 100.0 | 99.9 | 99.2 | 97.0 | 93.0 | 86.9 | 80.0 |
| 8 | 100.0 | 100.0 | 100.0 | 99.4 | 98.3 | 94.9 | 89.8 | 83.4 |
| 9 | 100.0 | 100.0 | 100.0 | 99.8 | 99.1 | 96.6 | 92.3 | 86.5 |
| 10 | 100.0 | 100.0 | 100.0 | 99.8 | 99.4 | 97.2 | 93.4 | 88.8 |
| 11 | 100.0 | 100.0 | 100.0 | 99.9 | 99.5 | 98.0 | 94.7 | 90.9 |
| 12 | 100.0 | 100.0 | 100.0 | 100.0 | 99.7 | 98.5 | 95.7 | 91.7 |
| 13 | 100.0 | 100.0 | 100.0 | 100.0 | 99.8 | 99.1 | 96.8 | 93.1 |
| 14 | 100.0 | 100.0 | 100.0 | 100.0 | 99.8 | 99.1 | 97.1 | 94.2 |
| 15 | 100.0 | 100.0 | 100.0 | 100.0 | 99.8 | 99.1 | 97.3 | 94.6 |
| 16 | 100.0 | 100.0 | 100.0 | 100.0 | 99.9 | 99.6 | 98.4 | 95.9 |
| 17-128 | 100.0-100.0 | 100.0-100.0 | 100.0-100.0 | 100.0-100.0 | 99.9-100.0 | 99.6-100.0 | 98.5-100.0 | 96.3-100.0 |
| Partially-open | ||||||||
| 0 | 1 | 2 | 3 | 4 | 5 | 6 | 7 | |
| 1 | 84.2 | 76.9 | 70.5 | 61.2 | 54.6 | 46.4 | 39.7 | 31.8 |
| 2 | 84.2 | 83.6 | 81.5 | 75.8 | 70.8 | 63.3 | 55.9 | 47.5 |
| 3 | 84.2 | 84.0 | 82.1 | 78.3 | 74.0 | 67.4 | 60.8 | 53.2 |
| 4 | 84.2 | 84.0 | 82.1 | 78.7 | 74.9 | 69.1 | 63.4 | 56.3 |
| 5 | 84.2 | 84.0 | 82.2 | 79.2 | 75.4 | 69.9 | 64.8 | 57.8 |
| 6 | 100.0 | 99.4 | 98.1 | 95.4 | 91.8 | 86.2 | 80.2 | 72.4 |
| 7 | 100.0 | 100.0 | 99.8 | 98.4 | 95.5 | 91.2 | 85.3 | 77.7 |
| 8 | 100.0 | 100.0 | 99.9 | 98.8 | 96.7 | 93.5 | 88.6 | 82.0 |
| 9 | 100.0 | 100.0 | 100.0 | 99.7 | 98.1 | 95.3 | 91.5 | 86.0 |
| 10 | 100.0 | 100.0 | 100.0 | 99.8 | 98.9 | 96.6 | 93.1 | 88.0 |
| 11 | 100.0 | 100.0 | 100.0 | 99.8 | 99.3 | 97.5 | 94.4 | 90.3 |
| 12 | 100.0 | 100.0 | 100.0 | 99.9 | 99.6 | 98.2 | 95.6 | 91.9 |
| 13 | 100.0 | 100.0 | 100.0 | 100.0 | 99.8 | 98.9 | 96.8 | 93.4 |
| 14 | 100.0 | 100.0 | 100.0 | 100.0 | 99.8 | 99.0 | 97.3 | 94.3 |
| 15 | 100.0 | 100.0 | 100.0 | 100.0 | 99.8 | 99.3 | 98.1 | 95.4 |
| 16 | 100.0 | 100.0 | 100.0 | 100.0 | 99.9 | 99.4 | 98.3 | 95.8 |
| 17-128 | 100.0-100.0 | 100.0-100.0 | 100.0-100.0 | 100.0-100.0 | 99.9-100.0 | 99.6-100.0 | 98.6-100.0 | 96.4-100.0 |
| Partially-open with non-Power 5 guarantee | ||||||||
| 0 | 1 | 2 | 3 | 4 | 5 | 6 | 7 | |
| 1 | 84.2 | 76.9 | 70.5 | 61.2 | 54.6 | 46.4 | 39.7 | 31.8 |
| 2 | 84.2 | 83.6 | 81.5 | 76.0 | 71.0 | 63.2 | 55.8 | 47.3 |
| 3 | 84.2 | 84.0 | 82.1 | 78.5 | 74.3 | 67.5 | 60.9 | 53.3 |
| 4 | 84.2 | 84.0 | 82.1 | 78.8 | 75.2 | 69.3 | 63.4 | 56.5 |
| 5 | 84.2 | 84.0 | 82.2 | 79.4 | 75.8 | 70.3 | 65.2 | 58.5 |
| 6 | 84.2 | 84.0 | 82.2 | 79.4 | 75.8 | 70.4 | 65.4 | 58.9 |
| 7 | 100.0 | 99.4 | 98.2 | 95.7 | 92.3 | 86.8 | 80.9 | 73.5 |
| 8 | 100.0 | 100.0 | 99.8 | 98.4 | 95.7 | 91.5 | 85.7 | 78.5 |
| 9 | 100.0 | 100.0 | 99.9 | 98.8 | 96.9 | 93.8 | 89.0 | 82.9 |
| 10 | 100.0 | 100.0 | 100.0 | 99.7 | 98.2 | 95.6 | 92.0 | 86.7 |
| 11 | 100.0 | 100.0 | 100.0 | 99.8 | 99.2 | 97.0 | 93.7 | 89.1 |
| 12 | 100.0 | 100.0 | 100.0 | 99.8 | 99.4 | 97.7 | 94.9 | 91.0 |
| 13 | 100.0 | 100.0 | 100.0 | 99.9 | 99.6 | 98.3 | 96.0 | 92.4 |
| 14 | 100.0 | 100.0 | 100.0 | 100.0 | 99.8 | 99.0 | 97.1 | 93.8 |
| 15 | 100.0 | 100.0 | 100.0 | 100.0 | 99.8 | 99.1 | 97.6 | 94.9 |
| 16 | 100.0 | 100.0 | 100.0 | 100.0 | 99.9 | 99.4 | 98.3 | 95.8 |
| 17-128 | 100.0-100.0 | 100.0-100.0 | 100.0-100.0 | 100.0-100.0 | 99.9-100.0 | 99.5-100.0 | 98.4-100.0 | 96.1-100.0 |
Table 5
Effectiveness of tournaments when σE ∈ {0, 1, 2, 3, 4, 5, 6, 7} and
| Size | Fully-open | |||||||
| 0 | 1 | 2 | 3 | 4 | 5 | 6 | 7 | |
| 1 | 100.0 | 89.0 | 79.6 | 68.4 | 60.2 | 50.9 | 43.8 | 35.2 |
| 2 | 59.8 | 59.9 | 59.1 | 56.3 | 53/7 | 49.0 | 44.3 | 38.5 |
| 3 | 62.6 | 60.5 | 58.6 | 55.8 | 53.2 | 49.2 | 45.2 | 39.5 |
| 4 | 45.5 | 45.6 | 46.0 | 46.1 | 46.0 | 44.5 | 41.9 | 38.1 |
| 5 | 46.3 | 46.3 | 46.3 | 46.1 | 45.7 | 44.4 | 42.1 | 38.7 |
| 6 | 46.8 | 46.9 | 46.7 | 46.2 | 45.6 | 44.0 | 41.8 | 38.7 |
| 7 | 48.8 | 47.7 | 46.8 | 45.7 | 44.9 | 43.4 | 41.6 | 38.7 |
| 8 | 39.8 | 39.9 | 40.0 | 40.2 | 40.4 | 40.0 | 38.9 | 37.1 |
| 9 | 40.1 | 40.1 | 40.1 | 40.1 | 40.1 | 39.6 | 38.5 | 36.9 |
| 10 | 40.1 | 40.1 | 40.1 | 40.1 | 40.0 | 39.6 | 38.4 | 36.9 |
| 11 | 40.1 | 40.2 | 40.2 | 40.2 | 40.1 | 39.6 | 38.5 | 37.0 |
| 12 | 40.6 | 40.6 | 40.6 | 40.5 | 40.2 | 39.7 | 38.5 | 36.9 |
| 13 | 41.6 | 41.5 | 41.3 | 41.0 | 40.5 | 39.7 | 38.4 | 36.8 |
| 14 | 41.9 | 41.9 | 41.7 | 41.1 | 40.5 | 39.6 | 38.3 | 36.6 |
| 15 | 42.9 | 42.3 | 41.7 | 40.8 | 40.0 | 39.1 | 37.8 | 36.2 |
| 16 | 38.4 | 38.4 | 38.2 | 37.9 | 37.5 | 37.0 | 36.2 | 35.0 |
| 17-128 | 38.2–40.4 | 38.2-40.2 | 38.0-39.7 | 37.6-39.2 | 36.9-38.4 | 35.9-37.3 | 34.5-36.1 | 32.9-34.8 |
| Fully-open with non-Power 5 guarantee | ||||||||
| 0 | 1 | 2 | 3 | 4 | 5 | 6 | 7 | |
| 1 | 0.0 | 0.0 | 0.0 | 0.2 | 0.4 | 0.5 | 0.6 | 1.1 |
| 2 | 87.3 | 77.9 | 69.7 | 60.2 | 53.3 | 45.2 | 38.8 | 31.6 |
| 3 | 64.1 | 63.0 | 61.1 | 57.5 | 54.2 | 49.0 | 44.0 | 38.0 |
| 4 | 54.8 | 53.8 | 52.9 | 51.1 | 49.4 | 46.1 | 42.4 | 37.5 |
| 5 | 47.8 | 47.6 | 47.6 | 47.2 | 46.6 | 44.8 | 41.9 | 38.2 |
| 6 | 46.6 | 46.8 | 46.8 | 46.5 | 46.0 | 44.5 | 42.0 | 38.7 |
| 7 | 48.2 | 47.5 | 46.9 | 46.1 | 45.2 | 43.6 | 41.4 | 38.3 |
| 8 | 43.1 | 42.7 | 42.4 | 42.1 | 41.9 | 41.0 | 39.5 | 37.1 |
| 9 | 40.9 | 40.8 | 40.7 | 40.6 | 40.6 | 40.1 | 38.8 | 36.9 |
| 10 | 40.0 | 40.1 | 40.2 | 40.2 | 40.1 | 39.6 | 38.4 | 36.9 |
| 11 | 40.0 | 40.1 | 40.2 | 40.2 | 40.1 | 39.6 | 38.4 | 37.0 |
| 12 | 40.5 | 40.5 | 40.6 | 40.5 | 40.3 | 39.8 | 38.5 | 36.9 |
| 13 | 41.5 | 41.4 | 41.3 | 40.9 | 40.5 | 39.8 | 38.5 | 36.8 |
| 14 | 41.9 | 41.9 | 41.6 | 41.1 | 40.6 | 39.7 | 38.4 | 36.8 |
| 15 | 42.8 | 42.3 | 41.7 | 40.9 | 40.1 | 39.1 | 37.8 | 36.2 |
| 16 | 38.9 | 38.9 | 38.6 | 38.3 | 37.8 | 37.3 | 36.4 | 35.1 |
| 17-128 | 38.2-40.4 | 38.2-40.2 | 38.0-39.7 | 37.6-39.2 | 36.9-38.4 | 35.9-37.3 | 34.5-36.1 | 32.9-34.8 |
| Partially-open | ||||||||
| 0 | 1 | 2 | 3 | 4 | 5 | 6 | 7 | |
| 1 | 84.2 | 76.9 | 70.5 | 61.2 | 54.6 | 46.4 | 39.7 | 31.8 |
| 2 | 52.7 | 52.7 | 52.2 | 49.6 | 47.6 | 43.8 | 39.7 | 34.6 |
| 3 | 55.6 | 54.2 | 52.5 | 49.5 | 47.1 | 43.3 | 39.5 | 34.8 |
| 4 | 45.1 | 44.9 | 44.1 | 42.7 | 41.3 | 38.9 | 36.3 | 32.8 |
| 5 | 46.2 | 45.9 | 44.9 | 43.2 | 41.6 | 39.0 | 36.5 | 32.9 |
| 6 | 49.5 | 49.2 | 48.6 | 47.6 | 46.4 | 44.2 | 41.6 | 38.0 |
| 7 | 48.9 | 48.2 | 47.6 | 46.6 | 45.6 | 43.8 | 41.4 | 38.0 |
| 8 | 42.8 | 42.7 | 42.5 | 42.2 | 41.6 | 40.7 | 39.2 | 36.8 |
| 9 | 41.6 | 41.5 | 41.3 | 41.1 | 40.7 | 40.0 | 38.8 | 37.0 |
| 10 | 40.4 | 40.5 | 40.5 | 40.5 | 40.3 | 39.7 | 38.5 | 36.8 |
| 11 | 40.1 | 40.2 | 40.2 | 40.2 | 40.1 | 39.6 | 38.5 | 37.0 |
| 12 | 40.5 | 40.6 | 40.6 | 40.5 | 40.3 | 39.6 | 38.5 | 37.0 |
| 13 | 41.5 | 41.4 | 41.3 | 41.0 | 40.5 | 39.8 | 38.6 | 37.0 |
| 14 | 41.9 | 41.9 | 41.6 | 41.2 | 40.6 | 39.7 | 38.4 | 36.8 |
| 15 | 42.8 | 42.3 | 41.7 | 40.9 | 40.1 | 39.2 | 38.1 | 36.4 |
| 16 | 38.9 | 38.8 | 38.6 | 38.3 | 37.8 | 37.2 | 36.4 | 35.1 |
| 17-128 | 38.2-40.4 | 38.2-40.2 | 38.0-39.7 | 37.6-39.2 | 36.9-38.4 | 35.9-37.4 | 34.5-36.1 | 32.9-34.8 |
| Partially-open with non-Power 5 guarantee | ||||||||
| 0 | 1 | 2 | 3 | 4 | 5 | 6 | 7 | |
| 1 | 84.2 | 76.9 | 70.5 | 61.2 | 54.6 | 46.4 | 39.7 | 31.8 |
| 2 | 52.6 | 52.7 | 52.1 | 49.7 | 47.7 | 43.7 | 39.6 | 34.4 |
| 3 | 55.5 | 54.1 | 52.4 | 49.5 | 47.2 | 43.3 | 39.5 | 34.8 |
| 4 | 44.6 | 44.4 | 43.7 | 42.3 | 41.1 | 38.7 | 36.1 | 32.7 |
| 5 | 45.6 | 45.3 | 44.4 | 42.8 | 41.3 | 38.7 | 36.2 | 32.9 |
| 6 | 45.7 | 45.6 | 44.7 | 43.1 | 41.6 | 38.9 | 36.2 | 32.9 |
| 7 | 50.6 | 49.8 | 48.9 | 47.5 | 46.2 | 43.7 | 41.1 | 37.6 |
| 8 | 44.4 | 44.3 | 44.2 | 43.7 | 43.0 | 41.7 | 39.6 | 36.6 |
| 9 | 42.8 | 42.6 | 42.4 | 41.9 | 41.3 | 40.3 | 38.7 | 36.5 |
| 10 | 41.0 | 41.1 | 41.0 | 40.9 | 40.5 | 39.8 | 38.6 | 36.8 |
| 11 | 40.2 | 40.3 | 40.4 | 40.5 | 40.4 | 39.8 | 38.6 | 36.9 |
| 12 | 40.4 | 40.5 | 40.5 | 40.5 | 40.4 | 39.7 | 38.6 | 37.0 |
| 13 | 41.4 | 41.4 | 41.2 | 40.9 | 40.5 | 39.7 | 38.5 | 36.9 |
| 14 | 41.8 | 41.8 | 41.6 | 41.2 | 40.6 | 39.8 | 38.6 | 36.9 |
| 15 | 42.7 | 42.2 | 41.7 | 40.9 | 40.2 | 39.2 | 38.1 | 36.5 |
| 16 | 39.2 | 39.2 | 39.0 | 38.6 | 38.1 | 37.5 | 36.6 | 35.2 |
| 17-128 | 38.2-40.4 | 38.2-40.2 | 38.0-39.7 | 37.6-39.2 | 36.9-38.4 | 35.9-37.4 | 34.5-36.1 | 32.9-34.8 |
Table 6
Simulation results for σE ∈ {3, 4, 5} in 7- and 8-team tournaments when
| Tournament type | Standard error of committee team strength estimate | |||||
| σE = 3 | σE = 4 | σE = 5 | ||||
| Validity | Effectiveness | Validity | Effectiveness | Validity | Effectiveness | |
| 4-Team fully-open (current system) | 97.2 | 47.6 | 93.8 | 47.5 | 87.5 | 46.0 |
| 8-Team fully-open | 99.8 | 42.2 | 98.9 | 42.3 | 96.3 | 42.0 |
| 8-Team partially-open | 99.4 | 44.1 | 98.3 | 43.8 | 94.9 | 42.9 |
| 8-Team fully-open w/ non-Power 5 | 98.8 | 44.2 | 96.7 | 43.6 | 93.5 | 42.5 |
| 8-Team partially-open w/ non-Power 5 | 98.4 | 45.6 | 95.7 | 45.0 | 91.5 | 43.5 |
| 7-Team fully-open | 99.4 | 47.3 | 98.1 | 46.5 | 94.5 | 45.0 |
| 7-Team partially-open | 98.4 | 48.2 | 95.5 | 47.2 | 91.2 | 45.4 |
| 7-Team fully-open w/ non-Power 5 | 99.2 | 47.7 | 97.0 | 46.8 | 93.0 | 45.2 |
| 7-Team partially-open w/ non-Power 5 | 95.7 | 49.0 | 92.3 | 47.7 | 86.5 | 45.2 |
Table 7
Simulation results for σE ∈ {3, 4, 5} in 7- and 8-team tournaments when
| Tournament type | Standard error of committee team strength estimate | |||||
| σE = 3 | σE = 4 | σE = 5 | ||||
| Validity | Effectiveness | Validity | Effectiveness | Validity | Effectiveness | |
| 4-Team fully-open (current system) | 97.2 | 46.1 | 93.8 | 46.0 | 87.5 | 44.5 |
| 8-Team fully-open | 99.8 | 40.2 | 98.9 | 40.4 | 96.3 | 40.0 |
| 8-Team partially-open | 98.8 | 42.2 | 96.7 | 41.6 | 93.5 | 40.7 |
| 8-Team fully-open w/ non-Power 5 | 99.4 | 42.1 | 98.3 | 41.9 | 94.9 | 41.0 |
| 8-Team partially-open w/ non-Power 5 | 98.5 | 43.7 | 95.7 | 43.0 | 91.5 | 41.7 |
| 7-Team fully-open | 99.4 | 45.7 | 98.1 | 44.9 | 94.5 | 43.4 |
| 7-Team partially-open | 98.4 | 46.6 | 95.5 | 45.6 | 91.2 | 43.8 |
| 7-Team fully-open w/ non-Power 5 | 99.2 | 46.1 | 97.0 | 45.2 | 93.0 | 43.6 |
| 7-Team partially-open w/ non-Power 5 | 95.7 | 47.5 | 92.3 | 46.2 | 86.8 | 43.7 |
Table 8
Simulation results for σE ∈ {3, 4, 5} in 12-team tournaments when
| Tournament type | Standard error of committee team strength estimate | |||||
| σE = 3 | σE = 4 | σE = 5 | ||||
| Validity | Effectiveness | Validity | Effectiveness | Validity | Effectiveness | |
| 4-Team fully-open (current system) | 97.2 | 47.6 | 93.8 | 47.5 | 87.5 | 46.0 |
| 12-Team fully-open | 99.8 | 42.4 | 98.9 | 42.2 | 96.3 | 41.6 |
| 12-Team partially-open | 99.4 | 42.4 | 98.3 | 42.2 | 94.9 | 41.5 |
| 12-Team fully-open w/ non-Power 5 | 98.8 | 42.4 | 96.7 | 42.2 | 93.5 | 41.6 |
| 12-Team partially-open w/ non-Power 5 | 98.4 | 42.4 | 95.7 | 42.3 | 91.5 | 41.6 |
Table 9
Simulation results for σE ∈ {3, 4, 5} in 12-team tournaments when
| Tournament type | Standard error of committee team strength estimate | |||||
| σE = 3 | σE = 4 | σE = 5 | ||||
| Validity | Effectiveness | Validity | Effectiveness | Validity | Effectiveness | |
| 4-Team fully-open (current system) | 97.2 | 46.1 | 93.8 | 46.0 | 87.5 | 44.5 |
| 12-Team fully-open | 100.0 | 40.5 | 99.8 | 40.2 | 99.0 | 39.7 |
| 12-Team partially-open | 99.9 | 40.5 | 99.6 | 40.3 | 98.2 | 39.6 |
| 12-Team fully-open w/ non-Power 5 | 100.0 | 40.5 | 99.7 | 40.3 | 98.5 | 39.8 |
| 12-Team partially-open w/ non-Power 5 | 99.8 | 40.5 | 99.4 | 40.4 | 97.7 | 39.7 |
Even in the case where the standard error of the committee’s team strength estimates is as high as 7 points, the validity results for fully-open tournaments show that the true best team is about 35% likely to be ranked highest; of course, as the standard error decreases, the validity increases to the expected maximum of 100% when the committee makes no errors.
As a result, except where the only team to automatically qualify for the tournament is the top non-Power-Five team (which is unlikely to be the true best), a 1-team tournament clearly has the highest effectiveness as long as the committee’s standard error of team strength estimate is 4 points or lower. When that standard error is 5, the 1-team tournament generally has the highest effectiveness by 1-2%, and for standard errors of 6 or 7 larger tournaments are better. For all tournament types and sizes, the effectiveness of the most-effective tournament decreases as the standard error of the committee’s estimates increases.
Another consequence of the committee’s estimation error being relatively low is that the simulation results show effectiveness tiers not by number of rounds of a tournament (e.g., tournaments of size 5-8 require three rounds to determine a champion; 9-16 teams require 4 rounds, etc.), but by the number of games that the top-ranked team needs to play. For example, the effectiveness of a 3-round tournament with 8 teams is more similar to the effectiveness of a 4-round tournament with 9 teams than to a 3-round tournament with 7 teams. The reason is that in a 7-team tournament, the top-ranked team (which is reasonably likely to be the true best team) gets a bye in the first round; without an 8th team, the top-ranked team automatically advances to the second round. So, the top-ranked team has only two chances for in-game randomness to cause it to be upset, whereas in an 8- or 9-team tournament, the top-ranked team has three such chances.
Our results show, therefore, tiers of similar effectiveness: Tournaments of size 2 or 3 have similar effectiveness, as do tournaments of size 4 through 7, tournaments of size 8 through 15, and tournaments of size 16 and greater. (Tournaments of size 32 to 63, size 64 to 127, and size 128 each require the top-ranked team to play an additional game; however, the probability of the top-ranked team defeating the 32nd, 64th, or 128th-ranked team is sufficiently high even with in-game randomness that there is not much impact on effectiveness.)
All of these observations hold whether the in-game randomness has a variance of 167 or 194, just with slightly different magnitudes.
7Discussion
The current playoff system is a fully-open 4-team tournament. Most of the main criticisms and defenses of this tournament system can be phrased in the language of effectiveness and validity. Validity-based arguments, that the best team might be left out of the tournament without expansion and/or guarantees of inclusion, include that the current tournament might leave out the true best team in some years, every Power-Five conference winner should have a chance to play for the championship, and top non-Power-Five teams deserve a chance. Effectiveness arguments, that in an expanded tournament the best team might be less likely to win, include that the field might be diluted in an expanded tournament. Aside from validity and effectiveness, there are also fan-based and economic-based arguments: Fans want to see the championship decided by teams playing each other, and a larger tournament with more playoff games might also have the economic benefit of increased revenue and increase the number of fans who can attend a playoff game. In this section, we address the first two sets of questions by observing our simulated tournaments’ validity and effectiveness, and then discuss the implications on the fan-based and economic arguments.
In Section 6, we show simulation results for committees that range from perfect (σE = 0) to approximately equal to the Sagarin ratings (σE = 7), but we believe it is unlikely that either extreme is correct. In this section, we consider the middle range of committee quality, σE ∈ {3, 4, 5}.
Tables 2 and 3 show the validity and effectiveness of the current 4-team fully-open tournament, as well as the validity and effectiveness of all four types of 8-team tournaments we tested. Increasing the tournament from 4 to 8 while retaining its fully-open character decreases effectiveness by 4-6%, while increasing validity by 2-9%. However, the need for tradeoff decreases when all conference champions and the top non-Power-Five team are guaranteed spots in an 8-team tournament; in that case, effectiveness decreases by just 2-3% while validity increases by 1-4%. In essence, the simulation results suggest that substituting an 8-team tournament with guarantees for conference champions and the top non-Power-Five team does not create significant changes in validity or effectiveness. The effectiveness is not significantly decreased by the increase in number of teams, and while the validity does not increase significantly, giving opportunities to all conference champions and the top non-Power-Five team does not hurt effectiveness.
Tables 2 and 3 also show that 7-team tournaments have the potential for good effectiveness/validity tradeoffs. A 7-team fully-open tournament provides validity increases of 2-7% while decreasing effectiveness by just 0.3-1.1% compared with the current 4-team fully-open tournament, and if σE is 3, a 7-team tournament with guarantees for conference champions provides small increases for both validity and effectiveness.
On the other hand, newer proposals for a 12-team tournament (e.g., CollegeFootballPlayoff.com (2021)) would have a greater impact on validity and effectiveness. Tables 4 and 5 show the validity and effectiveness of the current 4-team fully-open tournament as well as the validity and effectiveness of all four types of 12-team tournaments we tested. The simulation results show that expanding the tournament to 12 teams would decrease effectiveness by 5-6% no matter what, and increase validity by 2-12%. Unlike expansion to 7 or 8 teams where there might be little difference, changing from a 4-team tournament to a 12-team tournament includes a definite effectiveness/validity tradeoff in addition to the economic and fan effects.
Overall, when considering only 4-team and 8-team tournaments, our simulations suggest that the annual debate over tournament size may be much ado about nothing. Replacing the current 4-team fully-open tournament with an 8-team tournament with guarantees for conference champions and the top non-Power-Five team is likely to lead only to small changes in both validity and effectiveness. As a result, decision-makers can give full consideration to fan and economic issues. It is also possible to obtain increased validity with only a very small effectiveness change by switching to a 7-team partially-open tournament, albeit with one fewer playoff game (and the resulting fan and economic effects) than an 8-team tournament would require. On the other hand, if 12-team tournaments are under consideration, there is a distinct validity/effectiveness tradeoff involved: the tournament would be 2-12% more likely to include the true best team, but that true best team would be 5-6% less likely to be correctly identified by winning the championship.
Acknowledgements
The authors would like to thank two anonymous referees and an editor for their suggestions for strengthening this paper.
Appendices
Appendix 1:
Sagarin rating data
Table 10
Sagarin ratings, 2009-2012
| 2009 | 2010 | 2011 | 2012 | ||||
| Alabama | 100.25 | Auburn | 98.06 | Alabama | 104.17 | Alabama | 99.40 |
| Florida | 95.75 | Stanford | 98.05 | LSU | 100.30 | Oregon | 93.91 |
| Texas | 92.39 | Oregon | 96.98 | Oklahoma State | 97.01 | Texas A&M | 93.31 |
| TCU | 90.16 | TCU | 94.69 | Oklahoma | 92.48 | Georgia | 92.15 |
| Boise State | 89.35 | Alabama | 94.30 | Oregon | 91.82 | Notre Dame | 91.08 |
| Ohio State | 88.35 | Boise State | 93.03 | Arkansas | 91.06 | South Carolina | 90.10 |
| Virginia Tech | 87.69 | Ohio State | 92.75 | Stanford | 90.48 | Florida | 89.84 |
| Cincinnati | 86.84 | LSU | 91.16 | Wisconsin | 88.67 | Kansas State | 88.98 |
| Iowa | 85.82 | Arkansas | 88.77 | Boise State | 88.53 | Stanford | 87.85 |
| Penn State | 85.43 | Oklahoma | 88.72 | South Carolina | 88.23 | LSU | 87.63 |
| Oregon | 85.27 | Oklahoma State | 87.57 | Michigan | 86.54 | Florida State | 87.50 |
| Georgia Tech | 84.60 | Wisconsin | 86.99 | Southern California | 86.48 | Oklahoma | 85.70 |
| LSU | 84.22 | Virginia Tech | 86.10 | Baylor | 86.01 | Ohio State | 85.37 |
| Nebraska | 84.06 | Florida State | 85.19 | Texas A&M | 85.87 | Clemson | 85.21 |
| BYU | 83.60 | Mississippi State | 84.81 | Houston | 85.26 | Oregon State | 83.78 |
| Pittsburgh | 83.50 | Nevada | 84.44 | Missouri | 85.25 | Texas | 83.63 |
| Oklahoma | 83.15 | Missouri | 83.04 | Texas | 85.21 | Oklahoma State | 83.56 |
| Arkansas | 82.49 | NC State | 82.85 | Michigan State | 85.13 | Baylor | 82.64 |
| Mississippi | 82.38 | Notre Dame | 82.47 | Kansas State | 84.56 | Utah State | 82.41 |
| Southern California | 81.95 | Texas A&M | 82.37 | TCU | 84.13 | Michigan | 82.25 |
| Miami-Florida | 81.72 | Iowa | 82.35 | Georgia | 84.01 | Northwestern | 81.72 |
| Clemson | 81.54 | Southern California | 81.93 | West Virginia | 81.78 | Nebraska | 81.06 |
| Wisconsin | 81.21 | Arizona State | 81.54 | Florida State | 81.16 | Wisconsin | 81.02 |
| Utah | 80.59 | Florida | 81.34 | Southern Miss | 81.07 | Mississippi | 80.91 |
| Texas Tech | 80.25 | South Carolina | 81.11 | Nebraska | 81.06 | Vanderbilt | 80.77 |
| Georgia | 80.08 | Utah | 80.56 | Notre Dame | 79.91 | BYU | 80.26 |
| Auburn | 79.43 | Nebraska | 80.23 | Virginia Tech | 79.14 | Louisville | 79.98 |
| Connecticut | 79.42 | Washington | 80.09 | Penn State | 78.82 | Arizona State | 79.87 |
| Stanford | 78.89 | Oregon State | 79.99 | Florida | 78.78 | San Jose State | 79.87 |
| Florida State | 78.56 | Arizona | 79.29 | Cincinnati | 78.63 | Penn State | 78.83 |
| West Virginia | 78.55 | Michigan State | 79.28 | Mississippi State | 78.43 | UCLA | 78.51 |
| North Carolina | 78.47 | Pittsburgh | 78.76 | Clemson | 77.78 | TCU | 78.39 |
| Oregon State | 78.35 | California | 78.29 | Auburn | 77.40 | Southern California | 78.32 |
| Air Force | 78.21 | San Diego State | 78.29 | BYU | 77.18 | Michigan State | 78.15 |
| Tennessee | 77.96 | Tulsa | 78.03 | Tulsa | 77.02 | Cincinnati | 77.81 |
| Arizona | 77.64 | West Virginia | 78.03 | Rutgers | 76.98 | Texas Tech | 77.71 |
| Navy | 77.51 | Air Force | 77.94 | California | 76.20 | Syracuse | 77.61 |
| South Florida | 77.28 | Maryland | 77.85 | Utah | 75.92 | Northern Illinois | 77.33 |
| Oklahoma State | 77.28 | Illinois | 77.78 | Toledo | 75.21 | Missouri | 77.14 |
| Rutgers | 76.98 | Miami-Florida | 76.91 | Arizona State | 74.94 | Boise State | 76.99 |
| Central Michigan | 76.48 | North Carolina | 76.77 | Vanderbilt | 74.94 | Mississippi State | 76.80 |
| South Carolina | 76.43 | Central Florida | 75.85 | Iowa State | 74.64 | North Carolina | 76.70 |
| Boston College | 76.14 | Texas Tech | 74.50 | Washington | 74.52 | Arizona | 76.18 |
| Mississippi State | 76.04 | South Florida | 74.43 | Iowa | 74.51 | Central Florida(UCF) | 76.17 |
| California | 75.77 | BYU | 74.35 | Temple | 74.50 | Georgia Tech | 75.92 |
| Kentucky | 75.35 | Northern Illinois | 74.02 | Northern Illinois | 74.46 | Tulsa | 75.81 |
| Notre Dame | 75.31 | Hawaii | 73.74 | Louisiana Tech | 74.34 | West Virginia | 75.44 |
| UCLA | 75.03 | Syracuse | 73.68 | Ohio State | 74.19 | Miami-Florida | 75.27 |
| East Carolina | 74.52 | Boston College | 73.10 | Tennessee | 74.09 | Arkansas State | 75.25 |
| Washington | 74.34 | Penn State | 73.05 | SMU | 73.88 | Louisiana Tech | 75.15 |
| Houston | 73.54 | Louisville | 73.02 | Miami-Florida | 73.61 | Washington | 75.05 |
| Missouri | 73.42 | Clemson | 72.82 | Texas Tech | 73.17 | Rutgers | 74.62 |
| Michigan State | 73.28 | Georgia | 72.77 | North Carolina | 72.86 | Virginia Tech | 74.37 |
| Wake Forest | 72.55 | Navy | 72.71 | Illinois | 72.80 | Iowa State | 74.15 |
| Texas A&M | 71.72 | Connecticut | 72.68 | Georgia Tech | 72.31 | Tennessee | 73.50 |
| Fresno State | 71.39 | Kansas State | 72.15 | NC State | 71.70 | SMU | 72.94 |
| Northwestern | 70.95 | Michigan | 71.91 | Northwestern | 71.35 | Fresno State | 72.41 |
| Kansas | 70.88 | Baylor | 71.49 | South Florida | 71.02 | Pittsburgh | 72.40 |
| Middle Tennessee | 70.87 | UCLA | 71.41 | Nevada | 70.89 | Kent State | 72.25 |
| Minnesota | 70.61 | Tennessee | 70.71 | Louisville | 70.75 | Utah | 71.27 |
| SMU | 70.35 | Texas | 70.52 | Arizona | 70.52 | Louisiana-Lafayette | 71.07 |
| Iowa State | 70.30 | Iowa State | 69.25 | Purdue | 70.28 | NC State | 70.65 |
| Arizona State | 70.11 | Temple | 69.08 | UCLA | 70.18 | Arkansas | 70.64 |
| Kansas State | 69.79 | Cincinnati | 68.96 | Arkansas State | 69.89 | San Diego State | 69.94 |
| Troy | 69.60 | Colorado | 68.82 | Ohio | 69.81 | Ball State | 69.71 |
| Nevada | 69.43 | Southern Miss | 68.58 | Pittsburgh | 69.65 | Minnesota | 69.22 |
| Central Florida | 69.34 | Georgia Tech | 68.32 | San Diego State | 69.30 | Toledo | 69.04 |
| Temple | 69.24 | Northwestern | 68.08 | Virginia | 69.17 | Iowa | 68.79 |
| Virginia | 69.01 | Army | 67.64 | Air Force | 68.58 | Purdue | 68.63 |
| NC State | 68.85 | Kentucky | 67.62 | Wake Forest | 68.42 | Duke | 67.97 |
| Purdue | 68.60 | Miami-Ohio | 67.24 | Navy | 68.37 | Bowling Green | 67.90 |
| Southern Miss | 68.07 | Fresno State | 67.07 | Connecticut | 68.09 | Ohio | 67.59 |
| Duke | 67.87 | Washington State | 66.73 | Central Florida(UCF) | 67.61 | Indiana | 67.47 |
| Marshall | 67.60 | Troy | 66.63 | Western Michigan | 67.51 | Louisiana-Monroe | 66.89 |
| Baylor | 67.37 | Houston | 66.01 | Marshall | 67.49 | California | 66.64 |
| Michigan | 67.18 | SMU | 65.90 | Utah State | 67.43 | Nevada | 66.31 |
| Wyoming | 67.09 | Mississippi | 65.85 | Louisiana-Lafayette | 66.60 | Auburn | 65.86 |
| Syracuse | 67.05 | East Carolina | 65.82 | Washington State | 66.14 | Navy | 65.78 |
| Idaho | 66.19 | Virginia | 65.00 | Wyoming | 66.09 | Rice | 65.49 |
| Louisville | 66.13 | Fla. International | 64.99 | Kentucky | 66.03 | East Carolina | 65.24 |
| Ohio University | 66.13 | Idaho | 64.81 | Syracuse | 65.97 | Middle Tennessee | 65.03 |
| Louisiana Tech | 66.12 | Rutgers | 64.47 | Oregon State | 65.76 | South Florida | 64.88 |
| Colorado | 65.89 | Louisiana Tech | 64.40 | Minnesota | 64.89 | Virginia | 64.65 |
| Bowling Green | 65.35 | Toledo | 63.75 | Rice | 64.45 | Connecticut | 64.35 |
| UNLV | 64.91 | Minnesota | 63.74 | Boston College | 64.40 | Western Kentucky | 64.16 |
| Illinois | 64.37 | Duke | 63.61 | Kansas | 64.09 | Kentucky | 63.99 |
| Northern Illinois | 64.33 | Purdue | 63.19 | UTEP | 63.71 | Kansas | 63.57 |
| Tulsa | 63.96 | Indiana | 62.79 | East Carolina | 63.52 | Temple | 63.34 |
| Maryland | 63.83 | Western Michigan | 62.67 | Fla. International | 63.26 | Maryland | 63.28 |
| Indiana | 63.56 | Wake Forest | 61.63 | San Jose State | 62.99 | Troy | 63.01 |
| UAB | 63.49 | Ohio University | 61.10 | Hawaii | 62.79 | Washington State | 62.65 |
| Utah State | 63.33 | Wyoming | 60.44 | Miami-Ohio | 62.62 | Marshall | 61.25 |
| San Diego State | 62.52 | Marshall | 59.57 | Bowling Green | 62.57 | Houston | 61.23 |
| Vanderbilt | 62.47 | Utah State | 59.45 | Ball State | 62.43 | Wake Forest | 61.11 |
| Hawaii | 62.47 | UAB | 59.29 | Western Kentucky | 62.11 | Texas-San Antonio | 60.89 |
| Colorado State | 62.05 | Arkansas State | 59.27 | Mississippi | 61.77 | Central Michigan | 60.83 |
| Buffalo | 61.95 | Kansas | 59.04 | Maryland | 61.76 | Boston College | 60.42 |
| Louisiana-Monroe | 61.51 | Kent State | 59.01 | Fresno State | 61.68 | Western Michigan | 59.94 |
| UTEP | 59.94 | UTEP | 58.80 | Colorado | 61.65 | North Texas | 59.15 |
| Florida Atlantic | 59.26 | Vanderbilt | 58.20 | Army | 60.51 | Wyoming | 58.79 |
| Kent State | 58.07 | Rice | 58.17 | Duke | 60.07 | Memphis | 58.60 |
| Toledo | 57.77 | Colorado State | 57.66 | Kent State | 59.79 | Texas State | 58.36 |
| Louisiana-Lafayette | 57.67 | UNLV | 57.60 | Eastern Michigan | 59.57 | Miami-Ohio | 58.23 |
| Western Michigan | 57.31 | Central Michigan | 56.81 | North Texas | 59.18 | Illinois | 58.11 |
| Washington State | 57.16 | Tulane | 56.31 | Louisiana-Monroe | 58.88 | Fla. International | 58.09 |
| Arkansas State | 56.44 | Middle Tennessee | 55.27 | New Mexico State | 56.68 | Air Force | 57.57 |
| Memphis | 56.39 | Louisiana-Monroe | 55.12 | Buffalo | 56.15 | Buffalo | 57.54 |
| Army | 56.02 | North Texas | 53.78 | Central Michigan | 56.00 | Colorado State | 57.14 |
| Fla. International | 54.42 | Florida Atlantic | 53.27 | Indiana | 55.37 | Florida Atlantic | 56.65 |
| New Mexico | 54.19 | Ball State | 52.27 | Idaho | 54.74 | UTEP | 56.55 |
| Akron | 54.14 | San Jose State | 52.06 | Colorado State | 54.65 | UAB | 55.73 |
| San Jose State | 54.06 | Louisiana-Lafayette | 52.05 | Troy | 52.68 | New Mexico | 54.98 |
| Tulane | 53.55 | Bowling Green | 52.01 | UAB | 52.04 | Eastern Michigan | 54.27 |
| Rice | 53.26 | Western Kentucky | 51.31 | UNLV | 51.47 | Army | 53.81 |
| Ball State | 51.99 | New Mexico | 50.64 | Middle Tennessee | 48.29 | Tulane | 52.95 |
| New Mexico State | 51.95 | New Mexico State | 50.18 | Tulane | 47.69 | Colorado | 52.89 |
| Miami-Ohio | 51.52 | Memphis | 49.75 | New Mexico | 47.05 | UNLV | 52.84 |
| North Texas | 51.15 | Eastern Michigan | 47.94 | Memphis | 45.68 | Hawai’i | 51.25 |
| Eastern Michigan | 44.11 | Buffalo | 47.70 | Florida Atlantic | 43.84 | South Alabama | 50.19 |
| Western Kentucky | 43.67 | Akron | 42.68 | Akron | 42.49 | Idaho | 49.82 |
| Southern Miss | 49.70 | ||||||
| Akron | 49.40 | ||||||
| New Mexico State | 47.25 | ||||||
| Massachusetts | 46.83 | ||||||
Table 11
Sagarin ratings, 2013-2015
| 2013 | 2014 | 2015 | |||
| Florida State | 101.90 | Ohio State | 100.81 | Alabama | 100.92 |
| Oregon | 93.58 | TCU | 99.61 | Clemson | 94.82 |
| Alabama | 93.37 | Alabama | 97.42 | Ohio State | 92.92 |
| Auburn | 91.76 | Oregon | 95.71 | Oklahoma | 91.50 |
| Stanford | 91.57 | Georgia | 95.17 | Stanford | 90.71 |
| Michigan State | 90.76 | Michigan State | 93.49 | Mississippi | 90.03 |
| Missouri | 90.33 | Baylor | 90.62 | TCU | 87.72 |
| UCLA | 89.39 | Mississippi | 89.94 | Baylor | 87.38 |
| Baylor | 89.28 | Mississippi State | 89.32 | Michigan | 87.07 |
| South Carolina | 88.99 | Arkansas | 88.64 | Tennessee | 86.81 |
| Washington | 88.39 | Auburn | 88.56 | Notre Dame | 86.65 |
| Oklahoma | 88.08 | Georgia Tech | 87.25 | Florida State | 86.62 |
| Oklahoma State | 88.04 | Clemson | 86.98 | LSU | 85.81 |
| Clemson | 87.22 | LSU | 85.69 | Southern California | 84.59 |
| LSU | 87.22 | Missouri | 85.19 | Arkansas | 84.43 |
| Ohio State | 86.57 | Florida State | 84.48 | North Carolina | 84.26 |
| Wisconsin | 85.79 | Kansas State | 84.44 | Michigan State | 84.01 |
| Arizona State | 85.51 | Stanford | 84.34 | Mississippi State | 84.00 |
| Louisville | 85.05 | UCLA | 84.29 | Wisconsin | 83.06 |
| Southern California | 84.55 | Wisconsin | 83.89 | Oregon | 82.90 |
| Texas A&M | 83.56 | Southern California | 83.86 | Houston | 82.73 |
| Kansas State | 83.39 | Texas A&M | 83.11 | Iowa | 82.70 |
| Arizona | 83.32 | Marshall | 82.42 | Georgia | 82.65 |
| Central Florida(UCF) | 82.02 | Utah | 82.39 | Utah | 82.41 |
| Georgia | 81.96 | Arizona State | 81.74 | Washington | 82.35 |
| Mississippi | 80.49 | Florida | 81.62 | Oklahoma State | 81.67 |
| Notre Dame | 79.80 | Tennessee | 81.50 | West Virginia | 81.02 |
| Oregon State | 79.72 | Oklahoma | 81.48 | Florida | 80.74 |
| Texas Tech | 79.64 | Nebraska | 81.02 | Auburn | 80.02 |
| Mississippi State | 79.58 | Louisville | 80.56 | UCLA | 79.99 |
| Iowa | 78.68 | Notre Dame | 79.78 | Navy | 79.61 |
| Texas | 78.63 | West Virginia | 78.81 | California | 79.59 |
| Utah | 78.49 | Louisiana Tech | 77.69 | Texas A&M | 79.34 |
| BYU | 77.87 | South Carolina | 77.61 | Louisville | 79.01 |
| Vanderbilt | 77.76 | Boise State | 77.33 | Western Kentucky | 78.24 |
| Georgia Tech | 77.14 | Arizona | 77.17 | Toledo | 77.70 |
| Nebraska | 76.82 | Minnesota | 76.35 | Boise State | 77.66 |
| Bowling Green | 76.54 | Memphis | 76.15 | BYU | 77.31 |
| Washington State | 76.21 | Virginia Tech | 75.24 | Pittsburgh | 76.94 |
| Utah State | 76.15 | Miami-Florida | 74.94 | Arizona State | 76.80 |
| Duke | 75.97 | Duke | 74.94 | Nebraska | 76.55 |
| Virginia Tech | 75.91 | Boston College | 74.34 | Washington State | 76.36 |
| Michigan | 75.75 | Washington | 74.07 | Northwestern | 76.35 |
| North Carolina | 75.68 | Penn State | 73.73 | San Diego State | 76.15 |
| Boise State | 74.53 | Iowa | 73.24 | Virginia Tech | 75.76 |
| TCU | 74.11 | NC State | 73.16 | Texas Tech | 75.37 |
| Miami-Florida | 73.86 | Kentucky | 73.14 | Memphis | 75.04 |
| Houston | 73.84 | Maryland | 72.75 | Miami-Florida | 74.94 |
| Navy | 73.53 | Virginia | 72.69 | NC State | 74.72 |
| Penn State | 73.47 | Utah State | 72.65 | Penn State | 74.69 |
| Florida | 73.43 | Texas | 72.42 | Temple | 74.34 |
| Fresno State | 73.01 | Oklahoma State | 72.41 | Bowling Green | 73.96 |
| Pittsburgh | 72.94 | BYU | 71.61 | Georgia Tech | 73.57 |
| East Carolina | 72.54 | Cincinnati | 71.56 | Arizona | 73.37 |
| Indiana | 72.06 | Central Florida(UCF) | 71.22 | Texas | 73.20 |
| Minnesota | 72.06 | California | 71.16 | South Florida | 73.15 |
| Northern Illinois | 71.86 | Michigan | 70.86 | Duke | 72.91 |
| Tennessee | 71.86 | Pittsburgh | 70.84 | Kansas State | 72.39 |
| Marshall | 71.46 | Rutgers | 70.72 | Appalachian State | 71.63 |
| Syracuse | 70.91 | Georgia Southern | 69.55 | Georgia Southern | 70.96 |
| North Texas | 70.81 | East Carolina | 69.46 | Missouri | 70.75 |
| Boston College | 70.60 | Colorado State | 69.39 | Western Michigan | 70.63 |
| Northwestern | 70.08 | Northwestern | 69.34 | Minnesota | 70.59 |
| Cincinnati | 69.66 | Rice | 68.35 | South Carolina | 69.58 |
| Toledo | 67.69 | Navy | 68.20 | Marshall | 69.54 |
| Rice | 67.67 | Northern Illinois | 68.15 | Iowa State | 69.49 |
| Ball State | 67.35 | Toledo | 68.05 | Louisiana Tech | 69.32 |
| Colorado State | 67.14 | Houston | 67.88 | Indiana | 69.30 |
| Iowa State | 67.06 | Air Force | 67.74 | Southern Miss | 68.96 |
| Maryland | 66.79 | North Carolina | 67.57 | Illinois | 68.88 |
| West Virginia | 66.75 | Louisiana-Lafayette | 66.74 | Virginia | 68.61 |
| Colorado | 66.42 | Texas Tech | 66.49 | Air Force | 68.55 |
| Illinois | 66.33 | Western Kentucky | 66.27 | Utah State | 68.46 |
| Arkansas | 66.21 | Washington State | 65.86 | Cincinnati | 68.45 |
| San Diego State | 65.89 | Oregon State | 65.71 | Arkansas State | 66.85 |
| Texas-San Antonio | 65.58 | Illinois | 65.61 | Syracuse | 66.54 |
| Louisiana-Lafayette | 65.44 | UAB | 65.40 | Kentucky | 66.44 |
| San Jose State | 65.34 | Arkansas State | 65.13 | Vanderbilt | 66.23 |
| Buffalo | 64.97 | Temple | 65.02 | East Carolina | 66.05 |
| Western Kentucky | 64.78 | Western Michigan | 64.87 | Northern Illinois | 65.76 |
| Wake Forest | 64.72 | Indiana | 64.24 | Maryland | 65.76 |
| Florida Atlantic | 64.59 | Nevada | 64.18 | Boston College | 65.72 |
| South Alabama | 64.20 | San Diego State | 64.10 | Central Michigan | 64.88 |
| Tulane | 64.14 | Syracuse | 62.93 | Middle Tennessee | 64.72 |
| Arkansas State | 62.79 | Colorado | 62.38 | Colorado | 64.10 |
| Nevada | 62.59 | Purdue | 62.30 | Connecticut | 63.11 |
| UNLV | 62.26 | Central Michigan | 62.09 | Wake Forest | 63.05 |
| Rutgers | 61.85 | Appalachian State | 61.93 | Colorado State | 62.82 |
| SMU | 61.57 | UTEP | 61.43 | San Jose State | 62.61 |
| Middle Tennessee | 61.04 | Iowa State | 61.42 | Ohio | 62.49 |
| Kentucky | 60.92 | Middle Tennessee | 60.89 | Tulsa | 61.81 |
| Virginia | 60.57 | Fresno State | 59.02 | Rutgers | 61.69 |
| Memphis | 60.46 | Texas State | 58.90 | Akron | 61.46 |
| NC State | 59.79 | Kansas | 58.32 | Nevada | 61.39 |
| Troy | 59.36 | Old Dominion | 58.10 | Purdue | 59.93 |
| Temple | 58.73 | Ball State | 57.72 | Oregon State | 59.48 |
| California | 58.54 | Bowling Green | 57.25 | New Mexico | 59.46 |
| Kansas | 58.41 | Vanderbilt | 57.21 | Troy | 58.42 |
| Connecticut | 58.28 | Fla. International | 56.99 | Georgia State | 56.92 |
| Ohio | 58.18 | Hawai’i | 56.62 | Buffalo | 56.38 |
| Kent State | 58.08 | Wake Forest | 56.46 | UNLV | 54.94 |
| Hawai’i | 56.73 | Wyoming | 56.26 | Fresno State | 53.65 |
| Louisiana-Monroe | 56.71 | Louisiana-Monroe | 56.06 | Florida Atlantic | 52.78 |
| Tulsa | 55.86 | South Alabama | 56.00 | SMU | 52.75 |
| Wyoming | 55.84 | New Mexico | 55.11 | Fla. International | 52.15 |
| Akron | 55.42 | Akron | 54.88 | Ball State | 51.78 |
| Central Michigan | 55.27 | Ohio | 54.88 | South Alabama | 51.61 |
| Texas State | 53.72 | Texas-San Antonio | 54.32 | Louisiana-Lafayette | 51.47 |
| South Florida | 53.66 | Florida Atlantic | 53.82 | Massachusetts | 51.29 |
| New Mexico | 53.40 | Southern Miss | 53.61 | Rice | 50.98 |
| Army | 51.95 | Buffalo | 53.57 | Army | 50.96 |
| Purdue | 51.65 | Tulane | 53.29 | Idaho | 49.88 |
| Air Force | 49.87 | North Texas | 52.96 | Tulane | 49.75 |
| Louisiana Tech | 48.21 | South Florida | 52.74 | UTSA | 49.24 |
| UAB | 47.93 | San Jose State | 52.01 | Wyoming | 49.19 |
| Georgia State | 44.65 | Massachusetts | 51.72 | Kansas | 48.79 |
| UTEP | 44.42 | Army | 51.56 | Texas State | 48.24 |
| Idaho | 42.44 | Miami-Ohio | 50.33 | Kent State | 47.82 |
| New Mexico State | 42.38 | Tulsa | 48.45 | Miami-Ohio | 47.67 |
| Western Michigan | 42.38 | Kent State | 47.65 | UTEP | 47.61 |
| Massachusetts | 41.45 | UNLV | 46.87 | Old Dominion | 47.51 |
| Southern Miss | 40.57 | Idaho | 46.78 | Hawai’i | 47.42 |
| Eastern Michigan | 38.81 | Troy | 46.19 | Central Florida(UCF) | 46.15 |
| Fla. International | 35.80 | New Mexico State | 45.20 | New Mexico State | 45.97 |
| Miami-Ohio | 35.24 | Connecticut | 44.71 | Louisiana-Monroe | 45.87 |
| Georgia State | 41.07 | North Texas | 42.59 | ||
| SMU | 39.16 | Eastern Michigan | 42.08 | ||
| Eastern Michigan | 38.81 | Charlotte | 39.00 | ||
Table 12
Sagarin ratings, 2016-2019
| 2016 | 2017 | 2018 | 2019 | ||||
| Clemson | 105.35 | Alabama | 101.18 | Clemson | 103.16 | LSU | 104.88 |
| Alabama | 105.33 | Ohio State | 97.15 | Alabama | 101.44 | Ohio State | 104.83 |
| Michigan | 94.05 | Georgia | 96.70 | Ohio State | 92.33 | Clemson | 101.53 |
| Washington | 93.28 | Penn State | 95.65 | Georgia | 91.50 | Alabama | 98.50 |
| Ohio State | 93.27 | Clemson | 95.32 | Oklahoma | 90.99 | Georgia | 94.44 |
| Oklahoma | 93.21 | Oklahoma | 94.31 | Michigan | 88.80 | Oregon | 93.65 |
| LSU | 91.99 | Wisconsin | 94.30 | Notre Dame | 87.43 | Oklahoma | 93.37 |
| Florida State | 91.56 | Auburn | 91.45 | Mississippi State | 87.32 | Penn State | 92.27 |
| Wisconsin | 90.59 | Washington | 89.29 | Washington | 87.05 | Wisconsin | 92.22 |
| Southern California | 89.92 | Notre Dame | 88.90 | Iowa | 86.60 | Florida | 90.67 |
| Oklahoma State | 89.71 | Oklahoma State | 87.58 | Penn State | 86.27 | Notre Dame | 90.56 |
| Miami-Florida | 88.28 | TCU | 87.39 | Texas A&M | 85.68 | Michigan | 89.58 |
| Penn State | 87.77 | Central Florida (UCF) | 87.11 | Florida | 85.21 | Auburn | 88.57 |
| Florida | 87.04 | Stanford | 85.79 | LSU | 85.16 | Iowa | 87.50 |
| Virginia Tech | 85.25 | Southern California | 85.42 | Auburn | 84.97 | Texas | 86.53 |
| Kansas State | 84.75 | Miami-Florida | 84.47 | West Virginia | 83.76 | Baylor | 86.22 |
| Auburn | 83.40 | Mississippi State | 84.35 | Texas A&M | 83.45 | Washington | 86.13 |
| Stanford | 83.24 | Iowa | 83.80 | Missouri | 83.43 | Minnesota | 84.30 |
| Western Kentucky | 83.07 | LSU | 83.66 | Washington State | 83.22 | Texas A&M | 84.20 |
| Tennessee | 82.68 | Northwestern | 83.54 | Fresno State | 82.36 | Utah | 83.82 |
| Western Michigan | 82.22 | Virginia Tech | 83.50 | Central Florida(UCF) | 82.18 | Memphis | 83.37 |
| Louisville | 81.96 | NC State | 82.92 | Utah | 82.05 | Oklahoma State | 81.39 |
| Georgia Tech | 81.11 | Michigan State | 82.92 | Stanford | 81.37 | Central Florida(UCF) | 81.29 |
| NC State | 80.99 | Louisville | 81.59 | Wisconsin | 81.12 | Navy | 81.27 |
| Minnesota | 80.06 | Iowa State | 81.48 | Kentucky | 80.44 | Appalachian State | 81.06 |
| Colorado | 80.03 | Michigan | 81.47 | Utah State | 79.47 | Southern California | 80.73 |
| San Diego State | 79.98 | Texas | 81.43 | Syracuse | 79.45 | Kansas State | 80.60 |
| West Virginia | 79.74 | Florida State | 80.07 | Boise State | 79.21 | Iowa State | 80.25 |
| Tulsa | 79.72 | Wake Forest | 79.95 | NC State | 79.13 | Air Force | 80.04 |
| Texas A&M | 79.53 | Kansas State | 79.48 | Oklahoma State | 79.01 | Cincinnati | 79.84 |
| North Carolina | 79.45 | Memphis | 78.78 | Northwestern | 78.37 | Boise State | 78.55 |
| South Florida | 79.42 | Boise State | 78.36 | Michigan State | 78.14 | Kentucky | 78.32 |
| Washington State | 79.08 | South Carolina | 78.31 | Miami-Florida | 78.11 | Virginia | 78.25 |
| Northwestern | 78.72 | Utah | 78.06 | Oregon | 78.00 | Tennessee | 77.74 |
| BYU | 78.27 | Boston College | 77.88 | Appalachian State | 77.09 | Michigan State | 77.01 |
| Utah | 77.91 | Purdue | 77.77 | Iowa State | 76.72 | Arizona State | 76.97 |
| Georgia | 77.48 | Washington State | 77.57 | Boston College | 76.46 | TCU | 76.42 |
| Pittsburgh | 77.44 | Duke | 77.54 | Cincinnati | 76.41 | Indiana | 75.94 |
| Appalachian State | 76.74 | Oregon | 77.15 | TCU | 76.38 | North Carolina | 75.94 |
| Iowa | 76.45 | South Florida | 76.68 | South Carolina | 76.31 | California | 75.82 |
| Baylor | 76.34 | Georgia Tech | 76.27 | Minnesota | 76.14 | Florida Atlantic | 75.80 |
| Temple | 75.46 | Texas A&M | 75.45 | Virginia | 75.98 | Lousiana | 74.78 |
| Nebraska | 74.18 | Arizona State | 74.75 | Army West Point | 75.83 | Virginia Tech | 74.47 |
| Arkansas | 74.06 | Pittsburgh | 74.67 | Arizona State | 75.63 | SMU | 74.25 |
| Mississippi State | 74.05 | Florida Atlantic | 74.40 | Texas Tech | 75.62 | Washington State | 74.18 |
| Wake Forest | 73.93 | Texas Tech | 74.09 | Purdue | 75.43 | Mississippi State | 73.26 |
| TCU | 73.35 | West Virginia | 73.97 | Georgia Tech | 75.12 | Louisville | 73.22 |
| Memphis | 73.16 | Indiana | 73.76 | Duke | 74.67 | Nebraska | 72.87 |
| Notre Dame | 72.95 | Missouri | 73.74 | Pittsburgh | 74.36 | San Diego State | 72.55 |
| Toledo | 72.51 | Arizona | 73.56 | Southern California | 74.11 | Texas Tech | 72.23 |
| Air Force | 72.50 | Fresno State | 73.49 | Kansas State | 73.59 | West Virginia | 72.21 |
| Arkansas State | 72.22 | California | 73.05 | Memphis | 73.20 | Missouri | 72.19 |
| Houston | 71.85 | Navy | 72.79 | Nebraska | 73.01 | South Carolina | 72.17 |
| Mississippi | 71.59 | UCLA | 72.57 | Ohio | 72.77 | Florida State | 71.96 |
| California | 71.35 | Mississippi | 71.92 | Maryland | 72.67 | Oregon State | 71.44 |
| Louisiana Tech | 70.78 | Appalachian State | 71.85 | Vanderbilt | 72.62 | Mississippi | 71.38 |
| Texas | 70.63 | San Diego State | 71.78 | California | 72.37 | Tulane | 71.14 |
| Navy | 70.31 | Army West Point | 71.58 | Wake Forest | 72.32 | Wake Forest | 70.05 |
| Boston College | 70.28 | Houston | 71.11 | Temple | 72.12 | UCLA | 69.92 |
| Troy | 69.76 | Minnesota | 70.68 | Baylor | 71.26 | Pittsburgh | 69.76 |
| Boise State | 69.62 | Ohio | 70.09 | BYU | 71.20 | Colorado | 69.75 |
| Kentucky | 69.62 | Kentucky | 70.04 | Virginia Tech | 71.19 | Wyoming | 69.55 |
| Vanderbilt | 69.57 | Troy | 69.89 | Arizona | 70.74 | Syracuse | 69.48 |
| Texas Tech | 69.14 | Florida | 69.82 | Indiana | 70.74 | Boston College | 69.34 |
| Indiana | 68.84 | Toledo | 69.59 | Florida State | 70.47 | BYU | 69.13 |
| UCLA | 68.27 | Colorado | 68.51 | Mississippi | 70.35 | Hawai’i | 68.78 |
| Iowa State | 68.18 | Temple | 68.38 | Tennessee | 70.22 | Purdue | 68.40 |
| Colorado State | 67.96 | North Carolina | 68.27 | UCLA | 69.76 | Miami-Florida | 68.35 |
| Idaho | 67.89 | Syracuse | 68.08 | Colorado | 69.55 | Northwestern | 68.10 |
| Old Dominion | 67.66 | Wyoming | 67.51 | UAB | 68.78 | Houston | 67.89 |
| Oregon State | 67.59 | Arkansas | 67.29 | Houston | 68.36 | Stanford | 67.76 |
| New Mexico | 67.43 | Nebraska | 67.21 | Toledo | 67.99 | Western Kentucky | 67.54 |
| Oregon | 67.40 | Northern Illinois | 67.04 | Troy | 67.24 | Buffalo | 67.50 |
| Wyoming | 66.97 | Maryland | 65.82 | Air Force | 67.21 | Temple | 66.39 |
| Duke | 66.61 | Louisiana Tech | 65.80 | Marshall | 66.29 | Duke | 66.37 |
| Missouri | 66.29 | Virginia | 65.71 | Buffalo | 66.20 | Tulsa | 66.02 |
| South Carolina | 66.18 | Vanderbilt | 65.66 | Wyoming | 66.00 | Illinois | 65.97 |
| Syracuse | 65.95 | Colorado State | 65.39 | Georgia Southern | 65.86 | Louisiana Tech | 65.81 |
| Michigan State | 95.93 | Marshall | 64.97 | North Texas | 65.55 | Utah State | 65.71 |
| Central Florida(UCF) | 64.70 | SMU | 63.73 | Northern Illinois | 65.48 | Ohio | 65.65 |
| Army West Point | 64.32 | Western Michigan | 63.51 | Miami-Ohio | 65.30 | Arizona | 64.94 |
| Maryland | 63.98 | Arkansas State | 63.40 | Tulane | 65.22 | Marshall | 64.53 |
| Arizona State | 63.86 | Utah State | 63.22 | Arkansas State | 65.08 | Kansas | 64.04 |
| SMU | 63.13 | Tulane | 63.07 | Nevada | 65.05 | Western Michigan | 64.03 |
| Southern Miss | 63.09 | Tennessee | 63.01 | North Carolina | 64.75 | Arkansas State | 63.52 |
| Northern Illinois | 62.34 | Air Force | 62.38 | Middle Tennessee | 64.61 | Kent State | 63.18 |
| Ohio State | 62.20 | Buffalo | 62.03 | Eastern Michigan | 64.53 | Georgia Southern | 63.09 |
| UTSA | 61.18 | Eastern Michigan | 61.82 | Kansas | 64.31 | Miami-Ohio | 62.80 |
| Arizona | 61.14 | Baylor | 61.66 | San Diego State | 63.61 | Fresno State | 62.01 |
| Hawai’i | 60.62 | Rutgers | 61.66 | Florida Atlantic | 62.65 | Ball State | 61.41 |
| Miami-Ohio | 60.51 | Central Michigan | 61.46 | Arkansas | 62.49 | Maryland | 61.39 |
| Virginia | 59.99 | Middle Tennessee | 61.09 | Fla. International | 62.42 | South Florida | 61.20 |
| Georgia Southern | 59.67 | North Texas | 61.04 | South Florida | 61.36 | Southern Miss | 61.17 |
| Tulane | 59.62 | Southern Miss | 60.05 | Louisiana Tech | 61.09 | Troy | 60.63 |
| Illinois | 59.21 | Tulsa | 59.43 | SMU | 60.72 | Liberty | 60.58 |
| Utah State | 58.85 | Miami-Ohio | 59.12 | Western Michigan | 60.26 | Central Michigan | 60.42 |
| Eastern Michigan | 58.17 | UTSA | 58.82 | Navy | 60.19 | Colorado State | 60.34 |
| Louisiana-Lafayette | 58.11 | BYU | 58.77 | Southern Miss | 60.17 | UAB | 60.08 |
| Cincinnati | 57.46 | New Mexico State | 58.03 | Illinois | 59.37 | NC State | 60.04 |
| East Carolina | 57.46 | Nevada | 58.02 | Lousiana | 58.59 | Georgia Tech | 59.73 |
| Central Michigan | 57.27 | Fla. International | 57.85 | Louisville | 58.48 | Army West Point | 59.72 |
| Nevada | 56.40 | Akron | 57.69 | Tusla | 57.91 | Vanderbilt | 59.12 |
| Middle Tennessee | 56.16 | UNLV | 57.40 | Oregon State | 56.96 | Nevada | 58.93 |
| South Alabama | 56.11 | Massachusetts | 57.30 | Hawai’i | 56.11 | ULM | 58.72 |
| Kansas | 55.22 | Illinois | 56.04 | ULM | 55.97 | San Jose State | 58.48 |
| Purdue | 54.97 | UAB | 55.55 | Rutgers | 55.46 | Eastern Michigan | 58.33 |
| San Jose State | 53.71 | Cincinnati | 55.42 | Colorado State | 55.25 | Charlotte | 57.64 |
| Ball State | 53.51 | East Carolina | 55.13 | UNLV | 54.49 | Arkansas State | 57.61 |
| Bowling Green | 53.34 | Oregon State | 54.37 | New Mexico | 54.35 | Fla. International | 57.49 |
| Arkon | 52.53 | Western Kentucky | 54.19 | Western Kentucky | 53.35 | Georgia State | 57.42 |
| Georgia State | 52.32 | Louisiana -Monroe | 54.04 | Akron | 53.21 | Northern Illinois | 56.63 |
| Massachusetts | 51.48 | Idaho | 53.74 | Ball State | 53.03 | Toledo | 56.55 |
| Fla. International | 51.38 | Connecticut | 53.61 | Charlotte | 52.59 | Middle Tennessee | 56.47 |
| UNLV | 51.15 | Georgia State | 53.23 | Massachusetts | 52.50 | UNLV | 56.44 |
| North Texas | 51.11 | New Mexico | 53.09 | Liberty | 52.48 | Coastal Carolina | 55.33 |
| Louisiana-Monroe | 50.26 | Bowling Green | 52.98 | East Carolina | 52.44 | North Texas | 54.18 |
| Kent State | 50.25 | Georgia Southern | 51.84 | Coastal Carolina | 52.40 | Rutgers | 53.59 |
| Connecticut | 50.11 | Old Dominion | 51.78 | San Jose State | 51.42 | East Carolina | 52.80 |
| Rutgers | 49.82 | Louisiana-Lafayette | 51.15 | Georgia State | 51.01 | Rice | 52.27 |
| Charlotte | 49.45 | Hawai’i | 50.56 | Central Michigan | 50.65 | Texas State | 49.33 |
| New Mexico State | 49.25 | South Alabama | 50.54 | Old Dominion | 50.52 | UTSA | 48.77 |
| Marshall | 49.05 | Kansas | 49.75 | Bowling Green | 50.10 | New Mexico | 48.75 |
| UTEP | 48.87 | Coastal Carolina | 48.72 | Kent State | 49.30 | South Alabama | 48.71 |
| Rice | 47.95 | Rice | 43.82 | South Alabama | 47.17 | New Mexico State | 45.85 |
| Florida Atlantic | 47.75 | San Jose State | 43.42 | New Mexico State | 46.53 | Bowling Green | 43.98 |
| Fresno State | 45.77 | Texas State | 42.83 | UTSA | 45.69 | Old Dominion | 43.74 |
| Buffalo | 44.84 | Kent State | 42.66 | Texas State | 45.53 | Connecticut | 42.99 |
| Texas State | 38.00 | Ball State | 40.15 | Rice | 43.41 | UTEP | 37.98 |
| Charlotte | 39.80 | Connecticut | 43.01 | Akron | 33.56 | ||
| UTEP | 38.38 | UTEP | 41.02 | Massachusetts | 30.72 | ||
Table 13
Power-Five conference champions and top non-Power-Five teams, 2009-2015
| Conference | 2009 | 2010 | 2011 | 2012 | 2013 | 2014 | 2015 | |||||||
| ACC | Georgia Tech | 84.60 | Virginia Tech | 86.10 | Clemson | 77.78 | Florida State | 87.50 | Florida State | 101.90 | Florida State | 84.48 | Clemson | 94.82 |
| Big 12 | Texas | 92.39 | Oklahoma | 88.72 | Oklahoma State | 97.01 | Kansas State | 88.98 | Baylor | 89.28 | TCU | 99.61 | Oklahoma | 91.50 |
| Big Ten | Ohio State | 88.35 | Wisconsin | 86.99 | Wisconsin | 88.67 | Wisconsina | 81.02 | Michigan State | 90.76 | Ohio State | 100.81 | Michigan State | 84.01 |
| Pac-12 | Oregon | 85.27 | Oregon | 96.98 | Oregon | 91.82 | Stanford | 87.85 | Stanford | 91.57 | Oregon | 95.71 | Stanford | 90.71 |
| SEC | Alabama | 100.25 | Auburn | 98.06 | LSU | 100.3 | Alabama | 99.40 | Auburn | 91.76 | Alabama | 97.42 | Alabama | 100.92 |
| Non-Power-Five | Boise State | 89.35 | Boise State | 93.03 | Boise State | 88.53 | Utah State | 82.41 | Louisville | 85.05 | Marshall | 82.42 | Houston | 82.72 |
aOhio State (12-0, ranked #3 by the AP poll with Sagarin rating of 85.37) was ineligible for postseason play, so Wisconsin (81.02) was the official Big Ten champion after winning the conference championship game.
Table 14
Power-Five conference champions and top non-Power-Five teams, 2016-2019
| Conference | 2016 | 2017 | 2018 | 2019 | ||||
| ACC | Clemson | 105.35 | Clemson | 95.32 | Clemson | 103.16 | Clemson | 101.53 |
| Big 12 | Oklahoma | 93.21 | Oklahoma | 94.31 | Oklahoma | 90.99 | Oklahoma | 93.37 |
| Big Ten | Penn State | 87.77 | Ohio State | 97.15 | Ohio State | 92.33 | Ohio State | 104.83 |
| Pac-12 | Washington | 93.28 | Southern California | 74.11 | Washington | 87.05 | Oregon | 93.65 |
| SEC | Alabama | 105.33 | Georgia | 96.70 | Alabama | 101.44 | LSU | 104.88 |
| Non-Power-Five | Western Kentucky | 83.07 | Central Florida | 87.11 | Fresno State | 82.36 | Memphis | 83.37 |
Appendices
Appendix 2:
Parameterized validity and effectiveness graphs
This appendix contains the validity and effectiveness of tournaments parameterized over the values of σR and σEObs. Each figure contains a 17 × 14 grid of line graphs; the graph in the ith row from the top and the jth column from the left shows the results of tournaments with σR = i and σEObs = j. The line in each graph, from left to right, shows the validity or effectiveness (from 0% to 100%) as tournaments increase in size from 1 team to 128 teams.
Fig. 2
Validity of fully-open tournaments, parameterized over σR and σEObs.

Fig. 3
Validity of partially-open tournaments with Power-Five conference guarantees only, parameterized over σR and σEObs.

Fig. 4
Validity of partially-open tournaments with non-Power-Five conference guarantee only, parameterized over σR and σEObs.

Fig. 5
Validity of partially-open tournaments with both Power-Five and non-Power-Five conference guarantees, parameterized over σR and σEObs.

Fig. 6
Effectiveness of fully-open tournaments, parameterized over σR and σEObs.

Fig. 7
Effectiveness of partially-open tournaments with Power-Five conference guarantees only, parameterized over σR and σEObs.

Fig. 8
Effectiveness of partially-open tournaments with non-Power-Five conference guarantee only, parameterized over σR and σEObs.

Fig. 9
Effectiveness of partially-open tournaments with both Power-Five and non-Power-Five conference guarantees, parameterized over σR and σEObs.

Appendices
Appendix 3:
Conditional distribution of real team strength given observed team strength
Given an observed team strength
(16)
(17)
(18)
Since
(19)
(20)
So, STrue|SObs is normally distributed, according to
(21)
Appendices
Appendix 4:
Rematch data, 1997-2019
This appendix shows the 63 times from 1997 to 2019 that two teams played each other twice in a season. As in Curry and Sokol (2016), we use this information, to estimate the variance of randomness
Table 15
Rematch data, 1997-2019. Types of games include regular season (“Reg”), conference championship game (“Conf”), and postseason bowl game (“Bowl”).
| Season | Teams | Date | Type | Home team | Line | Result | |
| 1997 | LSU | Notre Dame | 11/15/1997 | Reg | LSU | Notre Dame by 11 | Notre Dame by 18 |
| 12/28/1997 | Bowl | neutral | LSU by 7 | LSU by 18 | |||
| 1999 | Alabama | Florida | 10/02/1999 | Reg | Florida | Florida by 16 | Alabama by 1 |
| 12/04/1999 | Conf | neutral | Florida by 7.5 | Alabama by 27 | |||
| 1999 | Nebraska | Texas | 10/23/1999 | Reg | Texas | Nebraska by 16.5 | Texas by 4 |
| 12/04/1999 | Conf | neutral | Nebraska by 9.5 | Nebraska by 16 | |||
| 1999 | Marshall | W Michigan | 11/13/1999 | Reg | W Michigan | Marshall by 12.5 | Marshall by 14 |
| 12/03/1999 | Conf | Marshall | Marshall by 20.5 | Marshall by 4 | |||
| 2000 | Marshall | W Michigan | 10/05/2000 | Reg | Marshall | Marshall by 7 | W Michigan by 20 |
| 12/02/2000 | Conf | Marshall | W Michigan by 6 | Marshall by 5 | |||
| 2000 | Auburn | Florida | 10/14/2000 | Reg | Florida | Florida by 9.5 | Florida by 31 |
| 12/02/2000 | Conf | neutral | Florida by 9.5 | Florida by 22 | |||
| 2000 | Kansas St | Oklahoma | 10/14/2000 | Reg | Kansas St | Kansas St by 9.5 | Oklahoma by 10 |
| 12/02/2000 | Conf | neutral | Oklahoma by 2 | Oklahoma by 3 | |||
| 2001 | LSU | Tennessee | 09/29/2001 | Reg | Tennessee | Tennessee by 8 | Tennessee by 8 |
| 12/08/2001 | Conf | neutral | LSU by 7 | LSU by 11 | |||
| 2001 | Colorado | Texas | 10/20/2001 | Reg | Texas | Texas by 12 | Texas by 34 |
| 12/01/2001 | Conf | neutral | Texas by 9 | Colorado by 2 | |||
| 2002 | Colorado | Oklahoma | 11/02/2002 | Reg | Oklahoma | Oklahoma by 13.5 | Oklahoma by 16 |
| 12/07/2002 | Conf | neutral | Colorado by 7.5 | Oklahoma by 22 | |||
| 2003 | Georgia | LSU | 09/20/2003 | Reg | LSU | LSU by 1.5 | LSU by 7 |
| 12/06/2003 | Conf | neutral | LSU by 3 | LSU by 21 | |||
| 2003 | Florida St | Miami (FL) | 10/11/2003 | Reg | Florida St | Florida St by 7 | Miami (FL) by 8 |
| 01/01/2004 | Bowl | neutral | Florida St by 1.5 | Miami (FL) by 2 | |||
| 2003 | Bowling Green | Miami (OH) | 11/04/2003 | Reg | Miami (OH) | Miami (OH) by 7 | Miami (OH) by 23 |
| 12/04/2003 | Conf | Bowling Green | Miami (OH) by 6.5 | Miami (OH) by 22 | |||
| 2004 | Auburn | Tennessee | 10/02/2004 | Reg | Tennessee | Tennessee by 1.5 | Auburn by 24 |
| 12/04/2004 | Conf | neutral | Auburn by 14.5 | Auburn by 10 | |||
| 2004 | Miami (OH) | Toledo | 11/02/2004 | Reg | Miami (OH) | Miami (OH) by 6 | Miami (OH) by 7 |
| 12/02/2004 | Conf | neutral | Toledo by 1 | Toledo by 8 | |||
| 2005 | Akron | N Illinois | 09/24/2005 | Reg | Akron | N Illinois by 8 | Akron by 6 |
| 12/01/2005 | Conf | neutral | N Illinois by 13 | Akron by 1 | |||
| 2005 | Colorado | Texas | 10/15/2005 | Reg | Texas | Texas by 15.5 | Texas by 25 |
| 12/03/2005 | Conf | neutral | Texas by 25 | Texas by 67 | |||
| 2006 | Houston | Southern Miss | 10/14/2006 | Reg | Southern Miss | Southern Miss by 1.5 | Southern Miss by 4 |
| 12/01/2006 | Conf | Houston | Houston by 5 | Houston by 14 | |||
| 2007 | BYU | UCLA | 09/08/2007 | Reg | UCLA | UCLA by 8 | UCLA by 10 |
| 12/22/2007 | Bowl | neutral | BYU by 6.5 | BYU by 1 | |||
| 2007 | Central Michigan | Purdue | 09/15/2007 | Reg | Purdue | Central Michigan by 21.5 | Purdue by 23 |
| 12/26/2007 | Bowl | neutral | Central Michigan by 8 | Purdue by 3 | |||
| 2007 | Missouri | Oklahoma | 10/13/2007 | Reg | Oklahoma | Oklahoma by 13 | Oklahoma by 10 |
| 12/01/2007 | Conf | neutral | Oklahoma by 3 | Oklahoma by 21 | |||
| 2007 | Tulsa | UCF | 10/20/2007 | Reg | UCF | UCF by 3 | UCF by 21 |
| 12/01/2007 | Conf | UCF | UCF by 8 | UCF by 19 | |||
| 2007 | Boston College | Virginia Tech | 10/25/2007 | Reg | Virginia Tech | Virginia Tech by 3 | Boston College by 4 |
| 12/01/2007 | Conf | neutral | Virginia Tech by 4.5 | Virginia Tech by 14 | |||
| 2008 | Air Force | Houston | 09/13/2008 | Reg | Houston | Houston by 2.5 | Air Force by 3 |
| 12/31/2008 | Bowl | neutral | Houston by 5.5 | Houston by 6 | |||
| 2008 | Navy | Wake Forest | 09/27/2008 | Reg | Wake Forest | Wake Forest by 17 | Navy by 7 |
| 12/20/2008 | Bowl | neutral | Wake Forest by 3 | Wake Forest by 10 | |||
| 2008 | Boston College | Virginia Tech | 10/18/2008 | Reg | Boston College | Boston College by 3 | Boston College by 5 |
| 12/06/2008 | Conf | neutral | Boston College by 1 | Virginia Tech by 18 | |||
| 2009 | Clemson | Georgia Tech | 09/10/2009 | Reg | Georgia Tech | Georgia Tech by 5 | Georgia Tech by 3 |
| 12/05/2009 | Conf | neutral | Even | Georgia Tech by 5 | |||
| 2010 | Nebraska | Washington | 09/18/2010 | Reg | Washington | Nebraska by 3 | Nebraska by 35 |
| 12/30/2010 | Bowl | neutral | Nebraska by 13.5 | Washington by 12 | |||
| 2010 | Auburn | South Carolina | 09/25/2010 | Reg | Auburn | Auburn by 3 | Auburn by 8 |
| 12/04/2010 | Conf | neutral | Auburn by 3.5 | Auburn by 39 | |||
| 2011 | Clemson | Virginia Tech | 10/01/2011 | Reg | Virginia Tech | Virginia Tech by 7.5 | Clemson by 20 |
| 12/03/2011 | Conf | neutral | Virginia Tech by 7 | Clemson by 28 | |||
| 2011 | Michigan St | Wisconsin | 10/22/2011 | Reg | Michigan St | Wisconsin by 7.5 | Michigan St by 6 |
| 12/03/2011 | Conf | neutral | Wisconsin by 9.5 | Wisconsin by 3 | |||
| 2011 | Alabama | LSU | 11/05/2011 | Reg | Alabama | Alabama by 5.5 | LSU by 3 |
| 01/09/2012 | Bowl | neutral | Alabama by 2.5 | Alabama by 21 | |||
| 2012 | Iowa St | Tulsa | 09/01/2012 | Reg | Iowa St | Tulsa by 1.5 | Iowa St by 15 |
| 12/31/2012 | Bowl | neutral | Tulsa by 1.5 | Tulsa by 14 | |||
| 2012 | Nebraska | Wisconsin | 09/29/2012 | Reg | Nebraska | Nebraska by 12 | Nebraska by 3 |
| 12/01/2012 | Conf | neutral | Nebraska by 3 | Wisconsin by 39 | |||
| 2012 | Tulsa | UCF | 11/17/2012 | Reg | Tulsa | Tulsa by 1 | Tulsa by 2 |
| 12/01/2012 | Conf | Tulsa | Tulsa by 3 | Tulsa by 6 | |||
| 2012 | Stanford | UCLA | 11/24/2012 | Reg | UCLA | Stanford by 3 | Stanford by 18 |
| 11/30/2012 | Conf | Stanford | Stanford by 9.5 | Stanford by 3 | |||
| 2013 | Arizona St | Stanford | 09/21/2013 | Reg | Stanford | Stanford by 7 | Stanford by 14 |
| 12/07/2013 | Conf | Arizona St | Arizona St by 3 | Stanford by 24 | |||
| 2014 | Arizona | Oregon | 10/02/2014 | Reg | Oregon | Oregon by 21.5 | Arizona by 7 |
| 12/05/2014 | Conf | neutral | Oregon by 14.5 | Oregon by 38 | |||
| 2014 | Fresno St | Boise St | 10/17/2014 | Reg | Boise St | Boise St by 18 | Boise St by 10 |
| 12/06/2014 | Conf | Boise St | Boise St by 24 | Boise St by 14 | |||
| 2015 | USC | Stanford | 09/19/2015 | Reg | USC | USC by 10 | Stanford by 10 |
| 12/05/2015 | Conf | neutral | Stanford by 4.5 | Stanford by 19 | |||
| 2016 | Western Kentucky | Louisiana Tech | 10/06/2016 | Reg | Louisiana Tech | Western Kentucky by 3 | Louisiana Tech by 3 |
| 12/03/2016 | Conf | Western Kentucky | Western Kentucky by 12 | Western Kentucky by 14 | |||
| 2016 | Army | North Texas | 10/22/2016 | Reg | Army | Army by 17.5 | North Texas by 17 |
| 12/27/2016 | Bowl | neutral | Army by 10.5 | Army by 7 | |||
| 2016 | Wyoming | San Diego State | 11/19/2016 | Reg | Wyoming | San Diego State by 9.5 | Wyoming by 1 |
| 12/03/2016 | Conf | Wyoming | San Diego State by 7 | San Diego State by 3 | |||
| 2017 | USC | Stanford | 09/09/2017 | Reg | USC | USC by 4 | USC by 18 |
| 12/01/2017 | Conf | neutral | USC by 3.5 | USC by 3 | |||
| 2017 | UCF | Memphis | 09/30/2017 | Reg | UCF | UCF by 5.5 | UCF by 27 |
| 12/02/2017 | Conf | UCF | UCF by 7 | UCF by 7 | |||
| 2017 | Florida Atlantic | North Texas | 10/21/2017 | Reg | Florida Atlantic | Florida Atlantic by 3.5 | Florida Atlantic by 38 |
| 12/02/2017 | Conf | Florida Atlantic | Florida Atlantic by 11 | Florida Atlantic by 24 | |||
| 2017 | Akron | Toledo | 10/21/2017 | Reg | Toledo | Toledo by 15.5 | Toledo by 27 |
| 12/02/2017 | Conf | neutral | Toledo by 20.5 | Toledo by 17 | |||
| 2017 | Oklahoma | TCU | 11/11/2017 | Reg | Oklahoma | Oklahoma by 6 | Oklahoma by 18 |
| 12/02/2017 | Conf | neutral | Oklahoma by 7.5 | Oklahoma by 24 | |||
| 2017 | Georgia | Auburn | 11/11/2017 | Reg | Auburn | Georgia by 2.5 | Auburn by 23 |
| 12/02/2017 | Conf | neutral | Georgia by 2 | Georgia by 21 | |||
| 2017 | Boise St | Fresno St | 11/25/2017 | Reg | Fresno St | Boise St by 6.5 | Fresno St by 11 |
| 12/02/2017 | Conf | Boise St | Boise St by 9.5 | Boise St by 3 | |||
| 2018 | Washington | Utah | 09/15/2018 | Reg | Washington | Washington by 4 | Washington by 14 |
| 11/30/2018 | Conf | neutral | Washington by 4.5 | Washington by 7 | |||
| 2018 | Oklahoma | Texas | 10/06/2018 | Reg | neutral | Oklahoma by 7 | Texas by 3 |
| 12/01/2018 | Conf | neutral | Oklahoma by 9.5 | Oklahoma by 12 | |||
| 2018 | Liberty | New Mexico State | 10/06/2018 | Reg | New Mexico State | Liberty by 9 | New Mexico State by 7 |
| 11/24/2018 | Reg | Liberty | Liberty by 7 | Liberty by 7 | |||
| 2018 | UCF | Memphis | 10/13/2018 | Reg | Memphis | UCF by 5 | UCF by 1 |
| 12/01/2018 | Conf | UCF | UCF by 1 | UCF by 15 | |||
| 2018 | Appalachian St | Louisiana | 10/20/2018 | Reg | Appalachian St | Appalachian St by 25 | Appalachian St by 10 |
| 12/01/2018 | Conf | Appalachian St | Appalachian St by 17.5 | Appalachian St by 11 | |||
| 2018 | Boise St | Fresno St | 11/09/2018 | Reg | Boise St | Fresno St by 2.5 | Boise St by 7 |
| 12/01/2018 | Conf | Boise St | Boise St by 1.5 | Fresno St by 3 | |||
| 2018 | Middle Tennessee | UAB | 11/24/2018 | Reg | Middle Tennessee | UAB by 3 | Middle Tennessee by 24 |
| 12/01/2018 | Conf | Middle Tennessee | Middle Tennessee by 1.5 | UAB by 2 | |||
| 2019 | Liberty | New Mexico State | 10/05/2019 | Reg | New Mexico State | Liberty by 7.5 | Liberty by 7 |
| 11/30/2019 | Reg | Liberty | Liberty by 15 | Liberty by 21 | |||
| 2019 | Appalachian St | Louisiana | 10/09/2019 | Reg | Louisiana | Louisiana by 2.5 | Appalachian St by 10 |
| 12/07/2019 | Conf | Appalachian St | Appalachian St by 6 | Appalachian St by 7 | |||
| 2019 | Boise St | Hawaii | 10/12/2019 | Reg | Boise St | Boise St by 12.5 | Boise St by 22 |
| 12/07/2019 | Conf | Boise St | Boise St by 14 | Boise St by 21 | |||
| 2019 | Ohio St | Wisconsin | 10/26/2019 | Reg | Ohio St | Ohio St by 14.5 | Ohio St by 31 |
| 12/07/2019 | Conf | neutral | Ohio St by 16.5 | Ohio St by 13 | |||
| 2019 | Oklahoma | Baylor | 11/16/2019 | Reg | Baylor | Oklahoma by 10.5 | Oklahoma by 3 |
| 12/07/2019 | Conf | neutral | Oklahoma by 9 | Oklahoma by 7 | |||
| 2019 | Cincinnati | Memphis | 11/29/2019 | Reg | Memphis | Memphis by 14 | Memphis by 10 |
| 12/07/2019 | Conf | Memphis | Memphis by 9 | Memphis by 5 | |||
References
1 | Appleton, D.R. (1995) , May the best man win?, The Statistician, 44: , 529–538. |
2 | Berry, S.M. (2003) , A Statistician Reads the Sports Pages: CollegeFootball Rankings: The BCS and the CLT, Chance 16: , 46–49. |
3 | Chen, H. , Ham, S.H. , & Lim, N. (2011) , Designing multiperson tournaments with asymmetric contestants: an experimental study, Management Science 57: , 864–883. |
4 | CollegeFootballPlayoff.com. 2021. 12-Team Playoff Proposed by College Football Playoff Working Group. Https://collegefootballplayoff.com/news/2021/6/10/12-team-playoff-proposal.aspx. |
5 | Curry, S. , & Sokol, J. 2016, Quantifying March’s Madness. Working paper. |
6 | David, H.A. 1988, The method of paired comparisons, 2nd ed. Chapman / Hall. |
7 | Dizdar, D. 2013, On the optimality of small research tournaments. Working Paper, University of Bonn, Institute of Economic Theory, http://dx.doi.org/10.2139/ssrn.2357096. |
8 | Fanson, P. 2020, Vegas Always Knows? A Mathematical Deep Dive. Https://www.theonlycolors.com/2020/9/29/21492301/vegas-always-knows-a-mathematical-deep-dive, downloaded June 1, 2022. |
9 | Fullerton, R.L. , & McAfee, R.P. (1999) , Auctioning entry intotournaments, Journal of Political Economy 107: , 573–605. |
10 | Gill, P.S. (2000) , Late-Game Reversals in Professional Basketball, Football, and Hockey, The American Statistician 54: , 94–99. |
11 | Glenn, W.A. (1960) , A comparison of the effectiveness of tournaments, Biometrika 47: , 253–262. |
12 | Glickman, M.E. (2008) , Bayesian locally optimal design of knockout tournaments, Journal of Statistical Planning and Inference 47: , 2177–2127. |
13 | Groh, C. , Moldovanu, B. , Sela, A. , & Sunde, U. (2012) , Optimal seedings in elimination tournaments, Economic Theory 49: , 59–80. |
14 | Hochtl, W. , Kerschbamer, R. , Stracke, R. , & Sunde, U. 2010, Optimal design of multi-stage elimination tournaments with heterogeneous agents: theory and experimental evidence. Working Paper. |
15 | Horen, J. , & Riezman, R. (1985) , Comparing draws for single elimination tournaments, Operations Reearch 33: , 249–262. |
16 | Hwang, F.K. (1982) , New concepts in seeding knockout tournaments, American Mathematical Monthly 89: , 235–239. |
17 | Jennessy, J. , & Glickman, M. (2016) , Bayesian optimal design offixed knockout tournament brackets, Journal of Quantitative Analysis in Sports 12: , 1–15. |
18 | Marchand, E. (2002) , On the comparison between standard and randomknockout tournaments, The Statistician 51: , 169–178. |
19 | National Collegiate Athletic Association. Football Bowl Subdivision records. Http://fs.ncaa.org/Docs/stats/football_records/2014/FBS.pdf, last downloaded January 15, 2014. |
20 | OddsShark.com. NCAAF football odds & handicapping database. Http://www.oddsshark.com/ncaaf/database, data downloaded August 29, 2021. |
21 | Paine, N. 2014 “How to fix the NFL playoffs.” Http://www.slate.com/articles/sports/sports_nut/2014/01/nfl_playoffs_2014_an_insane_idea_to_ensure_that_the_best_teams_have_the.html, downloaded January 8, 2014. |
22 | Ryvkin, D. 2005, The predictive power of noisy elimination tournaments. Technical report, Center for Economic Research and Graduate Education –Economic Institute, Prague. |
23 | Sagarin, J. Jeff Sagarin computer ratings archive. Http://usatoday30.usatoday.com/sports/sagarin-archive.htm, each year’s data downloaded August 29, 2021. |
24 | Scarf, P. , & Bilbao, M. 2006, The optimal design of sporting contests. Working Paper 320/06, Salford Business School, University of Salford, Manchester, UK. |
25 | Scarf, P.A. , & Shi, X. (2008) , The importance of a match in atournament, Computers and Operations Research 35: , 2406–2418. |
26 | Schwenk, A.J. (2000) , What is the correct way to seed a knockouttournament? The American Mathematical Monthly 107: , 140–150. |
27 | Seals, D.T. (1963) , On the probability of winning with different tournament procedures, Journal of the American Statistical Association 58: , 1064–1081. |
28 | Sheremeta, R.M. , & Wu, S.Y. 2012, Testing canonical tournament theory: on the impact of risk, social preferences, and utility structure. Working Paper, Purdue University. |
29 | Sokol, J. , March 26, 2010. In a 96-team field, upsets could be a thing of the past. Http://thequad.blogs.nytimes.com/2010/03/26/in-a-96-team-field-upsets-could-be-a-thing-of-the-past/, New York Times. |
30 | ThePredictionTracker.com. Computer rating system prediction results for college football (NCAA IA). Http://www.ThePredictionTracker.com/ncaaresults.php, each year’s data downloaded August 29, 2021. |
31 | Vu, T.D. 2010, Knockout tournament design: a computational approach. PhD diss., Department of Computer Science, Stanford University. |
Notes
1 We note that Sagarin does not publicly archive week-by-week ratings, so we use the only available data, the rankings after the postseason.
2 This is in contrast to not only human rankings like polls, but also algorithmic ratings that use secondary statistics such as yards gained, game progress, etc. A team might lose a game despite appearing to play better and having better secondary statistics; a relevant example might be when LSU beat Alabama in 2011 by a score of 9-6 despite having worse secondary statistics, in part due to Alabama missing four field goals. At the end of the season, LSU and Alabama were ranked as the top two teams in the BCS, and Alabama won the rematch, and the national championship, by a score of 21-0.
3 The Las Vegas line also incorporates factors such as how teams’ specific strengths and weaknesses match up with each other, so “error in team strength estimation” is really an oversimplification. We retain the usage of the term for simplicity, but for the Las Vegas line we mean it to include all factors related to estimating attributes of a team, and excluding in-game randomness.
4 Model 1 of Curry and Sokol (2016) gives a value of 194, and Models 2 and 3 give nearly identical results, each estimating that in-game randomness accounts for 167 of the variance.


