
Production functions of NCAA men and women water polo matches
Abstract
Previous research has adapted the use of economic production functions to estimate the scoring production of teams in professional sports. Most of these studies have focused on professional male team sports, most notably, US baseball, basketball, and association football. This study adds to the literature by utilizing a new and distinctive data set of shooting statistics from 88 men’s and 38 women’s NCAA water polo contests to estimate production functions for United States’ collegiate water polo games and identify the most important variables for predicting margin of victory in such competitions. The results show that shots on goal, average shot distance, number of counterattacks, quick shots, and efficiency in power play conversions are all significant predictors of goal differentials in men’s contests while shots on goal, average shot distance, counterattacks, and center shots are significant predictors in women’s matches. Previous season win percentage, rebounds, exclusions, and missed shots were not significant predictors in the models. These conclusions confirm and extend previous discriminatory studies of elite international water polo contests.
1Introduction
Production functions of sports teams have been modelled in the academic literature since the late 1970s (see Zak, Huang & Siegfried, 1979; Zeck, 1981; Schofield, 1988; Bairam, Howells & Turner, 1990). Carmichael, Thomas and Ward (2000) argue that a sports team is similar to any managed enterprise where the objective is to generate output (a game victory) by employing and combining resource inputs (e.g., athletes, tactics, team characteristics). When viewed in this manner, managers of such teams will desire to better understand the relationship and contribution of resource inputs to output. Indeed, the modelling of production functions has been applied to professional sports in ‘time-limit’ games, such as basketball (Sanchez, Castellanos & Dopico, 2007), baseball (Lee & Lee, 2021), ice hockey (Leard & Doyle, 2010), and association football (Coates, Frick & Jewell, 2014) to gain insight on the relationship between players, tactics, organizational features and their impact on a game win.
The significant expansion of data recording and collection within these professional sports has made it possible to estimate sports production functions with more precision. One of the outcomes of this improvement has been a move away from intuition- and experience-based decision-making toward more data-based decision-making in both game preparation and game play. The estimation of production functions in these sports has reinforced the intuition on some variables considered to be important (e.g., passing efficiency, shot accuracy, three-point shots) but the lack of significance and counter-intuitive relationships in other variables (e.g., defensive blocks, defensive fouls) in the production of game victories. Although, it should be noted that the vast majority of the research has been conducted on male professional sports with very limited attention paid to their female counterparts.
Over the past decade, the analytics movement has begun to spread into other team sports that share structural elements with basketball, ice hockey and association football. Water polo is one such sport. While there has been extensive notational analysis of game-level data in the context of international competitions (see section entitled 4. Previous research on win/loss analysis in water polo), there remains a relative dearth of literature at lower levels of competitions, especially in relation to the women’s game. One issue that has likely inhibited the advancement of water polo analytics in this regard is the relative simplicity of common box scores in the sport, which often include little more than basic descriptive statistics about shots made or missed. Until recently, game footage for many matches at lower levels of competition was not publicly stored or available for analysis creating a challenge for anyone interested in more detailed shot analysis.
Consequently, the purpose of this study is to present a more detailed analysis of the production functions for one specific lower-level competition (USA collegiate) in both the men’s and women’s competitions. It also seeks to identify the most important variables for predicting margins of victory in such competitions. This study utilizes a unique methodology of recording and collecting game play from two seasons of National Collegiate Athletic Association (NCAA), men’s and women’s water polo games in the United States to estimate a sports production function for goal differentials. An exploration of this data and its relationship to game wins will enhance the understanding of the sport for both game managers, athletes, and spectators.
This paper is organized as follows. First, we provide an overview of the sport of water polo, summarize sport production function approaches to similar sports, and describe the similarities and differences relating to water polo. Second, we summarize previous research on win/loss analysis in water polo and discuss how this present study adds to the existing literature. Then, we present the methodology of data collection and analysis utilized in this study, with descriptions of the data gathered from NCAA competition, and model specification. Our methodology is followed by the presentation of the model results. Finally, we discuss our conclusions and identify future research directions.
2Overview of NCAA water polo
Water polo has a variety of similarities with other time-based team sports that have utilized data analytics and more specifically, production functions. For example, basketball, association football, and ice hockey have players that play both offense and defense during a game with the objective of outscoring the opponent. Association football and ice hockey both have ‘cages’ that are guarded by a goalie, allow player substitutions, and contain certain penalties that result in exclusions and player advantages. While basketball does not use a cage guarded by a goalie and does not employ player advantages from player fouls, player substitutions are allowed, a shot-clock is used, and a ball must be shot into the basket. However, like many of these sports, several structural elements of the game vary dependent on the level of competition, the rules of the relevant governing body and/or the gender of the athletes competing. As such, it is necessary to provide a brief overview of the specific context of NCAA water polo.
NCAA water polo games are played between two teams, each with six field players and one goalie (Streeter & Brownlee, 2018). Rosters for the final NCAA tournament have a maximum of 16 players whereas regular season play has an unlimited roster size. Players on the roster can be used as replacements for tactical, player injury, or for another player’s game ejection. Each game is divided into four, eight-minute periods, and offensive possessions are restricted by a 30-second shot clock in the men’s game and 35-second shot clock in the women’s game. The game is played in a pool which meets a rectangular dimension within the range of specifications (typically, 25 meters long and 20 meters wide). The game is supervised by two referees who are positioned on opposite sides of the length of the playing area.
Winning a water polo game is achieved by one team scoring more goals than the opposing team. A goal is scored by a player throwing the ball into a netted cage during either open play or a static play called a 5-metre penalty shot, the result of a penalty foul infraction as signaled by a referee. While the objective of scoring goals is self-explanatory, the field players are tasked with executing both offensive and defensive plays and tactics to create and disrupt goal-scoring opportunities, respectively. Additionally, certain actions of players may result in either a minor (ordinary) foul which leads to a free pass/throw or a major (exclusion) foul which leads to a free pass and the fouler being excluded for 20 seconds. A player receiving three exclusion fouls will be ejected for the remainder of the game but can be replaced by another player from the bench.
The goal cage is a netted frame, measuring 10 meters wide by 0.9 meters high, is guarded by the goalie who is responsible for preventing the ball from entering their team’s cage. The goalie is positioned in front of the cage and can use either one or two hands to block. While on defense, field players are able to either pressure offensive players individually, split between two offensive players in attempt to disrupt both players, or position themselves in a zone defense. Field players can use one hand to block passes and throws toward the goal as using two hands on the ball results in a penalty foul.
Two adaptations are made to the women’s’ game at the collegiate level when compared to the men’s format. Firstly, the women play with smaller, less inflated balls. The circumference of the ball in men’s games must fall within 0.68– 0.71 meters, with a pressure of 90– 97 kilopascals (Streeter & Brownlee, 2018, p 12). While in the women’s game, the ball must measure between 0.65– 0.69 meters wide and be inflated to a pressure of 83– 90 kilopascals. Secondly, as noted above, the women play with a longer shot clock (35 seconds vs 30 seconds). The nature of the women’s swimsuit presents an additional consideration. Given the extra material in the women’s suit, suit grabbing and holding occurs far more regularly in the women’s game. This feature may influence their ability to score and/or increase power play situations since suit holding is “a violation of rule 7.9” and triggers an exclusion foul (Streeter & Brownlee, 2018, p 7).
3Water polo and sports team production functions
Estimating production functions of sports teams has occurred in the research for more than four decades. Beginning with Scully (1974), the analysis of the production function for professional baseball also includes Kahn (1993) and Gustafson, Hadley and Ruggiero (1999). Production function models of association football were explored by Carmichael, Thomas and Ward (2000) and English rugby production functions were analyzed by Carmichael and Thomas (1995). Scott, Long and Somppi (1985) estimated the production function for professional basketball and production efficiency was analyzed by Kahane (2005) for professional ice hockey in the National Hockey League.
Modelling the production function of a sports team presents a distinct issue compared to other types of production functions: determining what it is that the team produces. Brook’s 2005 survey of the literature of team output provides the implications of using various measures (e.g., game attendance, win percentage, number of wins, score ratio, the “game” itself). While different sports do indeed have many similarities, certain measures of team output may not yield meaningful results. The generation of a win as the result of outscoring the opponent can be considered the “output” of the team for many team sports. Yet, for other team sports this measurement may not capture the relationship between inputs and resulting output. For example, association football matches can produce a drawn score but without either team scoring a goal. Thus, the number of wins or win percentage may not be the appropriate output measurement as opposed to using a point system where draws award each team a point.
Because competitive water polo games rarely generate either a scoreless game or a drawn result, this investigation defines the ‘output’ of a team’s production process as goals scored during a game. Similar to other team sports, the coach of the team is considered the ‘manager’ who is charged with devising offensive tactics, which are designed to lead to goals scored, and defensive tactics, which are designed to prevent goals allowed. Offensive and defensive tactics are executed by players creating measurable game-specific statistics. These measurable statistics can then be used as “tactical” or “service” inputs in production function models for goal differentials.
The specific models considered here assume that number of goals Si scored by team i playing against team j would generalize as a linear function for team i. In equation form,
(1)
where Oi is a vector of offensive tactics executed by team i, Dj is a vector of defensive tactics executed by team j, and fi is a linear function of its inputs. Conversely, the number of goals Sj scored by team j playing against team i generalizes to
(2)
where Oj is a vector of offensive tactics executed by team j and Di is a vector of defensive tactics executed by team i. It will be assumed here that the general function generating goals, fi or fj is the same for both teams.
4Previous research on win/loss analysis in water polo
Although the production function approach is new to water polo, notational analysis of matches has a more extensive history dating back to the early 2000s. Enomoto et al. (2003) studied characteristics of high ranked (top eight) vs low ranked (bottom eight) teams at the 2001 Women’s world championship and found that top ranked teams shot more frequently, committed fewer mistakes on offense, had more goalie saves, and perhaps counterintuitively, committed more personal fouls than low ranked teams.
The mid-late 2000s saw a surge in discriminatory analysis comparing technical and tactical indicators for winning vs losing teams in elite international competitions. Argudo et al. (2007, 2009) compared various shooting statistics across different micro-situations for both men’s and women’s teams at the 2003 world championships. There micro-situations included even play, power play scenarios, counterattack/transitions, and penalty shots. Vila et al. (2011) extended this analysis to 50 women’s and 72 men’s matches from the 2008 European Championships and the 2009 World Championships, adding shot velocity as an additional game metric. Overall, they found that winning teams in women’s water polo were more efficient in converting even situations but not necessarily more efficient at getting or converting transition, power play, or penalty scenarios. In contrast, they found that men’s teams typically generated and converted more counterattacks and were more efficient at converting even situations as well although they found no differences in penalties. Significant differences in shot speed varied among competitions with winning teams achieving higher average velocity in the world championship but not in the European championship.
Using a similar discriminatory approach, Escalante et al. (2012, 2013), studied a different set of statistics across 230 men’s and 124 women’s matches from the European and World Championships between 2007 and 2011. They found that including both offensive and defensive performance-based statistics successfully differentiated between winning and losing teams across all stages of the competition, with better classification rates occurring in preliminary rounds compared to later classificatory or medal rounds and in women’s matches compared to men’s matches. Garcia-Marin and Argudo Iturriaga (2017a, 2017b) and Lupo et al. (2012, 2014) split World Championship matches between unbalanced (those decided by more than 3 goals) and close (1– 3 goals) games, concluding that the set of discriminatory statistics in balanced games was much smaller. Graham and Mayberry (2014) also looked at close vs unbalanced games, finding that the exclusion conversion rate, the proportion of exclusion conversion opportunities converted to goals, was the number one classifier of outcomes in close matches and that exclusion opportunities were similar between winning and losing teams confirming an earlier finding of Platanou (2004).
There have been fewer papers which look at goal scored or final score differential as an outcome variable. After performing a discriminatory analysis of women’s elite matches in 2016, Saavedra et al. (2017) followed up this analysis by looking at how their results changed if final score difference was used instead of the binary win-loss outcome but found little difference in their findings. Smith (2004) examined the impacts of penalties on final scores but found that differences in penalties affected the outcomes in only 20% of all games. Perhaps one of the most extensive papers on this topic was the work of Takagi et al. (2005) where they applied Principal Component Analysis to over 30 different game-related statistics from 108 men’s and women’s games in the 2001 world championship to split them into 10 roughly independent performance factors. After correlating these factors with goals scored, they found that counterattacks were the most significant factor followed by exclusion performance, post-play, cut-in, goal-keep, and number of defenses. They also found minimal differences in men’s vs women’s matches except in pass-interception rates (higher in women’s) and more successful outside shooting in women’s matches.
To date, we are aware of only one study to examine a win produced model within the specific context of US collegiate water polo (see Harris & Berri, 2020). The authors collected data from a single men’s Division I conference (the Western Water Polo Association [WWPA]) over seven seasons (2010– 2017). However, their data was limited to variables typically found in box scores (e.g., shot attempts, shot efficiency and turnovers). Nevertheless, their regression model accounted for about 55% of variation in win percentage for their sample and was able to predict actual wins with a relative error of only 5% over a 24-game season. Thus, this work suggests that with the incorporation of more detailed variables, production functions can be a valuable predictive tool for water polo contests.
Our study adds to the existing body of water polo research in several ways, one major contribution being the paper’s introduction of the production function terminology into the water polo literature. This could offer a powerful new lens for win/loss analysis in the sport when compared with previous discriminatory studies. The study also extends the scope of previous win/loss analysis (see Harris & Berri, 2020) through its unique methodology and more complex variables. Finally, this paper contains an explicit comparison of men’s vs women’s games, the first to do so in the context of US collegiate water polo.
5Methods
This study employed a case-based approach to estimate production functions for NCAA men’s and women’s water polo games and identify the most important variables for predicting margin of victory in such competitions. The research population of interest was all men’s NCAA Division I, II and III varsity water polo games conducted during the 2016– 2017 seasons and all women’s NCAA Division I, II and III varsity water polo games conducted during the 2019– 2020 seasons. A non-random convenience sample containing 88 of the 1248 men’s games played during these seasons (44 from each year) and 38 of the 1348 women’s games played during these seasons (19 from 2019, 19 from 2020) were selected for analysis based on game-data availability. Game film was obtained in one of three ways: i) directly filmed by a staff member of the authors’ institution, ii) downloaded off the TeamXStream website or, iii) recorded via a live stream.
As evidenced in Table 1, the sample contained games from all three divisions and in a variety of contexts. The aggregation of data across all 3 divisions is warranted on the basis of NCAA Water Polo’s unique competition structure. During the data collection period, teams from all three divisions compete against one another for the same National Championship.
Table 1
Sample demographics of coded games
| Gender | Type of Game | 2016 | 2017 | 2019 | 2020 | Total |
| Men | Total games played | 616 | 632 | – | – | 1,248 |
| Total games coded | 44 | 447% | – | – | 88 | |
| % of games played | 7% | 7% | ||||
| Regular Season, Non-conference | 27 | 25 | – | – | 52 | |
| % of coded sample | 61% | 57% | 59% | |||
| Regular Season, Conference | 14 | 13 | – | – | 27 | |
| % of coded sample | 32% | 30% | 31% | |||
| Post-season Tournaments | 3 | 6 | – | – | 9 | |
| % of coded sample | 7% | 14% | 7% | |||
| Division 1 | 41 | 40 | – | – | 81 | |
| % of coded sample | 47% | 45% | 92% | |||
| Division 2 | 0 | 1 | – | – | 1 | |
| % of coded sample | 1% | 1% | ||||
| Division 3 | 3 | 3 | – | – | 6 | |
| % of coded sample | 3% | 3% | 7% | |||
| Total shots coded | 2,605 | 2,542 | – | – | 5,147 | |
| Women | Total games played | – | – | 872 | 476 | 1,348 |
| Total games coded | – | – | 19 | 19 | 38 | |
| % of games played | 2% | 4% | 3% | |||
| Regular Season, Non-conference | – | – | 16 | 16 | 30 | |
| % of coded sample | 84% | 84% | 79% | |||
| Regular Season, Conference | – | – | 2 | 3 | 5 | |
| % of coded sample | 11% | 16% | 13% | |||
| Post-season Tournaments | – | – | 1 | 0 | 3 | |
| % of coded sample | 5% | 0% | 8% | |||
| Division 1 | – | – | 18 | 18 | 36 | |
| % of coded sample | 47% | 47% | 94% | |||
| Division 2 | – | – | 1 | 1 | 2 | |
| % of coded sample | 3% | 3% | 6% | |||
| Total shots coded | – | – | 956 | 1,045 | 2,001 |
NCAA bylaws grant permission to use game film for research purposes. Due to the nature of the study, data was analyzed as normal work operations and did not involve interacting with humans. The unobtrusive nature of the data collection did not disturb or affect the social environment in any way. Therefore, participants could not react to or alter their behaviors. Anonymity of player identities was secured throughout the quantitative coding process and the research methodology was granted ethical approval by the lead authors’ Institutional Research Board.
The first author of this study used the software SportsCode to track all shot attempts occurring within the sample of games. This author is a coach and ex-player at a Division I NCAA university with five years of experience in observational water polo methodology at the collegiate, junior-national, and senior-national levels. Overall, the shot-tracking process resulted in a sample of 5147 shots after removing 33 shots with missing entries (e.g., unknown defense or unidentifiable shot attempt) from the men’s games and a sample of 1997 shots from the women’s games after removing four shots with erroneous or vague entries. For each shot, various information was additionally recorded including: the position in the pool that the shot was taken from (converted to distance from the center of the goal and angle from the center of the pool for analysis), the shooter’s hand (left or right), the current offensive scenario (even, power play, counterattack or penalty shot), whether the shot came from the center position (yes or no), whether the shot was taken immediately after an exclusion foul (quick), whether the shot hit the water before reaching the goal (skip shot), defense at the time of the shot (uncontested, pressured from the side or behind, or contested from in front), and the result of the shot (goal, save, new clock, missed shot, field block, or offensive rebound). The first three categories of results are classified as “shots on goal” [SOG] because they involve a shot which either was a goal, would have been a goal if not caught by the goalie, or would have been a goal if not knocked out of bounds by the goalie. The latter three categories of missed shots (shots which flew outside of the goal), field blocks (those in which a defensive player intercepted or deflected a shot before it reached the goal), or rebounds (those in which the offence obtained possession after a deflected pass) are not classified as SOG. Reliability analysis on the data was performed and is reported in Gullikson et al. (2020). For purposes of this study, individual shot data was then aggregated by game and team to create the variables defined in Table 2. For example, to get the aggregate statistics for game k in the dataset, one of the two teams competing in the game was randomly assigned to be team one and the other team assigned to be team two. The number of instances of a specific variable, for example, SOG was counted for both teams and then the difference Team 1 value – Team 2 value was computed.
Table 2
Variable Names, Definitions, and Summary Statistics: Aggregate Game Data
| Variable Name | Definition | Median (Q1,Q3) Men | Median (Q1,Q3) Women | Expected Sign |
| Play Variables | ||||
| DSHGOAL | Difference in number of shots on goal (on target) | – 3 (– 7, 1) | 0 (– 3.5, 2) | + |
| DSHMISS | Difference in number of shot misses including shots deflected by the defense (off target or field blocked shots) | – 0.5 (– 5, 3) | 0 (– 3, 2) | – |
| DCENTER | Difference in number of center opportunities | 0 (– 1, 2) | – 1 (– 2, 1) | + |
| DCOUNTER | Difference in number of counterattack or “fast break” opportunities | – 2 (– 6, 1) | 0 (– 1.5, 1) | + |
| DEXCLUSION | Difference in number of player advantage opportunities from an exclusion foul (all types) | – 1 (– 3,1) | – 2 (– 4, 0) | + |
| DQUICK | Difference in number of “quick shots” immediately from an exclusion foul | 0 (– 1,0) | 0 (– 1, 1) | + |
| DECR | Difference in the percentage of exclusion shots converted to goals | – 10 (– 32, 7) | 0 (– 33, 12.5) | + |
| DREBSHOT | Difference in number of immediate shot attempt following an offensive rebound | 0 (0,0) | 0 (0,0) | + |
| DPNSHOT | Difference in number of penalty shots | 0 (0,1) | 0 (– 1, 1.5) | + |
| DDISTANCE | Difference in average distance of shots from center cage | 0.15 (– 0.26, 0.61) | – 0.03 (– 0.37, 0.28) | – |
| Team Characteristic Variable | ||||
| DWINPERC | Difference in team win percentages from previous season | – 0.08 (– 0.27, 0.14) | 0.03 (– 0.11, 0.09) | + |
6Data and model specification
When teams i and j play each other in a game, each team is employing its tactical and player service inputs to score more goals than they allow. Thus, the difference of the goals scored for each team is equal to the difference in the respective production functions (1) and (2), or
(3)
This reveals that the difference in goals scored is the result of the differences in each team’s goal generation production function. Each function is dependent on the same offensive tactical and service inputs as well as each team’s defensive tactical and service inputs, while the functions themselves are based on team-specific information. With the specification in equation (3), our approach is consistent with Carmichael, Thomas and Ward (2000). Their model estimated a production function of team performance that was assumed to be linear where the game result was determined by various input variables categorized as “plays” and “team characteristics.”
Building on the earlier explanation of water polo games, a team with possession of the ball will work to position their six field players in the opposing half of the pool and maneuver their positions according to the tactical play(s) called by the coach. Within the constraint of the 30-second shot clock, the offensive players pass the ball amongst one another using only one hand until there is an opportunity to attempt a shot. A SOG occurs when the ball either enters the netted cage (goal) or is stopped by the opposing goalie (save). Some of the shot attempts by the offense, however, will result in either deflection off the cage or a miss of the cage entirely (miss). A miss of the entire cage outside of the field of play results in the ball being returned to the goalie of the opposing team who is now on offense. A miss that hits the cage may either deflect outside the field of play or deflect back to the field of play. The latter will be treated like a rebound in basketball which can either be possessed by the offense or defense.
As a result of active positioning in the pool, the team on offense may draw ordinary fouls, exclusion fouls, or penalty fouls. The exclusion foul results in a player advantage, a reset of the shot clock, and a change in the tactics of the offensive team as well as the defensive team. Active positioning by the offensemay also result in a referee’s call of an “offensive foul” which results in a turnover to the defense and, in some cases, an exclusion foul. These tactics are unique to water polo and should be included in the production function specification.
The approach here is to evaluate a play-based linear production function for the outcome of water polo contests. As shown in Equation (3), it is assumed that the score differential, Si - Sj, in game k is a linear combination of the performance-based statistics. The variable name DGSCOREk represents the difference in goals scored in the kth game between team i and team j. Table 2 defines all independent variables employed in the models as well as their expected sign in the relationship to DGSCOREk.
This study investigates two models for base production functions, applying both to men’s and women’s games in the dataset. The first model includes a random team effect leading to the equation
The second model includes a fixed effect for teams based on previous year’s win percentage as opposed to a random effect for the team itself, leading to the equation
Where DWINPERCk is the difference in previous win percentages between teams i and j Successful teams may be able to sustain their win percentage during a period of several years. This ‘winning tradition’ may be a factor affecting the differences in the production functions. Since 1998, the men’s NCAA Division 1 water polo playoff brackets and eventual champion have been dominated by four university teams: USC (10 championships, 6 consecutive), UCLA (6 championships, 2 consecutive), Cal (3 championships, 2 consecutive), and Stanford (2 championships, 2 consecutive). In 19 of the past 21 championship games, two of these four teams competed against each other for the title and USC has participated in the title game 14 consecutive years. Thus, the production functions of teams who performed well in the previous season may be measurably different from teams who did not, akin to the “elite” team effect considered in other production function research (Carmichael, Thomas and Ward, 2000). The elite effect is even more strong in women’s water polo with Stanford (7 titles), UCLA (7 titles), and USC (6 titles) winning the last 21 championships and two of the three teams competing in 20 of the 21 championship games.
Initially, an effect for home pool advantage was also included as a potential factor in the models. While men’s NCAA Division water polo teams typically have a regulation pool for their home games, the pool facilities from both a team and spectator perspective can vary greatly. For example, the Avery Aquatic Centre at Stanford University is considered the finest outdoor venue in collegiate water polo in the U.S. with one of the largest scoreboards, premier player locker room facilities, and a spectator seating capacity of 2,480. Austin College, by contrast, is a member of the same men’s water polo conference yet plays their home games in an indoor natatorium with a seating capacity of less than 250. However, over 70% of the recorded games in the men’s dataset were played in neutral locations so this variable did not change the results and was excluded from the summaries below.
Both the men’s and women’s model 2 fits also showed limited multicollinearity although one term did exhibit a variance inflation factor of slightly higher than 3 (VIF = 3.186 for DCOUNTER in women’s model 2). To test for robustness, insignificant variables were removed, and the reduced models were assessed using Leave-One-Out Cross Validation (LOOCV). The men’s model achieved a 54% reduction in LOOCV Root Mean Squared Error (RMSE) over the null model (RMSENull = 6.181, RMSEModel = 2.854) and while the women’s model achieved a reduction of 35% (RMSENull = 5.476, RMSEModel = 3.5625).
A secondary model was applied on the shot level data to identify high quality shots and determine which individual shot factors significantly affected the likelihood of obtaining a SOG. A logistic regression model was fit to the binary dependent variable SOG = 1 if a shot was on goal and 0 otherwise. Table 3 summarizes the independent variables used in this model.
Table 3
Variable Names, Definitions, and Summary Statistics: Shot Data. For qualitative predictors, the baseline value appears first in the list of possible values and counts are listed in the same order as the possible values. The expected signs refer to the values of coefficients compared with baseline in these scenarios
| Variable Name | Definition | Median (Q1, Q3) or Counts Men | Median (Q1, Q3) or Counts Women | Expected Sign |
| Play Variables | ||||
| DISTANCE | Distance of shot location from the center of the goal cage (in meters) | 5.1 (3.7, 6.0) | 4.9 (3.5, 5.7) | – |
| ANGLE | Absolute value of the angle between the shot location and the center of the pool (in degrees) | 17.7 (7.5, 28.7) | 18.3 (6.9, 28.0) | – |
| HAND | Binary variables indicating the hand of the shooter (Right/Left) | 3977/1170 | 1669/328 | + |
| SKIP | Binary variable indicating whether the ball hit the water (skipped) before reaching the goal (No/Yes) | 3707/1440 | 1941/356 | + |
| OFFENCE | Offensive scenario at the time of the shot (Even/Counter/Power Play/Penalty) | 3360/579/1139/69 | 1300/123/503/71 | + |
| CENTRE | Binary variable indicating whether the shot came from the offensive center position (No/Yes) | 4690/457 | 1746/177 | + |
| DEFENCE | Position of nearest defender at the time of the shot (Uncontested/ Pressured/Contested) | 409/928/ 3810 | 76/343/ 1504 | – |
Estimated changes in SOG odds were calculated via the formula
(4)
7Results
Table 4 displays the results of all production function models.
Table 4
Production function regression results: linear models
| Dependent Variable: DGSCORE | |||||||||
| Mixed Models | Model 1, Men (N = 88) | Model 1, Women (N = 38) | Fixed Effect | Model 2, Men (N = 88) | Model 2, Women (N = 38) | ||||
| Variable Name | Est. Coef. | SE | Est. Coef. | SE | Est. Coef. | SE | Est. Coef. | SE | |
| Constant | – 0.337 | 0.377 | 0.139 | 0.713 | – 0.349 | 0.370 | 0.230 | 0.688 | |
| DSHGOAL | 0.244*** | 0.066 | 0.471*** | 0.175 | 0.240*** | 0.065 | 0.464*** | 0.172 | |
| DSHMISS | – 0.060 | 0.063 | – 0.166 | 0.161 | – 0.052 | 0.063 | – 0.103 | 0.172 | |
| DCENTER | 0.220 | 0.137 | – 0.503 | 0.300 | 0.221 | 0.135 | – 0.528* | 0.296 | |
| DCOUNTER | 0.547*** | 0.109 | 0.679* | 0.353 | 0.526*** | 0.108 | 0.487 | 0.216 | |
| DEXCLUSION | – 0.112 | 0.099 | – 0.228 | 0.203 | – 0.150 | 0.100 | – 0.298 | 0.208 | |
| DQUICK | 0.895*** | 0.275 | – 0.209 | 0.439 | 0.918*** | 0.273 | – 0.048 | 0.451 | |
| DECR | 0.038*** | 0.010 | 0.023 | 0.024 | 0.036*** | 0.011 | 0.03 | 0.024 | |
| DPNSHOT | 0.197 | 0.357 | – 0.095 | 0.506 | 0.240 | 0.355 | – 0.087 | 0.504 | |
| DREBSHOT | 0.178 | 0.379 | – 0.342 | 1.103 | 0.212 | 0.380 | – 0.402 | 1.099 | |
| DDISTANCE | – 1.448** | 0.710 | – 2.630** | 1.250 | – 1.360* | 0.707 | – 2.424* | 1.232 | |
| DWINPERC | NA | NA | 1.538 | 1.065 | 4.800 | 4.051 | |||
| Marginal R2/ Conditional R2 | 0.812/ 0.820 | 0.666/0.682 | R2/ Adj. R2 | 0.836/0.812 | 0.749/0.646 | ||||
| Residual Variance (σ2) | 7.07 | 10.61 | Res. Std Err. | 2.697 | 3.299 | ||||
| Random Effects Group Variance (t2) | 0.31 | 0.29 | F (df1, df2) | 35.11 *** (11, 76) | 6.987 *** (11, 27) | ||||
| ICC | 0.04 | 0.05 | |||||||
* Significant at 0.1 level; ** Significant at 0.05 level; *** Significant at 0.01 level.
Shots on goal (DSHGOAL), counterattack opportunities (DCOUNTER), quick shots (DQUICK), exclusion conversion rate (DECR), and average shot distance (DDISTANCE) were all significant factors in predicting the final score differential for both men’s models. Model 1 estimated that the expected goal differential will increase by approximately one for every:
• increase in shots on goal differential of four,
• increase in counterattack differential of two,
• increase in quick differential of one,
• increase in exclusion conversion rate differential of 26%, and
• decrease in average shot distance differential of 0.7 meters.
The estimated increases based on model 2 were similar.
Figure 1 compares the relative importance of each term in the model as measured by absolute t-scores using the coefficients from model 1.
Fig. 1
Variable Importance Plots in Production Function Model 1 for men (left) and women (right). The horizontal axis shows the t-scores for the corresponding variables listed on the vertical axis.
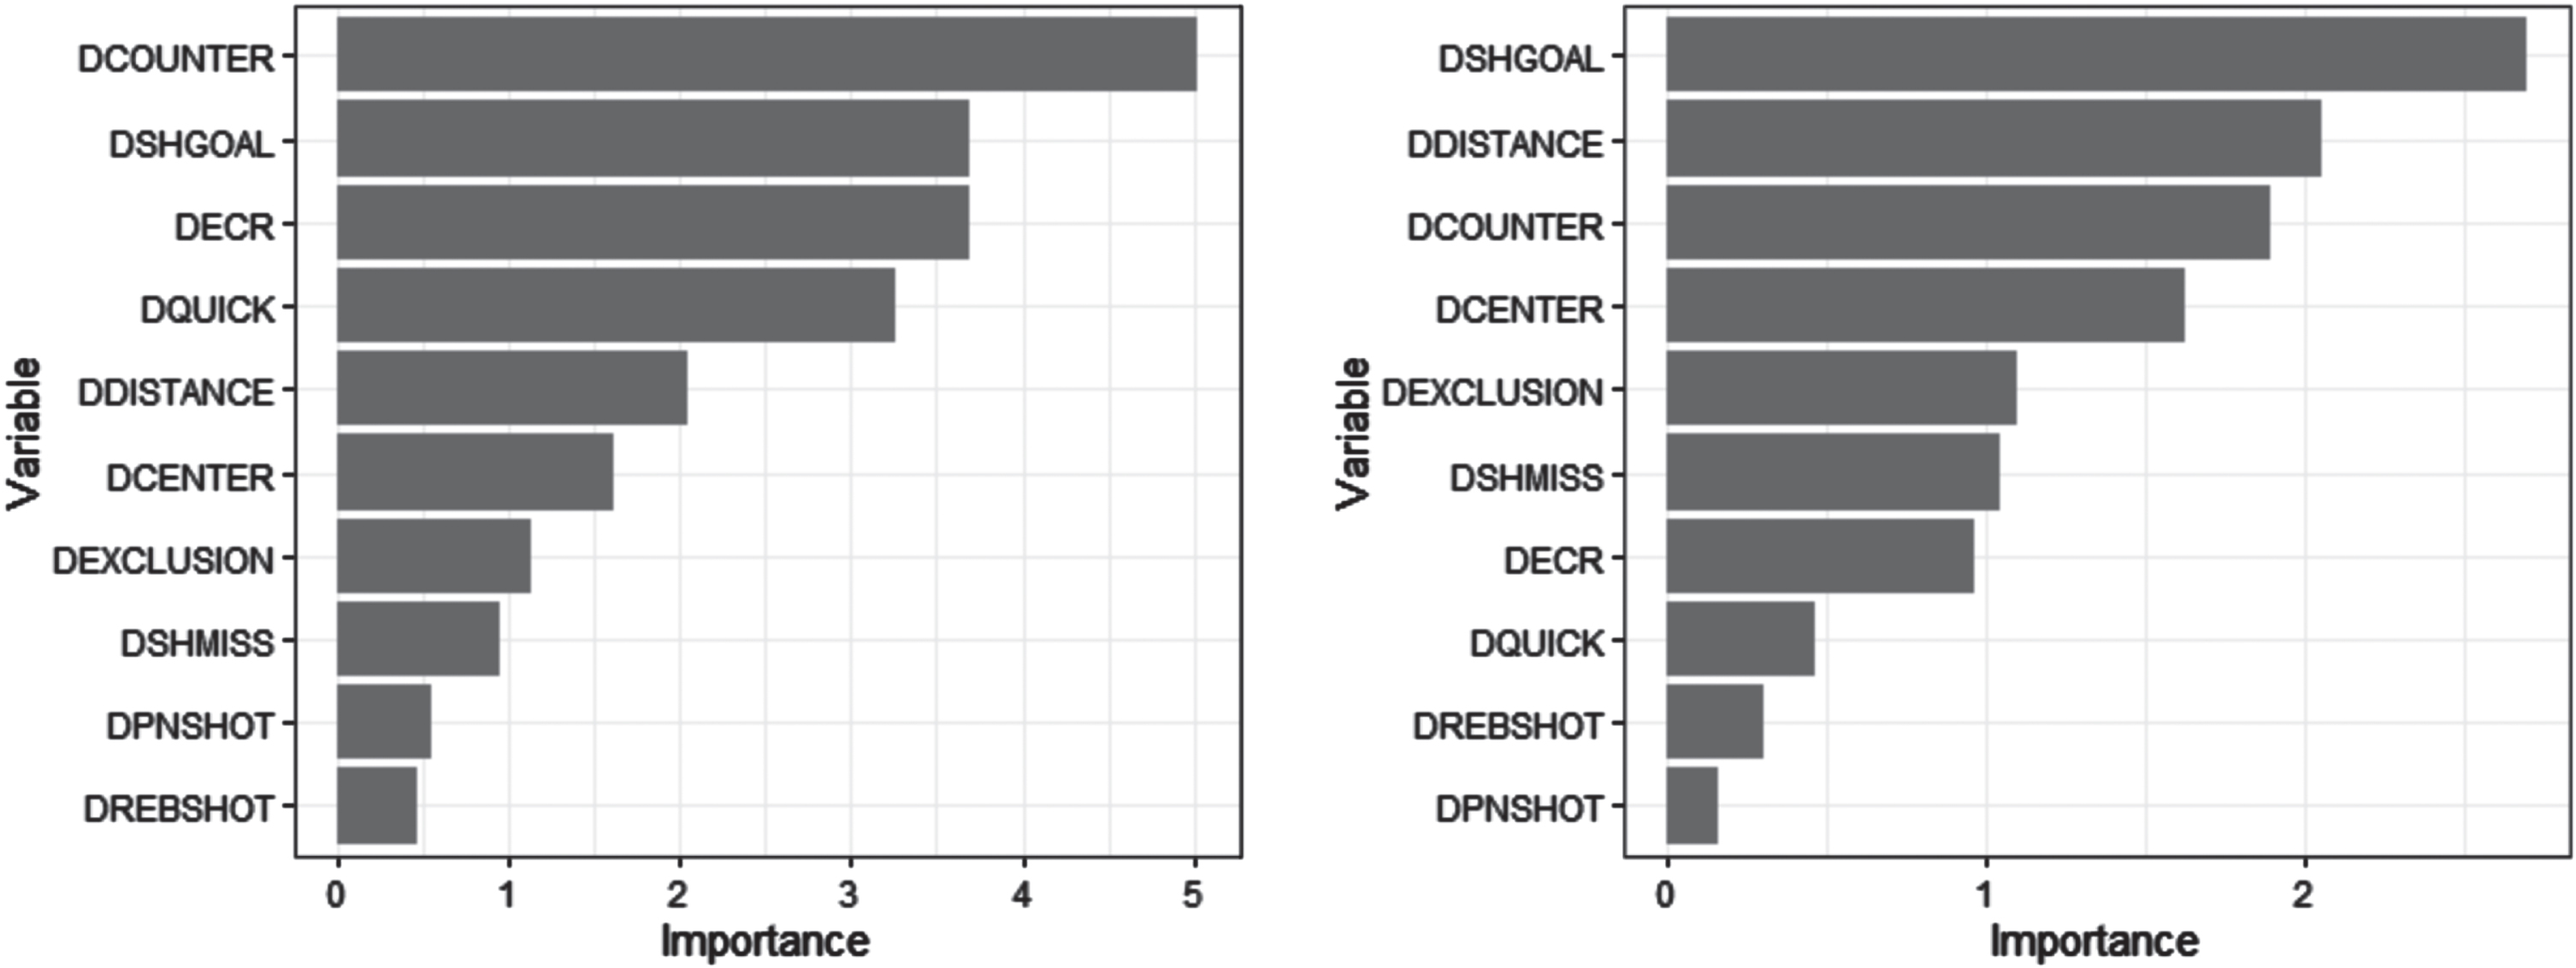
This figure illustrates that the most important shot characteristics in the production function for men’s games were counterattacks, shots on goal, exclusion conversion rate, quick shots, and average shot distance. All the coefficients in this model were of the expected signs except DEXCLUSION which had a negative sign.
Model 1 suggested four significant predictors of goal differentials in women’s games: DSHGOAL, DDISTANCE, DCOUNTER, and DCENTER. The coefficient for DSHGOAL was almost twice as large as the corresponding coefficient in the men’s model 1 with an average predicted increase in goal differential of one for an increase of about two in shots on goal differential. DDISTANCE also seemed to be more significant for women’s games with an average increase of one in goal differential for every decrease of 0.38 meters in average shot distance differential. The right panel of Fig. 1 shows the variable importance for all terms in the women’s model 1. Note that the top three of DSHGOAL, DDISTANCE, and DCOUNTER were also in the top five for the men’s model 1. The next most important term in the women’s Model was DCENTER with a sharp drop off in importance after this variable.
Comparing the women’s model 1 with model 2, we found that the estimated coefficients were more volatile than in the corresponding men’s model comparisons. None of the coefficients changed signs, however, one variable (DCOUNTER) did lose significance. Furthermore, while the variable DWINPERC was still not significant, its estimated coefficient was more than four times as large as its estimated coefficient in the men’s model 2.
Interestingly, there were more variables in the women’s Models with unexpected signs including DEXCLUSION, DCENTER, DQUICK, DPNSHOT, and DREBSHOT, although the latter three were very low in importance and can likely be explained by the smaller sample size of women’s games compared to the men. The coefficient of DEXCLUSION was close to the corresponding coefficient in the men’s model while the large negative coefficient of DCENTER was not seen in the men’s model.
Table 5 displays the results of the secondary model of SOG likelihood.
Table 5
Production function regression results: shots on goal model
| Dependent Variable: SOG | ||||||||
| Men’s (n = 88) | Women’s (n = 38) | |||||||
| Variable Name | Est. Coef. | SE | Statistic | P value | Est. Coef. | SE | Statistic | P value |
| Intercept | 1.036 | 0.046 | 22.472 | 0.000 *** | 1.017 | 0.079 | 12.796 | 0.000 *** |
| DISTANCE | – 0.043 | 0.006 | – 6.845 | 0.000 *** | – 0.044 | 0.010 | – 4.214 | 0.000 *** |
| ANGLE | – 0.002 | 0.001 | – 3.495 | 0.00 *** | – 0.001 | 0.001 | – 1.468 | 0.142 |
| CENTER (yes) | 0.008 | 0.027 | 0.291 | 0.771 | 0.025 | 0.043 | 0.588 | 0.557 |
| HAND (Left) | 0.022 | 0.016 | 1.423 | 0.155 | 0.012 | 0.029 | 0.431 | 0.666 |
| SKIP (yes) | 0.043 | 0.015 | 2.921 | 0.004 *** | 0.159 | 0.028 | 5.586 | 0.000 *** |
| OFFENCE (Counter) | 0.029 | 0.024 | 1.229 | 0.219 | 0.033 | 0.047 | 0.691 | 0.489 |
| OFFENCE (Penalty) | 0.171 | 0.064 | 2.694 | 0.007 *** | 0.019 | 0.080 | 0.238 | 0.812 |
| OFFENCE (power play) | 0.008 | 0.017 | 0.473 | 0.636 | 0.004 | 0.026 | 0.142 | 0.887 |
| DEFENCE (Pressured) | – 0.095 | 0.030 | – 3.153 | 0.002 *** | – 0.104 | 0.058 | – 1.782 | 0.075 * |
| DEFENCE (Contested) | – 0.194 | 0.029 | – 6.609 | 0.000 *** | – 0.201 | 0.057 | – 3.548 | 0.000 *** |
* Significant at 0.1 level; ** Significant at 0.05 level; *** Significant at 0.01 level.
As shown in Table 5, the following independent variables were found to be significant predictors in men’s water polo: DISTANCE (coef = – 0.043, SE = 0.006, p – value < 0.001), ANGLE(coef = – 0.002, SE = 0.0005, p – value < 0.001), SKIP = Yes (coef = – 0.043, SE = 0.0015, p – value = 0.004), OFFENCE = Penalty (coef = 0.171, SE = 0.064, p – value = 0.007), DEFENCE = Pressured (coef = – 0.095, SE = 0.030, p – value = 0.002), and DEFENCE = Contested (coef = – 0.194, SE = 0.029, p – value = 0.001). The following variables were not found to be significant (all p – values > 0.1): CENTRE, HAND, OFFENCE = Counter, and OFFENCE = Power Play although all these terms had the expected sign predicted in Table 3. To place these coefficients in context, the odds of obtaining a SOG are predicted to
• decrease by 4% for each additional meter of distance from the goal.
• decrease by 2% for each additional 10 degrees from center.
• increase by 4% for a skip shot compared to a non-skip shot.
• increase by 19% for a penalty shot compared with an even shot
• decrease by 9% for a pressured shot compared with an uncontested shot.
• decrease by 18% for a contested shot compared with an uncontested shot.
For the women’s model, the following variables were found to be significant: DISTANCE (coef = – 0.043, SE = 0.010, p – value < 0.001), SKIP = Yes (coef = – 0.159, SE = 0.028, p – value < 0.001), DEFENCE = Pressured (coef = – 0.104, SE = 0.058, p – value < 0.075), and DEFENCE = Contested (coef = – 0.201, SE = 0.057, p – value < 0.001). All other variables were not found to be significant. The estimated change in SOG odds for the women’s model were approximately the same as in the men’s model for the variable DISTANCE and both levels of the variable DEFENCE, but more drastic for skip shots. In particular, the odds of an SOG were predicted to increase by 17% for a skip shot compared to a non-skip shot.
8Discussion
This exploration draws upon sports economics literature to identify the functional elements of NCAA water polo production functions. Unique two-year data sets tracking men’s and women’s NCAA water polo games provided an opportunity to analyze the production of goals scored between two teams as a function of play- and team-specific variables. Using this data, two models were fit to predict goal differentials in men’s and women’s games, one using a random effect for teams and one using a fixed effect based on previous year’s win percentage. The conclusions of the two models were roughly consistent in terms of model coefficients although there were some small differences in variable significance.
Both models found that differences in shots on goal, counterattack opportunities, exclusion conversion rates, “quick shots” following an exclusion foul, and average shot distance were all significant variables for predicting score differential in men’s games. For women’s games, the random team effects model found that differences in shots on goal, counterattacks, and average shot distance were all significant predictors of goal differential while the fixed effects model identified shots on goal, center opportunities, and average shot distance as significant variables. These findings draw attention to the similarities in predictors of goal differences in both the men’s and women’s game. The presence of center opportunities as a significant predictor in the women’s game but not the men’s, may be explained by differences in the physicality of center play. Further investigation into the number of exclusions drawn and penalties awarded by centers is warranted to explore this tentative explanation.
DCOUNTER was identified as the most important variable for men’s games by both models while DSHGOAL was the most important for women’s games. Since DSHGOAL was found to be a highly significant variable in both models, a secondary logistic model for studying how to increase the likelihood of getting shots on goal was also fit to shot level data. Analysis showed that shot distance and defense were significant predictors of shots on goal in both men’s and women’s water polo with the odds of getting a shot on goal decreasing by about 4% for each additional meter of distance and by as much as 18% for contested vs uncontested shots. Whether or not a shot skipped on the water before reaching the goal was also a significant factor in both models although the odds increase was more than four times as large in women’s compare to men’s shots. Interestingly, the angle of the shot was only significant in men’s water polo with the odds of making a shot decreasing by about 2% for each 10 degrees of distance from the center of the pool. Whether or not a shot was a penalty shot was also a significant factor in men’s but not women’s water polo.
Comparing and contrasting these results may offer some help in understanding differences in how games are won and lost in men’s vs women’s NCAA contests. For example, the findings suggest that ‘speed of play’ variables, here represented by counterattacks and quick shot opportunities, were more critical in men’s games while ‘shot quality’ variables, shot on goal and average shot distance, were more important for women’s games. Another notable difference was in the effect of exclusion conversion rate (DECR) which was highly significant in the men’s models but not in the women’s. Despite this lack of significance, however, there was still a strong positive correlation between DECR and score differential in women’s games (r = 0.520), so its importance should not be completely ruled out. In addition, the winning team had a higher exclusion conversion rate than the losing team in a comparable 69% of all women’s games and 72% of all men’s games. The discrepancy occurs when we include DECR in models with other important predictors. DECR is more strongly correlated with DSHGOAL in women’s games and this latter variable was found to be the most important predictor of goal differential in such contests. These conjectures warrant further investigations.
The summary statistics in Table 2 reveal some additional insights about differences between men’s and women’s games. For example, final score differential appeared to be more variable in men’s than in women’s games (IQR of 8 for men’s compare to 5.5 for women’s). Men’s games also tended to have a wider range of differences in counterattacks (IQR of 7 vs 2.5) and shot distances (0.87 vs 0.65) while women’s games had a wider range of differences in penalties (IQR of 1 for men vs 2.5 for women) and quick shots (1 vs 2). The spreads of differences in exclusion opportunities and conversion rates, center shots, and rebound shots were similar between men’s and women’s games.
Most of the variable coefficients in the models matched their expected signs with two noteworthy exceptions: differences in exclusions (DEXCLUSION) for men’s/women’s and center opportunities (DCENTER) for women’s only. The consistent sign of DEXCLUSION across models is at first glance surprising. Recalling from the previous discussion on a player advantage from an exclusion foul, it is reasonable to hypothesize that a greater number of player advantage opportunities from a player exclusion than that of the opposing team will be associated with a greater goals-scored differential than the opposing team. Graham and Mayberry (2014) isolated various offensive water polo tactics in the 2012 Olympics men’s competition and found that exclusions generated more goals than any other tactic. Yet, their findings also indicated that a greater number of exclusions only led to a winning outcome in 49% of all games analyzed. When evaluating the goals, however, from a player advantage opportunity, 80% of the teams that won their games also scored a greater number of power play goals. The relevant measure was how efficient the team was at converting the opportunities into goals. In a follow-up analysis, Graham and Mayberry (2016) concluded that officials calling exclusion fouls during water polo games revealed bias: it was more likely that the losing team would have more player advantage opportunities.
The results here are consistent with these previous findings. DEXCLUSION measures the differences of the player advantage opportunities rather than the efficiency of a player advantage opportunity. If the variable DEXCLUSION is isolated, there is almost no correlation with goal differential for men’s games (r = 0.041) and a moderately strong negative correlation with goal differential for women’s games (r - – 0.182). The variable DECR contrastingly measured the difference in exclusion conversion rates and was found to be significant in the men’s model, once again providing an important link between exclusion efficiency and goal scoring as in previous studies.
The large negative coefficient of DCENTER in the women’s models is a more puzzling result as it suggests that more center opportunities have a negative impact on goal production in women’s NCAA contests. If DCENTER is isolated as a predictor, this conclusion can be demonstrated as a fallacy; there is indeed a positive correlation of 0.202 between DCENTER and DGOALS in the women’s game data. However, DCENTER had moderate correlations with the two most important variables from the women’s model: DDISTANCE ((r - – 0.397) and DSHGOAL ((r - 0.383). If we drop these two terms from model 1, for example, the estimated coefficient of DCENTER increases to an inconsequential – 0.047 so it is likely that these two correlated variables are primarily responsible for the observed sign flip in DCENTER.
Although there was a strong and significantly positive correlation between DWINPERC and DGOALS for men’s games (r = 0.395, t86 = 3.989, p < 0.001) as suggested by the dominance of a relatively small number of teams in the sport, the variable DWINPERC was not a significant factor in the men’s model 2. This suggests that any relationship between previous year’s performance and production can be explained by other play variables in the model. For example, DWINPERC exhibited moderate positive correlations with three of the significant variables in the model: DSHGOAL (r = 0.269), DECR (r = 0.274), and DCOUTER (r = 0.332), as well as a moderate negative correlation with the significant variable DDISTANCE (r = – 0.302). In other words, teams which were strong in the previous year, also tended to take more SOG and counterattack opportunities, score a higher percentage of exclusion shots, and shoot from closer to the goal in their games. As with men’s games, there was also significant positive correlation between DWINPERC and DGOALS (r = 0.322, t37 = 2.07, p = 0.045) for women’s games as well as correlations with other play variables. The models here therefore suggest that it is consistent quality of play as opposed to inherent “elite-ness” that are responsible for the dominance of top teams in NCAA water polo.
The findings presented in this paper can be applied in a variety of ways by water polo players, coaches, and organizations, specifically those operating at the collegiate level. Current or aspiring collegiate water polo players can use these data to better understand the implications of specific game tactics and to improve their decision-making in game play situations. More specifically, they can identify the offensive strategies that are likely to cultivate high goal scoring opportunities (i.e. center shots in the men’s game and power play opportunities in the women’s game) and the defensive strategies that force opposing teams into lower percentage plays (i.e. perimeter shots in both the men’s and women’s game). In so doing, the athletes have an opportunity to enhance their water polo IQ and use this knowledge to inform their in-game decisions.
Similarly, coaches can utilize our findings to develop effective game tactics, increase their winning percentages and inform recruiting decision-making processes. Our data enables coaches to manipulate offensive and defensive strategies to cultivate high goal scoring opportunities and force opponents into lower percentage plays. For example, in the men’s game, coaches may encourage their teams to avoid early perimeter shots in favor of working down the clock, forcing an exclusion and taking advantage of a quick power play. In practice sessions, coaches can use these findings to develop drills that emphasize both the high goal scoring game tactics and the skills necessary to execute them (e.g., skip shots in the men’s game and lob shots in the women’s). From a recruiting perspective, coaches can use these data to inform the evaluation of potential players and identify recruits who possess the skills necessary to be successful in any given team. In addition, our dataset and findings provide an insight into the specific tactical demands of the women’s game. Coaches of women’s teams can therefore ground their tactical decisions in women-specific datasets rather than assuming the tactics and skills necessary for success in the men’s game are automatically transferable.
Finally, water polo organizations can utilize these findings in several ways. With regard to long-term skill development, clubs and organizations can use this information to build training programs across age groups that scaffold players’ knowledge of effective offensive/defensive tactics and help develop the skills necessary to execute them. From a high-performance perspective, our findings add to the body of evidence that suggest investment in data analytics infrastructure is warranted. Water polo organizations can utilize this paper to advocate for increased financial investment in the technology (e.g., apps/film) needed to capture game statistics and the personnel needed to analyze the data.
9Futures lines of inquiry
A natural extension of our approach to understanding the water polo production function is to apply the same data gathering and analysis to other water polo competitions and standards of play. A logical starting point may be with international elite competitions and teams, given data can be accessed through video archives and file sharing to allow for the same tracking mechanism to be applied to any available game. The Summer Olympic Games and annual FINA international tournaments would be excellent opportunities to evaluate the tactical inputs and team-specific information of both women’s and men’s teams to see if there are similarities in importance across levels of competition. Additional avenues for contribution to the literature reside in specific offensive tactical approaches and goal-scoring probabilities. We would reasonably expect players, coaches and water polo organizations to be responsive to feedback from these models since it may provide a tactical edge in games of fine margins. However, we may also encounter resistance from those who play or coach “from the gut”. Future research is warranted to explore the responsiveness of these stakeholders to the perceived value of data analytics in water polo. We believe this paper and future lines of inquiry will be useful to both coaches and players as the sport moves from its past, rooted in intuition and experience, to a future that is likely cemented in data analysis and refined coaching techniques and player development.
References
1 | Argudo Iturriaga, M.F. , Roque, J.I.A. , Marín, P.G. & Lara, E.R. , (2007) . Influence of the efficacy values in counter attack and defensive adjustment on the condition of winner and loser in male and female water polo, International Journal of Performance Analysis in Sport 7: (2), pp. 81–91. https://doi.org/10.1080/24748668.2007.11868398. |
2 | Argudo Iturriaga, F.M. , Ruiz, E. & Alonso, J.I. , (2009) . Were Differences in Tactical Efficacy between theWinners and Losers Teams and the Final Classification in the 2003 Water Polo World Championship? Journal of Human Sport and Exercise 4: (2), pp. 142–153 DOI:10.4100/jhse.2009.42.07 |
3 | Bates, D. , Maechler, M. , Bolker, B. & Walker, S. , (2015) . Fitting Linear Mixed-Effects Models Using lme4, Journal of Statistical Software 67: (1), pp. 1–48. https://doi.org/10.18637/jss.v067.i01 |
4 | Bairam, E. , Howells, J. & Turner, G. , (1990) . Production functions in cricket: Australian and New Zealand cricket, Applied Economics 22: , pp. 871–879. https://doi.org/10.1080/00036849000000025 |
5 | Brook, S. , (2005) . What Do Sports Teams Produce? Journal of Economic Issues 39: , pp. 792–797. DOI:10.1080/00213624.2005.11506846 |
6 | Carmichael, F. & Thomas, D. , (1995) . Production and efficiency in team sports: An investigation of rugby league football, Applied Economics 27: , pp. 859–69. https://doi.org/10.1080/00036849500000039 |
7 | Carmichael, F. , Thomas, D. & Ward, R. , (2000) . Team performance: The case of English premiership football, Managerial and Decision Economics 21: , pp. 31–45. https://doi.org/10.1002/1099-1468(200001/02)21:1<31::AID-MDE963>3.0.CO;2-Q. |
8 | Coates, D. , Frick, B. & Jewell, T. , (2014) . Superstar salaries and soccer success: The impact of designated players in Major League Soccer, Journal of Sports Economics 17: (7), pp. 716–735. https://doi.org/10.1177/1527002514547297 |
9 | Escalante, Y. , Saavedra, J.M. , Tella, V. , Mansilla, M. , García-Hermoso, A. & Dominguez, A.M. , (2012) . Water polo game-related statistics in Women’s international championships: Differences and discriminatory power, Journal of Sports Science & Medicine 11: (3), pp. 475–482. https://www.ncbi.nlm.nih.gov/pmc/articles/PMC3737929/ |
10 | Escalante, Y. , Saavedra, J.M. , Tella, V. , Mansilla, M. , García-Hermoso, A. & Domínguez, A.M. , (2013) . Differences and discriminatory power of water polo game-related statistics in men in international championships and their relationship with the phase of the competition, The Journal of Strength & Conditioning Research 27: (4), pp. 893–901. https://doi.org/10.1519/JSC.0b013e318260ed85. |
11 | Enomoto, I. , Suga, M. , Takahashi, M. , Komori, Y. , Minami, T. , Fujimoto, H. & Takahashi, J. , (2003) . A notational match analysis of the 2001 women’s water polo world championships. In Chatard, J.C., (Ed.), Biomechanics and Medicine in Swimming. IX: . pp. 487–492. https://www.iat.unileipzig.de/datenbanken/iks/bms/Record/4037318 |
12 | García-Marín, P. & Argudo Iturriaga, F.M. , (2017) a. Water polo: Technical and tactical shot indicators between winners and losers according to the final score of the game. International Journal of Performance Analysis in Sport 17: (3), pp. 334–349. https://doi.org/10.1080/24748668.2017.1339258 |
13 | García-Marín, P. & Argudo Iturriaga, F.M. , (2017) b. Water polo shot indicators according to the phase of the championship: Medallist versus non-medallist players. International Journal of Performance Analysis in Sport 17: (4), pp. 642–655. https://doi.org/10.1080/24748668.2017.1382215 |
14 | Graham, J. & Mayberry, J.K. , (2014) . Measures of tactical efficiency in water polo, Journal of Quantitative Analysis in Sports 10: (1), pp. 67–79. https://doi.org/10.1515/jqas-2013-0127. |
15 | Graham, J. & Mayberry, J.K. , (2016) . The ebb and flow of official calls inwater polo, Journal of Sports Analytics 2: (2), pp. 61–71. https://doi.org/10.3233/JSA-160019. |
16 | Gullikson, J. , Mayberry, J.K. , Gale, L.R. & Killick, L. , (2020) . Not throwing away my shot: an analysis of shot features in men’s collegiate water polo, International Journal of Performance Analysis in Sport 20: (2), pp. 240–253. https://doi.org/10.1080/24748668.2020.1741915 |
17 | Gustafson, E. , Hadley, L. & Ruggiero, J. , 1999. Alternative econometric models of production in Major League Baseball, in Fizel, J., Gustafson, E., & Hadley, L. (eds.) Sports Economics: Current Research. Westport: CT, Praeger, pp. 91–104. ISBN : 0275963306 |
18 | Harris, J.S. & Berri, D.J. , (2020) . Wins produced in water polo. In Harris, J.S. (Ed). The Economics of Aquatic Sports. Springer Nature, Switzerland. Sports Economics, Management & Policy book series, (17), pp. 7–14. https://doi.org/10.1007/978-3-030-52340-4_3 |
19 | Kahane, L.H. , (2005) . Production efficiency and discriminatory hiring practices in the National Hockey League: A stochastic frontier approach, Review of Industrial Organization, 27: , pp. 47–71. https://doi.org/10.1007/s11151-005-4400-4 |
20 | Kahn, L. , (1993) . Managerial quality, team success, and individual player performance in Major League Baseball, Industrial and Labor Relations Review 46: , pp. 531–547. https://doi.org/10.2307/2524551 |
21 | Leard, B. & Doyle, J.M. , (2010) . The effect of home advantage, momentum and fighting on winning in the National Hockey League, Journal of Sports Economics 12: (5), pp. 538–560. https://doi.org/10.1177/1527002510389869 |
22 | Lee, J. & Lee, Y.H. , (2021) . Development of a win production function and evaluation of cross-Sectional dependence, Journal of Sports Economics 22: (4), pp. 412–431. https://doi.org/10.1177/1527002520983438 |
23 | Lupo, C. , Condello, G. & Tessitore, A. , (2012) . Notational analysis of elite men’swater polo related to specific margins of victory, Journal of Sports Science & Medicine 11: (3), pp. 516–525. https://www.ncbi.nlm.nih.gov/pmc/articles/PMC3737947/ |
24 | Lupo, C. , Condello, G. , Tessitore, A. & Tessitore, A. , (2014) . Women’s water polo World championships technical and tactical aspects of winning and losing teams in close and unbalanced games, Journal of Strength and Conditioning Research 28: (1), pp. 210–222. https://doi.org/10.1519/JSC.0b013e3182955d90 |
25 | Platanou, T. , (2004) . Analysis of the” Extra Man Offence” in Water Polo: A Comparison between Winning and Losing Teams and Players of Different Playing Position, Journal of Human Movement Studies 46: (3), pp. 205–211. Research gate. |
26 | Saavedra, M.J. , Escalante, Y. , Mansilla, M. , Tella, V. , Madera, J. & García-Hermoso, A. , (2017) . Water polo game-related statistics in women’s international championships as a function of final score differences, International Journal of Performance Analysis in Sport 16: (1), pp. 276–289. https://doi.org/10.1080/24748668.2016.11868886 |
27 | Sánchez, J.M. , Castellanos, P. & Dopico, J.A. , (2007) . The Winning Production Function: Empirical evidence from Spanish Basketball, European Sport Management Quarterly 7: (3), pp. 283–300, DOI: 10.1080/16184740701511177 |
28 | Schofield, J. , (1988) . Production functions in the sports industry: An empirical analysis of professional cricket, Applied Economics 20: , pp. 177–93. https://doi.org/10.1080/00036848800000003 |
29 | Scott, F.A. , Long, J.E. & Somppi, K. , (1985) . Salary vs marginal revenue product under monopsony and competition: the case of professional basketball, Atlantic Economic Journal 13: , pp. 50–59. DOI:10.1007/BF02304294 |
30 | Scully, G.W. , (1974) . Pay and performance in Major League Baseball, American Economic Review 64: (6), pp. 917–930. https://www.jstor.org/stable/1815242 |
31 | Smith, H.K. , (2004) . Penalty shot importance, success and game context in international water polo, Journal of Science and Medicine in Sport 7: (2), pp. 221–225. https://doi.org/10.1016/S1440-2440(04)80012-4 |
32 | Streeter, B. & Brownlee, B. , 2018. 2018-19 and 2019-20 NCAA Water Polo Rules and Interpretations. Indianapolis, NCAA. https://collegiatewaterpolo.org/wpcontent/uploads/2018/07/NCAARulesBook2018_192019_20.pdf |
33 | Takagi, H. , Nishijima, T. , Enomoto, I. & Stewart, A.M. , (2005) . Determining factors of game performance in the 2001 world water polo championships, Journal of Human Movement Studies 49: (2), pp. 333–352. https://www.researchgate.net/publication/261474423_Determining_factors_of_game_performance_in_the_2001_World_Water_Polo_Championships |
34 | Vila, M.H. , Abraldes, J.A. , Alcaraz, P.E. , Rodríguez, N. & Ferragut, C. , (2011) . Tactical and shooting variables that determine win or loss in top-Level in water polo, International Journal of Performance Analysis in Sport 11: (3), pp. 486–498. https://doi.org/10.1080/24748668.2011.11868567 |
35 | Wickham, H. , (2016) . ggplot2: Elegant Graphics for Data Analysis. Springer-Verlag New York. https://ggplot2.tidyverse.org |
36 | Zak, T.A. , Huang, C.J. & Siegfried, J.J. , (1979) . Production efficiency: the case of professional basketball, Journal of Business 52: , pp. 379–392. DOI: 10.1086/296053 |
37 | Zeck, C.E. , (1981) . An empirical estimation of a production function: the case of American baseball, American Economist 25: , pp. 19–23. DOI: 10.1177/056943458102500204 |


