
Fast starters and slow finishers: A large-scale data analysis of pacing at the beginning and end of the marathon for recreational runners
Abstract
Every year millions of people participate in big-city marathons around the world, with such events routinely attracting thousands and even tens of thousands of participants. Careful pacing is widely considered to be an important determinant of success in the marathon and, come race-day, most participants will have decided on a pacing strategy to ensure they manage their energy levels and optimise their finish-times. While researchers have examined the pacing of elite athletes, recreational runners are less well understood. We present an analysis of 1.7 million recreational runners, focusing on pacing at the start and end of the marathon, two particularly important race stages. We show how starting or finishing too quickly can result in poorer finish-times, because fast starts tend to be very fast, leading to endurance problems later, while fast finishes suggest overly cautious pacing earlier in the race. We find that women tend to pace their race more effectively than men, but they can be more cautious too, costing them minutes overall. These findings help to quantify the costs of uneven pacing at the start and end of a marathon, and may help to improve coaching and performance in endurance races.
1Introduction
There are few sporting events quite like the marathon. For many it is the iconic endurance event and yet, despite its gruelling 26.2 miles (42.195 kms), it appeals to millions of runners every year, men and women, young and old, and from all walks of life. The marathon is unique because many events see recreational athletes competing side by side with top elites. For many it is all about surviving the distance, for others it’s about achieving a personal best, and for a rare few it is about winning, and even breaking records. Just as the 100 m sprint and mile distances have had their landmark times (ten seconds and four minutes, respectively) so too does the marathon, with its fabled two-hour target time. In fact, at the time of writing, Nike have recently completed their Breaking2 project1, designed to break the two hour marathon time, albeit in a highly engineered race setting. In the end Eliud Kipchoge registered an impressive 2:00:25 time, only narrowly missing the two hour target. As as a result the narrative around this milestone time has shifted somewhat, from a discussion of “if” to “when”.
Careful pacing during the marathon is widely considered to influence performance, and come race-day most participants, whether recreational or elite, will have carefully considered their pacing strategy. Should a runner aim to run with an even pace throughout the race? Or is it better to plan for a faster first half, bank time, and hope to hold on during a slower second half (a so-called positive split)? Or, should runners pace more conservatively during the first half of the race, speed-up in the second half, and then push hard for a fast finish (a so-called negative split)? In the past researchers have focused on the pacing patterns of elite athletes (Abbiss and Laursen, 2008; Esteve-Lanao et al., 2014; Gosztyla et al., 2006; Hanley, 2013, 2015; Lara et al., 2014; Renfree and St Clair Gibson, 2013; Tatemet al., 2004; Tucker et al., 2006). However, the pacing patterns of recreational runners are less well understood, notwithstanding some recent work (Barandun et al., 2012; Deaner et al., 2014; March et al., 2011; Santos-Lozano et al., 2014).
The popularity of the marathon, and the availability of reasonably fine-grained timing data at many mass-participation events, now presents a unique opportunity to explore many aspects of race performance, including pacing, for recreational runners. In this article we present one such study, in the form of a large-scale, multi-year, multi-race data analysis of more than 1.7 million recreational runners, focusing on pacing during the critical opening and closing stages of the race. Our main findings include the following:
1 Starting or finishing too fast is associated with slower overall finish-times, as partly predicted by Denison (2007), and there is evidence of a causal relationship between start pace and finish-time, in particular.
2 Fast starts are injurious to finish-time performance because they have a tendency to be much faster than most other race segments, leaving runners with a longer remaining distance to endure, and increasing the probability that they will go on to hit the wall later in the race (Buman et al., 2008a,b, 2009; Rapoport, 2010).
3 Fast finishes are also associated with slower finish-times, because they sometimes signal cautious pacing earlier in the race, as if runners are holding back for a final sprint.
4 While women may pace more effectively than men (de Koning et al., 2011; Hubble and Zhao, 2016; Santos-Lozano et al., 2014) they may do so too cautiously, which can cost them minutes in terms of their overall finish-times.
In the following sections we will review related work on the topic of marathon pacing before describing the data used for this study, and explaining our analysis methodology and key findings in detail. We believe that these findings will be of general interest to runners, coaches, and sports scientists alike, by quantifying the importance of careful pacing, especially at the start of the marathon, while highlighting the risks of conserving too much energy for the end of the race.
2Related work
There is a growing body of work that explores the various factors that influence pacing during a wide range of athletic events. Indeed, with the advent of cheaper and more reliable timing technologies, endurance races such as the marathon, and the ‘big data’ that they can generate, provide new opportunities to capture, analyse, and better understand the performance patterns of athletes, at all levels of training and ability. In what follows we will summarise a representative sample of pacing research for various endurance events, for elite and recreational runners, to provide a context for the work presented in this article.
Tucker et al. (2006) examined the pacing strategies of male runners in world-record performances for 800m, 5,000m, and 10,000m events, from 1912 to 1997. They showed that the optimal pacing strategy, during such performances, differed depending on the event duration. The 800m event saw more speed at the start (first lap) of the race, with limited evidence of athletes increasing their speed during the remainder of the event. Indeed, world-record 800m races are characterised by a second lap that is typically much slower than the first lap, supporting the notion that performance in shorter events is improved by a fast start, even at the cost of a slower finish. In contrast, world records in the 5,000m and 10,000m events were reported to be characterised by fast starts, followed by a period of slower running during the middle of the race, and then a significant burst of speed in the closing stages.
Physiologically, the final burst of speed suggest athletes are able to effectively manage their reserve capacity during the middle section of the race, and to draw on these reserves late in the race, to overcome those factors that were responsible for the earlier reduction in speed. The manner in which elite athletes choose a sub-maximal speed at the start of the race, and then optimise their pace during these longer events, is still not well understood. Of course, it needs to be acknowledged too that world-record performances are, by definition, unlikely to be representative of regular race performances, even among elites, and thus are not necessarily achieved with optimal pacing strategies. In the present work, where the focus is on recreational runners, there is a finish-time cost for both a fast start and a fast finish in the marathon. This suggests that, compared to elites, recreational runners are much less adept at selecting or maintaining optimal pacing, relative to their training or ability, during the marathon event, as might be expected.
In related work, Gosztyla et al. (2006) studied the optimal pacing strategy for 5,000m races, this time for moderately trained female distance runners. The results, based on an analysis of 11 runners, suggest that the best performance can be achieved by running the start of the race (the first mile or 1.6 km) 3-6% faster than average race pace. In fact, an even pacing strategy was found to produce slower finish-times in the 5,000m event, suggesting that the slower start (relative to fast start conditions) could not be compensated for during the remainder of this shorter event. Recently, de Koning et al. (2011) proposed a hazard score as a mechanism to predict pacing changes, based on momentary estimates of perceived exertion, and the race distance remaining. Elsewhere, Baron et al. (2011) examined the role of emotion in pacing, and the potential benefits of training strategies that are designed to help the athlete relate their emotional and physical state during exertion.
Researchers have suggested that faster marathoners tend to run at a more consistent or even pace, when compared with slower runners, but the influence of age, gender, and ability, on pacing, is less well understood, particularly with respect to recreational runners. With this in mind March et al. (2011) analysed the pacing of 186 men and 133 women runners from a US marathon during a 3-year period from 2005-2007. These runners completed laps of a one mile loop to compare the pacing of the last 9.7 km of the race to the first 32.5 km, using one mile (1.6 km) splits. Stepwise multiple regression determined that age, sex, and finish-time were each simultaneously statistically significant factors in pace prediction. The authors concluded that small differences between the mean speed of the last 9.7 km and first 32.5 km are associated with faster finish-times; in other words, more even pacing tended to be associated with faster finish-times. Likewise, women were found to be more consistent pacers than men, even when the effects of finish-time and age were controlled for (Haney Jr, 2010; Lara et al., 2014).
The previous study is limited in a number of respects. The test group of runners was relatively small, and the approach taken did not account for widely accepted differences between the sexes when it comes to marathon finish-times; see also Deaner (2006). Physiological differences between men and women — men’s greater maximal oxygen uptake and muscle mass, for example — mean that comparing runners based on finish-time is unlikely to provide a fair basis for comparison; a woman finishing in 3 hours can be considered to be performing at a higher level than a male runner with the same finish-time, all other things being equal. To address this, Deaner et al. (2014) focused on comparing the pacing of male and female recreational runners while correcting for this. They used a data-set gathered from 14 US marathons in 2011, with a total of 91,929 runners. Their study compared first half pacing to second half pacing and corrected for performance differences between the sexes by adjusting (reducing) the finish-time of women by 12%. This preserved a reliable difference in pace variation between men and women (15% vs 11%).
Trubee (2011) also focused on recreational runners, this time in the Chicago marathon, and considered, in addition to age and ability, the effect of heat stress on pacing. The results again support the notion that women are more effective pacers than men, but also found that the difference between the sexes increases from cold to warm races.
Table 1
Dataset summary by city, including the mean and standard deviation of finish-times (minutes).
| Years | Total Runners | Female(%) | Time(mins)(μ/σ) | |
| Amsterdam | 2012-2015 | 44,609 | 21.55 | 250.85 / 41.15 |
| Berlin | 2010-2016 | 230,544 | 23.54 | 248.41 / 42.75 |
| Boston | 2010-2016 | 166,954 | 43.16 | 234.49 / 42.64 |
| Chicago | 2005-2016 | 383,869 | 44.13 | 275.17 / 51.22 |
| Hamburg | 2013-2016 | 50,276 | 22.00 | 242.82 / 37.21 |
| London | 2011-2016 | 212,230 | 36.40 | 269.07 / 53.83 |
| Los Angeles | 2015-2016 | 28,855 | 43.10 | 304.95 / 58.46 |
| New York | 2006-2016 | 407,436 | 37.57 | 268.90 / 48.96 |
| Rotterdam | 2013-2016 | 42,850 | 19.93 | 243.03 / 35.15 |
| Stockholm | 2011-2016 | 88,512 | 24.79 | 249.65 / 38.81 |
| Tokyo | 2015-2016 | 67,974 | 21.43 | 293.25 / 61.55 |
Elsewhere, Del Coso et al. (2013) considered the likely causes of pacing changes during the marathon by looking for blood markers associated with muscle damage. They found a positive correlation between these blood markers in fatigued runners with slowing pace profiles. The presence of other athletes or pacers may also impact performance and pacing, and Bath et al. (2012) considered this with respect to pacing strategy in 5,000m time-trials for recreational male runners. Interestingly, while the participants perceived their performance to be improved by the presence of another runner, their pacing strategy, speed, and heart-rate were not significantly impacted, suggesting that pacing strategies remain unaltered by the presence of another athlete.
Finally, Allen et al. (2017) focused on how marathoners evaluate their race goals, as gains or losses, relative to a neutral reference point. They found, for example, significant bunching among athletes about ‘round’ finish-times, such as 30-minute and 60-minute finish-time intervals, with athletes more likely to adjust their pacing late in the race to target such finish-times, independently of other factors such as pacing groups.
The work presented in this article contributes to this growing body of pacing research in two important ways. Firstly, this work studies recreational marathoners specifically, using one of the largest and most detailed recreational marathon datasets that have been used to date. Secondly, our specific focus on the start and the end of the marathon is, to the best of our knowledge, unique in such a study. The start and the end of the marathon hold a special fascination and significance for marathon runners and coaches alike — there are many cautionary tales about starting too fast or finishing too slowly, for example — and yet the literature remains relatively silent on quantifying the effects of starts and finishes that are slow or fast; for related work on shorter endurance events see Tucker et al. (2006) and Gosztyla et al. (2006). In this paper we quantify these effects, so that we may better understand the relationship between the start and finish of the marathon and overall performance, by measuring the finish-time costs of specific pacing choices.
3Materials and methods
The data for this study was gathered during 2016 from publicly accessible marathon result archives. Briefly, most mass participation races maintain public result archives with athlete and timing information, including gender, age, finish-times etc. In this study we also require 5 km split-times — that is, timing data for each runner at 5 km intervals throughout the race — which limited the set of suitable marathons. Nevertheless, a total of 1,741,806 complete race records, spanning 12 years, were obtained from 64 races in 11 cities; see Appendix for further information on the web-site addresses of these race archives.
In this study we focus on a subset of 1,724,109 recreational runners. We exclude 10,302 elites and 7,395 walkers from consideration. Elites are defined as those finishing in under 150 and 185 minutes, for males and females, respectively. These exact cutoffs are used by some races, while being slightly faster than the cutoffs used by others. However, the precise elite cutoff used is not so important, and the results presented here are consistent when tested against a variety of similar cutoffs. Likewise we define the cutoff for walkers to be 7 hours, and exclude all those taking longer than this to finish; once again the precise cutoff does not have a material impact on the results presented.
For the avoidance of doubt, the final dataset of 1,724,109 recreational runners includes age, gender, and timing information, with 5 km split-times throughout the race (5 km, 10 km,..., 40 km), plus the final finish-time. Overall, 35% of runners in this dataset are female, with 51% aged 40 and older; the dataset is summarised in Table 1.
We are interested in the degree to which a runner starts or finishes their race at a pace that is faster or slower than their mean race pace (MRP), measured in minutes per kilometre. We calculate this relative pace (% RP) for a given race segment (e.g. start or final) as shown in Equation 1; the start segment is the segment from 0-5 km and the final segment is the 2.195 km segment from 40 km to the finish. So, if %RP (Start) =+10 % then it means that the first 5 km was run at a pace that was 10% faster than MRP, while %RP (Final) = -7% means the final segment was run at a pace that was 7% slower than MRP.
(1)
In what follows then, we compare the relative pace of runners at the start (first 5 km) and end (final 2.195 km) of the marathon, to analyse the finish-time implications for male and female runners. Primarily, we are interested in whether uneven pacing (fast or slow, relative to MRP) at the start or the end of the race is beneficial or injurious to overall performance, and what we might learn from this. It is worth highlighting that although the analysis that follows focuses on the aggregation of these data across many races, similar results have been observed on a race by race basis.
4Fast starts = slow finishes
Fast starts in short races (such as 5 km races) are associated with faster finish-times (Gosztyla et al., 2006), but Denison (2007) speculated that fast starts may negatively impact performance for longer, endurance events, such as the marathon; see also Hubble and Zhao (2016) and Santos-Lozano et al. (2014). Is this supported by the data? Is there any evidence of a causal link between start pace and overall performance? We will attempt to answer this question as follows. Firstly, we will present data to support a strong correlation between pacing at the start of the marathon and overall performance. Secondly, we will establish a case for causation by demonstrating the strength, consistency, and repeatability of this relationship under a variety of conditions. Finally, we will provide an explanation as to why we believe this effect exists in the marathon.
4.1Start pace & finish-time costs
Fig. 1 graphs the mean finish-times for runners — all, males (M), females (F) — versus relative start pace during the first 5 km segment of the marathon. All differences between consecutive mean finish-times are statistically significant with p < 0.001 using Welch‘s t-test (Welch, 1947); for the avoidance of doubt, this means that the mean associated with %RP (Start) = P is significantly different from %RP (Start) = P+/-5 %. It is also worth highlighting that in this study we group relative start paces into 5% ranges, so that %RP (Start) = P refers to start paces centred on %RP (Start) = P and in the range P - 2.5 < % RP (Start) < P + 2.5. We have also tested other ranges (1%, 2%... 10% etc.) and found no material difference in the results.
Fig. 1
The mean finish-time of runners (all, male, female) versus relative start pace.
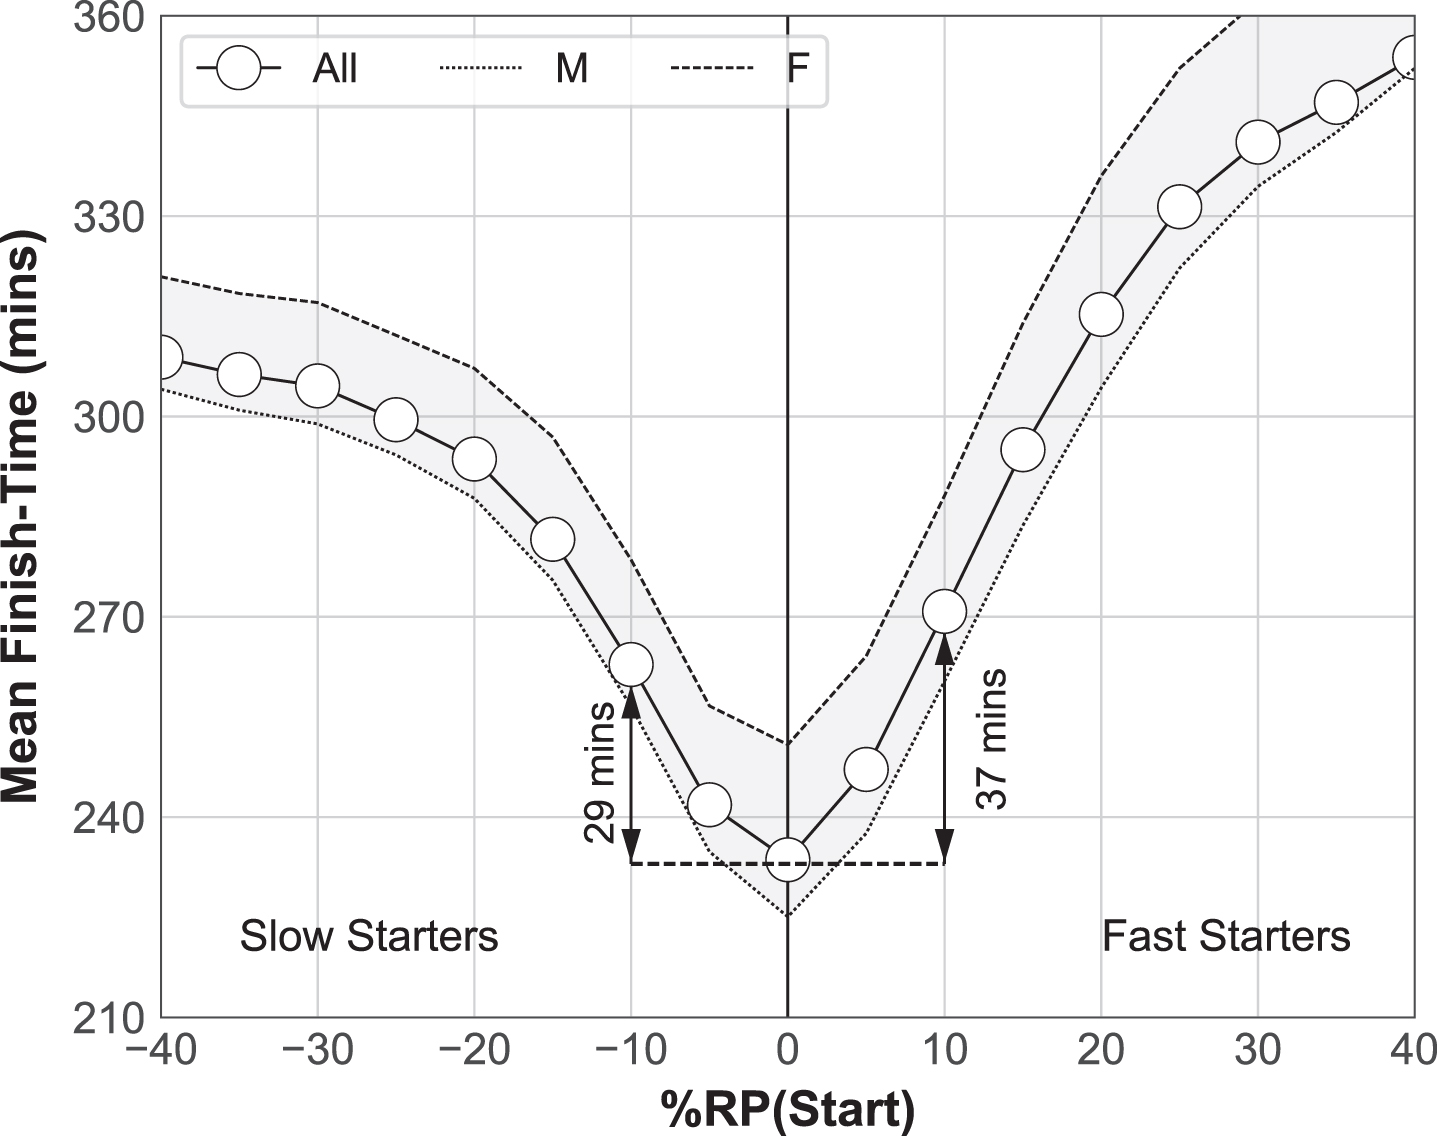
The best finish-times (233 minutes) are found for runners who run the first 5 km segment at, or very close to, their MRP (%RP (Start) =0 %), and we can see a clear finish-time cost, in terms of lost minutes, for those starting faster (%RP (Start) >0) or slower (%RP (Start) <0) than their MRP. For example, as shown, running the first 5 km segment 10% faster than MRP adds about 37 minutes to the average finish-time, while starting 10% slower adds about 29 minutes. In general, fast starts are associated with a greater finish-time cost than slow starts, for a given relative start pace. This difference probably exists because, as we shall see later, fast starters carry a much greater risk of hitting the wall late in the race, compared with slow starters.
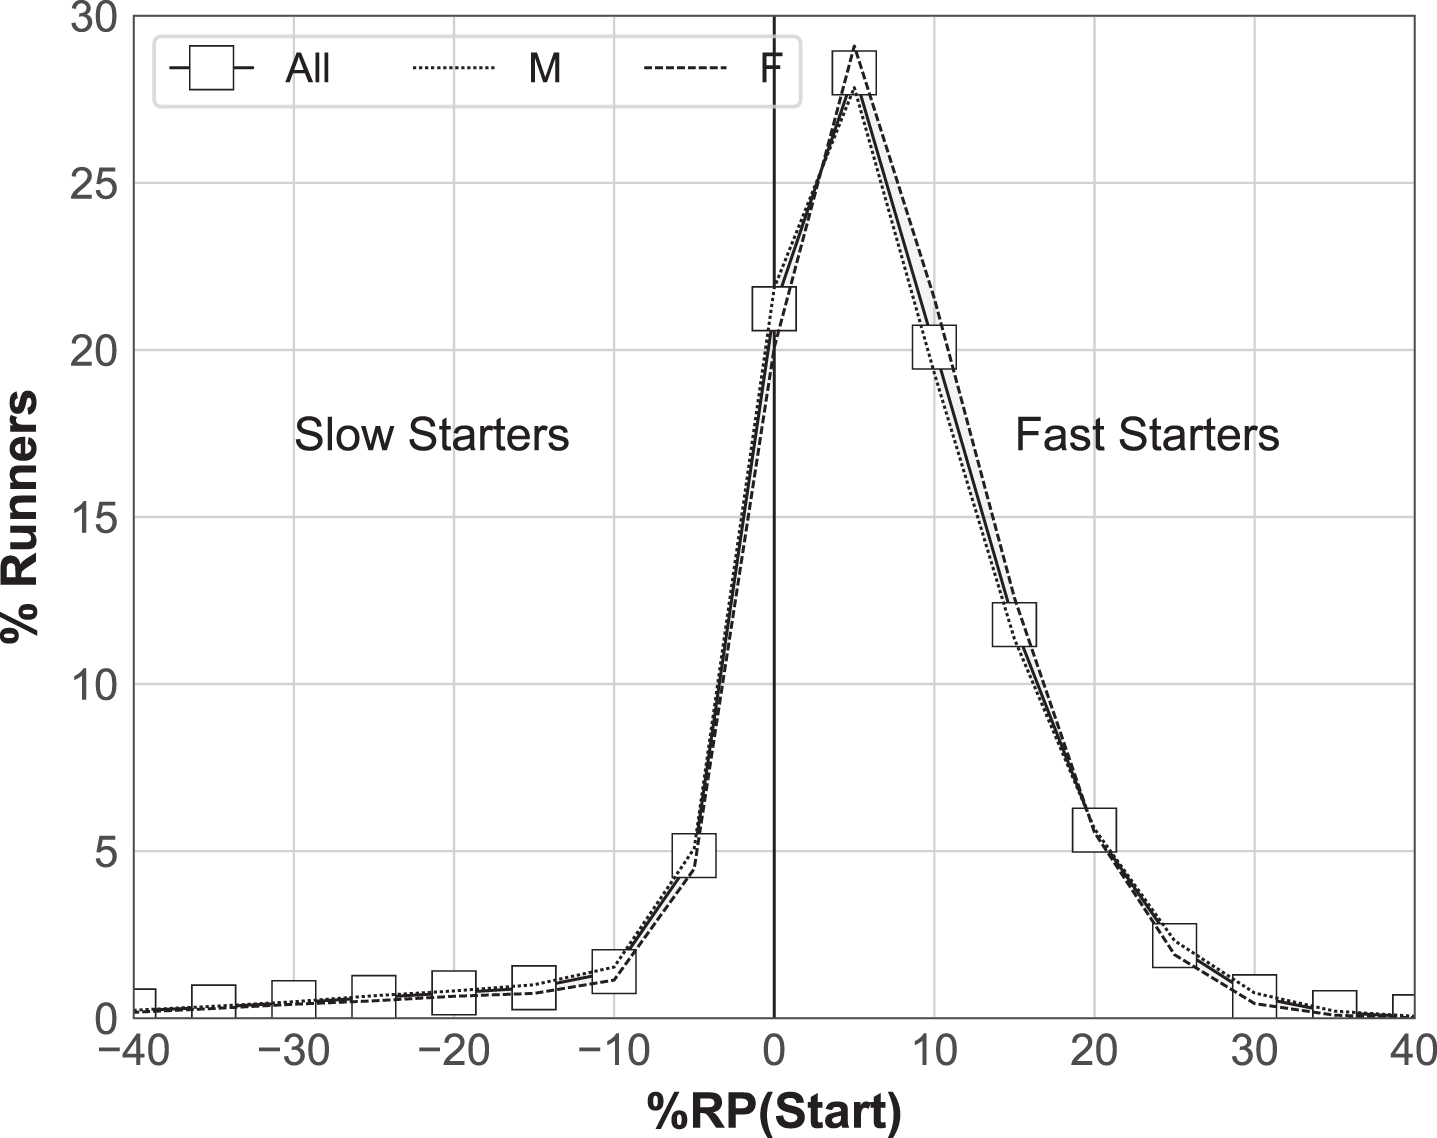
For completeness, in Fig. 2 we show the percentage of runners who start their race at these various relative start paces; this time there is no material difference between the sexes. A large majority of runners (>PctStartingFast%) start at least 5% faster than their MRP, despite the fact that it is associated with slower finish-times. In contrast only PctStartingSlow% of runners start at least 5% slower than MRP. In other words, despite the obvious cost associated with a fast start, and the frequent warnings about going out too fast, most runners can’t seem to help starting fast.
Fig. 2
The mean percentage of runners (all, male, female) with given relative start paces.
4.2The case for causation
While this demonstrates a correlation between fast (and slow) starts and slower overall finish-times, it does not mean that fast starts cause poor overall performance. For instance, one plausible explanation of these results could be that the fastest runners tend to be disciplined enough to start at or near their mean race pace, whereas slower runners are much more likely to start too fast or too slow. This would produce slower finish-times for uneven start paces but it would not mean that starting too fast (or too slow) caused poorer finish-times.
4.2.1Do fast starts cause slow finishes?
One way to begin to test for causation is to stratify the runners into different finish-time bands, to separately analyse the effect of fast (and slow) starts on different levels of ability. If fast or slow starts are causing slower finish-times then we should see evidence of this across all ability levels.
We consider three separate ability bands (based on finish-time) that are well represented in our dataset: (1) those who finish between 3 and 4 hours (180-240 mins, accounting for 34% of all finishers); (2) those who finish between 4 and 5 hours (240-300 mins, accounting for 40% of all finishers); and (3) those who finish between 5 and 6 hours (300 and 360 mins, accounting for 17% of all finishers). For each band we calculate the finish-time associated with the different start paces, as a percentage of the finish-time associated with an evenly paced start (%RP (Start) =0) for that band. This gives us a percentage finish-time cost and makes it possible to directly compare the effect of start pace across the different bands.
Fig. 3
The percentage finish-time cost (relative to %RP (Start) =0) by start pace for ability groups.
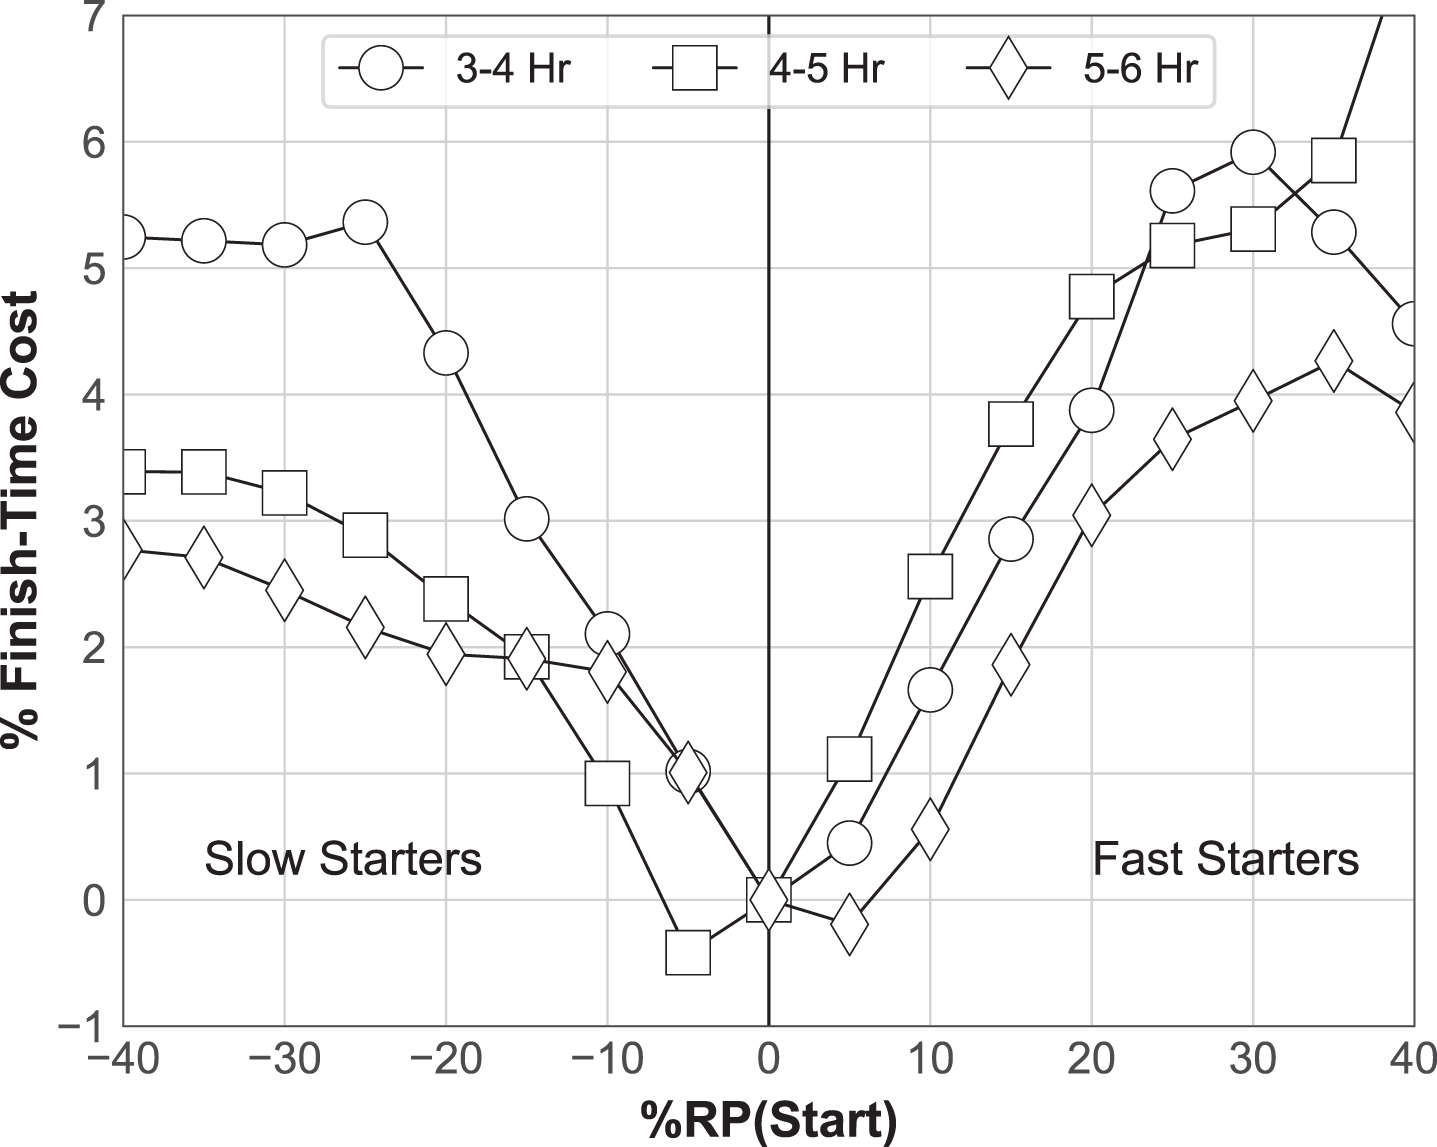
The results are presented in Fig. 3. The finish-time cost associated with starting fast or slow is evident across all three bands. For example, runners finishing in the 4-5 hour range, who start 15% faster (%RP (Start) =15%) than their MRP go on to produce finish-times that are almost 4% longer (slower) than the finish-times of 4-5 hour finishers who start at their MRP; that’s an extra 10+ minutes added to the finish-times of these fast starters, depending on where in the 4-5 hour range they finish. A similar effect is observed for 3-4 hour finishers and also for 5-6 hour finishers.
The same effect is also observed when these banded runners start more slowly than their mean race pace (that is, %RP (Start) <0). The slower they start, the greater the finish-time cost, relative to an evenly paced start. It is worth remarking that the optimal start pace is not always %RP (Start) =0. While this start pace is optimal for 3-4 hour finishers, the 4-5 hour and 5-6 hour cohorts do better by starting at a slightly slower or faster start pace, respectively. Nevertheless, the idea that starting too quickly or too slowly can be injurious to finish-times continues to hold.
The important point is that these results show that the correlation between start pace and finish-times cannot be dismissed as a simple interaction between ability (finish-times) and start pace. Instead, the finding of a robust and consistent finish-time cost, among faster and slower starters, regardless of ability, supports the existence of a causal link between start pace and overall finish-time.
4.2.2Do PBs start fast?
Another way to consider causation between start pace and finish-time is to analyse the performance of individual runners across multiple races, and their ability to run ‘personal bests’ (PBs). If fast or slow starts lead to additional finish-time costs then we should see fewer PBs among these runners.
To test this we focus on repeat runners who have run 3 or more races. There are 476,584 such runners in our dataset. For each of these runners we identify the race with their best (fastest) finish-time, and designate this their PB; obviously this is not necessarily a genuine PB — after all we do not have a complete record of their marathon race-history — but for our purposes it should be sufficient to distinguish between good and not so good performances. In our dataset, the average difference between these PBs and non PBs is just over 18 minutes, for both men and women, and on average, the relative start pace for PBs is about 3% faster than MRP, compared with 6% for non PBs.
Using this data we can calculate the proportion of runners who achieve a PB for different start paces, as shown in Fig. 4; note the %PBs do not sum to 100% because each of the %PBs is calculated with respect to the group of runners starting at a given start pace. The highest percentage of PBs is seen for an even start pace (%RP (Start) =0). 36% of the runners who start at their mean race pace go on to achieve a PB time. For slower and faster runners the likelihood of securing a PB falls away consistently, the slower and faster they start. In fact, in absolute terms, 77% of all PBs (across runners of all levels of ability) are achieved when they start within +/-5% of their MRP. Thus, once again we see a strong, consistent, and predictable relationship between start pace and running a good race.
Fig. 4
The percentage of PBs for different start-paces.
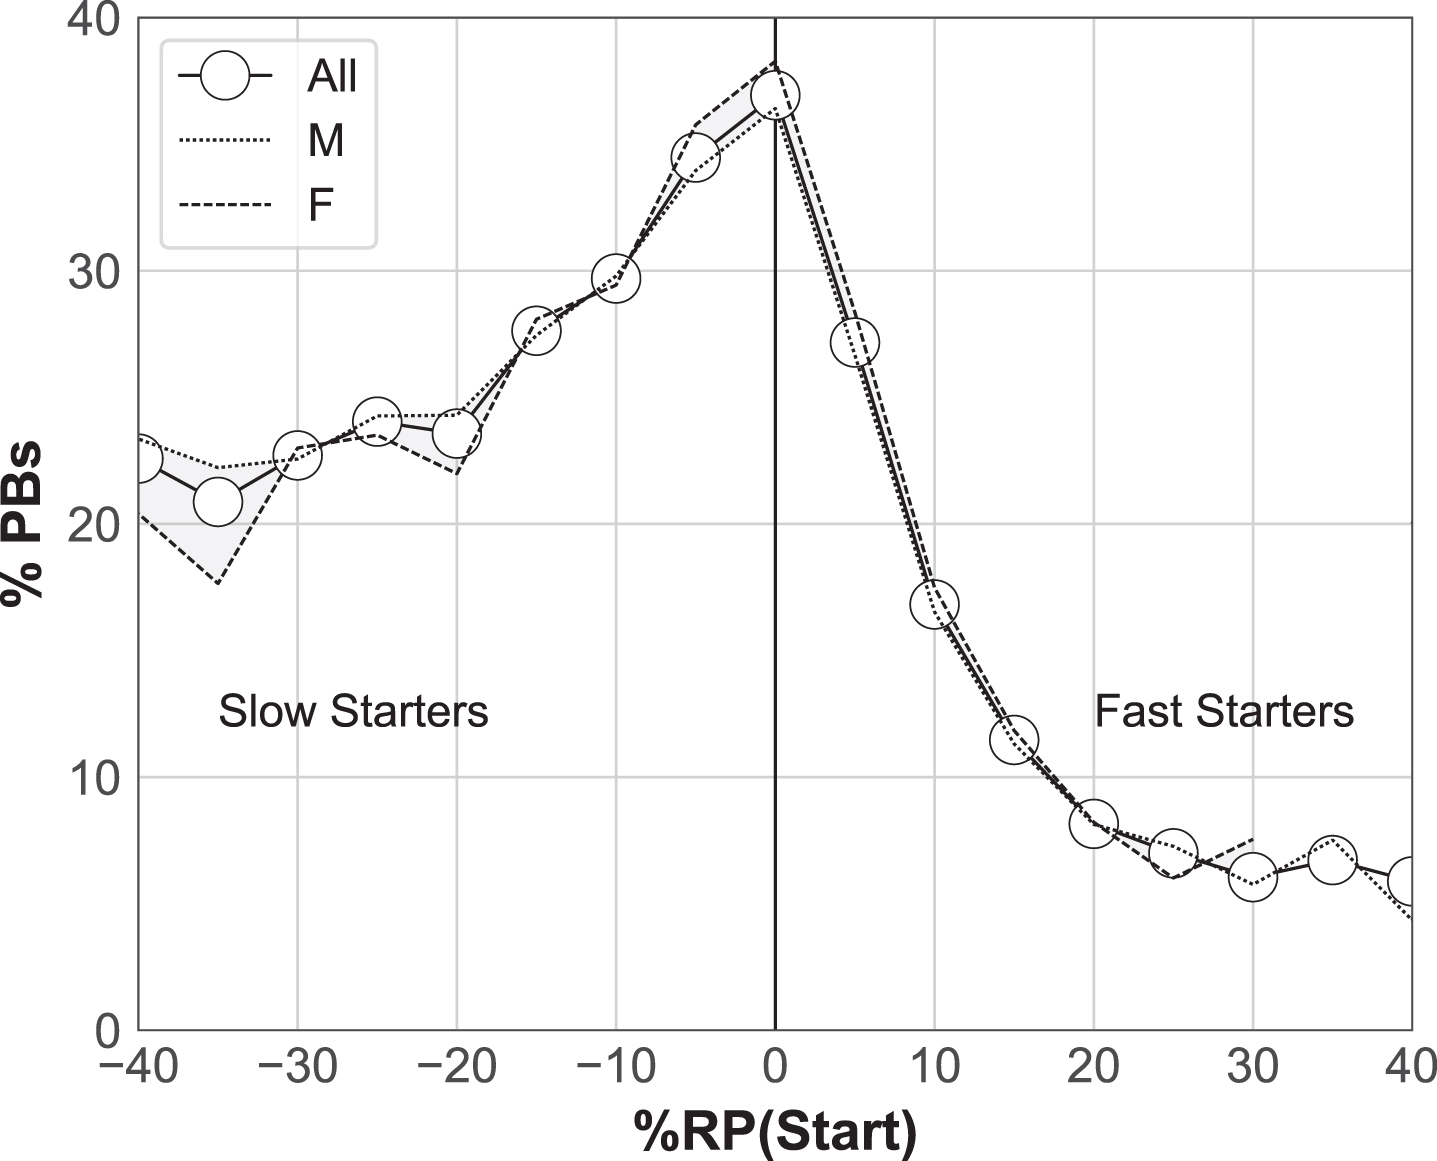
It is worth making three further points about this result. Firstly, by and large there is no major difference between the PB rate of men and women, relative to start pace. Secondly, the effect of start pace on PBs is clearly asymmetrical, and the ability to achieve a PB is reduced for fast starters, relative to slow starters. In absolute terms, over 20% of the slowest starters (those with %RP (Start)< -20 %) go on to achieve a PB, but less than 10% of the correspondingly fast starters achieve a PB. Finally, we have performed the same analysis looking at different repeat thresholds (e.g. >5, >10 races etc. as the basis for PBs) and found the same pattern of results in each case.
4.2.3The criteria for causation
In this section we have focused on the strength and nature of the relationship between pacing at the start of the marathon and overall finish-times. Our analysis shows a strong correlation between starting a race faster (or slower) than MRP, and increased finish-times; in the results presented so far the Pearson correlation coefficient between start pace (faster or slower) and finish-time routinely exceeds 0.95. There is also a strong ‘dose-response’ gradient effect: increasingly fast or slow start paces lead to higher finish-time costs. Furthermore, this relationship persists across runners of differing ability levels; so it cannot be dismissed on the basis that the fastest runners might start at an even pace while slower runners might start more quickly or more slowly. And, when we look at repeat runners, we find the same effect between start pace and the frequency of PBs; a more even start means there is a higher probability of achieving a PB.
The strength, consistency, and repeatability of this relationship between start pace and overall finish-times speaks to the likelihood of a causal relationship; see Hill’s criteria for causation (Hill, 1965). The effect is also consistent with the conventional wisdom about the danger of starting too fast for recreational marathon runners and, as we shall discuss next, the effect passes the plausibility test, as there is a credible mechanism between cause and effect.
4.3Why are fast starts so slow?
Why do fast starts, in particular, have such an injurious effect on overall finish-time? We will consider two related explanations that are uniquely applicable to the start of the marathon: (1) fast starts tend to be very fast, and therefore energy sapping; and (2) fast starts lead to more runners hitting the wall, greatly impacting their overall performance.
4.3.1Fast starts are very fast
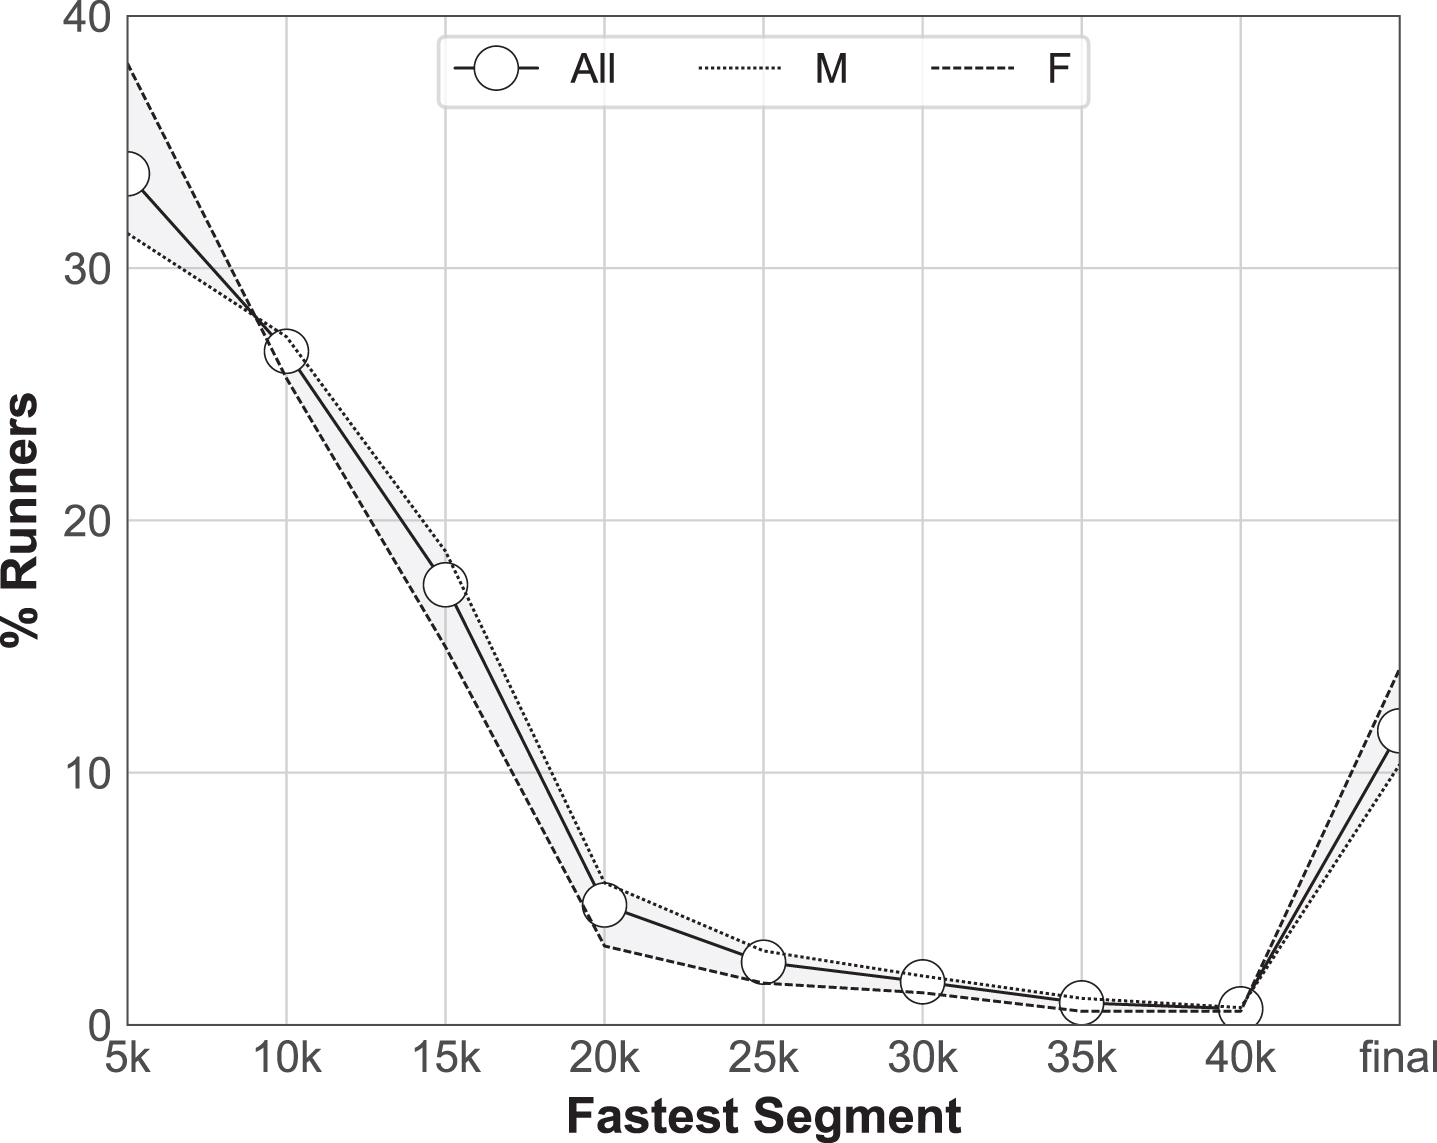
Despite the familiar warnings against starting too fast in the marathon it remains a common occurrence (see Fig. 2), probably due to runners getting caught up in the excitement of the start-line. Fig. 5 shows that 33% of runners have their first 5 km segment as their single fastest race segment (fastest-starters), which is more than any other segment. But why should starting fast be so problematic compared to going fast later in the race? Firstly, by definition, compared to when any other segment is the fastest, starting fast means there is a greater remaining distance to endure, and an increased likelihood that a runner will exhaust their energy reserves before the end of the race.
Fig. 5
The percentage of runners (all, male, female) who run a given race segment as their fastest.
Secondly, those who run the first segment as their fastest do so considerably faster than when any other 5 km segment is their fastest. Fig. 6 shows that these fastest-starters start about 12% faster than their MRP and only the much shorter (2.195 km) final segment is faster. Thus, these fastest-starters start their race more quickly, using more energy, and they have further to finish, when compared to any other segment. This is a combination of factors that is unique to the start of the race and especially injurious to overall performance.
Fig. 6
The relative speed-up of runners (all, male, female), who run a given race segment as their fastest. When run as the fastest segment, the early segments (5km, 10km, 15km) tend to be signifiantly faster than when any other segment is fastest, with the exception of the short (2.195km) final segment
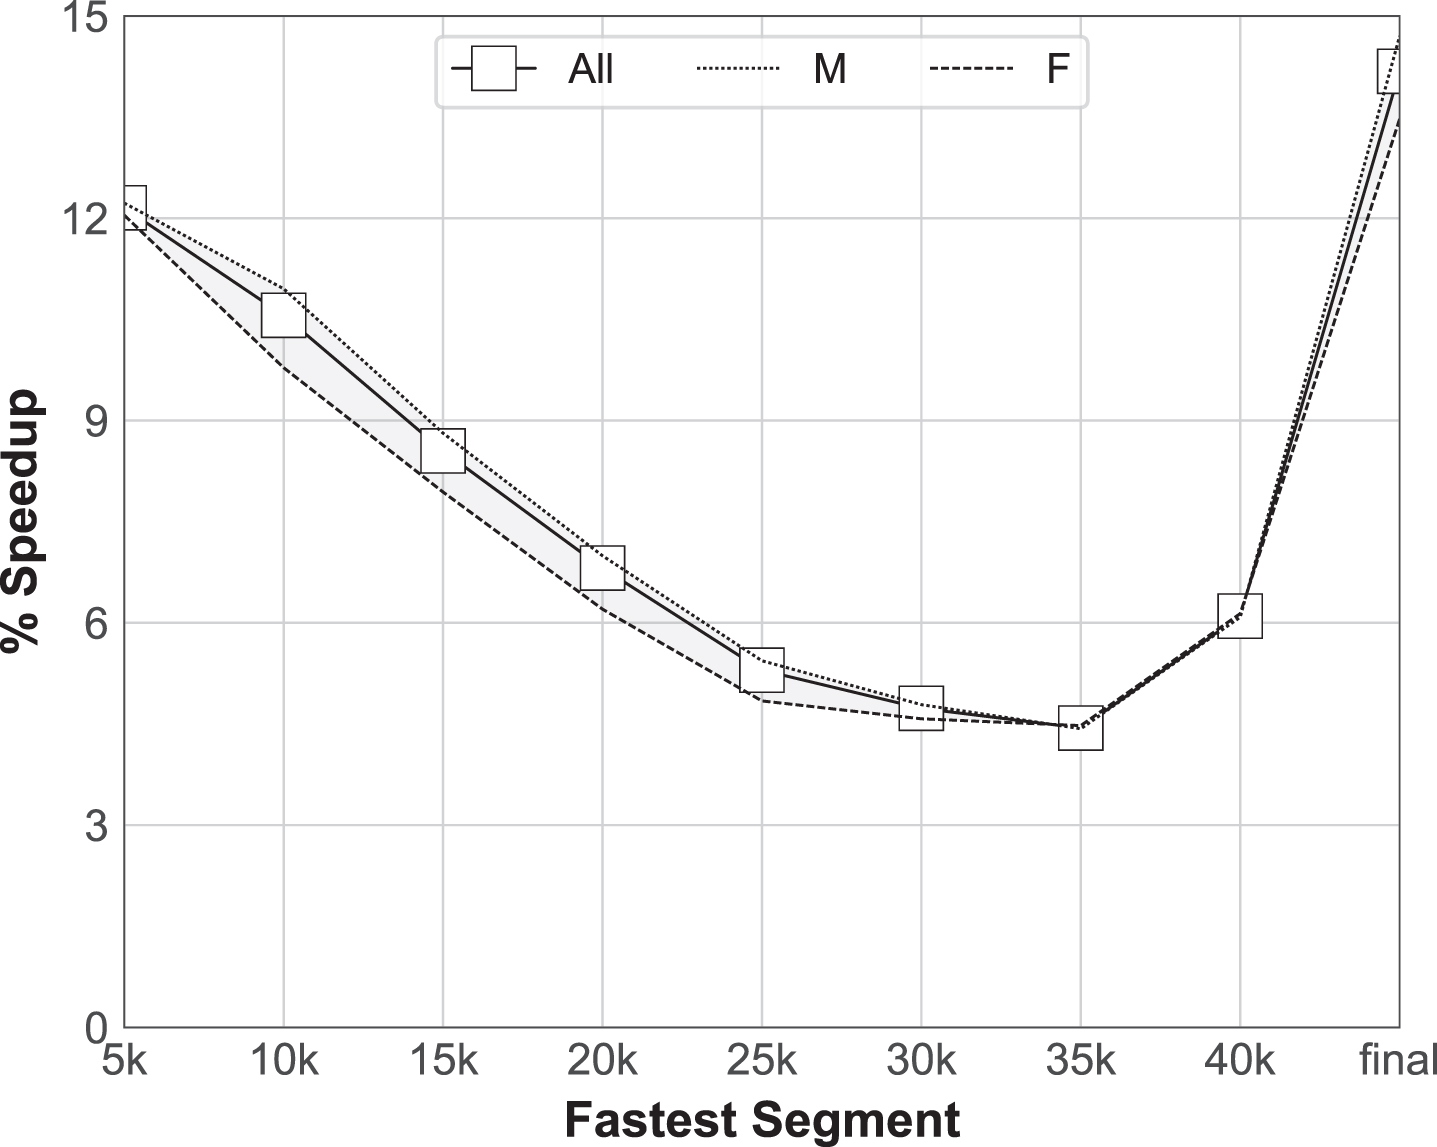
Fig. 7
The percentage of runners (all, male, female) who hit the wall for different relative start paces.
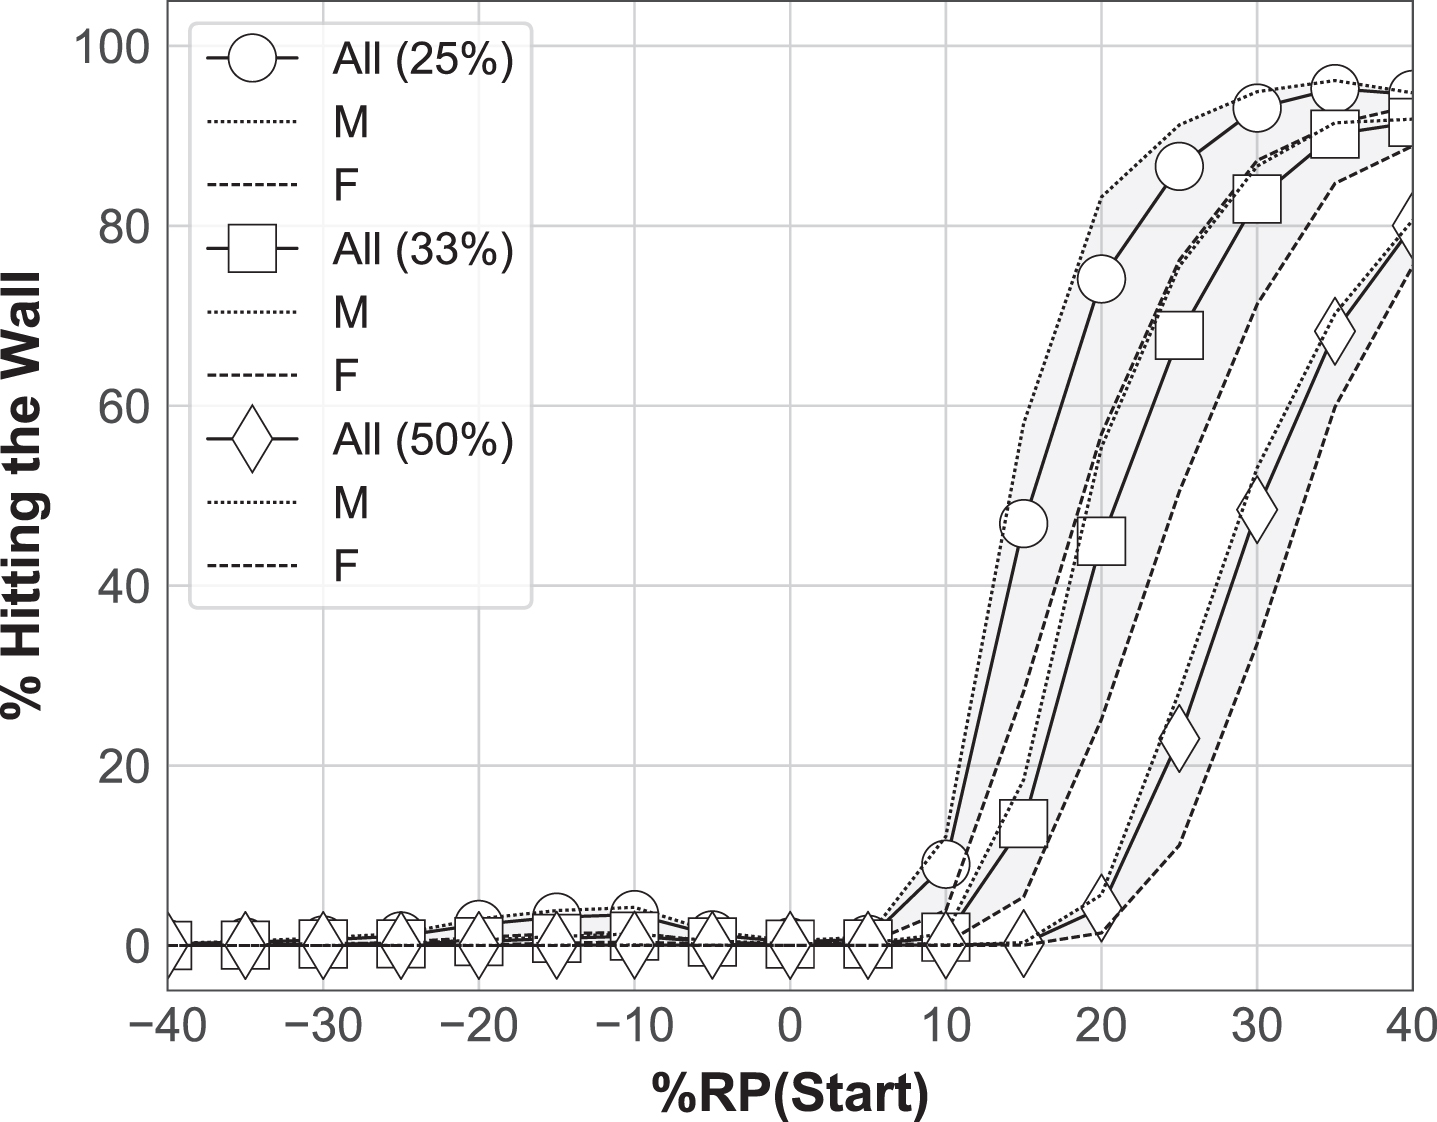
4.3.2Fast starts and hitting the wall
Runners who start faster are also more likely to hit the wall. Hitting the wall refers to a dramatic slow-down, during the second half of the race, usually around 20 miles/30 km, due to a combination of fatigue and glycogen depletion (Buman et al., 2008a,b, 2009; Buman et al., 2009; Morgan, 1978; Morgan and Pollock, 1977; Rapoport, 2010; Stevin-son and Biddle, 1998). For the purpose of this study we determine that a runner hits the wall if their average second half pace slows by some minimum threshold. We chose to focus on slow-downs in the second half of the race, rather than just the final 10-12 km of the race, because there is sufficient anecdotal evidence that recreational runners can experience slow-downs earlier than the 30 km mark. By focusing on the second half of the race we can account for these runners, as well as those who hit the wall around the 30 km mark. Curiously, the literature remains largely silent on the scale of slow-down that is associated with hitting the wall. The precise slow-down threshold is less important here and so we consider a range of values — 25%, 33%, 50% — in order to get a sense of how start pace influences the frequency of slow-downs that might be indicative of hitting the wall. Obviously higher thresholds create a higher bar, so that fewer runners will be considered to have hit the wall.
Fig. 7 graphs the percentage of finishers hitting the wall (based on the 25%, 33%, and 50% thresholds) for different paces at the start of the race. Regardless of the threshold used, we can see that very few runners who start near, or slower than, their MRP (%RP (Start)⩽5 %) go on to hit the wall. However, those who start more than 5% faster than MRP are increasingly at risk of a major slow-down in the second half of the race, and are likely candidates to hit the wall. For example, at the 33% threshold, when %RP (Start) =20%, then 44% of runners hit the wall. It is also worth noting that, regardless of threshold, significantly more men than women risk hitting the wall, for a given start pace. This is consistent with previous research (Buman et al., 2008a,b, 2009; Buman et al., 2009; Stevinson and Biddle, 1998) and suggests that women are pacing more effectively (or at least more cautiously) than men; see also Deaner et al. (2014) and Santos-Lozano et al. (2014).
This strong connection between hitting the wall and starting fast may also explain why there are far fewer PBs among fast starters compared to slow starters (see Fig. 4), and may also be why the finish-time cost of fast starts tends to exceed that of slow starts (see Fig. 1). Starting fast simply carries a much greater risk of hitting the wall, and its attendant performance problems.
4.4Discussion
Conventional wisdom warns against starting the marathon too fast. In this regard, a key contribution of this work has been: (1) to verify that the data supports this advice, for recreational runners, and to quantify the concrete finish-time costs associated with fast (or slow) starts, compared with more even pacing; (2) we have also presented evidence to support a causal relationship between start pace and overall finish-times by demonstrating a strong, consistent and repeatable relationship, which persists across a variety of conditions; and (3) we proposed an explanation for why fast starts, in particular, are so injurious to performance, arguing for the presence of a combination of factors unique to the start of the race, in which runners risk expending too much energy early on, with a maximum remaining distance to endure.
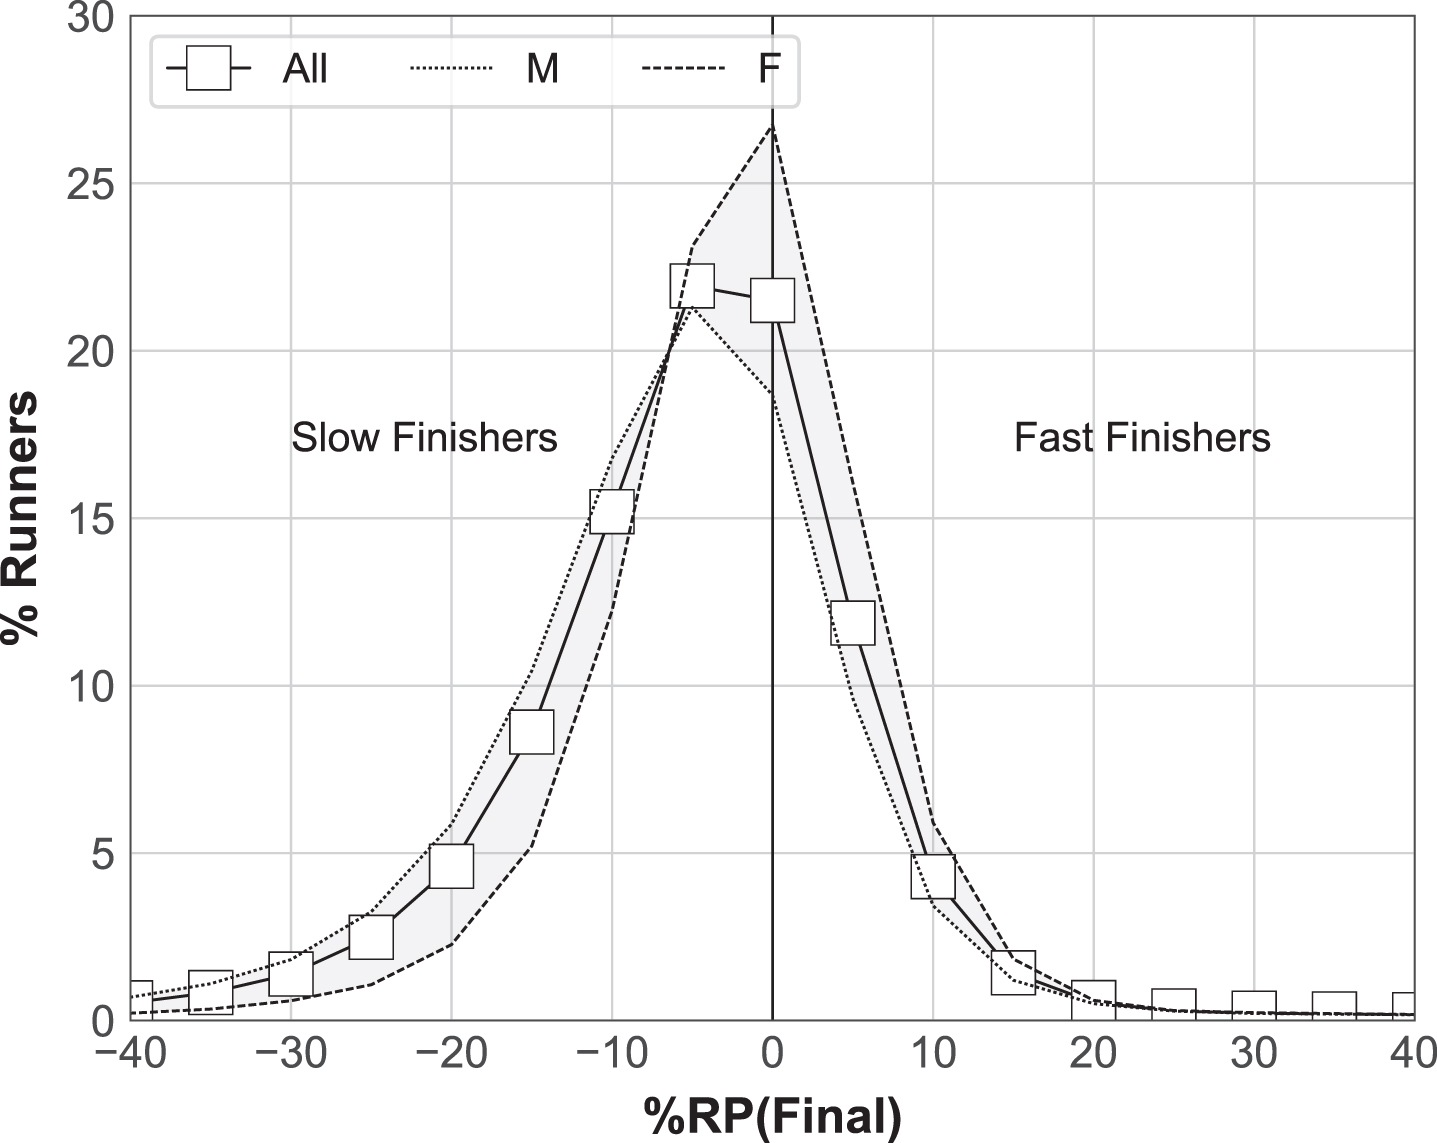
Fig. 8
The mean percentage of runners (all, male, female) with given final paces.
5The paradox of the fast finish
If starting fast is to be avoided, then what might pacing during the final 2.195 km segment of the marathon tell us? If we accept that most runners will try to complete the final segment as quickly as possible — safe in the knowledge that the end of the race is near — then, whether or not they do finish quickly is a proxy for how they feel at race-end. As such, it may reveal how they have paced their race overall, and predict performance. For example, if we accept that runners will try to finish fast, but they are unable to do so, then, injuries aside, this must signal that they have paced too aggressively, and are now suffering the consequences. If, on the other hand, they are able to finish fast, then this may signal that they have paced too conservatively, leaving ‘too much in the tank’, and risk under-performing overall. Either way, if pacing in the final stages is a sign of pacing effectiveness overall then both of these scenarios should lead to a finish-time cost, relative to more evenly paced finishes. To investigate this we will adopt a similar methodology to that used during our analysis of start pace.
5.1How runners finish the marathon
Fig. 8 shows the percentage of runners completing the final segment of the marathon at different relative paces (%RP (Final)). Compared to the start of the race, where a large majority of runners run the first 5 km faster than their MRP, here we see a small majority of runners finishing slower than their MRP. Just over 58% of runners finish more slowly than MRP (%RP (Final) <0) compared to 19% finishing faster (%RP (Final) >0); more than 21% finish at their MRP (%RP (Final) =0). The suggestion is that these slow finishers have run a more aggressive race (relative to their ability) compared with fast finishers, so much so that they cannot even muster a final dash to the finish-line. As further evidence of this, on average these slow finishers run their second half of the marathon about 15% slower than their first half, while evenly paced finishers run the second half 7% slower, and fast finishers run it just 5% slower than the first half; true negative splits are rare among recreational marathoners. This suggests that a slow finish is the end of a hard race with significant deterioration in pace during the second half of the course. On the other hand, fast finishers maintain a much more even pacing profile throughout the race, and have enough left to finish fast.
Unlike the corresponding result for pacing at the start of the race (c.f. Fig. 1) here we do see a difference in approach between the sexes. 65% of men are slow finishers, compared with less than 47% of women. And only 16% of men are fast finishers, compared with 26% of women. In other words, male runners are much more likely to finish slowly, and much less likely to finish quickly, compared to female runners. This suggests that, compared with female runners, males are more likely to push hard during the early part of the race, and much less likely to hold back for a faster second half. Moreover, these slow-finishing males tend to run their final segment about 14% slower than MRP, compared to just over 9% slower for slow-finishing females.
Thus, the pacing of the final segment of the marathon, whether slow, even or fast, looks to be a reasonable proxy for how well a runner has paced their race up to that point. The next logical question is whether these pacing differences come with any additional finish-time cost, as was the case for start pace.
5.2The cost of a fast finish
To answer this, we begin by establishing the relationship between final-pacing (%RP (Final)) and mean finish-time as shown in Fig. 9; once again all differences between consecutive mean finish-times are statistically significant with p < 0.001 using Welch‘s t-test for %RP (Final)> -30 %.
Fig. 9
The mean finish-time for runners (all, male, female) versus relative pace, for the final (2.2km) race segment.
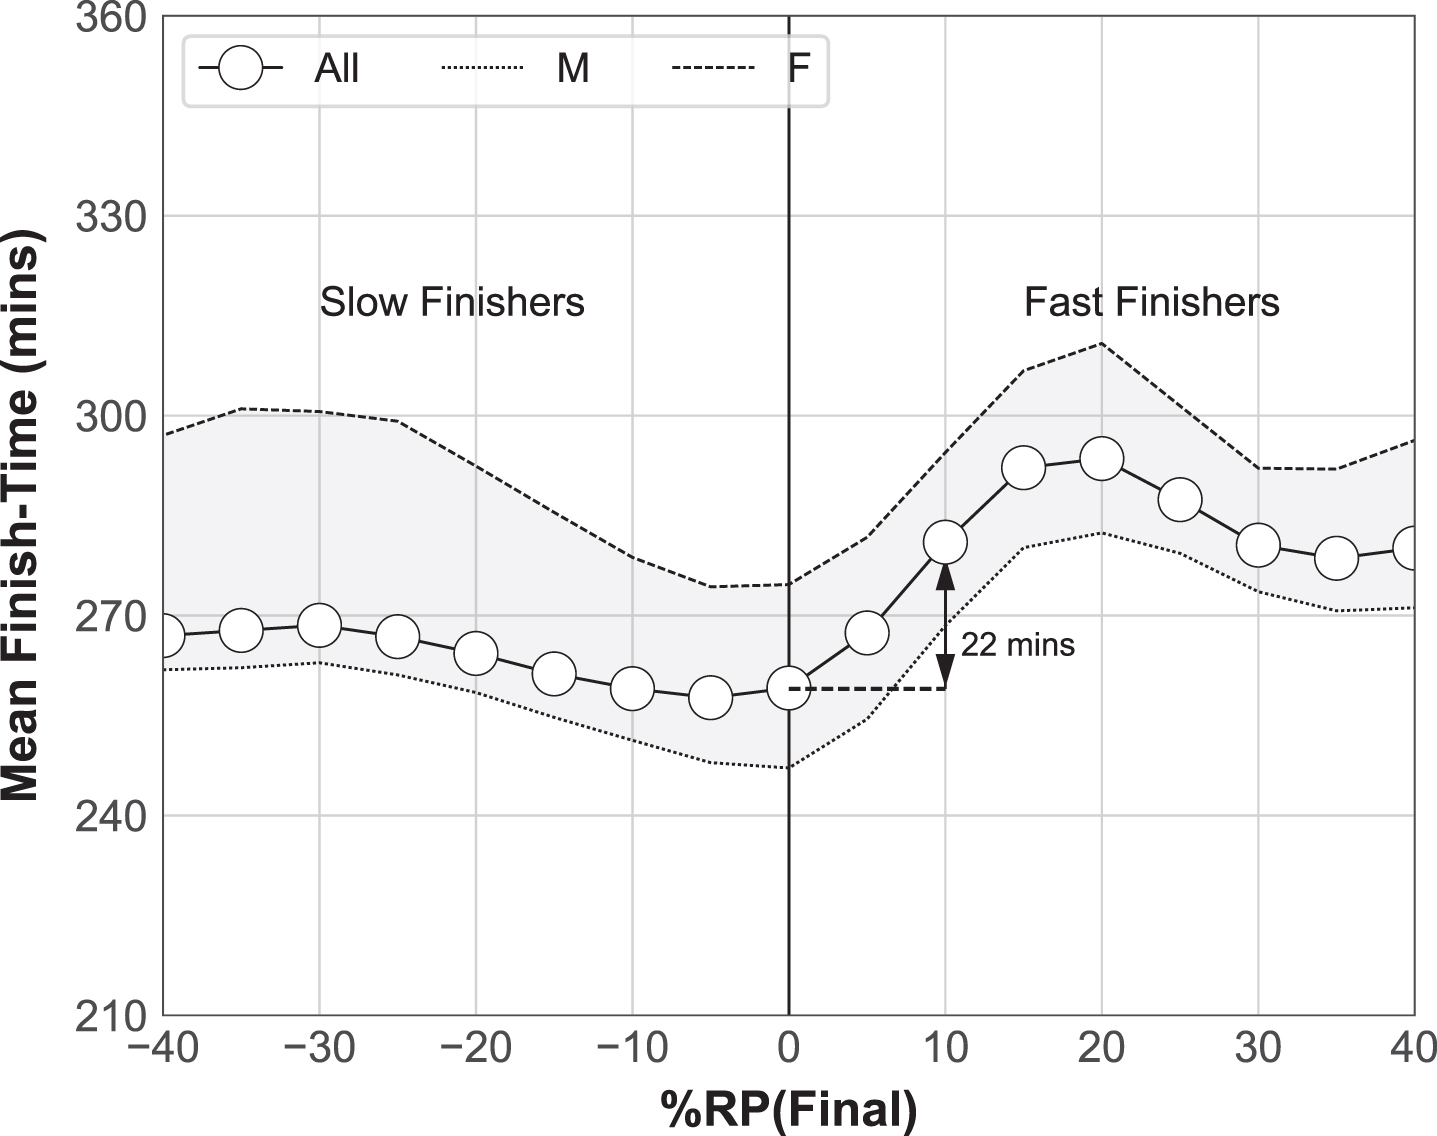
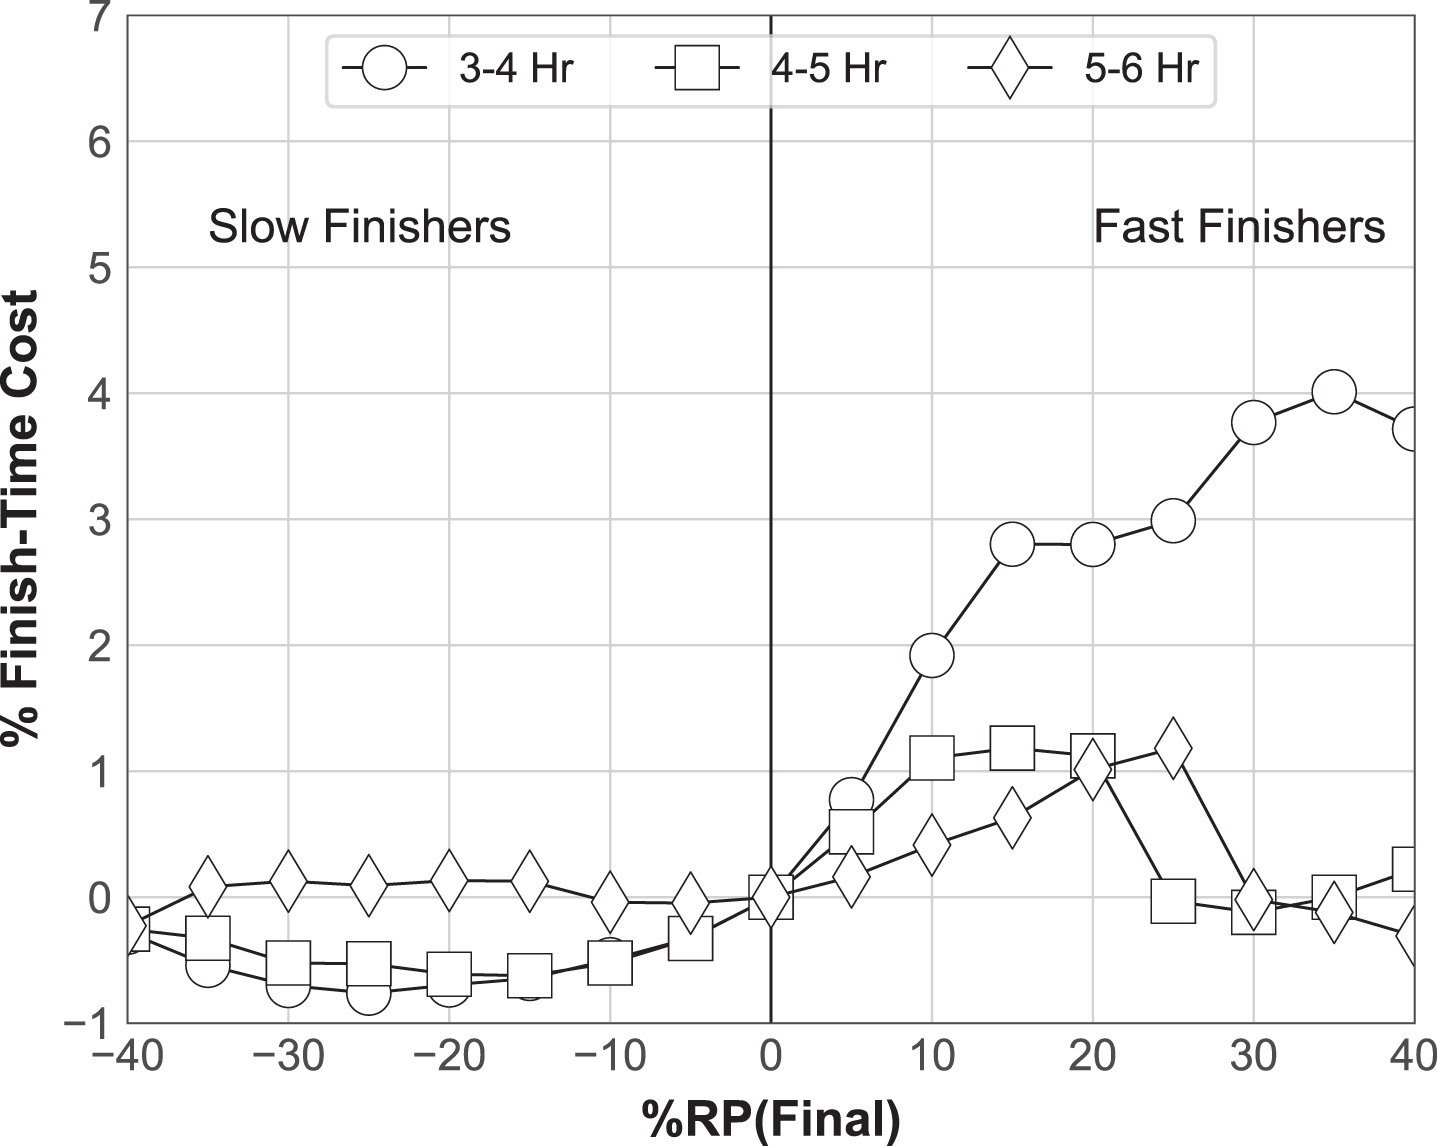
Fig. 10
The percentage finish-time cost (relative to %RP (Final) =0) by different final paces and for ability-based groups.
This time we see quite a different result, compared to that found for pacing at the start of the race (c.f. Fig. 1). First, the finish-time costs associated with slow or fast pacing at the end of the race are less significant, compared to the start of the race. Second, there is a much greater finish-time cost associated with finishing fast (%RP (Final) >0) compared with finishing slowly (%RP (Final) <0), for men and women; a similar, albeit more subtle, effect was seen for the start pace. For example, on average, runners finishing 10% faster than their MRP finish 22 minutes slower than evenly paced finishers, while those finishing 10% slower suffer a more minor finish-time cost. This suggests that the cost of pacing aggressively, and finishing slowly, is less than the cost of pacing too conservatively, and finishing quickly.
In Fig. 10 we can see a similar effect for each of the 3 ability bands used previously. For all 3 cohorts of runners, finishing fast is associated with a finish-time cost, extending finish-times by up to 4% relative to the %RP (Final) =0; faster, 3-4 hour finishers, suffer more than the other bands in this case, and very fast (%RP (Final) >20) 4-5 and 5-6 hour finishers seem to be able to recover in terms of finish-time cost, although these cases are exceedingly rare. The effect of a slow finish is less pronounced for the 3-4 and 4-5 hour finishers, in fact there is a marginal improvement in finish-times, relative to their evenly paced finishes.
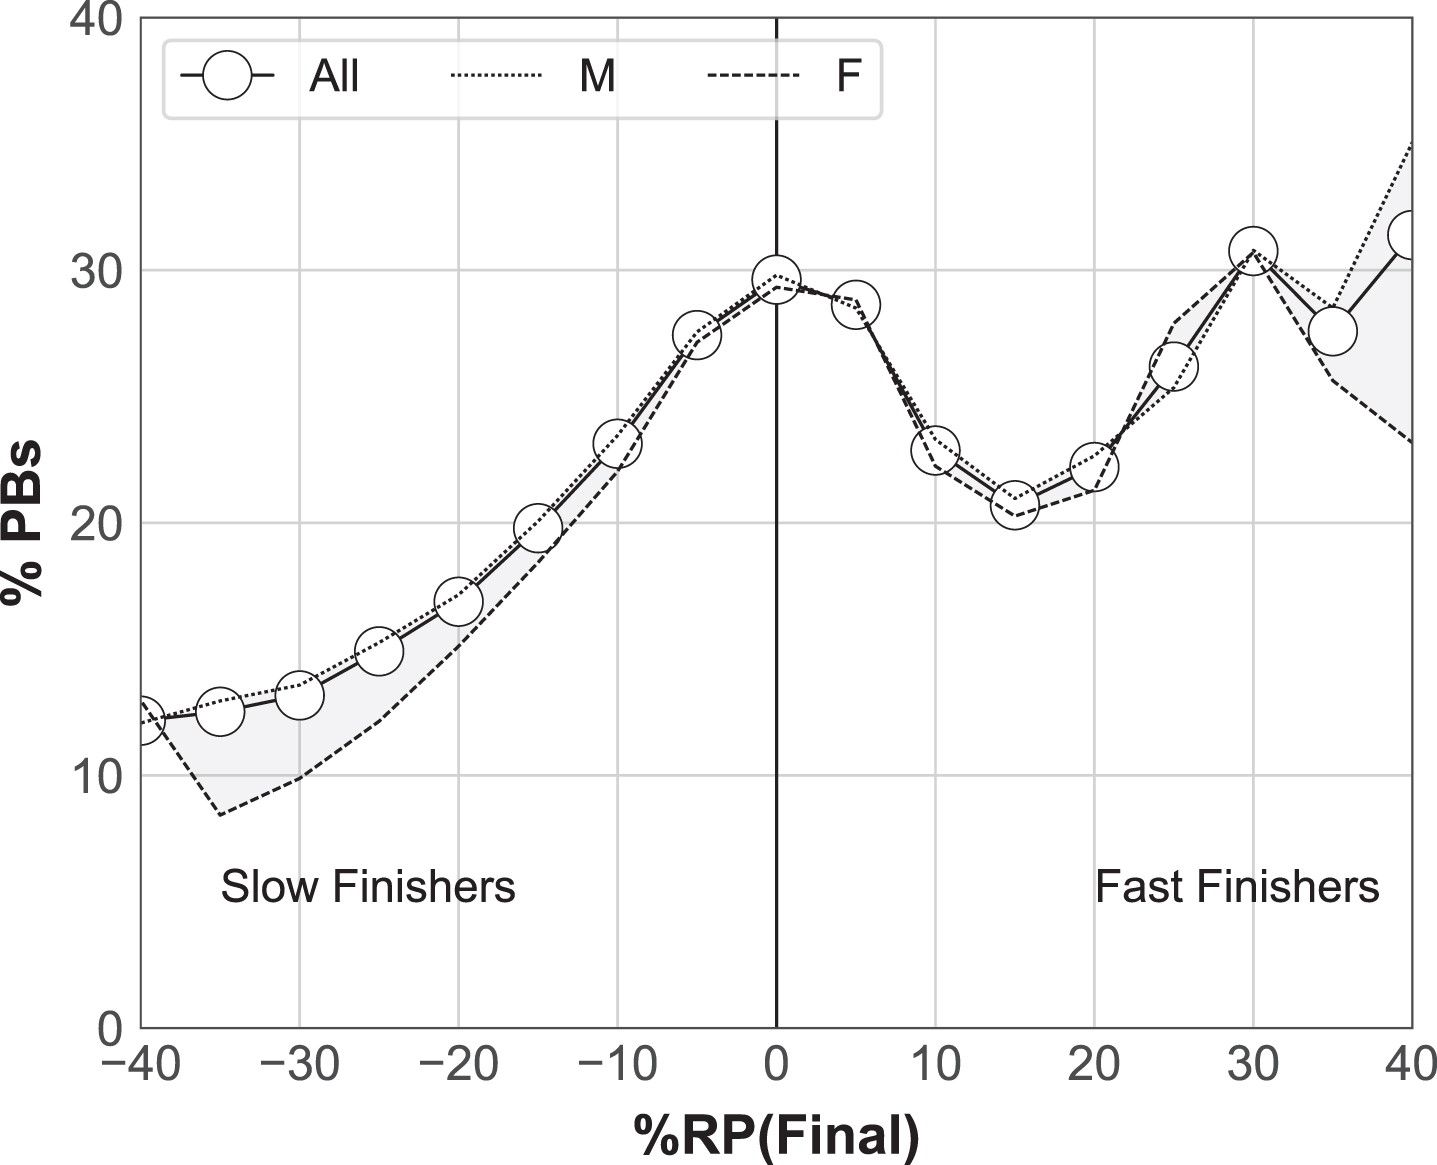
Fig. 11
The percentage of PBs for different final-paces.
This contrasts with recent research among elite athletes, which suggests that tactical mid-race slow-downs and fast finishes do produce improved finish-times (Hanley, 2015). For recreational marathoners at least, the ability to finish fast, whether planned or otherwise, typically comes with a finish-time cost.
5.2.1PBs and final pacing
As before, we can also consider the relationship between pacing at the end of the race and the likelihood that repeat runners will achieve a PB. If fast or slow finishes signal sub-optimal pacing, then we should see a decrease in the percentage of PBs achieved.
Fig. 11 shows the percentage of runners achieving a PB for different values of %RP (Final). The most common final-pace for PBs is, as before, even pacing: whether male or female, 30% of runners who finish at %RP (Final) =0 go on to produce a PB. For increasingly slow finishers, there are fewer and fewer PBs, as was the case with slow starters. But for fast finishers we see a different effect. For moderately fast finishes (0 < % RP (Final) <15) the likelihood of achieving a PB decreases for faster finishes, as before, but for very fast finishes (%RP (Final) >15), the likelihood of a PB increases again; this coincides with a corresponding decrease in finish-time cost in Fig. 9. It turns out that these very fast finishers are associated with more even overall pacing than slower, even, or moderately fast finishers. These very fast finishers run their second half only 2.6% slower than the first half of the race. They appear to be able to finish very fast without pacing too conservatively during the race as a whole. Thus, while finishing moderately fast seems to signal conservative pacing earlier in the race, very fast finishes may be more consistent with good pacing, although not quite as good as those who finish at MRP, because there is still a finish-time cost, especially among faster runners (c.f. Fig. 9).
5.3Discussion
In summary then, there is good evidence to support the proposition that pacing during the final stage of a marathon is a proxy for how well a runner has paced their race overall: finishing slowly may be a sign of overly aggressive pacing, while finishing fast suggests overly cautious pacing. There is a finish-time cost associated with the ability or inability to run a fast finish, and we also see more PBs associated with evenly paced finishes, all of which is consistent with this proposition.
To put this in context, the work of Hubble and Zhao (2016) suggests that men tend to overestimate their marathon ability compared to women, based on a comparison of ex ante and actual finish-times. Our findings suggest that this carries through to race-day, because a greater proportion of (cautious) fast finishers are women, while more men pace aggressively early on, and finish slower. Past research has also highlighted how female marathoners tend to pace more evenly than men (Haney Jr, 2010; Lara et al., 2014; March et al., 2011), citing this as an example of more disciplined pacing among women, but perhaps this more ‘disciplined’ pacing may arise from more cautious pacing.
The data supports the idea that even pacing leads to the best overall finish-times. Moreover, since the finish-time cost of fast finishes is uniformly greater that the cost of slower finishes, this suggests more aggressive pacing may lead to a better finish-time than more cautious pacing. At the very least, this might mean that planning to recoup time with a fast finish, after a cautious race, may be a flawed strategy. By comparison, focusing less on the final segment and more on running a strong and aggressive race early on, leads to better finish-times. Perhaps when runners plan to be cautious they err on the side of being too cautious, and when they plan to run hard they often manage to hang on. This doesn’t mean that finishing slowly, because of an aggressive race, is the best strategy — it still carries a finish-time cost — but it does appear to be better than racing too conservatively.
6Conclusion
In this work we have considered the beginning and the end of the marathon as two unique stages of the race that are revealing about a runner’s performance. Pacing at the start of the race influences overall performance, while pacing at the end of the race reveals how well a runner has paced their effort up to that point.
While sex differences in marathon pacing have been previously reported (de Koning et al., 2011; Hubble and Zhao, 2016), little consideration has been given to pacing during these key parts of the race, and the scale of this analysis further sets it apart from other work. Previous research has mostly considered smaller cohorts of marathoners — elite (Abbiss and Laursen, 2008; Hanley, 2015; xLara et al., 2014; Renfree and St Clair Gibson, 2013) and recreational (Barandun et al., 2012; March et al., 2011; Summers et al., 1982) — or data that has been limited to specific races (Deaner et al., 2014; Santos-Lozano et al., 2014). In contrast, our findings are based on a large-scale analysis of recreational marathoners across multiple races, cities, and years. We make explicit the finish-time costs of uneven pacing at the start and the end of a race, and the specific costs associated with fast starts and fast finishes, in particular. Moreover, while causality can be very difficult to prove, we provide evidence in support of a causal connection between start pace and finish-time. We also uncovered novel aspects of pacing, particularly with respect to the overly cautious pacing of fast finishers, in general, and of some women in particular.
It is worth noting that although these findings are based on the aggregation of race records across dozens of marathons, we have also completed similar analyses on a city-by-city, race-by-race basis. The results confirm the same set of findings for individual cities and races and thus remain robust with respect to differences in course topology, weather conditions, and race popularity.
There are of course many opportunities for further research based on this approach and these results. How do age and marathon experience influence these findings? Are more experienced runners less likely to start fast and more likely to pace their race effectively? Are older runners more or less cautious in their pacing than younger runners? There are some challenges to fully exploring these matters — obtaining fine-grained age information and recognising repeat runners across multiple races, for example — but we do plan to explore these questions in future work.
In this work we have based our analysis of pacing on the relative paces of runners, by comparing their segment paces to their mean race pace. An alternative approach, using race data for repeat runners, would be to compare the segment pace for a runner in a given race to their pace for the same segment across other marathons. In this way we could determine whether a runner is running slower or faster than usual, for them, which may provide a more robust basis for analysis. Once again we will consider this as an interesting opportunity for future work.
We expect these findings to be of value to runners, coaches, and sport scientists. Understanding the finish-time costs of starting too fast, and just how common fast starts are in actual races, will help to focus attention on this key part of the marathon, during training, and on race-day itself. And recognising the potential down-side of a fast finish, or at least the capacity to finish too fast, will help to better calibrate mid-race pacing.
Appendices
Appendix
The following is the list of the urls of the marathons used in this study. At the time of writing, each of these websites provides access to a public results archive from which the data was collected.
1 Amsterdam Marathon — http://www.tcsamsterdammarathon.nl
2 Berlin Marathon — http://www.bmw-berlin-marathon.com
3 Boston Marathon — http://www.baa.org/races/boston-marathon.aspx
4 Chicago Marathon — https://www.chicagomarathon.com
5 Hamburg Marathon — http://www.haspa-marathon-hamburg.de
6 London Marathon — https://www.virginmoneylondonmarathon.com
7 Los Angeles Marathon — http://www.lamarathon.com
8 New York Marathon — http://www.tcsnycmarathon.org
9 Rotterdam Marathon — http://www.nnmarathonrotterdam.org
10 Stockholm Marathon — http://www.stockholmmarathon.se/
11 Tokyo Marathon — http://www.marathon.tokyo
Acknowledgments
Supported by Science Foundation Ireland through the Insight Centre for Data Analytics under grant number SFI/12/RC/2289 and by Accenture Labs, Dublin.
References
1 | Abbiss C.R. and Laursen P.B. , (2008) , Describing and understanding pacing strategies during athletic competition, Sports Medicine 38: (3), 239–252. |
2 | Allen E.J. , Dechow P.M. , Pope D.G. and Wu G. , (2017) , Reference-dependent preferences: Evidence from marathon runners, Management Science 63: (6), 1657–1672. |
3 | Barandun U. , Knechtle B. , Knechtle P. , Klipstein A. , Rüst C.A. , Roann T. and Lepers R. , (2012) , Running speed during training and percent body fat predict race time in recreational male marathoners, Open Access J Sports Med 3: , 51–58 sem. |
4 | Baron B. , Moullan F. , Deruelle F. and Noakes T.D. , (2011) , The role of emotions on pacing strategies and performance in middle and long duration sport events, British Journal of Sports Medicine 45: (6), 511–517. |
5 | Bath D. , Turner L.A. , Bosch A.N. , Tucker R. , Lambert E.V. , Thompson K.G. and Gibson A.S.C. , (2012) , The effect of a second runner on pacing strategy and rpe during a running time trial, International Journal of Sports Physiology and Performance 7: (1), 26–32. |
6 | Buman M.P. , Brewer B.W. , Cornelius A.E. , Raalte J.L.V. , and Petitpas A.J. , (2008) a, Hitting the wall in the marathon: Phenomenological characteristics and associations with expectancy, gender, and running history, Psychology of Sport and Exercise 9: (2), 177–190. |
7 | Buman M.P. , Omli J.W. , Giacobbi P.R. Jr. , and Brewer B.W. , (2008) b, Experiences and coping responses of “hitting the wall” for recreational marathon runners, Journal of Applied Sport Psychology 20: (3), 282–300. |
8 | Buman M.P. , Brewer B.W. and Cornelius A.E. , (2009) , A discrete-time hazard model of hitting the wall in recreational marathon runners, Psychology of Sport and Exercise 10: (6), 662–666. |
9 | de Koning J.J. , Foster C. , Bakkum A. , Kloppenburg S. , Thiel C. , Joseph T. , Cohen J. and Porcari J.P. , (2011) , Regulation of pacing strategy during athletic competition, PLoS One 6: (1), 1–6. |
10 | Deaner R.O. , (2006) , More males run fast: A stable sex difference in competitiveness in us distance runners, Evolution and Human Behavior 27: (1), 63–84. |
11 | Deaner R.O. , Carter R.E. , Joyner M.J. and Hunter S.K. , (2014) , Men are more likely than women to slow in the marathon, Medicine and Science in Sports and Exercise 4: (3), 607–616. |
12 | Del Coso J. , Fernández D. , Abián-Vicen J. , Salinero J.J. , González-Millán C. , Areces F. , Ruiz D. , Gallo C. , Calleja-González J. and Perez-González B. , (2013) , Running pace decrease during a marathon is positively related to blood markers of muscle damage, PLoS One 8: (2), 1–7. |
13 | Denison J. , (2007) , Perspectives on coaching pace skill in distance running: A commentary, International Journal of Sports Science & Coaching 2: (3), 217–238. |
14 | Esteve-Lanao J. , Larumbe-Zabala E. , Dabab A. , Alcocer-Gamboa A. and Ahumada F. , (2014) , Running world cross-country championships: A unique model for pacing, Int J Sports Physiol Perform 9: (6), 1000–1005. |
15 | Gosztyla A.E. , Edwards D.G. , Quinn T.J. and Kenefick R.W. , (2006) , The impact of different pacing strategies on five-kilometer running time trial performance, Strength & Conditioning Research 20: (4), 882–886. |
16 | Haney T.A. Jr. , (2010) , Variability of pacing in marathon distance running. PhD thesis, University of Nevada, Las Vegas, (2010) . |
17 | Hanley B. , (2013) , An analysis of pacing profiles of world-class racewalkers, Int J Sports Physiol Perform 8: (4), 435–441. |
18 | Hanley B. , (2016) , Pacing, packing and sex-based differences in olympic and iaaf world championship marathons, Journal of Sports Sciences 34: (17), 1675–1681. |
19 | Hill A.B. , (1965) , The environment and disease: Association or causation?, Pro-ceedings of the Royal Society of Medicine 58: (5), 295–300. |
20 | Hubble C. and Zhao J. , (2016) , Gender differences in marathon pacing and performance prediction, Journal of Sports Analytics 2: (1), 1–18. |
21 | Lara B. , Salinero J.J. and Del Coso J. , (2014) , The relationship between age and running time in elite marathoners is u-shaped, Age 36: (2), 1003–1008. |
22 | March D.S. , Vanderburgh P.M. , Titlebaum P.J. and Hoops M.L. , (2011) , Age, sex, and finish time as determinants of pacing in the marathon, The Journal of Strength & Conditioning Research 25: (2), 386–391. |
23 | Morgan W.P. , (1978) , The mind of the marathoner, Psychology Today 11: (11), 38–49. |
24 | Morgan W.P. and Pollock M.L. , (1977) , Psychologic characterization of the elite distance runner, Annals of the New York Academy of Sciences 301: (1), 382–403. |
25 | Rapoport B.I. , (2010) , Metabolic factors limiting performance in marathon runners, PLoS Computational Biology 6: (10), 1–13. |
26 | Renfree A. and St Clair Gibson A. , (2013) , Influence of different performance levels on pacing strategy during the female world championship marathon race, International Journal of Sports Physiology and Performance 8: (3), 279–285. |
27 | Santos-Lozano A. , Collado P. , Foster C. , Lucia A. and Garatachea N. , (2014) , Influence of sex and level on marathon pacing strategy. insights from the city race, International Journal of Sports Medicine 35: (11), 933–938 new york. |
28 | Stevinson C.D. and Biddle S.J. , (1998) , Cognitive orientations in marathon running and “hitting the wall”, British Journal of Sports Medicine 32: (3), 229–234. |
29 | Summers J.J. , Sargent G.I. , Levey A.J. and Murray K.D. , (1982) , Middle-aged, non-elite marathon runners: A profile, Perceptual and Motor Skills 54: (3), 963–969. |
30 | Tatem A.J. , Guerra C.A. , Atkinson P.M. and Hay S.I. , (2004) , Momentous sprint at the 2156 olympics?, Nature 431: , 525. |
31 | Trubee N.W. , (2011) , The Effects of Age, Sex, Heat Stress, and Finish Time on Pacing in the Marathon. PhD thesis, University of Dayton, 2011. |
32 | Tucker R. , Lambert M.I. and Noakes T.D. , (2006) , An analysis of pacing strategies during men’s world-record performances in track athletics, International Journal of Sports Physiology and Performance 1: (3), 233. |
33 | Welch B.L. , (1947) , The generalization of ‘student’s’ problem when several different population variances are involved, Biometrika 34: (1/2), 28–35. |


