
Using agronomic data to minimize the impact of field conditions on player injuries and enhance the development of a risk management plan
Abstract
An important aspect of facility management is the development of a comprehensive risk management plan. Player safety has only recently been a consideration when developing a risk management plan. Field conditions have not received much attention as it relates to player safety. Several injuries at Optus Stadium in Perth, Australia raised questions about the playing surface being the cause. The purpose of this study was to determine the ability of established athletic field agronomic measures to predict injuries from football fields and soccer pitches. Logistic regression was used to predict injury based upon soil compaction, soil moisture, surface firmness, and turfgrass quality. Results indicate that athletic fields that met good standards had the lowest probability of injury and injury probability is the highest when field conditions are considered poor. These results provide parameters facility and athletic field managers can use to determine whether an athletic field demonstrates a low risk of injury, needs to be improved, or a game should be canceled.
When managing all levels of events, it is important to include a risk management plan to mitigate potential liabilities. One definition of risk management is a proactive process involving an assessment of all possible risks associated with an event and anticipating, preventing, minimizing, and planning responses to mitigate said risks (Leopkey & Parent, 2009). Consequently, facility managers will develop a risk management plan to mitigate any existing and potential risks. Part of this risk management plan should involve ways to limit the possibility of spectator injury, which would include putting warnings on the back of tickets or posting signs around the facility warning of specific dangers. While facility managers correctly are concerned with spectator safety, this same danger of injury extends to the players as well. There have been many recent moves to protect players from injuries (e.g., addressing concussion concerns within football), but there has been minimal focus on the role of field conditions as it relates to player safety, especially when it comes to natural grass fields. What needs further examination is the role field conditions play as it relates to player safety and how the league and facility managers can use that information to make decisions related to playing, postponing to later in the day, or canceling games.
1Risk management
Facility managers must have a risk management plan in place to meet the minimum duty of care afforded to spectators, participants, officials, and employees when they enter a stadium or arena for an event. One theoretical approach to developing a risk management plan is the DIM process (Ammon, 2017). The DIM process can be applied in a variety of contexts. According to Ammon et al. (2016), “facility managers at ice rinks, convention centers, municipal golf courses, minor league baseball parks, and international stadiums would use the same fundamental concepts” (p. 184). Using this process, facility managers must follow these steps: (1) develop the risk management plan, (2) implement the risk management plan, and (3) manage the risk management plan.
1.1Developing the risk management plan
To develop a risk management plan, facility managers must follow three steps (Ammon, 2017). First, it is necessary to identify the various risks to which spectators, participants, officials, and employees will be exposed. One of the many ways to identify risks is to employ a knowledgeable staff who can identify risks associated with any events to be held at a facility (e.g., security for crowd control). Since no single individual can identify risks across all areas that must be addressed, this study focused on methods athletic field managers could use to assess risk of injury due to the field conditions. Second, facility managers must classify the risks that have been identified. These risks are often classified by frequency and severity. Frequency is classified as “high”, “medium”, or “seldom”, while severity is classified as “catastrophic”, “critical”, “moderate”, or “low” (Ammon et al., 2016). Finally, facility managers must determine a treatment for each of the risks identified and classified.
1.2Implementing the risk management plan
The second step in the DIM process is to implement the risk management plan (Ammon, 2017). During this step, facility managers communicate the expectations related to risk management to all employees. To successfully implement the risk management plan, it is best if the facility manager involves the employees in the development of the plan to instill shared responsibility in the employees (Ammon et al., 2016). Moreover, involving the employees in the development is beneficial in fully exploring and identifying all potential risks during the first step of the process.
1.3Managing the risk management plan
The final step in the DIM process is to manage the risk management plan (Ammon, 2017). Facility managers may select a specific individual responsible for managing certain aspects of the risk management plan. If there are too many responsibilities for one person to handle, then facility managers could split the responsibilities among multiple people (Ammon et al., 2016). When it comes to the athletic field, there is an athletic field manager who is responsible for maintaining the turfgrass. This individual is best equipped to manage the risk management plan as it relates to the field.
2Player safety
One aspect of a risk management plan, especially in contact sports like football and hockey, is how an organization or facility manager will address player safety. One high profile aspect of player safety has been the NFL’s response to concussions. Henize and Lu (2017) found that the pressure the NFL received from disruptive events, independent researchers, and the media has led to the league being more proactive in addressing concussions and chronic traumatic encephalopathy (CTE) in current and former players.
While concussions/CTE is an enormous player safety concern within contact sports such as football, the probability of injuries can play a role in the decision-making process when determining to conduct or cancel a game. One example of a game cancelled due to the increased risk of injuries related to field conditions was the 2016 Hall of Fame Game scheduled between the Indianapolis Colts and Green Bay Packers (Rosenthal, 2016). While this decision was an inconvenience to fans who were traveling to the game (Epstein, 2016), player safety should be of the utmost importance when considering to play, postpone, or cancel a game. More recently, injuries sustained at Optus Stadium in Perth, Australia were thought to be a result of the playing surface, resulting in West Coast coach Adam Simpson contemplating no longer training on the field in 2019 (Chadwick, 2019). Understanding the cause of these injuries would be beneficial to facility and athletic field managers as they determine the appropriate action to take regarding field preparation.
2.1Injuries
There is a variety of methods of assessing injuries: prevalence, incidence, and incidence proportion (Knowles et al., 2006). Prevalence refers to the proportion of an athletic team who is injured at a given time. Incidence refers to new injury occurrences during a specified time (usually one season). Incidence proportion refers to the proportion of athletes who have at least one injury during a specified time (usually one season). To determine the probability of an athlete getting injured given specific field conditions, this study is focusing on the incidence of new injuries during individual games. One set of injuries in particular that can be related to field conditions are head injuries. A study conducted on natural grass athletic fields provided evidence that the incidence of head injuries may be lowered by managing the soil water content of athletic fields (Dickson et al., 2018). In another study, field-related injuries occurred primarily as a result of shoe-surface traction. Orchard (2002) found that shoe-surface traction was correlated with ground hardness, dryness, grass coverage/root density, length of cleats, and relative speed of the game. Considering this study is focusing on all injuries possibly related to field conditions, injuries will be categorized by type to identify which injuries come from field conditions and which injuries come from other means (such as helmet-to-helmet hits). Injuries unrelated to field conditions will be eliminated from analysis.
2.2Field conditions
Petrass et al. (2016) identified relevant, subjective data related to field conditions that could cause injuries: surface evenness, grass coverage, shock absorbency, grip, and hazards. Surface hardness affects the player’s ability to turn sharply and along with soil compaction increases athlete injury to falls and tackles to the ground. Poor traction (grip) either a lack of turfgrass coverage or drainage (slickness) can lead to muscle pulls and a variety of other injuries. These descriptive measures are included in current maintenance checklists utilized to determine field and facility safety, which addresses the first step in the development of a risk management plan; identifying potential risks. One current sports field safety and maintenance checklist visually evaluates the evenness and traction of the playing surface for natural grass by visually assessing turfgrass coverage and uniformity (Schlotthauer, 2017). Also, this checklist evaluates facility conditions, like fencing, seating/bleachers, transition areas (i.e., distance from sidelines to fencing), and other general facility conditions.
Agronomic data related to surface properties of the turf and soil need to be added to these current checklists to improve overall field conditions and player safety. Turfgrass quality, surface hardness, soil moisture, and soil compaction are essential to determining field conditions before games (Carrow et al., 2010; McAuliffe, 2008). Turfgrass quality measurements reflect overall turfgrass and ground conditions. Turfgrass quality includes both visual and functional components that factor in turfgrass uniformity (surface evenness) and density (grass coverage). A turfgrass quality rating below 0.6 (or 6 on a 1–9 visual scale) indicates poor field conditions in regard to playability and can pose potential hazards to athletes. Many researchers have even developed standards for each of these surface properties to improve field playability to decrease player injuries (Bartlett et al., 2009; Canaway et al., 1990; Holmes & Bell, 1986; Jennings-Temple et al., 2006; McClements & Baker, 1994).
Agronomic data can easily be measured on the field using hand-held meters or devices. Furthermore, the data generated from grid sampling produces surface maps of the field to determine variability in turf and soil properties (Straw et al., 2016; Straw, Samson et al., 2018). This technology can aid athletic field managers in pinpointing problem areas on the field that need to be addressed before games to protect athletes from injury due to field conditions. Cultivating a healthy turfgrass system that is resistant to traffic and wear from sports is essential for facility and athletic field managers to produce optimal field conditions that ultimately protect players from injury.
3Purpose and hypothesis
The purpose of this study was to determine the efficacy of using agronomic data as a means of calculating the probability of player injury on a university soccer and football field. Specifically, can agronomic data predict player injury, depending upon sport played? Furthermore, can agronomic data be utilized to determine the frequency classification of injury risks into high, medium, or seldom risk within each sport? The agronomic measures assessed are soil compaction, soil moisture, surface firmness, and turfgrass quality. The null hypothesis of this study that all of the regression coefficients for all of these predictor variables (sport and agronomic measures) are zero: H0 : = β1 = β2 = β3 = β4 = β5 = 0 .
4Methodology
Before data collection commenced, the Institutional Review Board (IRB) reviewed this study and found it exempt from full board review. Two sets of data were collected and analyzed over two years (2017 and 2018 seasons). First, agronomic field data related to soil compaction, soil firmness, soil moisture, and turfgrass quality was collected to quantify certain aspects of the field conditions. An agronomist with a Doctor of Philosophy in Agronomy (specializing in turfgrass and soil science) was responsible for collecting the agronomic data. Second, the athletic trainers provided aggregated injury data they deemed to be a result of the field conditions. The head athletic trainer was responsible for maintaining the integrity and accuracy of injury data.
4.1Teams assessed
Data related to the women’s soccer and men’s football teams at a Midwestern university were collected over two years (2017 and 2018) before each home game. To determine the probability of an individual student-athlete being injured during a game, all of the eligible players who dressed out for each game during their respective seasons were included in the study. Since field conditions can vary in different athletic fields (and considering the soccer field underwent a recent renovation), the type of field (soccer or football) was included as a predictor in the logistic regression. While there were only two fields within this study, recommended field characteristics, such as soil moisture can vary depending upon the soil type. The two fields examined within this study are the same soil type. Including other fields from different locations within this study would create difficulty in determining the predictive value of the agronomic measures collected because different soil types would have different optimal agronomic measures (especially concerning soil moisture). Table 1 depicts the number of student-athletes on the soccer and football teams each season of the study.
Table 1
Number of Student-Athletes on each Team and Number of Home Games, by Season
| n of Student-athletes | n of Home Games | |
| 2017 Season | ||
| Women’s Soccer | 23 | 5 |
| Football | 77 | 5 |
| 2018 Season | ||
| Women’s Soccer | 23 | 7 |
| Football | 83 | 5 |
4.2Agronomic data
Traffic and wear patterns on athletic fields vary, depending upon the sport played. For example, the traffic pattern on a soccer field is more variable than on a football field (where the middle of the field sees the most wear). One area on a soccer field that can receive more wear is the goal areas on each end of the field. To collect athletic field agronomic data, each field was separated into equal size plots to get the best representation of soil compaction, soil moisture, surface firmness, and turfgrass quality at each data collection point. This resulted in 26 plots (24 plots of the playing field and 2 goal areas) on the soccer field and 30 plots (10-yard increments separated into thirds by the hash marks) on the football field. To get a proper representation of each plot, six samples were randomly collected throughout each plot and averaged for each measure.
A FieldScout SC 900 meter (Plainfield, IL) was utilized to assess soil compaction by measuring pounds per square inch (psi) of penetration resistance within the top four inches of the soil. Compaction readings above 300 psi mean the soil is compacted. A FieldScout TDR 300 (at a depth of 4 inches) was utilized to assess soil moisture by measuring volumetric water content (VWC) of the soil through time domain reflectometry (TDR). Acceptable VWC varies depending upon the soil texture of the athletic field. Both fields are a silty clay loam soil texture, which means an acceptable VWC is between 18% and 40%. Turfgrass with VWC below 18% is too dry and begins to wilt (which could lead to poor turfgrass quality) and above 40% is too wet or saturated (which could lead to slipping if too high). A FieldScout TruFirm was utilized to assess surface firmness. The plunger is dropped from a consistent height and will penetrate the surface in a range from 0 to 1.5 inches. Turfgrass registering anything below 0.5 inches is considered too firm. A FieldScout CM 1000 Normalized Difference Vegetative Index (NDVI) meter was utilized to assess turfgrass quality, ranging from –1 to 1 (where 0.1 = bare soil, 0.6 = minimally acceptable turf, 0.9 = optimum turf). Turfgrass quality is a measure of both visual and functional components related to the turf and ground conditions. Specifically, turfgrass quality includes uniformity (surface evenness) and density (turfgrass coverage). When the turfgrass quality value is closer to one, the turfgrass and ground conditions are optimum for field playability. Whereas a turfgrass quality value closer to negative one, indicates poor field conditions in regards to overall playability and can pose potential hazards to athletes.
The day before home games for both soccer and football, agronomic data was collected and downloaded into an Excel spreadsheet to ensure data was reported accurately. During the 2018 soccer season, home games were played on a Friday and Sunday on the weekend for the first six home games. Since there was not enough time to collect data before both games on the weekend, agronomic data was utilized for both games (with injury data aggregated over the weekend). Soil compaction was higher in the goal areas than in other areas of the field. The other agronomic measures did not vary greatly across the different areas of the field. Table 2 depicts the mean and standard error for each third of the soccer field and each goal area across all home games for both seasons.
Table 2
Mean Soil Compaction, Soil Moisture, Surface Firmness, and Turfgrass Quality for the Soccer Field by Area of the Field
| West Side | Midfield | East Side | North Goal | South Goal | ||||||
| M | SE | M | SE | M | SE | M | SE | M | SE | |
| Soil Compactiona | 164.37 | 3.17 | 160.75 | 2.71 | 154.41 | 2.81 | 211.67 | 4.20 | 178.52 | 5.00 |
| Soil Moistureb | 61.03 | 0.59 | 63.29 | 0.59 | 62.12 | 0.55 | 61.76 | 0.64 | 62.99 | 0.76 |
| Surface Firmnessc | 0.56 | 0.00 | 0.55 | 0.00 | 0.57 | 0.00 | 0.52 | 0.01 | 0.50 | 0.01 |
| Turfgrass Qualityd | 0.84 | 0.01 | 0.84 | 0.01 | 0.86 | 0.00 | 0.84 | 0.01 | 0.78 | 0.01 |
Note. apounds per square inch (psi). bvolumetric water content (VWC). cinches. dNormalized Difference Vegetation Index (NDVI).
There was more variation in conditions across the football field when compared to the soccer field. Soil compaction across the middle third of the field was higher than the other two thirds of the field. Soil moisture was slightly lower in the middle third of the field when compared to the outer thirds of the field. The other agronomic measures were similar across the different areas of the field. Table 3 depicts the mean and standard error for each third of the football field across all home games for both seasons.
Table 3
Mean Soil Compaction, Soil Moisture, Surface Firmness, and Turfgrass Quality for the Football Field by Area of the Field
| South Side | Midfield | North Side | ||||
| M | SE | M | SE | M | SE | |
| Soil Compactiona | 197.13 | 3.01 | 209.51 | 3.23 | 190.58 | 3.17 |
| Soil Moistureb | 65.22 | 0.47 | 59.69 | 0.41 | 63.53 | 0.44 |
| Surface Firmnessc | 0.54 | 0.00 | 0.55 | 0.01 | 0.57 | 0.01 |
| Turfgrass Qualityd | 0.89 | 0.00 | 0.87 | 0.00 | 0.89 | 0.00 |
Note. apounds per square inch (psi). bvolumetric water content (VWC). cinches. dNormalized Difference Vegetation Index (NDVI).
4.3Injury data
To assess injury incidence, the head athletic trainer provided aggregated injury data related to field conditions. The head athletic trainer responsible for collecting this data was the Assistant Athletic Director for Sports Medicine and Health Care Administrator with a Masters of Science in Athletic Training. He has served in this role for the past eight years and is specifically responsible for treating football and soccer student-athletes. In order to make sure data was reported accurately, it was essential to specifically identify the types of injuries to be reported during a training session with the head athletic trainer and two other trainers who may have had to make a mechanism of injury determination. The head athletic trainer was the only trainer to treat the student-athletes observed within the study. Therefore, rater reliability was not compromised within this study.
The head athletic trainer provided a list of injuries and how many occurrences of each injury after each home game. No athlete identifying information was provided to ensure student-athlete confidentiality. The trainer only reported injuries attributable to field conditions in real-time. Specifically, he only reported non-contact injuries (e.g., slipping and twisting an ankle or hitting head on the ground causing a concussion) that were a result of the field and not due to some other factor. Other injuries that occurred as a result of other related factors (e.g., head-to-head contact causing a concussion or a player rolling up another player’s ankle) were excluded from the analysis. If there was any doubt as to the source of the injury (i.e., field conditions or some other factor), the injury was not included in the analysis. Over two years, there were 2,936 possible instances where a player could suffer an injury. Examples of injuries included shin splints, knee sprains, ankle sprains, and concussions. A dummy variable was created identifying a player as either being injured (1) or not being injured (0) for each home game. To prevent inconsistency in collecting injury data from different athletic trainers, visiting teams’ injury data was also excluded from the analysis.
4.4Data analysis
For the multivariate logistic regression, injury data were entered into an Excel spreadsheet along with the corresponding agronomic data and the date of the game. All data was then transferred over to Minitab version 19 as well as SPSS version 25 for analysis. Any missing agronomic data was estimated. On dates where agronomic data was not collected, field data from the previous game was used. This was appropriate because agronomic conditions of the field would be either similar to the most recent game or worse (especially related to compaction and firmness from increased traffic). To test the hypothesis, multivariate logistic regression was utilized as opposed to linear regression for a multitude of reasons. First, the only observations when injury probability was assessed were injured (1) or not injured (0). Using a linear model will result in predicted probabilities outside of this range (0-1). Second, the assumption of independence between the predictors and the error term necessary for linear regression is violated when a binary dependent variable is utilized. Finally, the error term in linear regression is heteroskedastic because of the nonconstant variance of the errors across the different combinations of predictors (DeMaris, 1995). Each player within each game was treated as an independent observation to appropriately use a multivariate logistic regression. In addition, it was essential to account for variance in field conditions during each game. As mentioned earlier, the soccer field was separated into 26 plots and the football field was separated into 30 plots. Since it is difficult to pinpoint precisely where an injury occurred on the field (e.g., an injury may occur at a different point on the field as compared to where the player went down), the injury data for each player was assessed across all plots for each game. By analyzing the data in this manner, field conditions for all plots were included in the analysis instead of using average field conditions for each game. Players who were injured due to field-related conditions were only counted if the injury occurred during the observed games. Equation 1 depicts the construction of the multivariate logistic regression utilized to estimate the probability (Y) of a student-athlete (soccer or football) being injured as predicted by athletic field (X1), soil compaction (X2), surface firmness (X3), soil moisture (X4), and turfgrass quality (X5). The multivariate logistic regression was conducted using both Minitab version 19 and SPSS version 25 to calculate all of the appropriate statistics.
(1)
5Results
Agronomic data for the athletic fields was first reviewed by comparing the data collected before each game with the player injury data for the game and presenting them together within Tables 4 through 7. Since agronomic data were collected across all areas of the field, soil compaction, soil moisture, surface firmness, and turfgrass quality were aggregated in an appropriate way to compare them to the player injuries that occurred during the game. For this initial review of the data, soil compaction (0 to 450 psi) across all areas of both fields is presented as a percent of the field above 300 psi, with more than 75% of the field above 300 psi indicating severe compaction. Soil moisture (0 to 100% volumetric water content) is presented as a percent of the field with volumetric water content over 40%. Surface firmness is presented as a range of firmness across the field, with lower values indicating firmer areas of the field. Turfgrass quality (–1 to 1) was averaged across the entire field, with values closer to 1 indicating better turfgrass quality.
5.1Game-by-game women’s soccer data
Soccer data was collected over two seasons before (agronomic measures) and after (injuries) each home game. The soccer data from the 2017 season resulted in four sets of agronomic measures and injury data across five home games. There was very little soil compaction and surface firmness did get worse throughout the season. Turfgrass quality also was progressively worse as the season went along. Table 4 depicts the agronomic and injury data for the 2017 soccer home games.
Table 4
Pre-game Agronomic and Post-game Injury Data – Soccer 2017 Home Games
| Field Assessment | Game 1 | Game 2 | Game 3 | Game 4 | Game 5 |
| Soil Compactiona | 4% | 0% | 0% | 0% | 0% |
| Soil Moistureb | 96% | 100% | 100% | 100% | 100% |
| Surface Firmness | 0.6–0.7 in | 0.6–0.7 in | 0.5–0.6 in | 0.5–0.6 in | 0.4–0.5 in |
| Turfgrass Quality | 0.91 | 0.90 | 0.92 | 0.90 | 0.85 |
| # of Injuries | 3 | 0 | 0 | 1 | 2 |
Note. apercentage of the field above 300 psi. bpercentage of the field above 40% VWC.
The soccer data for the 2018 home games resulted in four sets of agronomic and injury data across seven home games. There was no soil compaction observed, but the field was starting to exhibit some surface firmness (0.5 inches). Turfgrass quality became progressively worse during the season. One interesting item to note is no agronomic data was collected before games five and six because snow removal after a large winter storm was not complete in time for agronomic data to be collected. Injury data was still collected and analyzed, using the previous weekend’s agronomic data because conditions would at best remain the same and at worst further deteriorate. Table 5 depicts the agronomic and injury data for the 2018 soccer home games.
Table 5
Pre-game Agronomic and Post-game Injury Data – Soccer 2018 Home Games
| Field Assessment | Games 1 & 2 | Games 3 & 4 | Games 5 & 6 | Game 7 |
| Soil Compactiona | 0% | 0% | ND | 0% |
| Soil Moistureb | 100% | 100% | ND | 100% |
| Surface Firmness | 0.5–0.7 in | 0.5–0.7 in | ND | 0.5–0.6 in |
| Turfgrass Quality | 0.93 | 0.89 | ND | 0.66 |
| # of Injuries | 2 | 1 | 4 | 1 |
Note. apercentage of the field above 300 psi. bpercentage of the field above 40% VWC. ND = No data was collected prior to that weekend’s games due to the timing of snow removal.
5.2Game-by-game football data
As with soccer, football data was collected over two seasons before (agronomic measures) and after (injuries) all home games. Football data from the 2017 season resulted in four sets of agronomic measures and injury data across five home games. The football field was severely compacted for games one and four, but no compaction the other games. Game four was also noticeably firm compared to all other games. Turfgrass quality was consistent but was the worst for the last home game. Table 6 depicts the agronomic and injury data for all 2017 home games.
Table 6
Pre-game Agronomic and Post-game Injury Data – Football 2017 Home Games
| Field Assessment | Game 1 | Game 2 | Game 3 | Game 4 | Game 5 |
| Soil Compactiona | 77% | 0% | 0% | 90% | 0% |
| Soil Moistureb | 77% | 100% | 100% | 100% | 100% |
| Surface Firmness | ND | 0.6–0.8 in | 0.5–0.7 in | 0.3–0.4 in | 0.5–0.6 in |
| Turfgrass Quality | 0.90 | 0.90 | 0.92 | 0.90 | 0.85 |
| # of Injuries | 2 | 2 | 0 | 4 | 2 |
Note. apercentage of the field above 300 psi. bpercentage of the field above 40% VWC. ND = No data was collected before that weekend’s game due to no equipment.
Football data from the 2018 season resulted in four sets of agronomic measures and injury data across five home games. The field was not compacted, but was firm for game four. Turfgrass quality was worse late in the season. Table 7 depicts the agronomic and injury data for all 2018 home games.
Table 7
Pre-game Agronomic and Post-game Injury Data – Football 2018 Home Games
| Field Assessment | Game 1 | Game 2 | Game 3 | Game 4 | Game 5 |
| Soil Compaction | 0% | 0% | ND | 0% | ND |
| Soil Moisture | 100% | 100% | ND | 100% | ND |
| Surface Firmness | 0.6–0.9 in | 0.5–0.7 in | ND | 0.4–0.5 in | ND |
| Turfgrass Quality | 0.91 | 0.92 | ND | 0.78 | ND |
| # of Injuries | 0 | 0 | 1 | 1 | 1 |
Note. apercentage of the field above 300 psi. bpercentage of the field above 40% VWC. ND = No data was collected prior to that weekend’s game due to weather.
5.3Multivariate analysis to predict injury
There were 23 soccer players each season with a total of six field-related injuries across five home games in 2017 and a total of eight field-related injuries across seven home games in 2018. There were 77 and 83 football players in 2017 and 2018 respectively, with 10 field-related injuries across five home games in 2017 and 3 field-related injuries across five home games in 2018. The first set of analyses were four separate univariate logistic regressions to determine the relationship among the athletic field, injury, and soil compaction, soil moisture, surface firmness, and turfgrass quality. Each analysis demonstrated that, individually, soil compaction, soil moisture, surface firmness, and turfgrass quality predict the probability of injury. For the multivariate logistic regression analysis, the incidence of injuries after the game was compared to the pre-game agronomic data to determine if athletic field, soil compaction, soil moisture, surface firmness, and turfgrass quality were predictors of player injury.
The overall evaluation of the model was determined by the likelihood ratio test and the Wald test. Both tests were significant, indicating that the logistic model was more effective in predicting player injury than the null model, thus rejecting the null hypothesis. A goodness-of-fit test was also conducted to determine if the logistic model fit the outcomes within the data. The Hosmer & Lemeshow goodness of fit test resulted in a χ2(8) = 6.03 and was insignificant and suggested the logistic model fit the data well. The significance of each predictor in the model was calculated using a Wald’s χ2 statistic. Sport (athletic field), soil moisture, and turfgrass quality were significant predictors. The variance inflation factor for each predictor was below 10, indicating that multicollinearity was not an issue (Belsley et al., 1980). Table 8 depicts the results of the overall model evaluations, the goodness-of-fit test, and the significance of each predictor.
Table 8
Multivariate Logistic Regression Analysis of Injuries as a Function of Field Agronomic Properties and Sport
| Predictor | β | SE β | Wald’s χ2 | df | p | e β (odds ratio) | VIF |
| Constant | –0.270 | 1.670 | 0.49 | 1 | 0.483 | NA | NA |
| Compaction | 0.004 | 0.003 | 1.61 | 1 | 0.205 | 1.004 | 5.50 |
| Moisture | –0.036 | 0.016 | 4.88 | 1 | 0.027 | 0.964 | 2.90 |
| Firmness | 1.312 | 1.430 | 0.84 | 1 | 0.360 | 3.715 | 2.24 |
| Turfgrass Quality | –3.527 | 1.100 | 10.23 | 1 | 0.001 | 0.029 | 1.97 |
| Sport (1 = Soccer, 0 = Football) | 1.395 | 0.238 | 34.47 | 1 | 0.000 | 4.037 | 1.22 |
| Test | χ2 | df | p | ||||
| Overall model evaluation | |||||||
| Likelihood ratio test | 80.31 | 5 | 0.000 | ||||
| Wald test | 72.07 | 5 | 0.000 | ||||
| Goodness–of–fit test | |||||||
| Hosmer &Lemeshow | 6.03 | 8 | 0.644 |
Note. Cox and Snell R2= 0.027. Nagelkerke R2 (Max rescaled R2) = 0.102. Kendall’s Tau–α= 0.03. Goodman–Kruskal Gamma = 0.49. Somers’s Dxy = 0.48. c–statistic = 73.1%. NA = not applicable. VIF = Variance Inflation Factor.
Since the multivariate logistic regression model demonstrated a good fit, all predictors were kept in the final model. The resulting coefficients provide a way to validate the predicted probability of a player being injured, given the athletic field on which they played, soil compaction, soil moisture, surface firmness, and turfgrass quality and were calculated using Equation 2. Because there was a significant difference in the probability of player injury due to the athletic field, each sport utilized a different constant. The probability that a soccer player or a football player would suffer an injury was calculated using Equations 3 and 4, respectively.
(2)
(3)
(4)
To classify player injury risk as a part of a risk management plan, examples of possible field conditions were input into the logistic regression models to calculate the probability of injury given specific field conditions. The frequency of injury was the only classification factor observed, as there was not enough variability among the injury severity to classify severity. Typical frequency classifications of risk include high, medium, and seldom. Therefore, a high risk of injury was associated with poor field conditions, fair field conditions were associated with a medium risk of injury, and seldom risk of injury was associated with good field conditions. The data confirms the probability of injury is much lower on both the soccer and football fields when field conditions would be considered good (little to no compaction [100 psi], slight surface firmness [0.8 inches], soil moisture at field capacity [20% volumetric water content], and the highest turfgrass quality [1.0]) and is the highest when field conditions are considered poor (severe compaction [325 psi], very firm surface [0.3 inches], severely saturated soil moisture [100% volumetric water content], and poor turfgrass quality [0.1 bare soil]). While 100% for VWC was well above the 40% threshold of saturation (and included as representative of the poor range), that value was used because many of the VWC measurements were at 100%. Table 9 depicts the probability of injury for each field within each frequency risk classification, the 95% confidence interval, and the specific values utilized in calculating the probability through the appropriate logistic regression model. Values for each of the field conditions were chosen to be within each of the parameters yet not at the edges of the parameters.
Table 9
Probability of Injury based upon Poor, Fair, and Good Field Conditions (Soil Compaction, Surface Firmness, Soil Moisture, and Turfgrass Quality)
| Field Conditions | P | SE Fit | 95% CI |
| Soccer | |||
| Poor | 0.22 | 0.22 | [0.02,0.78] |
| Fair | 0.20 | 0.05 | [0.12,0.32] |
| Good | 0.15 | 0.11 | [0.03,0.49] |
| Football | |||
| Poor | 0.07 | 0.08 | [0.01,0.47] |
| Fair | 0.06 | 0.02 | [0.02,0.11] |
| Good | 0.04 | 0.04 | [0.01,0.21] |
Note. Poor conditions = severe compaction (325 psi), very firm surface (0.3 inches), severely saturated soil moisture (100% volumetric water content), poor turfgrass quality (0.1 = bare soil). Fair field conditions = moderate compaction (200 psi), somewhat firm surface (0.5 inches), saturated soil moisture (40% volumetric water content), acceptable turfgrass quality (0.7). Good conditions = little to no compaction (100 psi), slight surface firmness (0.8 inches), soil moisture at field capacity (20% volumetric water content), and the highest turfgrass quality (1.0). CI = confidence interval.
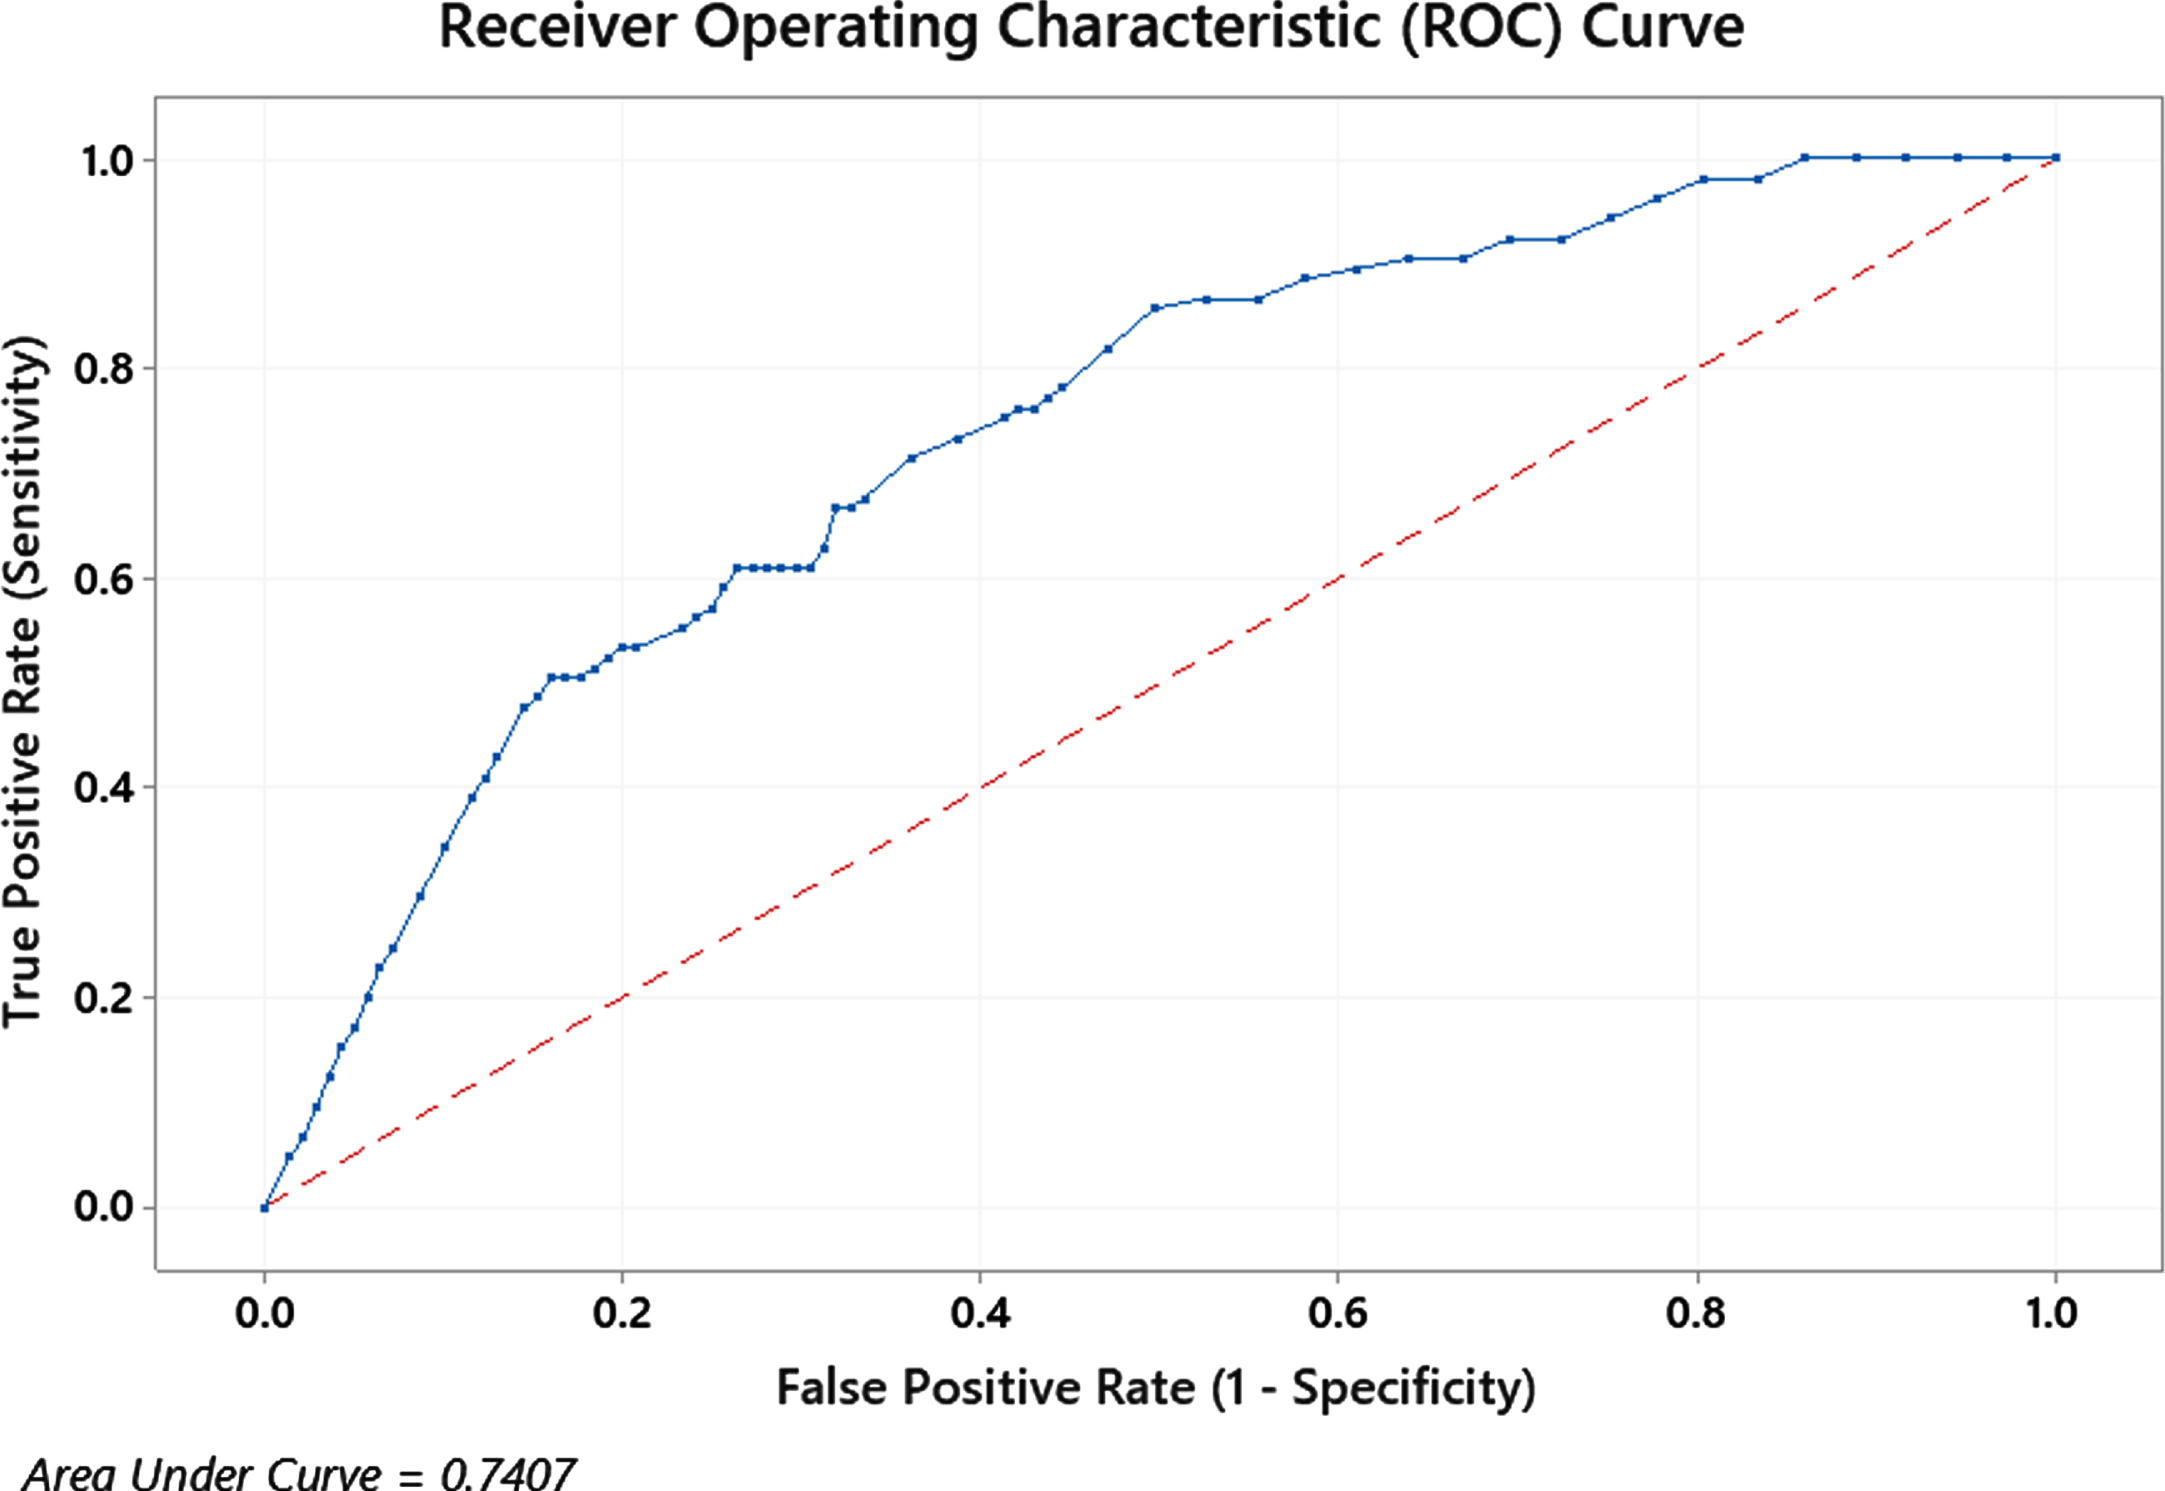
Examining the area under the Receiving Operator Characteristic (ROC) curve is another method of verifying the discrimination of the multivariate logistic regression model. This curve indicates the extent to which a model will correctly classify those who will get injured and those who will not. According to Hosmer et al. (2013), an area under the ROC curve will provide information on how well the model classifies those who will get injured. If the area under the ROC is 0.5 or worse, then the model is no better than flipping a coin. Alternatively, if the area under the ROC curve is between 0.7 and 0.8, then the model exhibits acceptable discrimination (Hosmer, et al., 2013). According to Fig. 1, the area under the curve (AUC) for the final multivariate logistic regression model demonstrates acceptable discrimination (AUC = 0.7407). This also can be translated into another measure of effect size: Cohen’s d. According to Cohen (1988), a large effect size when comparing two means is anything above 0.80. The AUC (0.7407) translates to a Cohen’s d = 0.91, which is above Cohen’s standard for large effect size (Rice & Harris, 2005).
Fig. 1
Area under the ROC Curve for Prediction of Injury by Sport and Pre–game Agronomic Measures.
6Discussion
The results provide evidence to reject the null hypothesis where at least one predictor variable can predict the probability of injury. The results of the univariate logistic regression demonstrate that there is a clear relationship among soil compaction, soil moisture, surface firmness turfgrass quality, and the probability of player injury. When including all of the predictor variables in the model, only the athletic field, soil moisture, and turfgrass quality were significant predictors of player injury. As a result of the connection between all four agronomic predictor variables, all predictors were kept in the final model. Soccer players were four times as likely to be injured when compared to football players. This could be related to the renovation of the soccer field. Higher soil compaction and higher surface firmness increased the probability of all players being injured. Higher soil moisture and better turfgrass quality reduced the probability of all players being injured.
6.1Implications for a risk management plan
The results of this study relate to the DIM process of risk management. Adding the objective measures presented in this study can help make the risk management plan more robust in the area of player safety. Concerning developing a risk management plan, field maintenance employees can collect agronomic data to identify risks associated with the field conditions. As previously mentioned, risks can then be classified by frequency and severity. This study collected the incidence/frequency of injuries and classified the risk of injury as high (when field conditions are poor), medium (when field conditions are fair), and seldom (when field conditions are good). There were not enough different category of injuries observed to classify by severity. To implement the field condition aspect of the risk management plan, facility and field maintenance supervisors can outline what information needs to be collected, how the information will be collected, and the timeline for data collection before a home game. The final aspect of the DIM process related to the results of this study is the management of the risk management plan. The number of employees maintaining the playing surface can vary, depending upon the size of the facility and the scope of events hosted at the facility. This makes it possible to spread out the responsibilities of managing the plan among different people within the facility management and field maintenance personnel.
The implications of this research relate to two specific areas of athletic facility management who would be responsible for managing the risk management plan as it relates to field conditions. First, pre-game assessment of field conditions can provide facility and field managers with objective data to determine what field maintenance practices need to be implemented before game day. For example, in a pilot study, the soil compaction data indicated that 80% of the football field was severely compacted. Following the recommendation of aerification, less than 10% of the football field observed little to no compaction after a follow-up assessment. Second, if there is either a quick change in field conditions, such as a severe weather system moving through the area, or adequate time to make improvements to the field, facility and field managers can take the data again and determine if they should play as scheduled, postpone, or cancel the game. All agronomic data was collected using hand-held devices as an efficient way of collecting the relevant data. Athletic field managers can download the data from these hand-held devices promptly to determine if there are any recommended strategies to be implemented prior to the next home game. In one instance during this study, there was not enough time between snow removal on the soccer field and the game to collect data. As such, there was no time to determine the playability of the field. There was a higher frequency of injuries during this particular game compared to other games. Since no agronomic data was collected, it is hard to determine if this specific game should have been canceled or postponed.
Facility managers are responsible for identifying, classifying, and treating risks at their facilities. The quantitative data collected identifies the potential field condition risks to which players are exposed, classifies the level of risk associated with each variable, and can be treated with various agronomic maintenance practices. These practices can then be included in the field risk management plan developed by the facility manager. If soil compaction is high, the field maintenance crew can aerify to relieve the compaction and reduce the risk of injury. This practice can also alleviate surface firmness by softening the surface of the field. Soil moisture can be too high or too low, depending upon the soil base of the field. Depending upon the amount of foot traffic on the field, aerification can be conducted as often as necessary to alleviate compaction. In the previously mentioned pilot study, two games per week increased compaction and firmness of the field to 50% within two weeks following aerification (approximately two home games per week). One important practice to maintain optimal soil moisture is to have appropriate drainage to prevent too much water in the soil and on the surface and have irrigation to prevent the soil from getting too dry and hard. Turfgrass quality is an important indicator of plant health; the healthier the turf, the better traction for the players. The field maintenance crew can improve the turfgrass quality by having a plant fertility plan appropriate for the type of grass on the athletic field throughout the entire season. All of these treatments will be important in preventing injuries related to field conditions.
7Future directions
While this research demonstrates the predictive value of a pre-game agronomic checklist as a means of reducing injury, more research needs to be conducted on different types of natural grass playing fields. Furthermore, different areas of the field see different wear patterns. For example, the center of the football field sees the most traffic and is likely to be more compacted and firm than the area of the field between the hash marks and the sidelines. Even though agronomic data were collected across all areas of the field, a limitation of this study is that the trainers could not identify the specific location of the field for each injury. This model could be more predictive if the injury could be pinpointed to a specific location on the field. Finally, one classification of risk not addressed in this study is severity. Following a larger number of sports over a longer time and using a severity of injury metric can provide a wider range of injuries that can be related to field conditions, which would allow for classifying the severity of the injuries and including that variable as an additional predictor of injuries.
References
1 | Ammon R , Risk management process. In D.J. Cotton & J.T. Wolohan (Eds.), Law for recreation and sport managers (7 ed.,). Dubuque, IA: Kendall-Hunt Publishers, pp. 274–282.. |
2 | Ammon R , Southall R.M , Nagel M , 2016. Sport facility management: Organizing events and mitigating risks (3rd ed.). West Virginia University: Fitness Information Technology. |
3 | Bartlett M.D. , James I.T. , Ford M. , Jennings-Temple M , (2008) . Testing natural turf sports surfaces: The value of performance quality standards. Proceedings of the Institution of Mechanical Engineers, Part P: Journal of Sports Engineering and Technology, 223: (1), pp. 21–29. |
4 | Belsley D.A. , Kuh E. , Welsch R.E. , (1980) . Regression diagnostics: Identifying influential data and sources of collinearity. New York: John Wiley. |
5 | Canaway P.M. , Bell M.J. , Holmes G. , Baker S.W. , 1990. Standards for the Playing Quality of Natural Turf for Association Football. In R. Schmidt, E. Hoerner, E. Milner, &C. Morehouse (Eds.), STP1073-EB Natural and Artificial Playing Fields: Characteristics and Safety Features, pp. 29-47. https://doi.org/10.1520/STP25347S. |
6 | Carrow R.N. , Krum J.M. , Flitcroft I. , Cline V. , (2010) . Precision turfgrass management: Challenges and field applications for mapping turfgrass soil and stress. Precision Agriculture 11: (2), 115–134. |
7 | Chadwick J. , 2019. AFL 2019: West Coast Eagles Injuries, Optus Stadium Hard Surface Blamed By Adam Simpson, Tom Barrass. [online] Fox Sports.Available at: https://www.foxsports.com.au/afl/afl-2019-west-coast-coach-adam-simpsonblames-optus-stadium-training-for-injury-plague/newsstory/c7a62f945bf7fa90da54822323154b49 [Accessed 1 December 2020]. |
8 | Cohen J. , Hillsdale N.J. , (1988) . Statistical Power Analysis for the Behavioral Sciences. 2nd ed. Hillsdale, N.J.: L. Erlbaum Associates. |
9 | DeMaris A. , (1995) . A tutorial in logistic regression. Journal of Marriage and the Family 57: (4), 956–968. |
10 | Dickson K. , Strunk W. , Sorochan J. , (2018) . The effect of soil type and moisture content on head impacts on natural grass athletic fields. In Multidisciplinary Digital Publishing Institute Proceedings 2: (6), 270. https://doi.org/10.3390/proceedings2060270. |
11 | Epstein T.L. , 2016. L ast-minute hall of fame game fumble may be costly. Chicago Daily Law Bulletin. |
12 | Heinze K.L. , Lu D. , (2017) . Shifting responses to institutional change: The National Football League and player concussions. Journal of Sport Management 31: (5), 497–513. |
13 | Holmes G. , Bell M.J. , (1986) . Pilot study of the playing quality of football pitches. Journal of the Sports Turf Research Institute 62: , 74–91. |
14 | Hosmer D.W. Jr , Lemeshow S. , Sturdivant R.X. , (2013) . Applied logistic regression (3rd ed.). New Jersey: JohnWiley & Sons. |
15 | Jennings-Temple M. , Leeds-Harrison P. , James I. , (2006) . An investigation into the link between soil physical conditions and the playing quality of winter sports pitch rootzones. In The Engineering of Sport 6, Springer, New York, NY, pp. 315–320. |
16 | Knowles S.B. , Marshall S.W. , Guskiewicz K.M. , (2006) . Issues in estimating risks and rates in sports injury research. Journal of Athletic Training 41: (2), 207–215. |
17 | Leopkey B. , Parent M.M. , (2009) . Risk management issues in large-scale sporting events: A stakeholder perspective. European Sport Management Quarterly 9: (2), 187–208. |
18 | McAuliffe K.W. , 2008. The role of performance testing and standards in the sports turf industry: A case study approach. In II International Conference on Turfgrass Science and Management for Sports Fields, 783, pp. 391-398. |
19 | McClements I. , Baker S.W. , (1994) . The playing quality of rugby pitches. Journal of the Sports Turf Research Institute 70: , 29–43. |
20 | Orchard J. , (2002) . Is there a relationship between ground and climatic conditions and injuries in football? Sports Medicine 32: (7), 419–432. |
21 | Petrass L.A. , Twomey D.M. , Finch C.F. , (2016) . Ensuring natural grass sports fields are safe for athlete participation Journal of Applied Sport Management 8: (2), 83–94. |
22 | Rice M.E. , Harris G.T. , (2005) . Comparing effect sizes in followup studies: ROC Area, Cohen’s d, and r Law and Human Behavior 29: (5), 615–620. |
23 | Rosenthal G. , 2016. Hall of Fame Game canceled due to field concerns. www.nfl.com. https://www.nfl.com/news/hall-of-fame-game-canceled-due-to-field-concerns-0ap3000000681448 |
24 | Schlotthauer D. , 2017. Football/soccer field safety and maintenance checklist. Sports Turf Managers Association. Retrieved 02/21/17. http://www.stma.org/sites/stma/files/STMABulletins/FootballSoccerFieldSafetySAFE.pdf |
25 | Straw C.M. , Grubbs R.A. , Tucker K.A. , Henry G.M. , (2016) . Handheld versus mobile data acquisitions for spatial analysis of natural turfgrass sports fields. HortScience 51: (9), 1176–1183. |
26 | Straw C.M. , Samson C.O. , Henry G.M. , Brown C.N. , (2018) . Does variability within natural turfgrass sports fields influence ground-derived injuries? European Journal of Sport Science 18: (6), 893–902. |


