
A football player rating system
Abstract
Association football (soccer) is the most popular sport in the world, resulting in a large economic interest from investors, team managers, and betting agencies. For this reason, a vast number of rating systems exists to assess the strength of football teams or individual players. Nevertheless, most of the existing approaches incorporate deficiencies, e. g., that they depend on subjective ratings from experts. The objective of this work was the development of a new rating system for determining the playing strength of football players. The Elo algorithm, which has established itself as an objective and adaptive rating system in numerous individual sports, has been expanded in accordance with the requirements of team sports. Matches from 16 different European domestic leagues, the UEFA Champions and Europa Leagues have been recorded, with more than 17 000 matches played in recent years, and 12 400 different players. The developed rating system produced promising results, when evaluating the matches based on its predictions. A high relevance of the created system results from the fact that only the associated match report is needed and thus—in relation to existing valuation models—significantly more football players can be assessed.
1Introduction
Association football (soccer) is the most popular sport in the world (Worldatlas 2018, TotalSportek 2019). According to the World Football Association FIFA (2018a), over the half of the global population saw the coverage of the 2018 World Cup. From this popularity of football results a correspondingly great interest, with fans and journalists watching football matches of all professional teams, analysing and discussing controversially the performance of each player. Questions like “Is this or that player the better footballer?” or “Who is the best player ever?” enjoy great popularity among fans as well as in the media.
To clarify these questions, there are various assessment models, which can be roughly divided into two categories (Stefani & Pollard 2007). In subjective models, experts rate the performances of the teams or athletes—in football, journalists usually rate the performances of individual players. Peeters (2018) showed that ratings based on the valuation obtained by crowdsourcing platforms are superior to official or Elo team rating schemes. In contrast, an objective approach to assessing player performance is based on their statistics. In each game, a lot of event data is collected for each player. From the number of ball contacts, the traveled distance, the pass and tackle quota as well as various other statistics, an algorithm determines how good or bad the performance of the player concerned has been. For example, Paixão et al. (2015) showed that UEFA Champions League semi-finalists using shorter passing sequences had a higher chance of winning the match. Very often, a machine learning algorithm, i. e., learning a black box model from a given training set of recorded data, is employed. The model determines how good or bad the performance of the player concerned has been or makes predictions for the performance in future matches. Aslan & Inceoglu (2007) emphasise on the importance of the input parameter selection in order to train a robust model. The data of one season of the Italian Serie A are used for the evaluation. The model is trained with the data from the first half of the season, ignoring the first 6 game days because “random factors play significant role at the start of the season and can distort the training procedure”.
Arndt & Brefeld (2016) predict future performances of players from the German Bundesliga based on more than 1 000 features extracted from event feeds, including information about duels and passes. However, the authors state that data for individual players is often too sparse for learning individual player models. Also Pappalardo et al. (2019) propose a metric to rank performances of individual football players based on events and a machine learning approach.
Kempe et al. (2018) introduced the usage of pass accuracy and effectiveness to rate the tactical behaviour of individual players. The authors pursue the use case of scouting, but they state as well that their approach requires real-time player and ball tracking systems. A hybrid approach based on event data and tracking systems has been proposed by Decroos et al. (2019). A language to represent individual actions by football players is presented, where each player action receives a label indicating how much it effects (positively or negatively) the match score. Also here, the authors stress the problem that real-time tracking data is required, which is available only for teams playing in top leagues. Thus, an application of such approaches for scouting is questionable.
Finally, Hossain et al. (2017) use wearables worn during football matches and deep learning techniques to analyse events such as dribblings and passes to evaluate the ability of a player. They are considering their system mainly as an additional rating source for coaches, besides the subjective visual analysis of the match. A usage for scouting is also imaginable, but this would require a large scale deployment, based on players’ consent, and implicate privacy protection issues.
Using a combined approach that considers both subjective journalist opinions and objective game features, Egidi & Gabry (2018) created a hierarchical model for predicting individual player performances.
In both, subjective and objective methods, players can accumulate ratings in a monotonous fashion over a period of time—such cumulative procedures have the disadvantage that the ratings cannot be adjusted to current results, but only an average of past results is determined. Another criticism of these models is that no cross-comparison between players from different leagues is possible because the different competitions do not have the same level of play and the teams partially use different philosophies of play.
Football is a complex sport—a player’s performance does not only depend on physical, technical and tactical skills, but also on psychological and mental components (Beswick 2010). The assessment of a player’s strength based on subjective impressions or cumulative statistics therefore turns out to be difficult to impossible. The goal, with which each team and each player starts into a football game, is on the other hand conceivably simple and can be sufficiently described in one word: Winning. Taking into account the results of a player, i.e., how often he or she reaches the goal of winning, and the level at which the player acts, as well as the strengths of his / her teammates and opponents, one receives an objective rating, which describes the strength of the player and which is comparable with the ratings of other players.
Comparing the results a team produces with and without a certain player, one can determine the impact of the player on the performance of the team. Kharrat et al. (2017) adapted the plus-minus model, which usually measures a player’s impact on the game in teamsports like icehockey or basketball, for use in football. R. Schultze & Wellbrock (2018) followed a similar approach in their studies and evaluated the importance of football players for their team based on a weighted plus-minus metric. The EA Sports Players Performance Index (Actim Index) is the official player rating system of the English Premier League and awards points for good stats as well as for positive team results (McHale et al. 2014).
Elo-based ranking systems for football have been proposed only—to the best knowledge of the authors—for teams and not for individual players. For example, Sullivan & Cronin (2016) introduce a system to predict the outcomes of matches of the English Premier League. Hubáček et al. (2019) evaluate four different models for football match result prediction on a large dataset of 52 leagues. They employ only the final scores as input to their models and find that the Elo model is slightly outperformed by a double Poisson model and pi-ratings, while it performs better than a graph-based model.
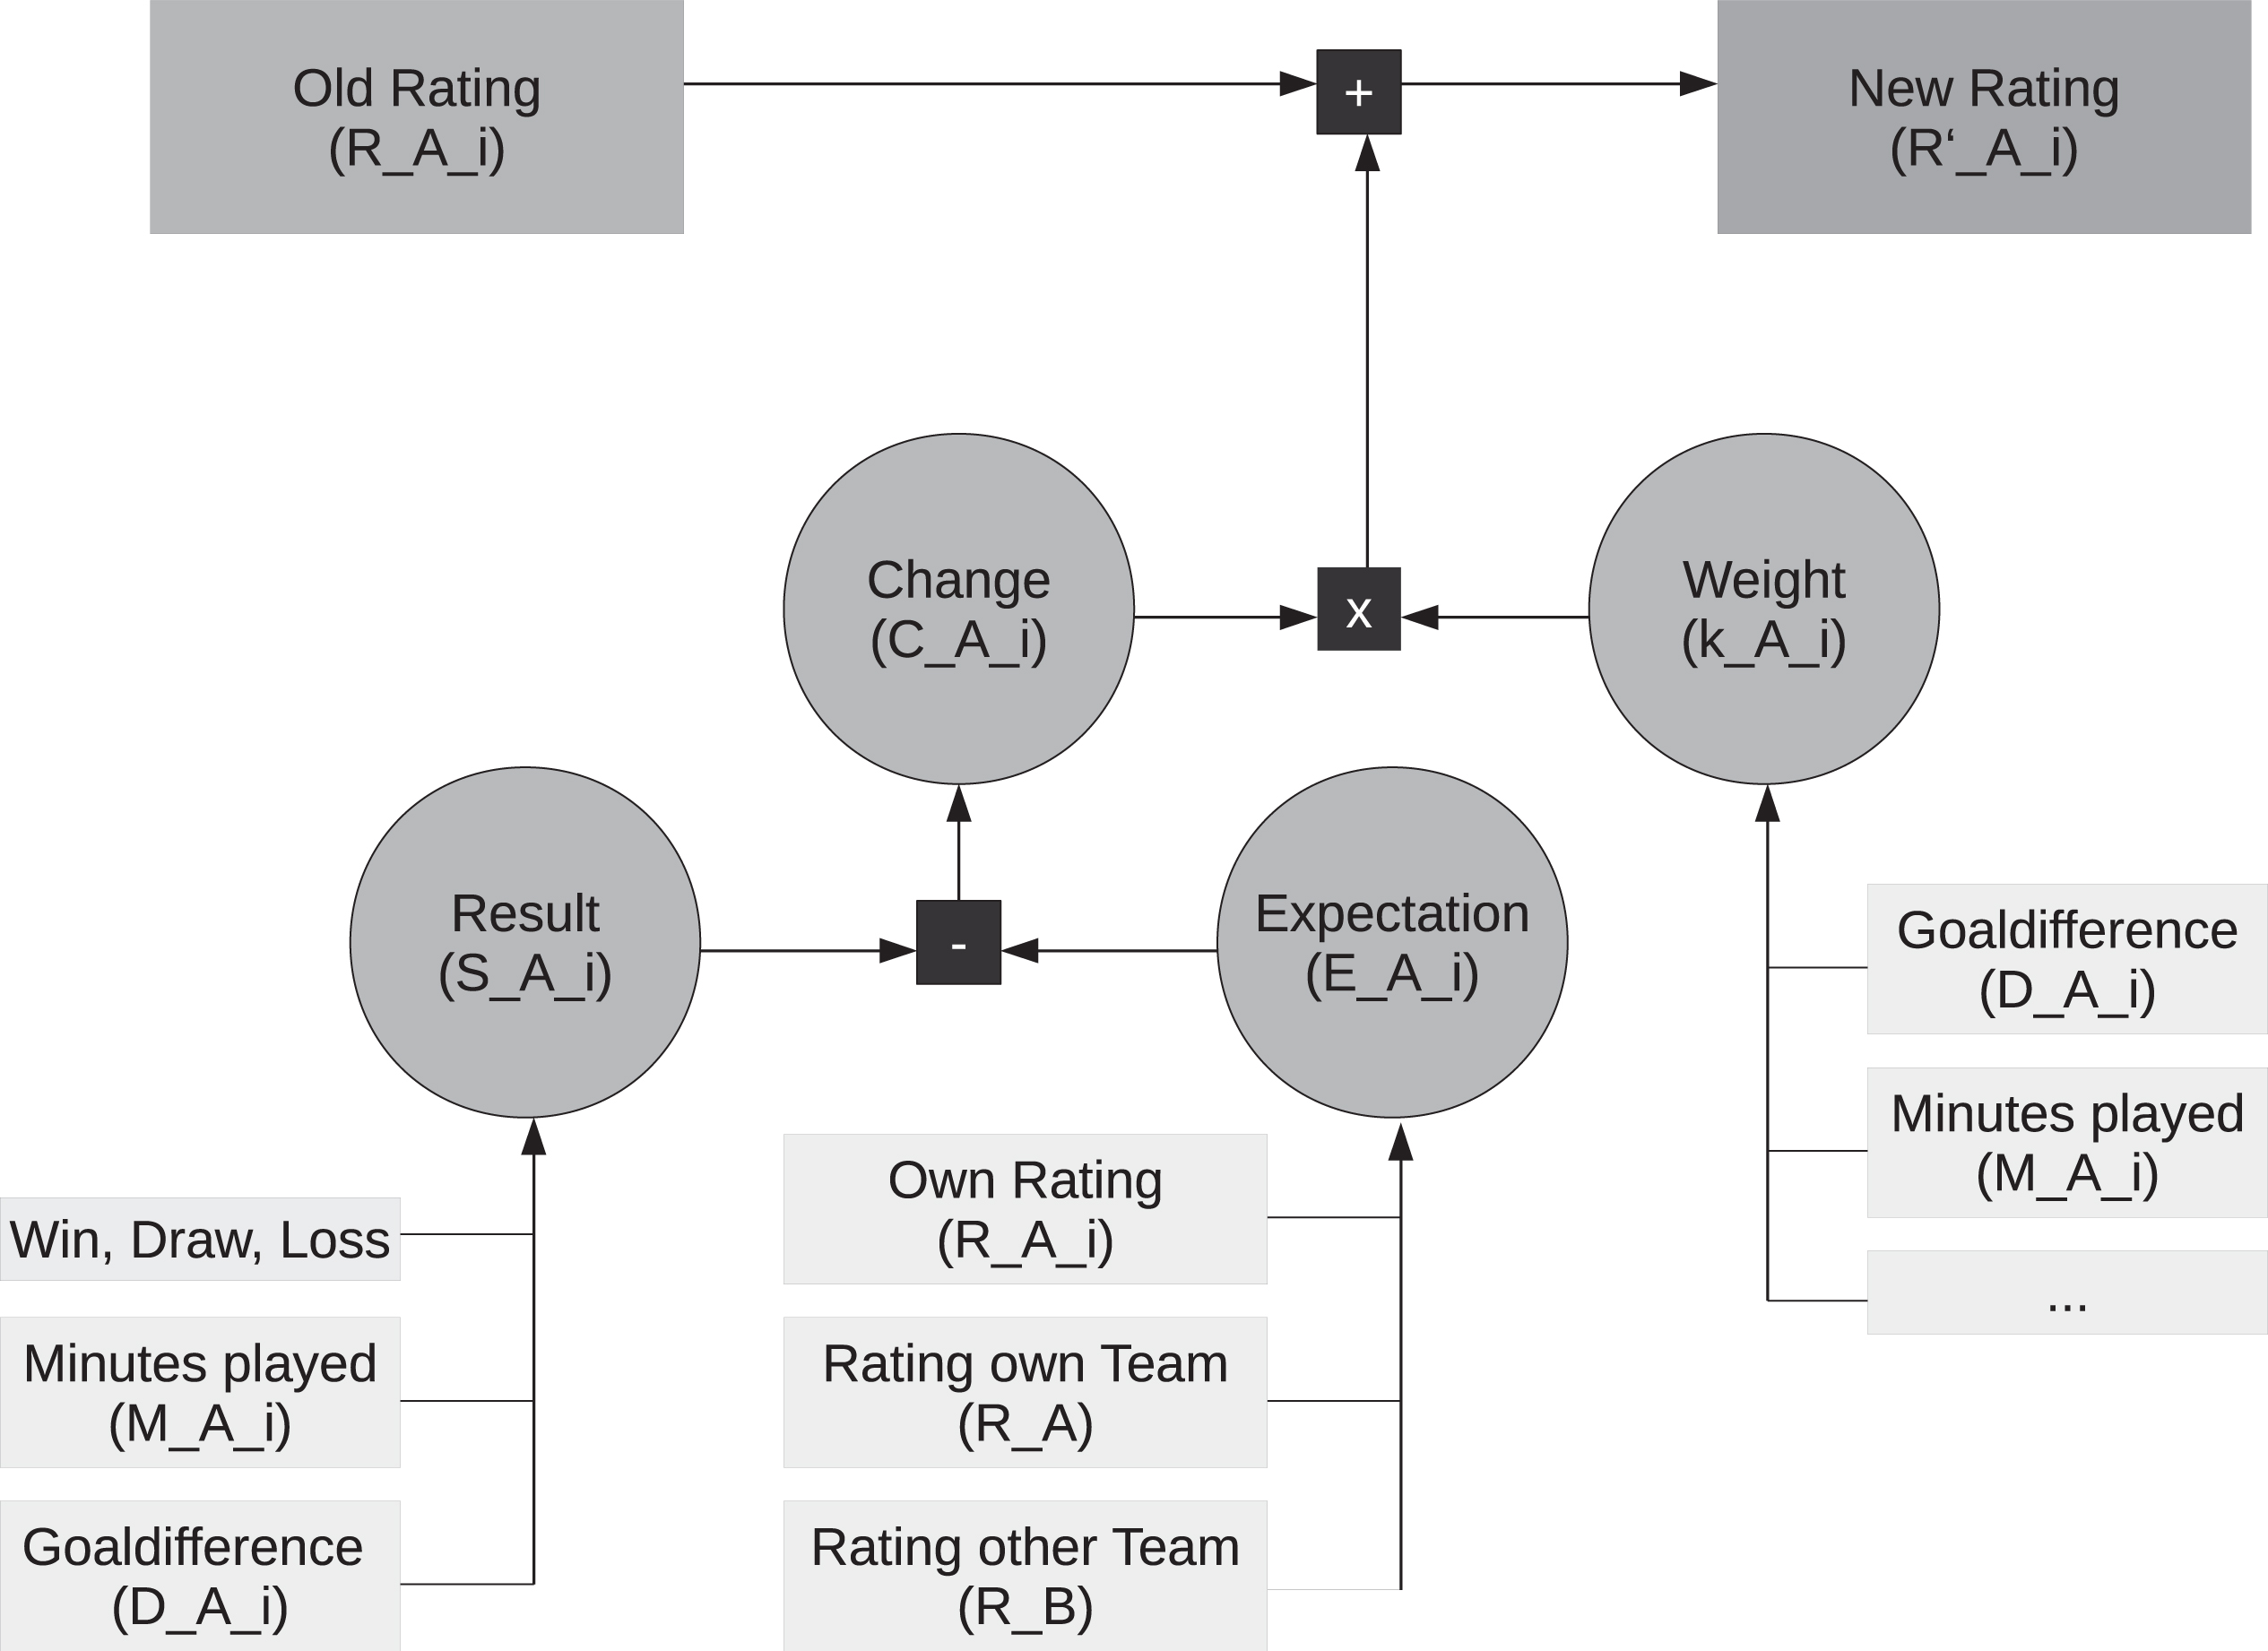
The contribution of this article is as follows: In contrast to previous research, we propose an Elo-based rating system for individual football players. The input of the system is solely the information found in the official match reports, i. e., the goals scored by each team and the lineups with substitutions, including the respective minutes of play. Thus, the system takes into account also intermediate results of the matches, but requires much less data than the event-based rating systems introduced in the past. After each match played, the rating of each player involved is adjusted. If the player has exceeded the expectations placed on him before the game, his rating will be increased—if he could not meet the expectations, he will be devalued. Figure 1 illustrates the basic structure of the algorithm. The developed system is able to: (a) rank the playing strengths of football players, (b) rank the playing strenghts of football teams, (c) predict the outcomes of future football matches, and (d) identify new talents in football. The advantage of our approach compared to Elo ratings of whole teams is that our model performs also across seasons, where player transfers take place, without any loss of accuracy. As the required input data is available for all divisions of football leagues, it can also be deployed for scouting purposes.
Fig. 1
Basic idea of the algorithm: The illustration shows how the old rating RAi of a player Ai from team A is updated after each game played. The expectation placed on the player before the game results from his rating and the rating of his own and the opposing team. If the actual result is better than expected, this leads to a positive change. If the player does not meet expectations, the change is negative. After multiplying by a weight, the change and the old rating result in the new rating. If expectations are exceeded, the player’s rating improves. The more unexpected the result, the greater the difference between the old and the new rating.
The rest of the article is organised as follows. Section 2 introduces the Elo algorithm and its applications in individual sports. Section 3 first explains the Elo-based football player rating system and then introduces the database used in the study. The results are presented and evaluated in Section 4. Then, in Section 5, the potentials and limitations of the system are discussed. The final section concludes the article.
2The Elo-Algorithm
In various sports, such rating systems which adapt the rating of the players based on their results and taking into account the relative skill level after each match, have been established for some time. The American statistician Arpad Emrick Elo (1903 – 1992) developed the Elo algorithm already in 1960, which serves since 1970 the world chess federation FIDE for the calculation of FIDE ratings—objective scores, which indicate the playing strength of chess players. Each chess player has an Elo rating (= FIDE rating) R, whose value correlates positively with his playing strength. The best players in the world have a rating of over 2 800. The most amateur players are ranked between 1 200 and 2 000 points.
If a player is not yet registered in the system, his Elo rating is initialised based on the level of the competition on which he completes his first scored match. After each played game, the rating of the player will be updated according to his result and taking into account the relative playing strength of the opponent. The algorithm for calculating the new rating is described by Elo (1978) as follows:
EA indicates the expected chance of success of player A with Elo rating RA in the duel against player B with Elo rating RB. This value varies between 0 and 1 and depends on the Elo ratings of the two actors involved.
(1)
The actual result that Player A achieves is represented by SA.
(2)
The difference between the result SA and the expectation EA yields—after multiplication by a factor kA—the value of the rating change CA. CA is positive if the player has exceeded expectations, resulting in an increase of his Elo rating.
(3)
The weight kA is a positive number between 10 and 40 and depends on the playing strength, the age, and the number of games played by A so far. For example, if A has completed only a few evaluated games, his Elo rating is still inaccurate—for this reason, kA is set to a high value and his rating is thus more closely aligned to current results. On the other hand, the Elo value of a world-class player can be specified more precisely because he has already participated in many competitions and more games are added regularly. Therefore, kA is lower for a player with a high playing strength. FIDE (2017) has set the following rules for the k-value:
(4)
The new Elo rating
(5)
The Elo system is used not only in chess but also in other individual sports. These variants, in which only details have been modified, are all based on the basic principle that the points are redistributed depending on the expectation and result values. Elo’s rating system can be used in all competitions in which two parties compete directly against each other. In team sports, however, it makes no sense to transfer the presented algorithm directly to individual players. Since the players usually have different statistics regarding goal difference (goals scored by the own team while the player was on the pitch minus goals scored by the opponent while the player was on the pitch) and minutes on the pitch, the algorithm must be fundamentally revised. However, considering the whole team as a single party, Elo’s considerations can be applied to team sports teams to be classified according to their skill level.
The FIFA uses the algorithm described above in a slightly modified form to compile the FIFA World Ranking, which assesses the national teams’ strength. For women, the rankings are formed in this way since their introduction in 2003 (FIFA 2020a). Yet in 2013, Lasek et al. (2013) found that an Elo-based system for team performance prediction works best and outperforms the one used by FIFA for Men’s National Teams at that time; the same claim has been made by Gásquez & Royuela (2016). The FIFA / Coca-Cola World Ranking for Men’s National Teams has been based on the Elo calculation method not until August 2018 (FIFA 2020b). According to FIFA (2018b), the main objective in the introduction of the new procedure was “to identify an algorithm that is not only intuitive, easy to understand and improves overall accuracy of the formula, but also addresses feedback received about the previous model and provides fair and equal opportunities for all teams”.
ClubElo (2014) evaluates the performance of teams at European club level using a similar and Elo algorithm based method. A total of almost 600 000 games from 33 different competitions and teams from 54 different countries have been recorded so far. With so much data on club teams, this site provides a good foundation for a rating system that uses a modified version of the Elo algorithm to determine the strength of individual footballers.
3Football player rating system
3.1Algorithm
Since in the following, each football player is considered individually and should be assigned a rating, the algorithm described above, which is suitable only for exactly two parties, must be modified and expanded accordingly. The following new variables are introduced:
Ai: A player of Team A.
RAi: Rating of player Ai.
RA / RB: Average rating of team A / average rating of team B.
EAi: Individual expectation value of player Ai for a given match—indicates the chances of success for the player and is calculated from RAi and RB.
MAi: Individual number of minutes played by Ai in a given match—indicates how long the player was on the pitch.
DAi: Individual goal difference of Ai for a given match—indicates the difference of the goals of the teams that were scored while the player was on the pitch.
The rating of a team RA indicates the strength of the lineup of club A. For this, in addition to the starting 11, the minutes of play of the team’s player changes must be known. RA is calculated from the average of the ratings of the n players, taking into account the associated time on the pitch.
(6)
Depending on the rating of the player as well as the team rating of the opponent, the Elo formula calculates EAi, an individual expectation value for each player. EA, the chance of success of the team, is determined from RA and RB as in Formula 1. The home team wins statistically more often than the away team (Pollard 1986, Trombley 2016) and therefore has a higher expectation value—because of this home advantage (H), the home team’s rating and the ratings of all home team players are adjusted before the expected values are calculated. It therefore applies RA:= RA + H.
(7)
Each player gets his own game score SAi based on the goals scored while the player was on the pitch. If the team with the player on the pitch scores more goals than the opponent, the goal difference is positive (DAi > 0) and the game is counted as a win (SAi = 1). The same applies for balanced and negative goal differences (see Formula 2). The result of the team SA is determined in the same way.
(8)
Similar to Formula 3, an individual change CAi is calculated for each player according to his result and expectation value. In the event of a win or a defeat, the goal difference DAi is taken into account, thereby weighting the clarity of the game’s outcome. A clearer result leads to a larger point change—the use of the third root of the goal difference ensures homogeneous relations between the magnitude of the change and the clarity of the result. For example, in a win with 8 goals difference, the change is twice as large as in a success with 1 goal difference. If a match ends in a draw for a player, the played minutes will be taken into account and the change will be weighted less in the case of a short time on the pitch. The background is that you cannot expect a favoured team—who should emerge victorious at the end of a game—to score more goals than their opponent in every section of the game. Mmax is the duration of the game and thus the maximum number of minutes a player can reach. The change is finally multiplied by w, the weight of the game. This value is usually the neutral element of multiplication (1) and therefore has no effect—in important games w is set higher, in unimportant matches accordingly lower. For example, w could be set higher in national team games of the World Cup than in qualifying matches, which in turn are more important than friendly matches. CA, the change for the team, is calculated identically:
(9)
The calculation of the new rating
In every game, the sum of the rating changes over all players is usually zero (different k-values can result in minimal deviations). The average player rating remains constant regardless of the number of games recorded.
(10)
The player is responsible for the result of the team and the team is responsible for the result of the player—for this reason, both the personal and the team change are considered in the calculations. The following example should clarify this: Team A wins 1:0, player Ax is substituted at the score of 0:0 by player Ay. So Ax has a draw as individual result and player Ay has a win. The fact that the team produced a better result with player Ay, does not necessarily have to be due to the performance of the players (e.g. could also have had tactical reasons)—for this reason, the team score for both players is considered a win. Player Ay has though achieved a better overall result than player Ax.
For the algorithm to respond properly to a player’s individual situation, the individual k and q weights are important. If a player is newly registered in the system, his ability to perform can initially only be estimated and under certain circumstances may differ significantly from that of his teammates. For this reason, a high value is chosen for both kAi and qAi, which means that the rating is adjusted more closely to current results and mainly the personal result is responsible for the change.
With each completed game, the player’s rating becomes more accurate and the comparability with the ratings of his teammates better—therefore, k and q are decremented after each game in which the player has played. If the player does not play for a long time due to injury or other reasons, the accuracy of his rating will decrease, which is why kAi and qAi are increased in each match without Ai.
A special case is present, if the player changes the club: Players of a team usually are on a similar rating level—in a club change, the rating of the player may differ significantly from that of his new teammates. In order for the rating to be adapted as quickly as possible to the new situation, the k-factor and the q-value of a player are set to the maximum each time a club changes. For example, if a player makes a career jump to a much better club, he has the opportunity to increase his rating faster and adapt it to the values of his new teammates—provided he produces the corresponding results. kAi is at least 24 and at most 40; qAi varies between 0.5 and 1 (for more k- and q-values details see Appendix A.1). Adaptation of the k-factor has also been employed by Sullivan & Cronin (2016), who found that a higher k at the beginning of a season improves the quality of the match prediction.
The team rating will also be updated after each match. The following applies:
3.2Data
For the dataset of this work, football matches from the English Premier League, the Spanish La Liga, the French Ligue 1, the Italian Serie A, the German Bundesliga, the German 2. Bundesliga, the Turkish Süper Lig, the Russian Premier Liga, the Greek Super League, the Dutch Erendivisie, the Austrian Bundesliga, the Swiss Super League, the Portuguese Liga NOS, the Belgian Jupiler League, the Danish Superliga and the Ukraine Premier-Liga as well as the UEFA (Union of European Football Associations) Champions League and the UEFA Europa League were recorded over a period of 4 years. The dataset contains a total of 17 086 matches from 18 different competitions, which were played between the first round of the season 14/15 and the last of the season 17/18. Table 1 shows for each league the number and the period of the recorded games.
Table 1
Recorded games per league in the database
| League | Area | Period of time | Recorded games |
| Premier League | England | 14/15 - 17/18 | 1520 |
| La Liga | Spain | 14/15 - 17/18 | 1520 |
| Ligue 1 | France | 14/15 - 17/18 | 1520 |
| Serie A | Italy | 14/15 - 17/18 | 1519 |
| Bundesliga | Germany | 14/15 - 17/18 | 1224 |
| 2. Bundesliga | Germany | 14/15 - 17/18 | 1222 |
| Süper Lig | Turkey | 14/15 - 17/18 | 1222 |
| Premier Liga | Russia | 14/15 - 17/18 | 960 |
| Super League | Greece | 15/15 - 17/18 | 956 |
| Eredivisie | Netherlands | 15/16 - 17/18 | 918 |
| Bundesliga | Austria | 14/15 - 17/18 | 719 |
| Super League | Switzerland | 14/15 - 17/18 | 719 |
| Liga NOS | Portugal | 16/17 - 17/18 | 612 |
| Jupiler League | Belgium | 16/17 - 17/18 | 479 |
| Superliga | Denmark | 15/16 - 17/18 | 388 |
| Premier-Liga A | Ukraine | 15/16 - 17/18 | 268 |
| Europa League | UEFA | 14/15 - 17/18 | 820 |
| Champions League | UEFA | 14/15 - 17/18 | 500 |
| Total | 17086 |
The data of the match reports originate from the website kicker.de. If the number of recorded games is less than the expected number, there may be several reasons: As a rule, a game could not be recorded because a complete match report with lineups, goals and player changes was not available—in exceptional cases, the game was judged by the association or canceled.
After the evaluation of all matches, 11 139 different players and 438 different club teams were registered in the database. 6 721 of these players were still active in one of the recorded teams in the season 17/18; 6 538 completed at least 20 games.
3.3Player initialisation
The players have to be initialised with different values. In a model without initialisation, the system would take much time, or respectively, a large number of games to adapt the expectation values for everyone to realistic ranges. If all players start with the same rating, those who are in good teams and play lots of games have an advantage—however, it is not the quantity of the games that should be judged, but the quality of the results on the pitch. The following example shows that more games do not necessarily lead to a higher rating: If player A plays all games, he is always on the field when the team loses. If player B, who belongs to the same team, is absent during one of these defeats and plays all the other games, he has a better rating than player A.
As already mentioned, calculates club team ratings using the Elo method. These values provide a good basis for classification. If no or only a few players have a rating in a team, new players are initialised based on the team’s current Elo rating. Due to player transfers and the different lineups of a team, a club’s Elo rating may differ from the actual strength of the players on the pitch. If more than half of the players of a lineup are already registered in the system, the initial rating of a new player is therefore the average score of his teammates.
The website records only games on professional level and rates most teams between 1 000 and 2 100 points. Since the rating system for football players should also include players at amateur level, the values of have been adjusted accordingly. The teams were initialised so that professional players usually have ratings of more than 4 000 points. Values of 5 000 points or more are seldom reached even by world-class players. The value range is basically not limited.
3.4Player impact
A player’s rating strongly depends on the performance of his team, as the player and his team usually get the same results. Therefore, players from teams performing below average will never achieve special ratings by playing regularly. For this reason, with the player impact, another key figure was developed. This value indicates the influence of the player on the results of his team. IAi, the impact of a player is positive if his presence on the pitch had a positive influence on the results of the club. Players who are rated particularly well here were therefore very important to the success of their team.
The player impact calculations are based on the difference between the team rating change with the player and the team rating change without the player. In addition, the number of minutes that the player was on the field and the number of minutes the team played without the player are considered:
(11)
Current games are weighted more heavily than matches in the past. The half-life of a game is 1 year. If the sum of minutes played with the player or the sum of minutes played without the player is less than 900 minutes (equivalent to 10 complete games), the results will be weighted weaker because of their low meaningfulness (for more player impact details see A.2).
4Analysis of the results
4.1Presentation of the results
The initialisation of teams and players was done as described in Section 3.3. The weight of each game w is 1 in all domestic competitions. On international level, w is increased due to the importance of the competitions and amounts to 1.5 for games of the UEFA Champions League and 1.25 for games of the UEFA Europa League. The home advantage H was initially estimated at 75 points, which is the approximated average home advantage by clubelo.com, and adjusted after each game according to the result. If the home team has exceeded expectations, the home advantage increases. Analogously, H is decreased if the home team could not meet expectations and consequently lost points. The new home advantage c is calculated as follows: H′ = H + CA.
After evaluating the data, 21 players have a rating of more than 4 900 and 103 players have a rating of more than 4 800. Only players are considered who completed at least 40 games and at the end of the data collection were still active in Europe. Table 2 presents the 25 players with the highest ratings. The data are on the status of May 26, 2018. The 25 best players are active for 5 different clubs. With Real Madrid (9 nominations) and FC Barcelona (8 nominations), 2 Spanish clubs are dominating this top selection. The superiority of the Spaniards, who also lead the UEFA Country coefficients ranking (UEFA 2018) can be explained by the fact that they have performed very well in international comparison and have won the UEFA Champions League in all 4 years of the evaluation period. The fact that the list of the 25 best players also includes players that most experts are unlikely to classify as world-class has the following reason: The listed players play in very good or successful teams, and the results they produce on the pitch are as good as or even better than those of their teammates.
Table 2
Top Ratings. Top 25 football players from the considered competitions according to their personal rating as of May 26, 2018
| Rank | Name | Current Club | Rating | Impact | Games | Points per Game | Goal-difference |
| 1. | GERARD PIQUÉ | FC Barcelona | 4974 | 4.23 | 147 | 2.43 | 271 |
| 2. | LIONEL MESSI | FC Barcelona | 4960 | 4.49 | 180 | 2.39 | 341 |
| 3. | DAVID ALABA | Bayern München | 4959 | 3.74 | 136 | 2.35 | 248 |
| 4. | KEYLOR NAVAS | Real Madrid | 4957 | 2.77 | 130 | 2.33 | 222 |
| 5. | DANIEL CARVAJAL | Real Madrid | 4951 | 1.3 | 132 | 2.28 | 192 |
| 6. | IVAN RAKITIC | FC Barcelona | 4946 | -1.02 | 176 | 2.25 | 272 |
| 7. | JORDI ALBA | FC Barcelona | 4941 | 1.18 | 151 | 2.37 | 269 |
| 8. | CRISTIANO RONALDO | Real Madrid | 4937 | 2.69 | 177 | 2.32 | 308 |
| 9. | LUIS SUAREZ | FC Barcelona | 4931 | 0.8 | 168 | 2.39 | 298 |
| 10. | LUKA MODRIC | Real Madrid | 4929 | 1.22 | 139 | 2.24 | 207 |
| 11. | SERGIO BUSQUETS | FC Barcelona | 4921 | 0.18 | 169 | 2.32 | 278 |
| 12. | JEROME BOATENG | Bayern München | 4920 | 3.62 | 111 | 2.43 | 186 |
| 13. | SERGIO RAMOS | Real Madrid | 4918 | 0.21 | 144 | 2.23 | 193 |
| 14. | MARCELO | Real Madrid | 4918 | -0.52 | 166 | 2.23 | 271 |
| 15. | RAPHAEL VARANE | Real Madrid | 4918 | 0.38 | 143 | 2.24 | 218 |
| 16. | NEYMAR | Paris St. Germain | 4917 | 3.46 | 154 | 2.43 | 318 |
| 17. | MARC ANDRE TER STEGEN | FC Barcelona | 4916 | -0.69 | 121 | 2.34 | 205 |
| 18. | ARJEN ROBBEN | Bayern München | 4912 | 0.31 | 110 | 2.26 | 176 |
| 19. | CASEMIRO | Real Madrid | 4909 | 0.1 | 118 | 2.21 | 158 |
| 20. | ALEIX VIDAL | FC Barcelona | 4909 | 1.82 | 77 | 2.16 | 92 |
| 21. | KYLE WALKER | Manchester City | 4904 | 2.99 | 128 | 2.05 | 148 |
| 22. | KEVIN DE BRUYNE | Manchester City | 4900 | 6.98 | 169 | 2.02 | 172 |
| 23. | NACHO | Real Madrid | 4899 | -1.41 | 108 | 2.21 | 165 |
| 24. | NICOLAS OTAMENDI | Manchester City | 4897 | 6.45 | 155 | 2.04 | 174 |
| 25. | DAVID SILVA | Manchester City | 4896 | 4.15 | 146 | 2.03 | 153 |
Gerard Piqué, who plays for FC Barcelona, has the highest rating of all 3 733 players considered, with a score of 4 974, and leads the ranking ahead of his teammate Lionel Messi and David Alaba from FC Bayern München. Piqué is also the player with the most points per game. Like Neymar and Jerome Boateng, he also scores an average of 2.43 points per match. The fact that this value correlates only partially with the player’s rating has two reasons: The value does not record the quality of the opponent and creates only an average without considering the date of the game. The record for the highest rating ever is held by Neymar, who reached 5 022 points on March 16, 2016 as a player of FC Barcelona. In Table 3, the players are sorted by their player impact. Only the 103 players with a rating of over 4 800 are considered. The statistics is led by Mohamed Salah, who played for FC Basel, AS Roma, and FC Liverpool during the recorded period. Salah had consequently a big positive impact on the results of his clubs. For comparison, the rating of the team is given for each player—it can be seen that the individual rating of the player is always higher than the corresponding club rating.
Table 3
Top Impacts. Top 15 football players from the considered competitions according to their impact as of May 26, 2018. Only players with a rating of more than 4800 are considered for these statistics
| Rank | Name | Current Club | Impact | Rating | Games | Club Rating |
| 1. | MOHAMED SALAH | FC Liverpool | 8.43 | 4858 | 156 | 4779 |
| 2. | KEVIN DE BRUYNE | Manchester City | 6.98 | 4900 | 169 | 4840 |
| 3. | NICOLAS OTAMENDI | Manchester City | 6.45 | 4897 | 155 | 4840 |
| 4. | RAHEEM STERLING | Manchester City | 4.97 | 4879 | 165 | 4840 |
| 5. | SADIO MANE | FC Liverpool | 4.75 | 4830 | 138 | 4779 |
| 6. | LIONEL MESSI | FC Barcelona | 4.49 | 4960 | 180 | 4923 |
| 7. | GERARD PIQUÉ | FC Barcelona | 4.23 | 4974 | 147 | 4923 |
| 8. | EDERSON | Manchester City | 4.21 | 4854 | 84 | 4840 |
| 9. | DAVID SILVA | Manchester City | 4.15 | 4896 | 146 | 4840 |
| 10. | EDINSON CAVANI | Paris St. Germain | 4.13 | 4814 | 172 | 4772 |
| 11. | MARCO VERRATTI | Paris St. Germain | 4.06 | 4842 | 127 | 4772 |
| 12. | ERIC BAILLY | Manchester United | 4.04 | 4832 | 101 | 4751 |
| 13. | PAUL POGBA | Manchester United | 3.99 | 4831 | 156 | 4751 |
| 14. | ANTOINE GRIEZMANN | Atletico Madrid | 3.95 | 4849 | 191 | 4818 |
| 15. | DAVID ALABA | Bayern München | 3.74 | 4959 | 136 | 4876 |
4.2Evaluation of the results
For the evaluation, all games from the evaluated period are analysed. A comparison between the actual results of the games and the expectations predicted by different models is made. It is measured how often the model favoured team could win the match. It has already been shown by Bigsby & Ohlmann (2017), who evaluated the results of college wrestling matches in their studies, that meaningful predictions can be made with the Elo method in sports.
The first method (‘player rating’) is based on the average player ratings of each of both teams and is calculated according to Formula 6. The presented system not only rates the players, but also assigns ratings to teams using the same procedure. This value is therefore independent of the lineup of the respective team and is used as a second method (‘team rating’) for the evaluation.
The main goal of the evaluation is to clarify the question: Does the player rating procedure outperform the team rating method in predicting game results? In other words, can the outcomes of football matches be better predicted if one knows not only the strength of the two teams, but also has knowledge of the ratings of the participating players? For best results, orderly probit or logit regression models should be used, according to the studies of Hvattum & Arntzen (2010) and Asimakopoulos & Goddard (2004), who tested Elo-based prediction algorithms in football. Since the optimisation of the results in this article plays only a minor role, an approach that is easy to automate and requires no additional input data is used for the evaluation.
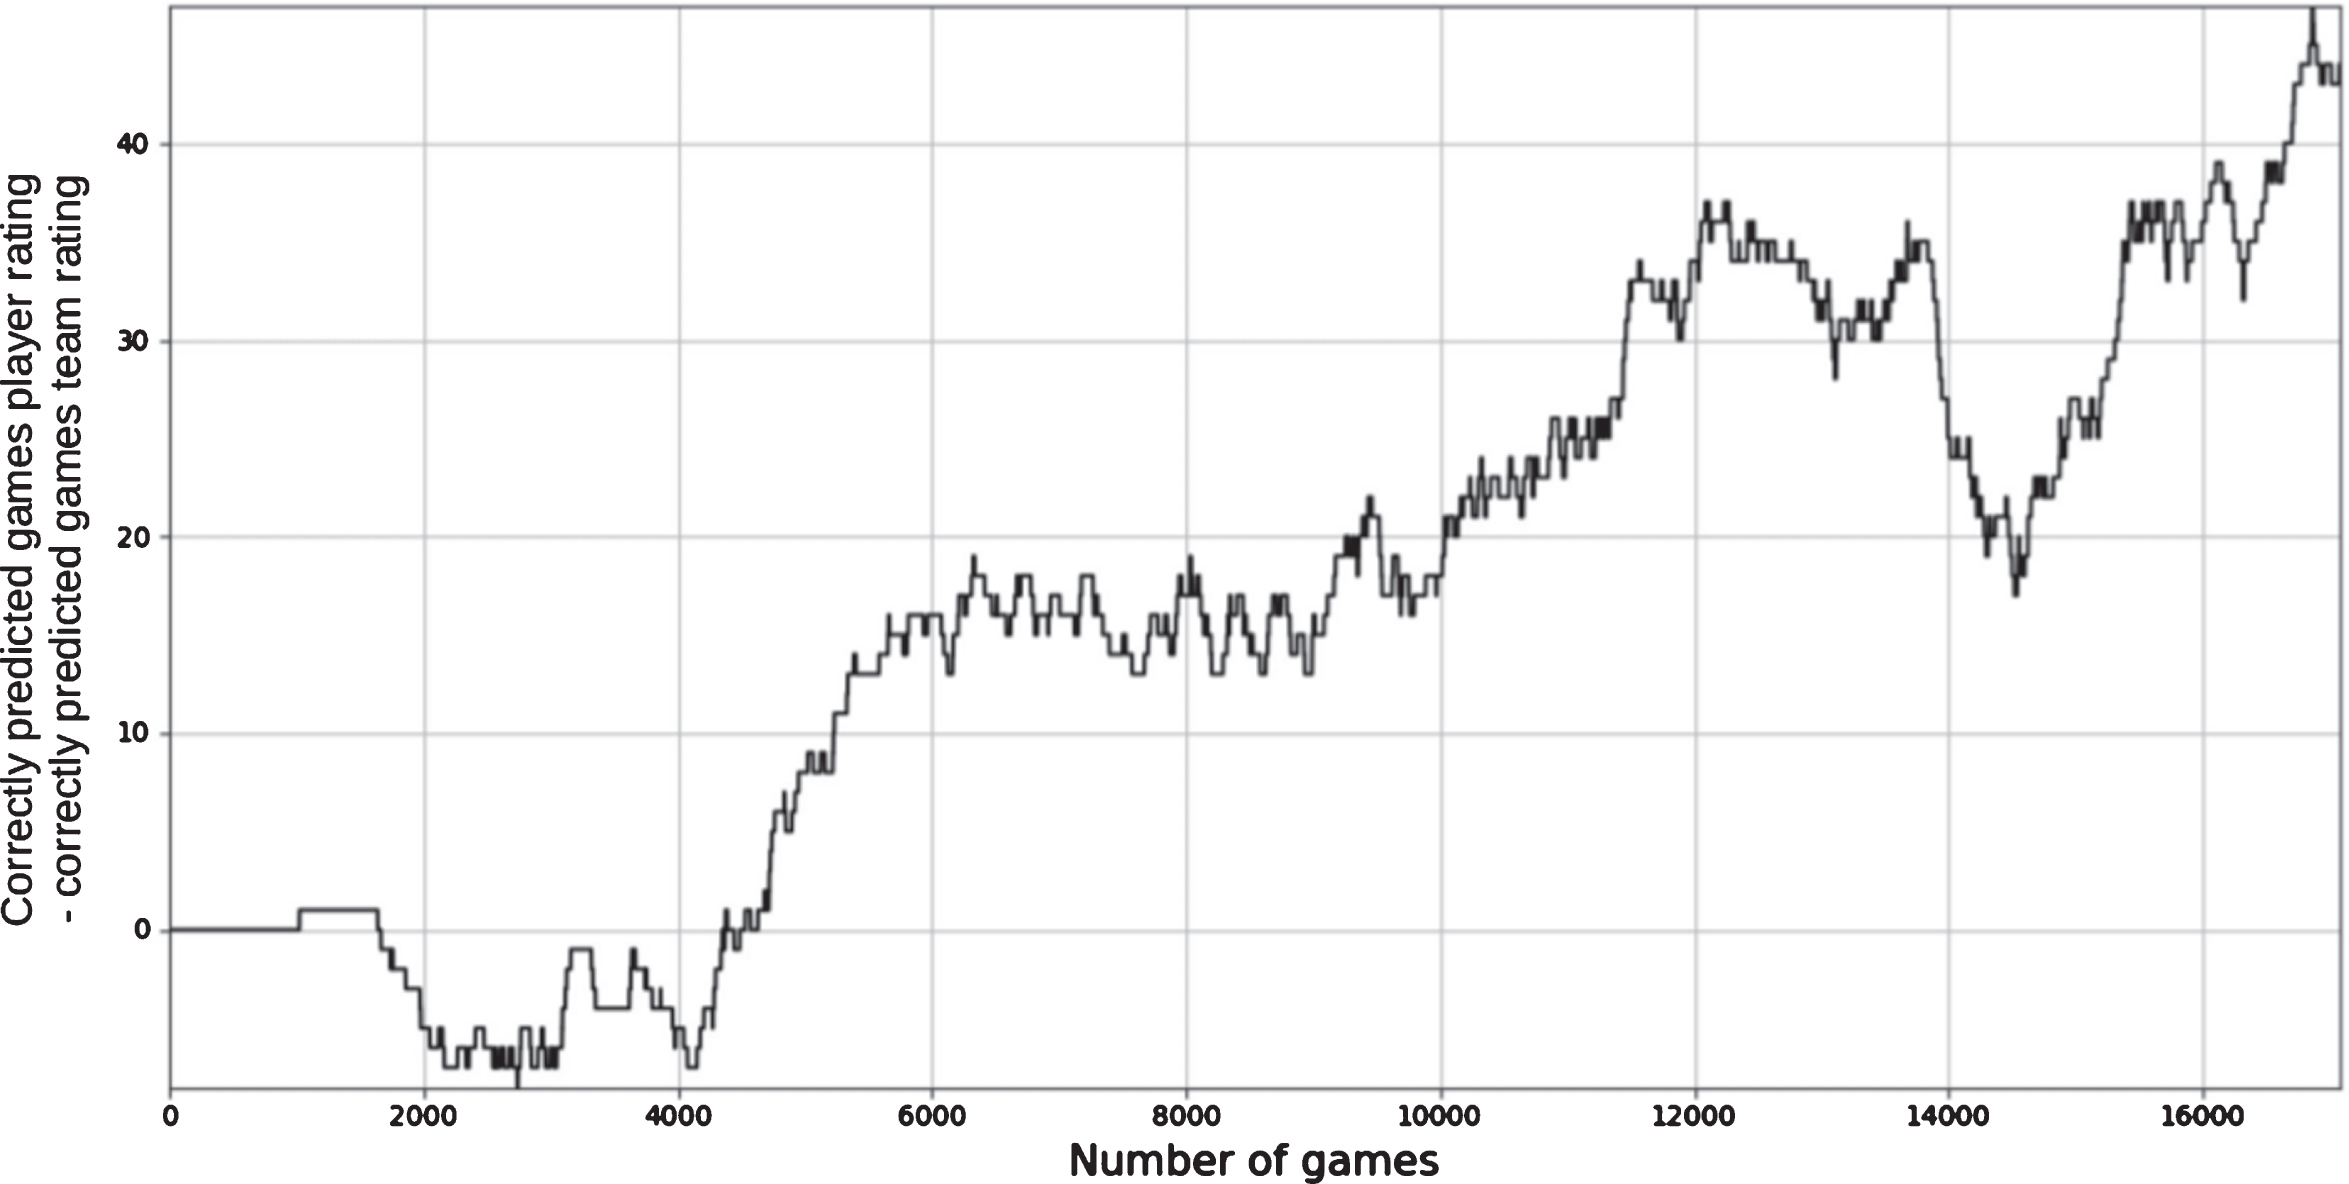
Table 4 shows the values of the correctly predicted games for the two procedures presented and individual seasons. Since players are initialised based on their team rating, the two variants initially produce the same predictions. Over time, the player rating deviates from the team rating and produces better predictions. Figure 2 shows this history and represents the difference between the games predicted correctly.
Table 4
Correctly predicted games by seasons. ‘Team rating’ evaluates the strength of the team regardless of the lineup. ‘Player rating’ takes into account the strength of each player in the lineup. Both methods always bet on the team that has the higher rating. The listed values indicate how often the prediction (‘win Team A’ or ‘win Team B’) was identical to the actual outcome (‘win Team A’ or ‘draw’ or ‘win Team B’)
| 14/15 | 15/16 | 16/17 | 17/18 | ∑ | |
| Player rating (%) | 1860 (51.57) | 2010 (51.00) | 2595 (54.39) | 2513 (52.72) | 8978 (52.55) |
| Team rating (%) | 1864 (51.68) | 1993 (50.57) | 2575 (53.97) | 2502 (52.49) | 8934 (52.29) |
| Difference | -4 | 17 | 20 | 11 | 44 |
| Total | 3607 | 3941 | 4771 | 4767 | 17 086 |
Fig. 2
Difference of correctly predicted games between ‘Team rating’ and ‘Player rating’. ‘Team rating’ evaluates the strength of the team regardless of the lineup. ‘Player rating’ takes into account the strength of each player in the lineup. Both methods always bet on the team that has the higher rating. The listed values indicate how often the prediction (‘win Team A’ or ‘win Team B’) was identical to the actual outcome (‘win Team A’ or ‘draw’ or ‘win Team B’).
For the last recorded season, the games of the English Premier League, the France Ligue 1 (L1), the German Bundesliga (BL), the Italian Serie A (SA), the Spanish La Liga (LL), and the UEFA Champions League (CL) are evaluated separately and together (∑). Of the players playing in these competitions, comparatively most games were previously recorded. Table 5 shows the results. It can be seen that the player rating makes better predictions for all competitions.
Table 5
Correctly predicted games 17/18 for Premier League (PL), Ligue 1 (L1), Bundesliga (BL), Serie A (SA), La Liga (L1) and Champions League (CL). ‘Team rating’ evaluates the strength of the team regardless of the lineup. ‘Player rating’ takes into account the strength of each player in the lineup. Both methods always bet on the team that has the higher rating. The listed values indicate how often the prediction (‘win Team A’ or ‘win Team B’) was identical to the actual outcome (‘win Team A’ or ‘draw’ or ‘win Team B’)
| PL | L1 | BL | SA | LL | CL | ∑ | |
| Player rating (%) | 209 (55.00) | 208 (54.74) | 150 (49.02) | 224 (58.95) | 210 (55.26) | 71 (56.80) | 1072 (54.95) |
| Team rating (%) | 206 (54.21) | 206 (54.21) | 148 (48.37) | 221 (58.16) | 207 (54.47) | 69 (55.20) | 1057 (54.18) |
| Total | 380 | 380 | 306 | 380 | 380 | 125 | 1951 |
The Brier score function was used as a further evaluation method. Therefore, the quadratic loss between the expectation EAt and the result SAt of the home team was calculated for each game t. The Brier Score is the average of all N games and can be calculated with the following formula:
(12)
Again, all major league games from the 2017/18 season were evaluated using the team rating and the player rating procedure, which calculated the expectation value. In addition, a baseline evaluation was carried out—the expectation value of the home team was therefor always set to 0.5. The home team’s result is 1 if they win, 0.5 if they draw and 0 if they lose (see Formula 8). The results are shown in Table 6. For all leagues, the player rating procedure receives the smallest output value, so it has the least deviation between expectation and result and consequently beats the other systems. This result supports the hypothesis that the player rating method can produce more accurate predictions than the team rating method after a sufficient training time.
Table 6
Brier score for games 17/18 for Premier League (PL), Ligue 1 (L1), Bundesliga (BL), Serie A (SA), La Liga (L1) and Champions League (CL). ‘Team rating’ evaluates the strength of the team regardless of the lineup. ‘Player rating’ takes into account the strength of each player in the lineup. Baseline rates both teams as equally strong. The listed values indicate the average quadratic loss between the expectation and the result of the home team
| PL | L1 | BL | SA | LL | CL | ∑ | |
| Player rating | 0.1440 | 0.1454 | 0.1575 | 0.1448 | 0.1562 | 0.1457 | 0.1490 |
| Team rating | 0.1451 | 0.1504 | 0.1581 | 0.1454 | 0.1632 | 0.1586 | 0.1524 |
| Baseline | 0.1848 | 0.1868 | 0.1822 | 0.1953 | 0.1934 | 0.1980 | 0.1894 |
5Potentials and limitations of the rating system
The system offers many possibilities for enhancements and improvements. One possible extension concerns the initialisation of young players. Since the players are always initialised on the level of their teammates at the first game, this is particularly problematic for young players. For example, a youth player of Bayern München has a higher value than a large part of the remaining Bundesliga after initialisation. As young players usually improve their skills over time, this should also be considered in the rating system. This would be possible if one considers the age of the players during the initialisation and additionally introduces a ‘youth bonus’. For example, one could initialise an 18-year-old with only 75 % of the actual value and give him bonus points for every game he finishes at the age of 21. Thus, the development curve of the player as well as the number of his matches would be considered. So far, only matches at club level have been recorded by the system. However, if the k- and q-values are adjusted, the results of national team matches can also be taken into account.
The system has various applications and great potential due to the incredibly large number of active football players. Most of the players play on amateur level. While, as mentioned above, at professional level, countless data is collected for each game and player, amateur football has no statistics to judge a player’s performance. For almost all games, however, a match report which contains result, date, goals, lineups, and player changes is recorded and published. A match report thus contains all the information that the presented system needs to evaluate football players. This makes it possible to evaluate an extremely large number of games. Thus, not only professional players but also amateur footballers can be recorded, rated based on their skill level, and compared to each other—regardless of league, region, gender, and age. That adaptive scoring systems in general and procedures according to the Elo algorithm in particular also produce reasonable results in mass sports, shows the success in the application to various individual sports.
Creating a good system for initialising amateurs is not trivial. A possible formula for the initial rating of amateur teams and potential problems are discussed in the following: In Germany, a team in the 1st division (league level 1) has an average rating of 4 375 points. For clubs in the 2nd division (league level 2), the rating is around 250 points lower on average. As a rough heuristic, we assume that the average rating per league level in Germany will drop by 250 points. In Germany there are between 9 and 13 league levels depending on the region. We assume an average of 11 levels Since the strengths of the teams at the lowest level will be approximately the same in all regions, the quality / strength differences between teams of two leagues are greater in regions with fewer levels. Therefore, the formula also takes into account the number of league levels. For a German team A playing at league level LA in a region with LMax league levels, the following formula results for the initial rating RA:
(13)
A team playing in the lowest league initially has 1 875 points (regardless of the number of levels in the region). If a club plays in the 6th of 11 leagues, it will start with 3 125 points. For other European countries, depending on the average rating in the top division and the number of league levels, a similar formula based on the considerations above can be created. Here we assume that teams from the lowest league are on average about as strong as those from other countries and should therefore also initially be rated with 1 875 points. For a general formula for clubs from other European countries, the average rating in the 1st division (Ø RL1) must also be considered. This results in the following formula:
(14)
The average rating of a Spanish 1st division club is 4 460 points—a team that plays in Spain in the 6th of 9 leagues initially receives a rating of 2 844 (rounded), for example. The presented formula should only give a first intuition for the possible initialisation of the amateurs. For more specific initialisations, one would have to deal individually and intensively with the league systems of the respective countries.
Another possible application is the scouting of players. The system can filter out players who—compared to their teammates and with their club—succeed above-average. Such players, who ‘make their own team better’, are likely to be interesting to various other teams. The benefit of an individual player rating system was impressively demonstrated by the National Baseball Team Oakland Raiders in the so-called “Moneyball Years” (Lewis 2003).
As an example of an underrated player, Aleix Vidal could be mentioned. This player occupies place 20 in the overall top ratings, although he was usually only a substitute at FC Barcelona and had relatively little playing time. The reason why this player is ranked so well can be seen from Table 7: On average, FC Barcelona in the 17/18 season needed fewer minutes to score 1 goal more than their opponent when Aleix Vidal was on the pitch—thus the team played more successfully with Vidal than without him. Against this, one could argue that Vidal was just lucky and only played against supposedly easier opponents, against whom Barcelona could achieve better goal differences. Thus, we only consider the games in which the player was used: Again, the goal difference in relation to the playing minutes with Vidal on the pitch is better than the goal difference without Vidal. After the season 17/18, Aleix Vidal’s appearances and statistics were not as good as before. Reasons for this are that footballers’ careers are not always linear and that the random factor also plays a role in games—therefore, the results previously processed by the system cannot predict all future events correctly.
Table 7
Statistics of FC Barcelona in the Spanish La Liga (LL) and the Champions League (CL) for the entire season 17/18. The first row indicates the minutes (M), goal difference (D = goals scored - goals conceded) and the minutes per goal difference (M/D) for all matches of the season. The second row only considers minutes and goals if Aleix Vidal was on the pitch. The third row takes into account the total playing time and all goals of games in which the Aleix Vidal has played for at least 1 minute
| LL | CL | ∑ | |||||||
| M | D | M/G | M | D | M/D | M | D | M/D | |
| Total | 4320 | +70 | 48.9 | 900 | +11 | 81.8 | 4320 | +81 | 53.3 |
| With Aleix Vidal on the pitch | 452 | +15 | 30.1 | 112 | +2 | 56.0 | 564 | +17 | 33.2 |
| Games with Aleix Vidal involved | 1350 | +33 | 40.1 | 360 | +6 | 60.0 | 1710 | +39 | 43.8 |
Nevertheless, as Section 4.2 makes clear, the rating system is quite suitable for game predictions. With appropriate adjustment, it would also be possible to specify quotas for corresponding bets. It should be noted that our system knew the actual lineup of the teams and used them for the evaluation. In reality, however, the lineups will only be announced shortly before kick-off. In order to calculate the player rating of a team, one would have to use the expected lineups. It would still have to be checked whether similarly good results can be achieved with this.
Similar to the way Elo’s algorithm was adopted by numerous individual sports, this system could also be adopted in a slightly modified form by other team sports. In order to be able to evaluate handball, ice hockey, or basketball players on the basis of their results, in the present algorithm only the influences of goal or point difference and played minutes would have to be adapted to the respective conditions (duration of a game, possible results).
6Conclusion
We developed a novel rating system for football players. The basic hypothesis is that the success of a footballer positively correlates with their playing strength. The developed system is based on the algorithm of Elo, which as an objective and adaptive rating model offers various advantages over subjective or statistics-based methods. The Elo algorithm, designed for chess and adapted from other individual sports, updates the ratings of the players involved after each game by comparing the expectation value resulting from the strengths of the two players with the actual outcome of the game.
According to the requirements of the team sport football, the algorithm had to be fundamentally revised and extended. The modified algorithm for football players takes into account the strengths of the two opposing teams and the result of the game as well as for each individual player the personal rating, the individual result, and the minutes on the pitch. In addition, a second key figure was developed with the player impact. This value indicates the dependence of the team success on the presence of a player on the pitch. Over the 4 years between the first matchday of the 14/15 season and the last matchday of the 17/18 season, matches from 18 different European competitions were recorded. A total of 17 086 games were applied to the algorithm and 11 139 different players were registered in the database.
After the application of the Elo model to all games, FC Barcelona’s Gerard Piqué had the highest rating with 4 974 points ahead of Lionel Messi and David Alaba. The Spanish top clubs Real Madrid and FC Barcelona, who won the UEFA Champions League in all 4 years of the rating period, own 17 of the top 25 players. Mohamed Salah, who lastly played for Liverpool, had the highest impact of all top players. Kevin de Bruyne and Nicolas Otamendi, both Manchester City players, are on the second and third place, respectively, in this ranking.
The average of the lined-up players’ rating indicates the strength of a team lineup for a match. In the evaluation part, it was checked for all games whether the team favoured by the system based on the determined strength values could actually win the game. It could be shown that the result of a game can be more accurately predicted, if one knows not only the participating teams but also the ratings of the lined-up players.
The presented rating system still offers possibilities for improvements and expansions. For example, the implementation of youth balancing, which takes into account the development curve of young actors, would be possible. In order to record a game, the system only needs the corresponding match report, which is normally also recorded and published on the amateur level. The system can thus determine rating values for an extremely large number of footballers—resulting in high relevance. After an appropriate adaptation, the algorithm could also produce profitable insights in determining odds, scouting players, or evaluating players from other team sports.
Recently, promising extensions of the Elo rating system have been suggested. For instance, Dorsey (2019) extends the Elo algorithm for chess players with time as a covariate, called Elo regression, improving the accuracy of the ranking. Kovalchik (2020) compares 4 different variants of Elo models for tennis players, which are able to predict the margin of victory as well. These and further possible enhancements will be object to our future research.
In conclusion, it can be noted that the presented rating system for football players, which—as an objective and adaptive procedure—represents an innovation compared to existing models, has great potential and high relevance due to the shown benefits.
Appendices
Appendix A. Calculation of some values in detail
Chapter 3 presented the formulas for the football player rating system—for reasons of clarity, some details have been omitted there. Appendix A provides the interested reader with more details about some of these formulas.
A.1. k- and q-Value
kAi, the value indicating the strength of the rating change of player Ai is initially 32, maximum 40 and minimum 24. After each game of the team of Ai, the player’s k-value is recalculated according to the following formula:
qAi, the value that indicates the weight of the individual change compared to the team change is initially 1, maximum 1 and minimum 0.5. After each game of the team of Ai, the player’s q-value is recalculated according to the following formula:
The values for k and q were initially chosen intuitively and then optimised through a few tests. For example, if a newly initialised player plays regularly for 1 season, his k- and q-values are at the bottom of the scale. If a player plays less often, his values increase and the results of his few games are weighted more heavily.
A.2 Player impact
Section 3.4 presented the player impact, a key figure that indicates the influence of a player to the success of the team.
In this chapter, it was mentioned that the change of the team rating with player Ai (∑CA:with:Ai) is weighted less if the sum of the minutes with player Ai (∑MA:with:Ai) is less than 900 minutes. In detail the formula in this case is as follows:
If the player was not on the pitch less than 900 minutes (ergo: ∑MA:without:Ai <900), the formula is similar:
If ∑MA:with:Ai <900 and ∑MA:without:Ai <900 applies, the formula is modified as follows:
The results have a half-life of 1 year. This means that the minutes and the team change of a 365-day-old game are weighted half as much as the minutes and the team change of a current game. The weight W by which the results of a game G played x days ago are multiplied with is calculated as follows:
References
1 | Arndt, C. and Brefeld, U. (2016) , ‘Predicting the future performance of soccer players’, Statistical Analysis and Data Mining: The ASA Data Science Journal 9: (5), 373–382. |
2 | Asimakopoulos, I. and Goddard, J. (2004) , Modelling football match results and the efficiency of fixed-odds betting’, Journal of Forecasting 23: (1), 51–66. |
3 | Aslan, B. G. and Inceoglu, M. M. (2007) , A comparative study on neural network based soccer result prediction, in ‘Proceedings of the Seventh International Conference on Intelligent Systems Design and Applications (ISDA)’, IEEE, pp. 545-550. |
4 | Beswick, B. (2010) , Focused for Soccer, Human Kinetics, Champaign, United States. 2nd Edition. |
5 | Bigsby, K. G. and Ohlmann, J. (2017) , Ranking and prediction of collegiate wrestling’, Journal of Sports Analytics 3: (1), 1–19. |
6 | ClubElo 2014, ‘Football club elo ratings’. Last access: 2020-06-28. URL: http://clubelo.com/System. |
7 | Decroos, T. , Bransen, L. , Van Haaren, J. and Davis, J. (2019) , Actions speak louder than goals: Valuing player actions in soccer, in ‘Proceedings of the 25th ACM SIGKDD International Conference on Knowledge Discovery & Data Mining’, Anchorage, AK, USA, pp. 1851-1861. |
8 | Dorsey, J. (2019) , Elo regression extending the elo rating system, Master’s thesis, University of Akron, Akron, OH, USA. |
9 | Egidi, L. and Gabry, J. (2018) , Bayesian hierarchical models for predicting individual performance in soccer’, Journal of Sports Analytics 3: (14), 143–157. |
10 | Elo, A. E. (1978) , The rating of chessplayers, past and present, Arco Pub., New York, United States. |
11 | FIDE 2017, ‘Fide rating regulations’. Last access: 2020-06-28. URL: https://ratings.fide.com/calculator_rtd.phtml. |
12 | FIFA 2018a, ‘2018 fifa world cup russia - global broadcast and audience summary’. Last access: 2020-06-28. URL: https://www.fifa.com/worldcup/news/more-than-half-the-world-watched-record-breaking-2018-world-cup. |
13 | FIFA 2018b, ‘Revision of the fifa / coca-cola world ranking’. Last access: 2020-06-28. URL: https://img.fifa.com/image/upload/edbm045h0udbwkqew35a.pdf. |
14 | FIFA 2020a, ‘The fifa women’s world ranking’. Last access: 2020-06-28. URL: https://www.fifa.com/fifa-world-ranking/ranking-table/women/. |
15 | FIFA 2020b, ‘The fifa/coca-cola men’s ranking’. Last access: 2020-06-28. URL: https://www.fifa.com/fifa-world-ranking/. |
16 | Gásquez, R. and Royuela, V. (2016) , The determinants of international football success: a panel data analysis of the elo rating’, Social Science Quarterly 97: (2), 125–141. |
17 | Hossain, H. S. , Khan, M. A. A. H. and Roy, N. (2017) , Soccermate: A personal soccer attribute profiler using wearables, in ‘Proceedings of the International Conference on Pervasive Computing and Communications Workshops’, IEEE, Kona, HI, USA, pp. 164-169. |
18 | Hubáček, O. , Šourek, G. and Železný, F. (2019) , Score-based soccer match outcome modeling-an experimental review, Athens, Greece, pp. 164-172. |
19 | Hvattum, L. M. and Arntzen, H. (2010) , Using elo ratings for match result prediction in association football’, International Journal of Forecasting 26: (3), 460–470. |
20 | Kempe, M. , Goes, F. R. and Lemmink, K. A. (2018) , Smart data scouting in professional soccer: Evaluating passing performance based on position tracking data, in ‘Proceedings of the 14th International Conference on e-Science’, IEEE, Amsterdam, The Netherlands, pp. 409-410. |
21 | Kharrat, T. , Peña, J. and Mchale, I. (2017) , ‘Plus-minus player ratings for soccer’, European Journal of Operational Research 726-736. |
22 | Kovalchik, S. (2020) , ‘Extension of the elo rating system to margin of victory’, International Journal of Forecasting. 13 pages. |
23 | Lasek, J. , Szlávik, Z. and Bhulai, S. (2013) , The predictive power of ranking systems in association football’, International Journal of Applied Pattern Recognition 1: (1), 27–46. |
24 | Lewis, M. (2003) , Moneyball: the art of winning an unfair game, W.W. Norton, New York, United States. |
25 | McHale, I. G. , A. Scarf, P. and Folker, D. E. (2014) , On the development of a soccer player performance rating system for the english premier league’, INFORMS Journal on Applied Analytics 4: (42), 329–340. |
26 | Paixão, P. , Sampaio, J. , Almeida, C. H. and Duarte, R. (2015) , How does match status affects the passing sequences of top-level european soccer teams?’, International Journal of Performance Analysis in Sport 15: (1), 229–240. |
27 | Pappalardo, L. , Cintia, P. , Ferragina, P. , Massucco, E. , Pedreschi, D. and Giannotti, F. (2019) , PlayeRank: data-driven performance evaluation and player ranking in soccer via a machine learning approach’, ACM Transactions on Intelligent Systems and Technology (TIST) 10: (5), 1–27. |
28 | Peeters, T. (2018) , Testing the wisdom of crowds in the field: Transfermarkt valuations and international soccer results’, International Journal of Forecasting 34: (1), 17–29. |
29 | Pollard, R. (1986) , Home advantage in soccer: A retrospective analysis’, Journal of Sports Sciences 4: (3), 237–248. |
30 | Schultze, R. S. and Wellbrock, C.-M. (2018) , A weighted plus/minus metric for individual soccer player performance’, Journal of Sports Analytics 4: (2), 121–131. |
31 | Stefani, R. and Pollard, R. (2007) , Football rating systems for top-level competition: A critical survey’,pages, Journal of Quantitative Analysis in Sports 3: (3), 21. |
32 | Sullivan, C. and Cronin, C. (2016) , ‘Improving elo rankings for sports experimenting on the english premier league’, Virginia Tech CSx824/ECEx424 technical report, VA, USA. |
33 | TotalSportek 2019, ‘25 world’s most popular sports (ranked by 13 factors)’. Last access: 2020-06-28. URL: https://www.totalsportek.com/most-popular-sports/. |
34 | Trombley, M. J. (2016) , Does artificial grass affect the competitive balance in major league soccer?’, Journal of Sports Analytics 2: (2), 73–87. |
35 | UEFA 2018, ‘Uefa country coefficients’. Last access: 2020-06-28. URL: https://www.uefa.com/memberassociations/uefarankings/country/#/yr/2018. |
36 | Worldatlas 2018, ‘The most popular sports in the world’. Last access: 2020-06-28. URL: https://www.worldatlas.com/articles/what-are-the-most-popular-sports-in-the-world.html. |


