
Analysing time pressure in professional tennis
Abstract
Taking advantage of space and time is a major focus of tennis coaching yet few statistical measures exist to evaluate a player’s spatio-temporal performance in matches. The present study proposed the time to net as a single metric capturing both space and time characteristics of the quality of a shot. Tracking data from 2017 Australian Open allowed a detailed investigation of the characteristics and predictive value of the time-to-net in 33,913 men’s and 19,195 women’s shots. For groundstroke shots, the majority of men’s and women’s shots have a time-to-net between 200 and 800 ms. The expected time to net was found to vary significantly by gender, shot type, and where in a rally it occurred. We found considerable between-player differences in average time-to-net of groundstrokes when serving or receiving, indicating the potential for time-to-net to capture differences in playing style. Time-to-net increased prediction accuracy of point outcomes by 8 percentage points. These findings show that time to net is a simple spatio-temporal statistic that has descriptive and predictive value for performance analysis in tennis.
1Introduction
Ask any tennis coach what distinguishes the most successful players in the sport from other players and they are likely to say it’s their ability to dictate “space and time” (Crespo and Miley, 1998). When coaches talk about space, they are referring to a player’s ability to maintain a position of advantage, occupying the part of the court that gives them good coverage while limiting the coverage of their opponent. Time is the term coaches use when they are referring to a player’s ability to play at a comfortable pace while disrupting the pace of their opponent.
Few statistical measures exist to assist tennis coaches and performance analysts in evaluating a player’s spatio-temporal performance in a match. In (Carvalho et al., 2013) authors propose a measure of positional advantage that is based on the distance between players during a rally. The positional advantage measure of Carvalho and colleagues has gone the furthest of any other published work to quantify the quality of player position (Carvalho et al. 2014). However, the measure ignores the timing or quality of shots, and much about its influence on outcomes remains untested.
There is a growing number of papers that are utilizing positional tracking data to advance the statistical analysis of professional tennis. These studies have focused on the prediction of shot and point outcomes (Wei et al., 2013; Wei et al., 2016) characterizing shots (Kovalchik and Reid, 2018; Mecheri et al., 2016), or describing the characteristics of matchplay (Reid, Morgan and Whiteside, 2016; Kovalchik and Reid, 2017). Metric development from tracking data has received less attention in the sports statistics literature.
Considering the lack of measures for describing spatio-temportal features of performance in tennis, the present paper sought to develop a useful spatio-temporal statistic from tracking data that could be easily interpreted by tennis coaches. The proposed statistic is the time to net, which measures the time from impact to when a shot crosses the net. The remainder of the paper describes the calculation of time to net and provides a detailed analysis of its characteristics and predictive value using a large dataset of shots played in professional tennis matches.
2Data description
This analysis was based on the matches from the 2017 Australian Open tournament. Our data included matches that were played on the courts equipped with the Hawk-Eye system (Owens, Harris and Stennett, 2003). The ball tracking system allows players to challenge line calls during matches, with Hawk-Eye calculating the ball bounce location with a mean error of 2.66 mm (Hawk-Eye Innovations). The full explanation is available from the Hawk-Eye website at: http://pulse-static-files.s3.amazonaws.com/HawkEye/document/2016/01/18/caa1c8ce-9a27-47f1-bf5e-777d2a9f5d13/ELC_Accuracy_&_Reliability.pdf (accessed 14 February 2020).
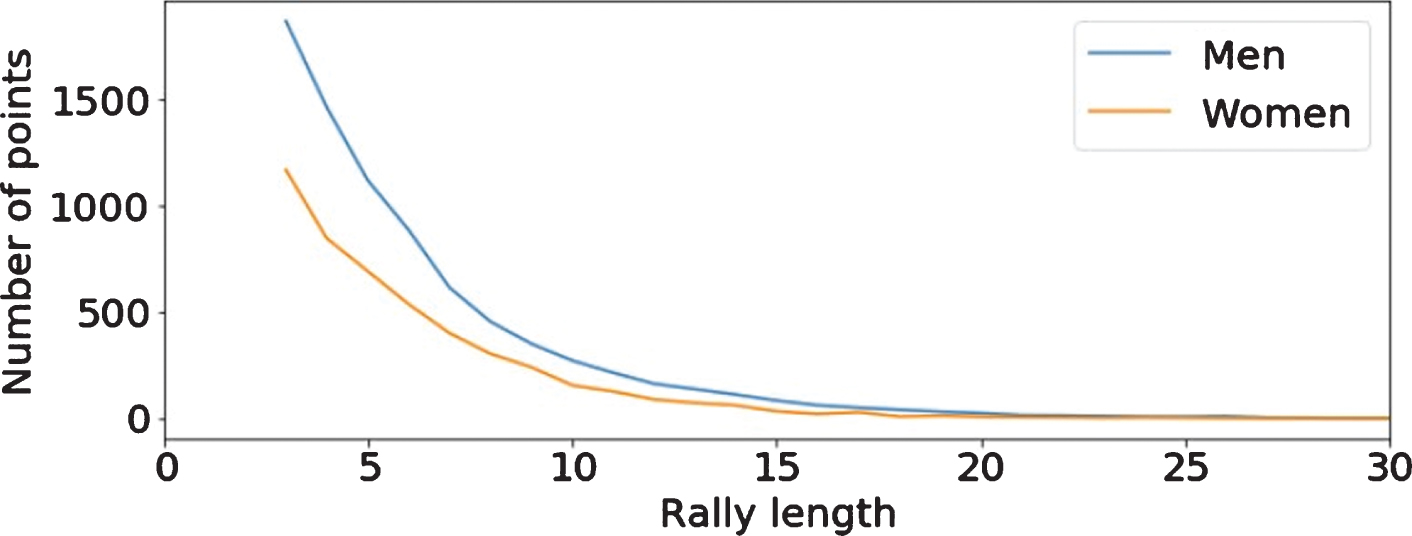
Our dataset included 66 men’s matches and 64 women’s matches. Since we wanted to analyze time pressure rallies, we included only points longer than 2 shots. For men, this included 8,026 points with all together 33,913 shots. For women, this included 4,834 points and 19,195 shots. The reason for having so much more points for men is because men play best of 5 sets compared to women’s best of 3.
Figure 1 shows how many shots (rally length) were in all points. We can see that the longer the rally, the lesser the number of points.
Fig. 1
Number of points based on rally length.
For each shot in addition to player name, shot type and shot number in a rally; we also calculated the time to net. This is the time from shot impact to when the ball passes over the net, and it is the portion of the time the ball occupies a player’s side of the court and thus is completely under their control.
3Measuring time pressure
To measure time pressure, we used the previously described time to net. Of course, if this time to net is small then the opponent will have less time for his shot and thus he will be more under pressure.
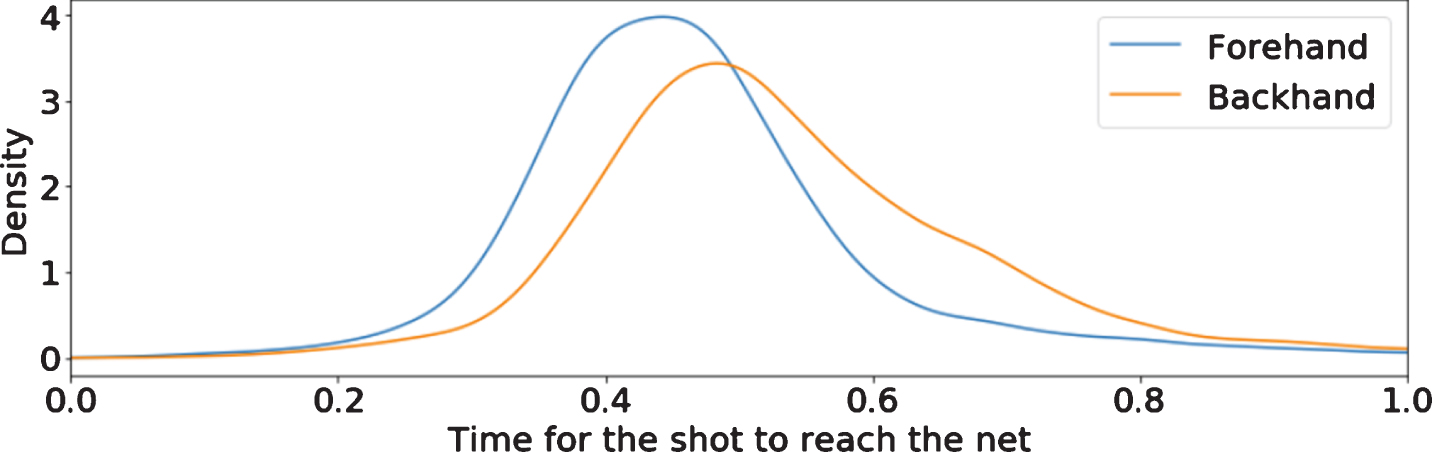
First, we compared shots, focusing only on forehands and backhands and left other shots out of this analysis. We can see a distribution of time to net for forehands and backhands for the men in Fig. 2. We can see that the forehand is clearly the dominant shot which is used to hit the ball faster, thus producing lower time to net.
Fig. 2
Time to net for the men’s game.
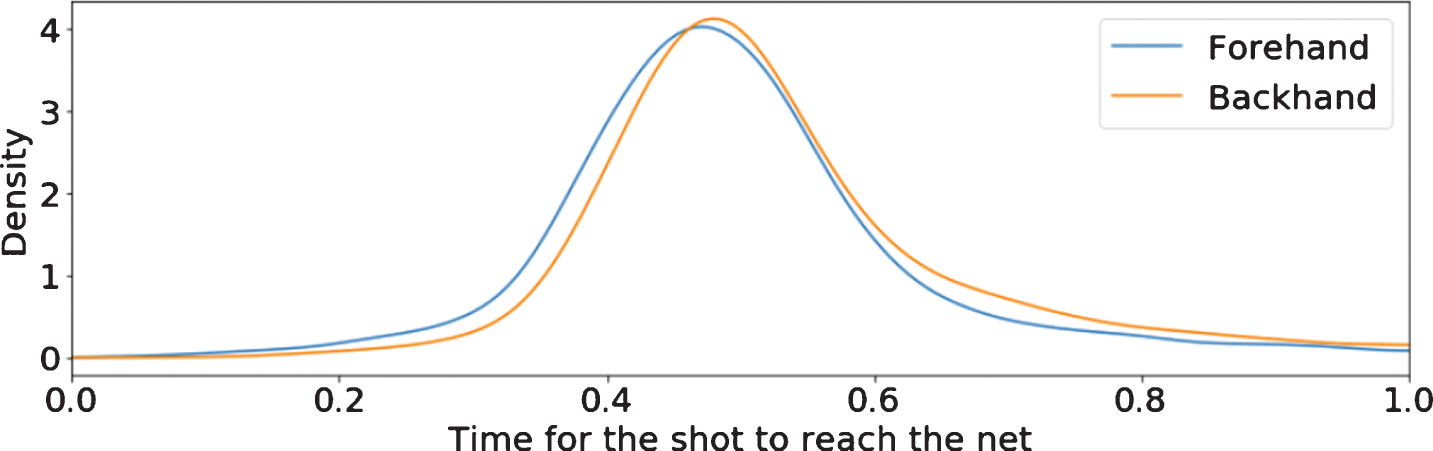
In women’s tour, we can see in Fig. 3 that the time to net for forehand is similar then it is for backhand. The reason for that is probably in the strength where women cannot produce much more power with the same accuracy with one hand.
Fig. 3
Time to net for the women’s game.
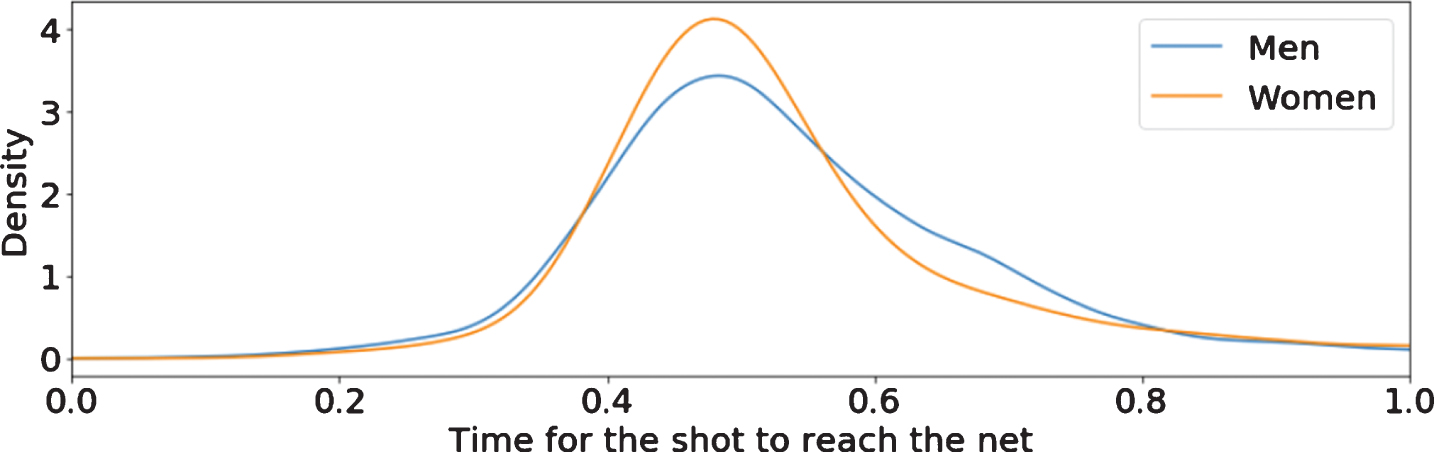
To compare men’s and women’s distributions, we also draw time to net distributions for backhand shots (Fig. 4). We can see that time to net for the most shots is very similar. We can see a slight difference in variation, where for the men, the larger amount of shots has lower time to net. These shots are slice shots which are slower and are used far more in men’s tour than in women’s.
Fig. 4
Time to net for backhand shots for both men’s and women’s game.
Next, we focused on exploring how time to net changes with the length of the rally and how serve influences the time to net. So, we further divided data to only shots from server and shots from returner to see how the serve influences the time to net and how long this influence lasts. The Fig. 5 shows the average time to net (and the 95% confidence interval) for shots made by server and returner. On the x-axis we have shot number, so we can draw both averages from server and returner nicely on one graph. The average in this case refers to i.e. all 4th shots in a rally. If rally is shorter, and there is no 4th shot, we do not include this point. Since here, we are not interested in time to net for serve and return the graph starts with shot number 2.
Fig. 5
Average time to net for different rally lengths for shots made by server and returner for men’s game.
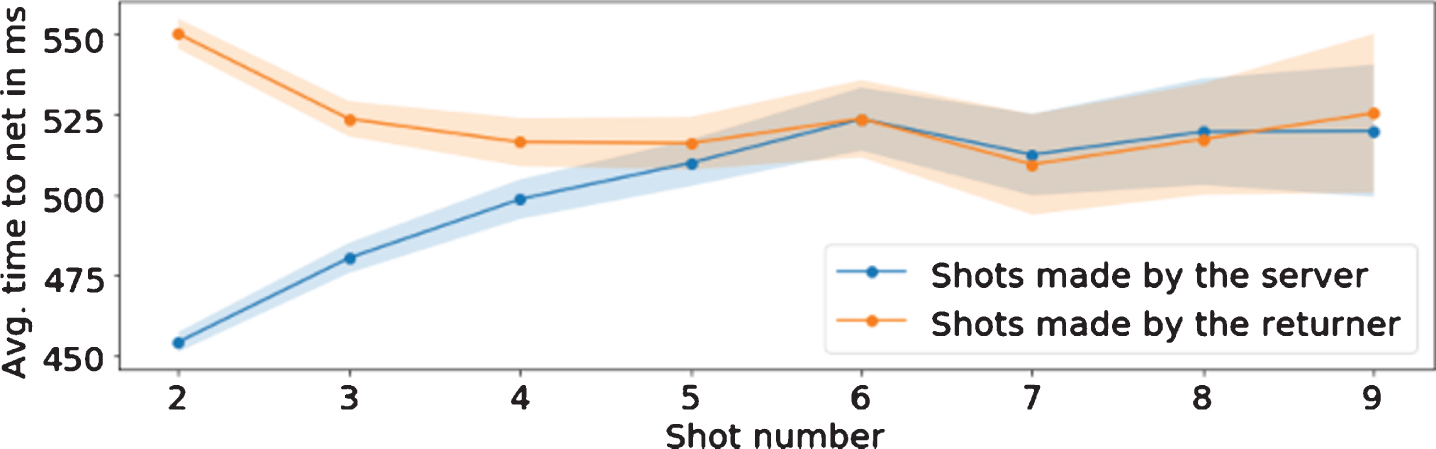
As we can see, by the 6th shot (rally length = 11 or 12) the time to net for the server and returner comes together. So, this means that the advantage the server is gone when the rally length is more than 10.
For the women’s tour, the average times to net for server and returner with confidence intervals can be seen in Fig. 6.
Fig. 6
Average time to net for different rally lengths for shots made by server and returner for women’s game.
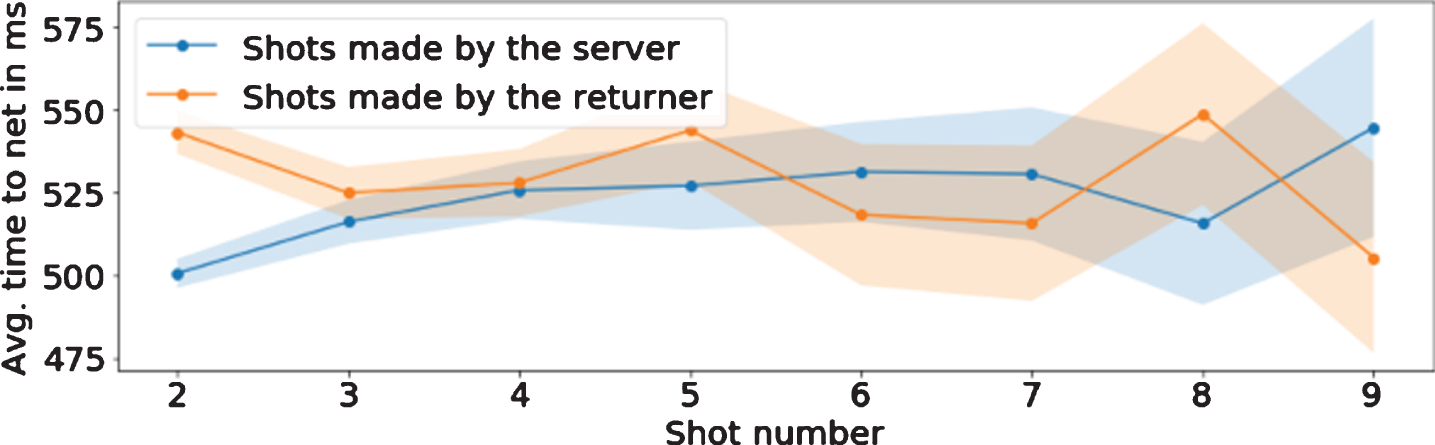
As we can see, the average time to net for server and returner comes together around 4th shot (rally length 7 or 8). The lines are not together further on as with men, due to the smaller number of data points for longer rallies. So, some “special” points can move the line a bit.
To take a different look at server influence, we calculated the percentage of winners’ players hit on average for each shot in a point. The idea here is that if you have a good serve you would get weaker returns and thus can hit more winners after the serve. And as the rally continues the advantage from the good serve would be gone and the percentage of winners would lower and would become similar for server and returner. These graphs for men’s and women’s game can be seen in Figs. 7 and 8.
Fig. 7
Percentage of winner shots on each shot number for the men’s game.
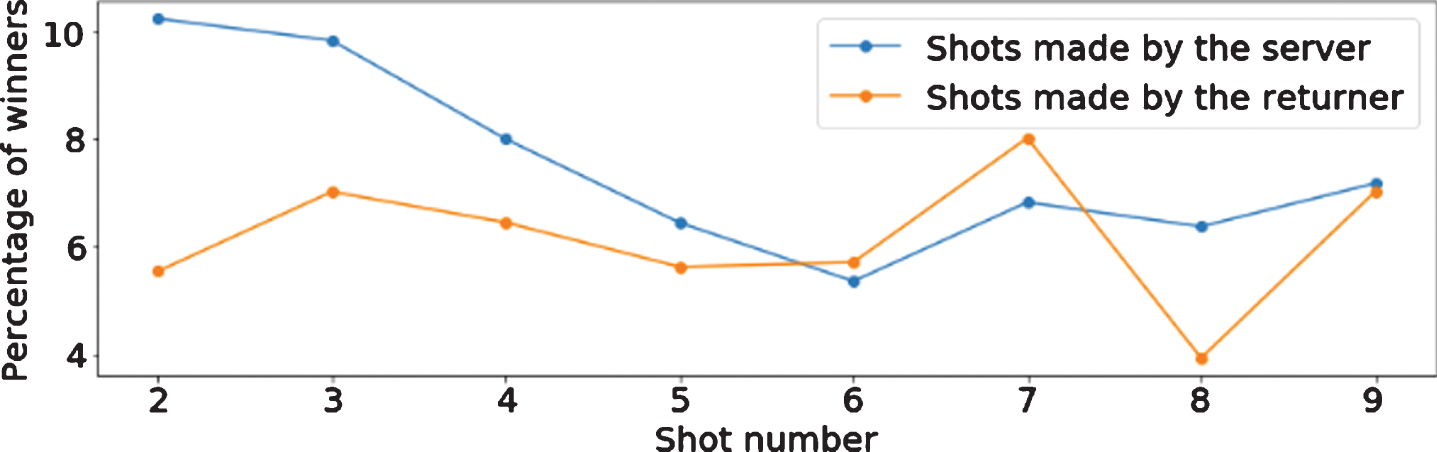
Fig. 8
Percentage of winner shots on each shot number for the women’s game.
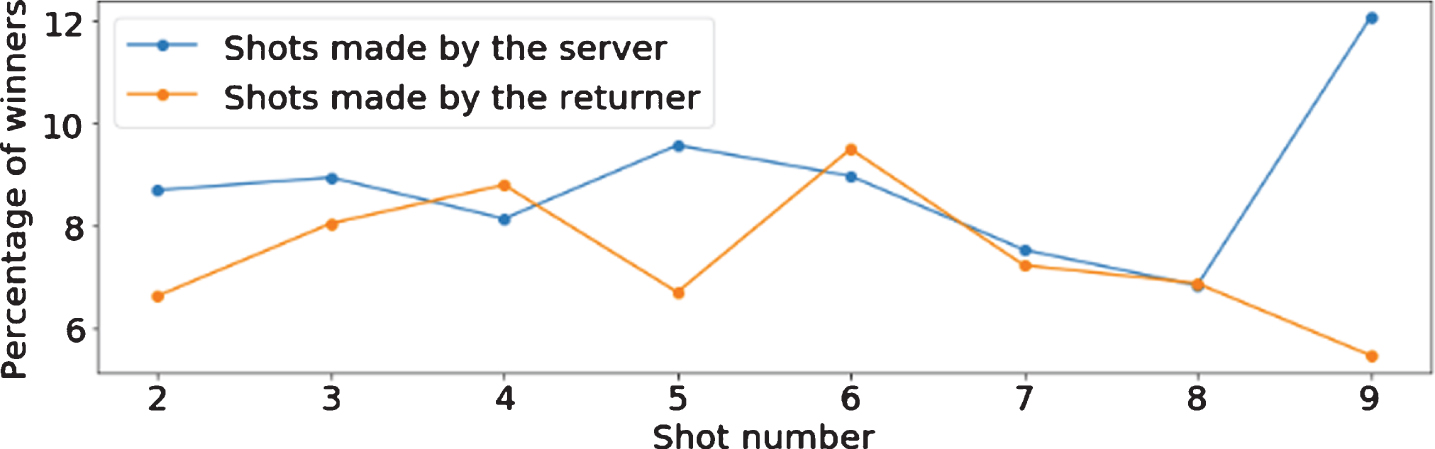
We can see that similarly as with average time to net, the percentage of winners gets even when rally length is more than 10 (shot number 5-6). And with women, similarly when rally length is more than 7. So, it is fair to say, that the influence of the serve can be felt for the next 4 shots after serve in men’s competition and for the next 2 shots in women’s. This confirms that the men are serving relatively better and that serve is much more of an advantage in men’s competition.
Next, we focused on the last shots in a point. We wanted to know if the last shots in average have different times to net then the shots that are not the last ones in a point. The graphs for men can be seen in Fig. 9 and for women in Fig. 10.
Fig. 9
Average time to net for last and not last shots in a rally for the men’s game.
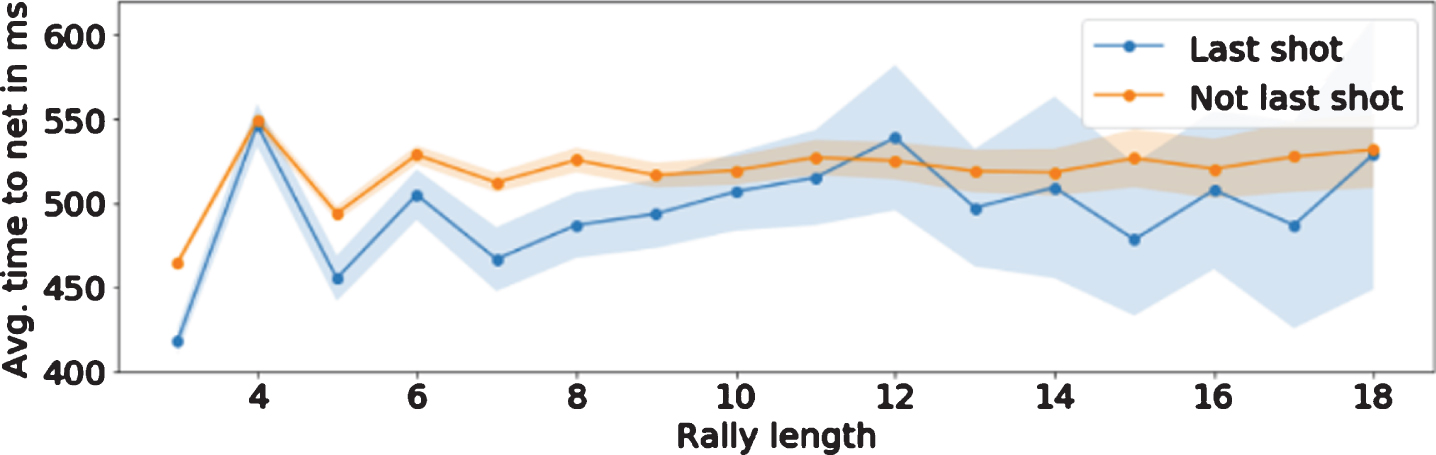
Fig. 10
Average time to net for last and not last shots in a rally for the women’s game.
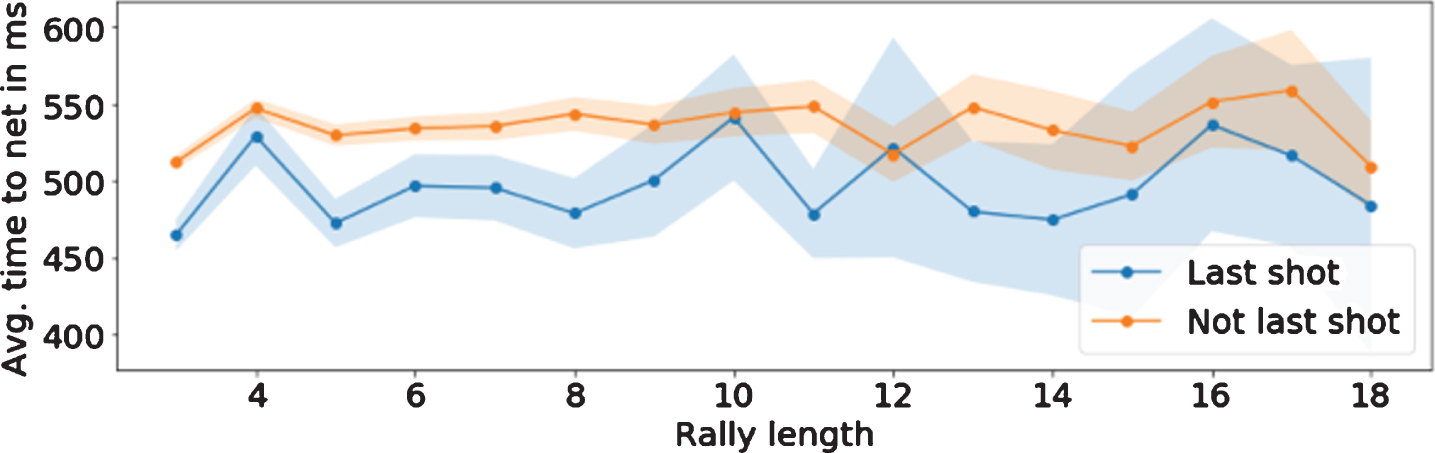
In both cases, we can see that there is a difference if a shot is the last shot of the point or not. The difference is expected, since winners (or winner attempts) are usually faster shots, thus have lower time to net. The difference is somewhat similar and mostly independent of the rally length, so it is not influenced by the serve. Interestingly in women’s game the difference is a bit larger. We can also see especially for the men’s the difference in time to net for the first few shots, because of the serve influence.
4Player specifics
In this section, we focused on how time to net characteristics vary from player to player. Estimates of the expected time to net for each player was obtained from a linear mixed model with a player random effect, which was fit separately for points on serve and points on return. To verify the significance of the results, we used likelihood ratio tests to derive measures of statistical significance and bootstrap resamples for 95% confidence intervals.
The analyses revealed notable between-player variation in average time to net characteristics. For men, the fastest averages when serving were under 400 ms, while the slowest times were over 530 ms; when receiving times were systematically slower but the fastest and slowest averages were still separated by more than 100 ms (Figure 11). Indeed, men took 50 ms less time to net on average when serving than when receiving (P < 0.001).
Fig. 11
Player estimates for average time-to-net (95% confidence interval) for men’s game on serve and return, ordered by average on serve.
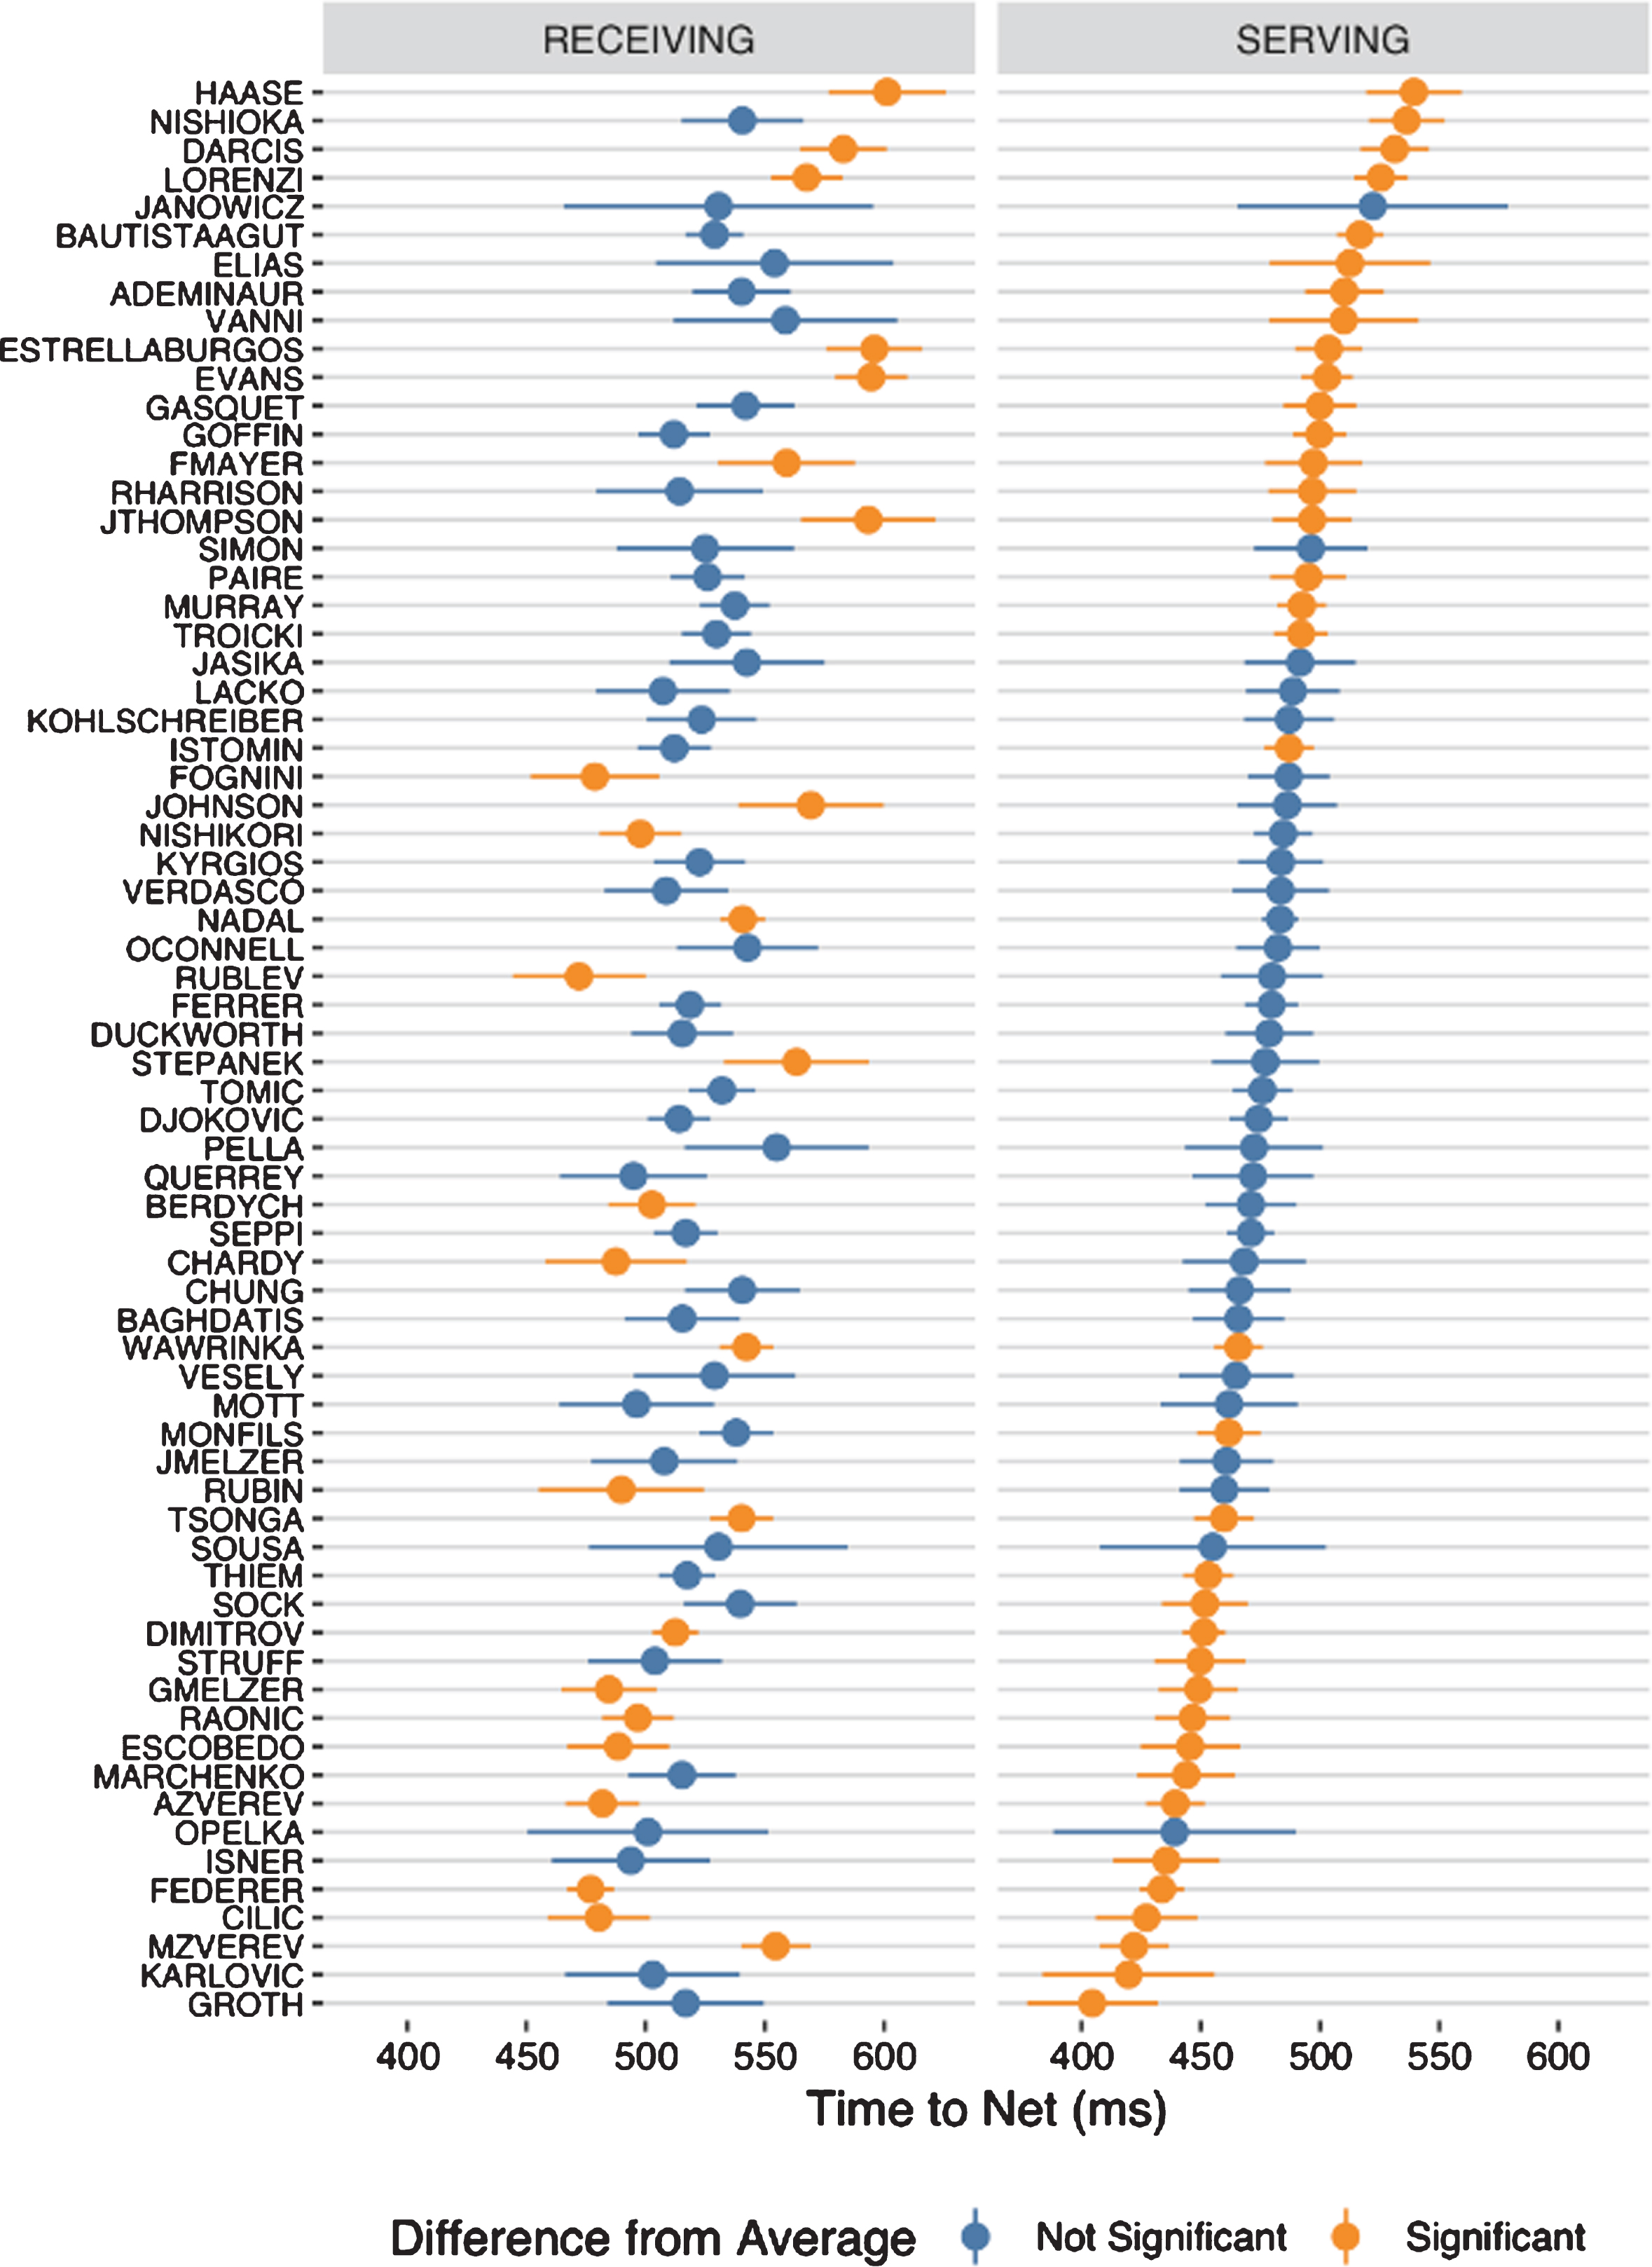
Players who were significantly faster to get to net on serve and return included Marin Cilic, Roger Federer, and Alexander Zverev. A number of the fastest on serve were not significantly different from average on serve, like Sam Groth and Ivo Karlovic; while Mischa Zverev was significantly slower than average when receiving.
We observe more consistency in the time to net characteristics among players that are slower than average on serve. Specifically, players who were significantly slower than average on serve, such as Robin Hasse, Steve Darcis, and Paolo Lorenzi, also tended to be similarly slower than average when receiving.
The time difference between the fastest and slowest time to net for female players was also more than 100 ms, revealing comparable between-player variation as was observed for the men. However, unlike male players, the time to net characteristics for women were less dependent on serve (Figure 12). Women were 18 ms faster to net on average when serving than when receiving (P < 0.001).
Fig. 12
Player estimates for average time-to-net (95% confidence interval) for women’s game on serve and return, ordered by average on serve.
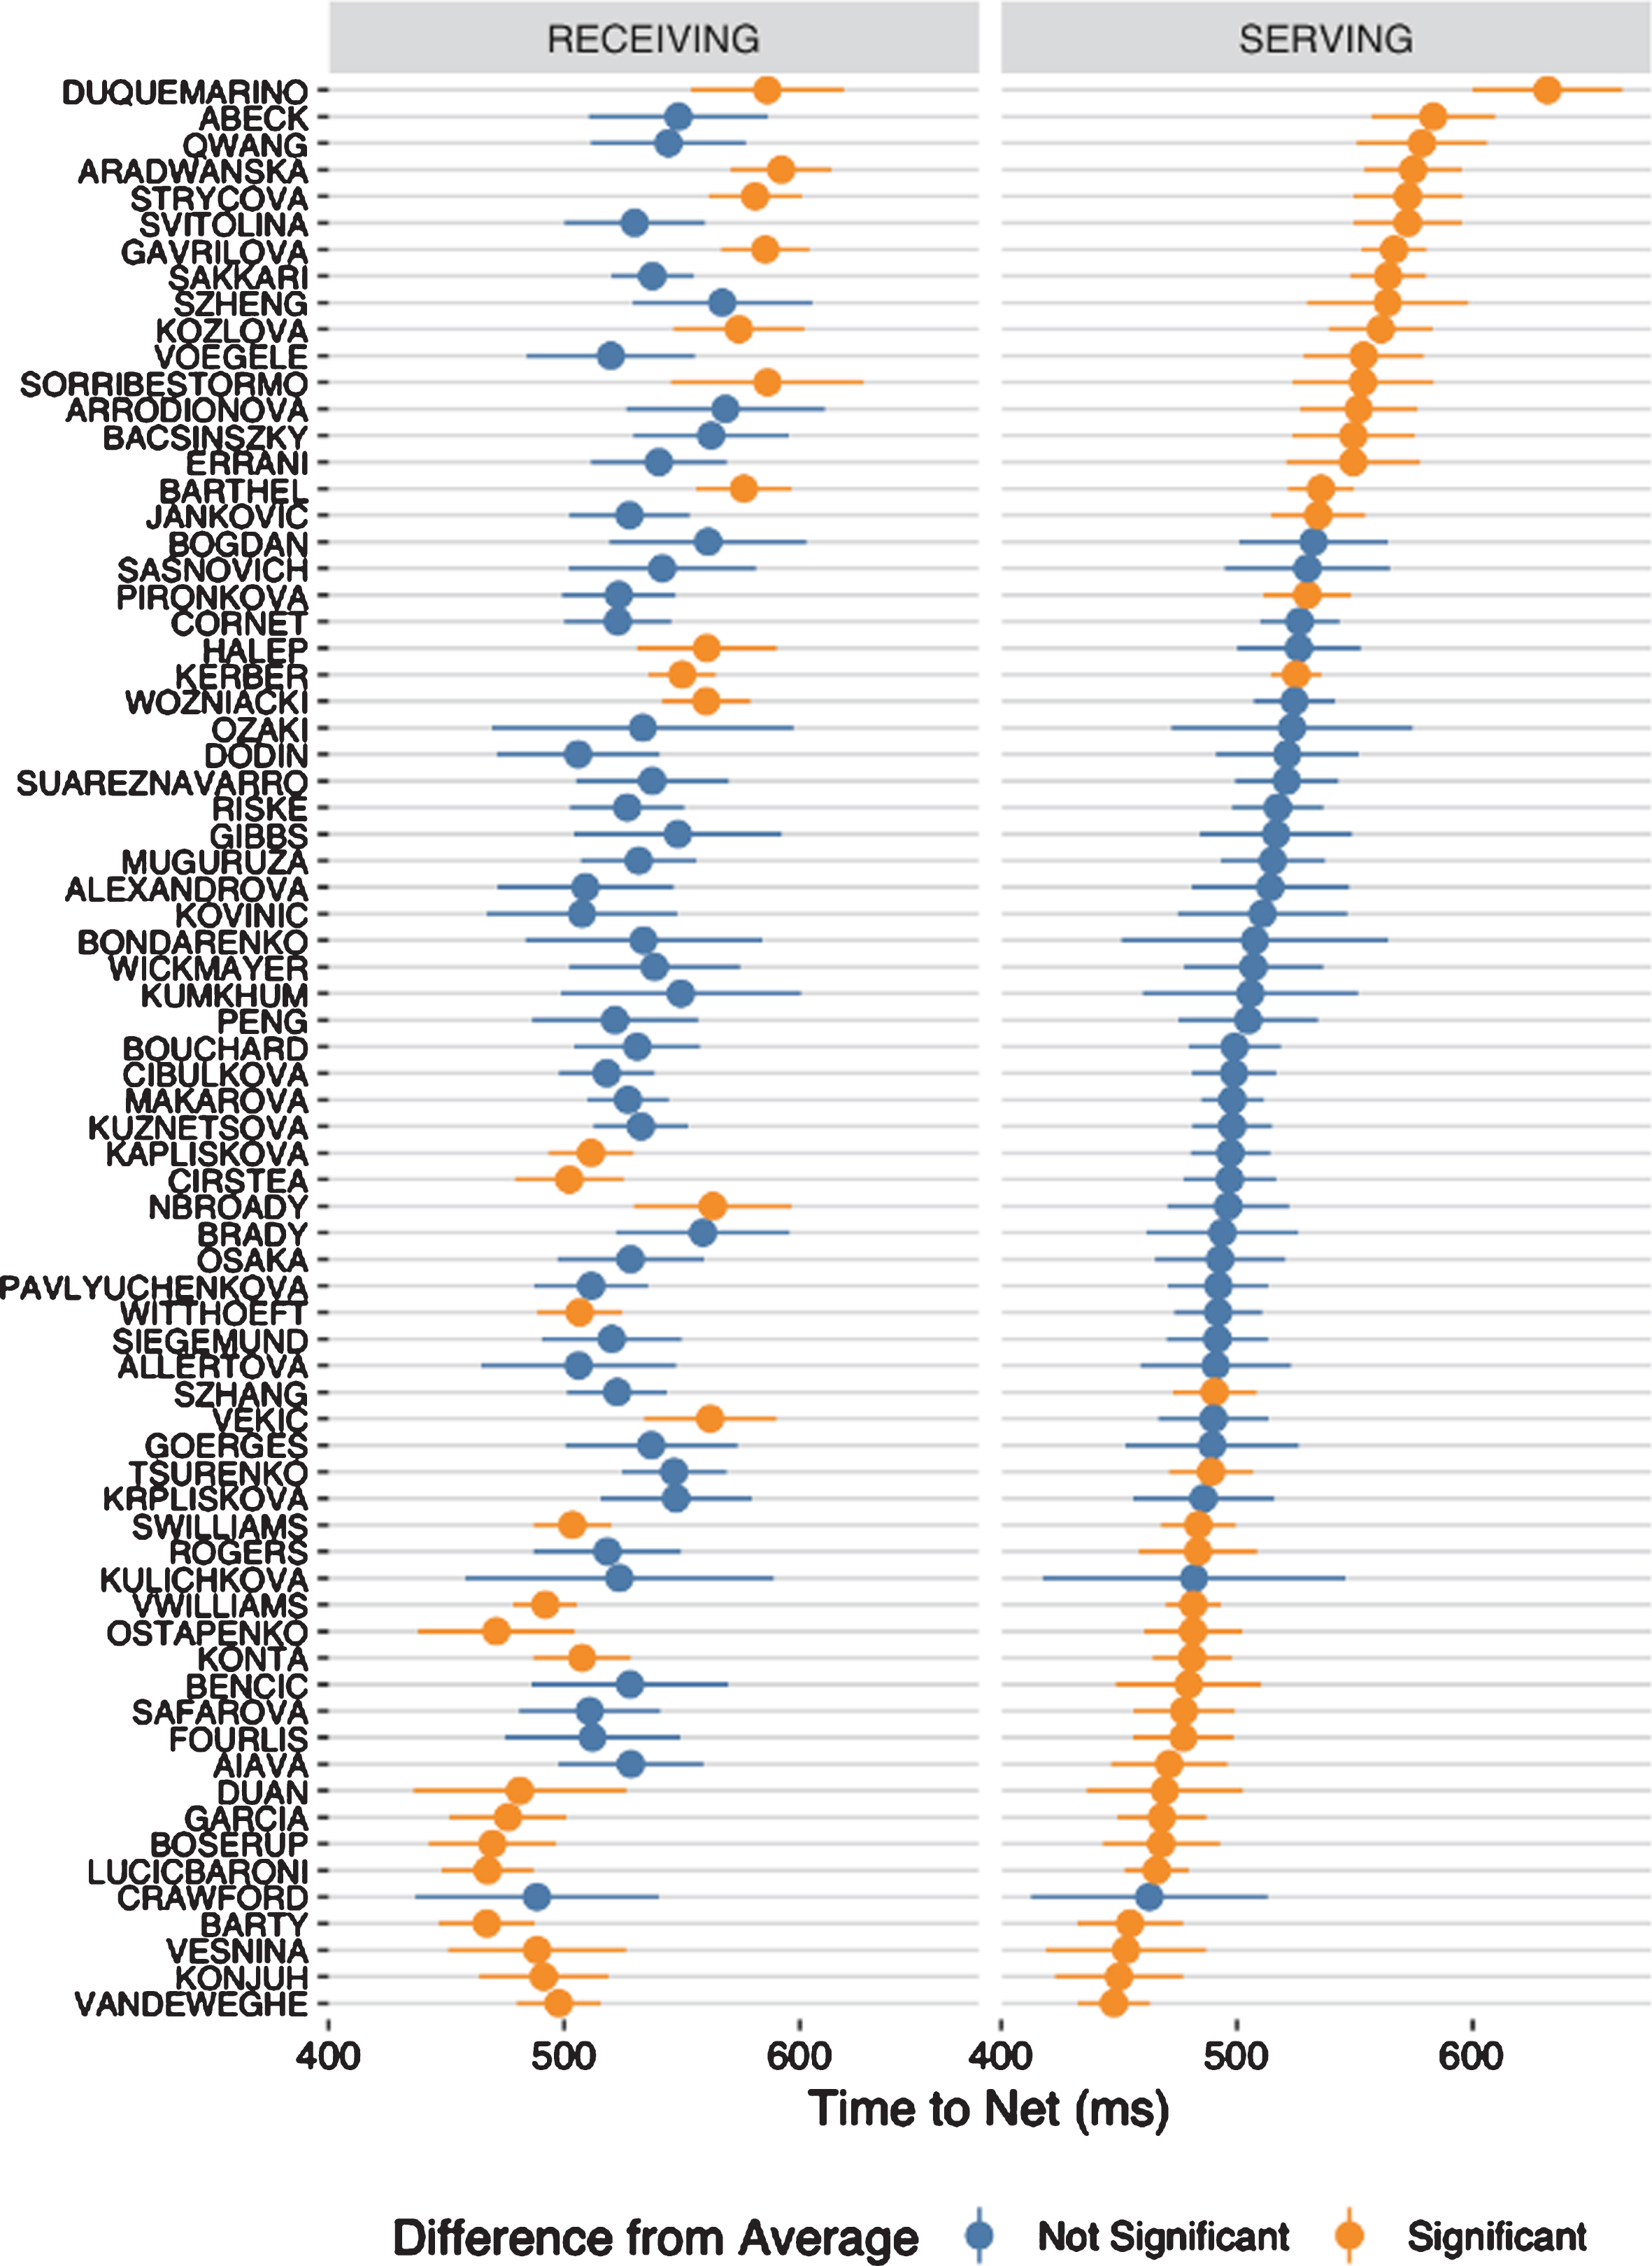
Several women who had the fastest time to net on serve and return were CoCo Vandeweghe, Ana Konjuh, Elina Vesnina and Ashleigh Barty. These players had time to net averages under 450 ms when serving and under 500 ms when receiving.
Players who exhibited the slowest times to net on serve and return, included Mariana Duque-Marino, Agniezska Radwanska, and Barbora Strycova. The average time to net for this group of players was 570 ms or slower when serving and 580 ms or slower when receiving.
5Predicting point endings with time to net
In addition to all the presented stats, we also wanted to look at the sequence of times to net for each shot in the rally and then predict if the point would end with the winner or with the error. The tracking data allows us to identify shots that are clean winners and shots that are errors, but it does not include subjective classification of errors, so we were not able to separate between ‘unforced’ and ‘forced’ errors. If the prediction accuracy would be high this would indicate that just by looking at the sequence of times to net, we could predict the point endings. Also, accurately predicting point outcomes by just looking at the time to net sequences, would indicate that time to net is an (very) important factor for players to focus on.
If we look at the characteristics of time to net for the last shot in the rally the average time to net for winner is 380 ms for men and 390 ms for women and the average time to net for error is 530 ms for men and 540 ms for women. This is somewhat as expected, because if you want to hit a ball so that the opponent doesn’t get to the ball, the shot must be fast and thus it has a lower time to net.
Another thing that obviously comes to mind is to calculate how difference between last shot and opponents last shot influences the point outcome. The idea here is that for hitting winner you usually need to first hit one good shot and then after opponent hits back weaker shot with higher time to net you have more time and can hit your last shot faster (and more accurate) and thus hit a winner. If we calculate the average difference for last shots, we get the average time to net for winners -270 ms and for errors 30 ms. For women, we get -290 ms for winners and 33 ms for errors. This is expected and again the results are very similar for men and women.
These two features may sound like the most descriptive ones, but we calculated also additional features that may help to get better predictions. So, for the machine learning, we used the following set of features:
– time to net for last shot
– time to net for before last shot
– time to net for before last shot of the player that hit the last shot
– mean and median time to net over all shots in a point for each player
– standard deviation for time to net over all shots in a point for each player
– difference between last time to net and time to net for the last shot from the opponent
– difference between last time to net and time to net for the before last shot from the opponent
– for each player sum of differences between time to net for all shots
– for each player for each shot difference between time to net and mean (median) time to net for the entire point
– shot number in a rally
The features that include differences in time to net over the whole point are included to possibly detect patterns that occur between two players where one player is an attacker and constantly has lower time to net compared to the defensive player. A feature with standard deviation is included to detect a type of player that mixes his time to net a lot, like Federer that plays slow slices combined with fast shots.
So, having these all additional features could increase the possibilities of model recognizing different types of play or specific players and then use this information with last time to net differently, as it would without this knowledge. We know that there are styles of play that are hard to describe with just simple features, but for some players, these features could be useful.
We build 2 separate prediction models, one for men and one for women. To build and test the prediction models, we used stratified 10-fold cross-validation. This means that we randomly separated the dataset to 10 pieces, with each piece having the same class distribution. Then we used 9 pieces to train the model and the remaining piece to test it. We repeated this for each of 10 pieces and averaged the results we obtained on the test set.
For the prediction model, we used the Extreme Gradient Boosting (XGB) algorithm (Chen, He and Benesty, 2015). The algorithm is known for its proven efficiency, speed and flexibility and was therefore used many times at Kaggle tournaments by winning teams (Mangal and Kumar, 2016; Sheridan., 2016). We used 100 trees as a parameter for XGB and left other parameters with default. We know that by optimizing parameters we could maybe increase the prediction accuracy further by a small margin, but this was not the scope of this paper.
To put results into a perspective, we first used a dummy classifier. This is a very simple classifier that does not take into account any features, but just always predicts the class that is most frequent. We started with predicting men’s point endings first. So, the classification accuracy with the dummy classifier was 66.1%. To see how much accuracy improves with just time to net, we used only this one feature to train the model. The accuracy we obtained was 73.6%. Next, we added the feature describing the difference between the last shots and with these two features we got the classification accuracy of 74.8%. Then we added all the other features and calculated the final accuracy and it was 75.1%.
For the women’s points, we did the same procedure with no (dummy classifier), one, two and all features. The results are presented in Table 1.
Table 1
Classification accuracies for different prediction models for men’s and women’s points
| Dummy | Time to net | 2 features | All features | |
| Men’s | 66.1% | 73.6% | 74.8% | 75.1% |
| Women’s | 65.2% | 73.0% | 75.0% | 75.3% |
We can see that the results for predicting point endings on men’s points are very similar to results obtained on women’s points. First, the dummy classifier indicates that approximately two out of three points end with an error. So, if the model predicts every point as the error it gets correct approximately two-thirds of the time. Then with just using feature time to the net we are able to increase the prediction accuracy by almost 8 percent. By adding the difference feature we can see that the accuracy increases by 1.2% with men and 2% with women. This indicates that this feature holds some additional prediction value. On the last step, we used all the remaining features and build the best model we could with all the features available. We did manage to increase the prediction accuracy a little bit but this clearly indicates that the other features do not hold much new information about how the point will end. This means that the most important information about the point ending is in the last two shots. Of course, having additional features like player positions, ball speeds and others would improve the classification accuracy, but in this paper, we focused only on the time to the net and its characteristics.
6Conclusion
In this paper, we introduced the time to net, the time from the shot impact to the time when the ball passes over the net, as a statistic that captures a player’s spatial and temporal advantage when making a shot. We used this feature to analyze differences between shots and genders, determine how it influences the shot outcomes and how it differentiates between the different playing styles. For our work, we used Hawk-Eye data from the 2017 Australian Open tournament for both men’s and women’s matches. The main findings can be summarized as following:
– Men’s forehands have lower time to net then backhands and women’s forehands and backhands have similar time to net
– Compared to women’s shots, men’s forehand shots had a lower time to net, but men’s backhand shots had a similar time to net
– Average time to net gets longer with rally length, due to diminishing effect of the serve and return
– The server advantage for men vanishes approximately by the 10th shot of the rally. With women, where the serve is not that much of a weapon, the advantage vanishes around the 7th shot of the rally.
– The average time to net for the last shot in a rally is lower than for the other rally shots and this is independent of the rally length
– Player specifics identify which players have lower (higher) average time to net on serve, return or both. With these results players could be grouped in to several playing styles.
– Using machine learning, we build several models for predicting the point outcomes using different features calculated from the sequence of time to nets for each shot. We showed which features are the most descriptive and what accuracy can be obtained using just time to net features.
Acknowledgments
We are grateful to Tennis Australia for providing the player tracking data that made this research possible.
References
1 | Carvalho,J. , Araújo,D. , Travassos,B. , Esteves,P. , Pessanha,L. , Pereira,F. and Davids,K. , (2013) , Dynamics of players’ relative positioning during baseline rallies in tennis, Journal of Sports Sciences, 31: (14), 1596–1605. |
2 | Carvalho,J. , Araújo,D. , Travassos,B. , Fernandes,O. , Pereira,F. and Davids,K. , (2014) , Interpersonal dynamics in baseline rallies in tennis, International Journal of Sports Science & Coaching, 9: (5), 1043–1056. |
3 | Chen,T. , He,T. and Benesty,M. , (2015) , “Xgboost: extreme gradient boosting.” R package version 0.4-2, pp. 1–4. |
4 | Crespo,M. and Miley,D. , (1998) , Advanced Coaches Manual, International Tennis Federation (ITF Ltd), London. |
5 | Kovalchik,S. and Reid,M. , (2017) , Comparing matchplay characteristics and physical demands of junior and professional tennis athletes in the era of big data, Journal of Sports Science & Medicine, 16: (4), 489. |
6 | Kovalchik,S. and Reid,M. , (2018) , A shot taxonomy in the era of tracking data in professional tennis, Journal of Sports Sciences, pp. 1–9. |
7 | Mangal,A. and Kumar,N.. , (2016) , “Using big data to enhance the bosch production line performance: A Kaggle challenge.” Big Data (Big Data). |
8 | Mecheri,S. , Rioult,F. , Mantel,B. , Kauffmann,F. and Ben-guigui,N. , (2016) , The serve impact in tennis: First large-scale study of big Hawk-Eye data, Statistical Analysis and Data Mining: The ASA Data Science Journal, 9: (5), 310–325. |
9 | Owens,N.E.I.L. , Harris,C. and Stennett,C. , Hawk-eye tennis system, 2013, in: 2003 International Conference on Visual Information Engineering VIE 2003, pp. 182–185. |
10 | Reid,M. , Morgan,S. and Whiteside,D. , (2016) , Matchplay characteristics of Grand Slam tennis: implications for training and conditioning, Journal of Sports Sciences, 34: (19), 1791–1798. |
11 | Sheridan,R.P. , (2016) , “Extreme gradient boosting as a method for quantitative structure–activity relationships.” Journal of Chemical Information and Modeling, 56: (12), 2353–2360. |
12 | Wei,X. , Lucey,P. , Morgan,S. and Sridharan,S. , (2013) , Sweet-spot: Using spatiotemporal data to discover and predict shots in tennis, MIT Sloan Sports Analytics Conference, Boston, MA. |
13 | Wei,X. , Lucey,P. , Morgan,S. , Reid,M. and Sridharan,S. , (2016) , The thin edge of the wedge: Accurately predicting shot outcomes in tennis using style and context priors, MIT Sloan Sports Analytics Conference, Boston, MA, USA, pp. 1–11. |


