
Setting final target score in T-20 cricket match by the team batting first
Abstract
The purpose of this paper is to develop a deterministic model for setting the target in T-20 Cricket by the team batting first. Mathematical tools were used in model development. Recursive function and secondary data statistics of T-20 cash rich cricket tournament Indian Premier League (IPL) such as runs scored in different stages, fall wickets in different stages, and type of pitch are used in developing the model. This model was tested at 120 matches held IPL 2016 and 2017. This model had been proved effective by comparing with the models developed earlier. This model can be a useful tool to the stakeholders like coach and captain of the team for adopting better strategy at any stage of the match. For future research, this model can be useful in framing a regulation work by policy makers at both national and international cricket board by deriving the target score during interruptions.
1Introduction
Cricket is one of the most popular sports in the world. Mostly this game is played in commonwealth countries as it is originated in UK. It is a game played between two teams of eleven players each. With the advent of optimal modeling in sports, setting the target score in T-20 cricket game has been considered as a challenging problem. The game of cricket is played in three formats –Test Matches, ODIs and T20 s. This paper focusses research on T20 matches, the most popular format of the game in the recent times by developing a mathematical model for setting the final target score of an Indian Premier League (IPL) cricket match for a team batting first. In an IPL tournament there are 8 teams playing and each team play with remaining all teams two times. All league matches are held at one of the team’s home venue. For certain matches, home pitches may not play a bigger role but toss plays as a crucial factor in deciding the winner of the match. This may be due to the fact that there may exist uncertainty in setting a right target for the team batting second. The team batting first will try to score as many runs as possible in their 20 overs in order to set a target. The team batting second has an advantage of knowing the exact target and of course their strengths as well as opposition bowling strengths. They need to chase the target in order to win the game. For years while watching limited overs cricket, we have seen projected scores at different intervals being displayed on television screens. Projected scores are completely based on runs scored and looking at different totals at the end of an innings, using various run rates. Such projected scores can also guide the batting/bowling side in changing their tactics in the remaining overs for winning the match. The Duckworth-Lewis model (1998) and the Clarke model (2006) bring out the findings that the total score is strongly affected by the stage and state of the match, i.e. the wickets and the overs remaining. They recommend their projected scores as the ideal levels that the team should attain in the match for success and winning.
IPL is a very popular tournament supported by Board of control for cricket in India (BCCI). Players participating in the tournament are from India as well as from other countries but limited to few players.
2Related work
In the recent past, many researchers have applied tools related to mathematics, Statistics and operations research in sports viz. (Sphicas, G.P., et al., 1976), (Croucher, J.S., 1982), (Hayes, M., et al., 1984), (Clarke, S.R., 1988), (Duckworth, F.C., et al., 1998). In the last two research papers it relates to one day cricket matches where each team will play maximum 50 overs. Clarke, S.R. (1988) had used optimal scoring rates to define a strategy for the team whereas Duckworth et al. (1998) has been innovated a formula applicable to interrupted matches. Latter’s work is meant for policy makers of international cricket council to regulate the rules for the game in case of interruptions of the game due to weather or some other external disturbances. Many researchers later have extended, reviewed or even modified these works to other form of cricket viz T-20.
Munir Fahad, et al. (2015) illustrated forecasting system based on the data of previous matches played between teams to predict results whilst T20 match is in progress. For example a decision can be taken during the match like the right players to send for batting or right bowlers go for bowl in middle of game by using the tools multiple regression and decision tree predictive algorithms. Shah Parag (2017) used Duckworth-Lewis method to predict winning team while match was in progress. Clarke S. R. and Norman J. M. (1998) have tried to found out optimal policy and value of objective function using simple dynamic programming for the weak batsman with aim of maximize number of balls for longer partnership in the match and gave him strike at the second last or last ball of the over by taking run because better batsman could score runs to the first ball of new over. Ananda B. W. Manage, et al. (2013) analyzed performance of T20 cricket world cup players based on runs, wickets and combinations of it means that considering the attempting innings and throwing overs in the tournament.
Tim B. Swartz, et al. (2009) developed a simulation methodology and Bayesian latent variable model which provide batting outcome probabilities enable to determine optimal strategies during innings and team to easily investigate outcomes from making changes in order of batting and bowling in the ODI. Bailey, M.J. and Clarke, S.R. (2006) established predicting match outcomes through multiple regression and used Duckworth–Lewis approach to the generation of runs in case of interruption of the ODI matches. Davis Jack, et al. (2015) developed simulator for T20 cricket matches using a probabilities of the batsman, the bowler, the number of overs consumed, home team advantage, target score (for second inning team) and number of wickets fall.
While Kalgotra Pankuch, et al. (2013) developed several predictive models for selection of players for Indian Premier League (IPL) based on performances and they have validated it through comparing misclassification rate for the optimal model, although, this model assist to decision makers during auction of players for team to set their salaries, and Satao Preeti, et al. (2016) built a system that it could be predicted score of the T20 cricket players by using k-means clustering algorithm. For a different game like basketball, Lutz Dwight (2012) and Cheng Ge, et al. (2016) have contributed in developing models.
Sharp et al. (2011) described method of player performances based on their abilities and then used an integer programming to determine the optimal team based on player’s performance in twenty20 cricket. Passi and Pandey (2018) predicted run scored by batsmen and wicket taken by bowlers which were based on players stats and characteristics, and obtained high prediction accuracy using random forest classifier among other classifiers in ODI. When T20 match results were predicted by Prakash Deep, et al. (2016) whose modeling the individual players’ potential into cumulative batting and bowling scores through Deep Performance Index (Prakash Deep, 2016). Also, during the second innings a model gives outcome of the match regards to winning at the end of each over represented by Viswanatha S. et al. (2017). An explored that an optimized model based on features of team and players for the prediction T20 cricket match results and was preeminent outperformed a gambling industry benchmark (Kampakis Stylianos and Thomas William, 2015). Modeling hazard function through Bayesian analysis used batsmen career statistics to make prediction of cricketers who would have batting abilities of the next opening Test match (Stevenson and Brewer, 2017). Also, Sharma (2013) and Shah (2017) established that batting capabilities have been dominated over bowling capabilities of T20 cricket using factor analysis. Bhattacharjee, et al. (2016) proposed method to find effect of power play overs in T20 match outcomes and identified that for better team performance in batting and bowling skills which leads to winning the match. Duckworth and Lewis (1998) introduced a method for setting revised fairer target for team batting second in cricket matches that are shortened due to weather interruptions through available team resources as such overs and wickets, given scored from any combination of these resources to win. To access the performance of batsmen and bowlers using new statistics viz. ratio of runs scored to consume the resources which was developed method by Swartz (2003) and these resources was demonstrated by Duckworth and Lewis (1998) in context revised target during interruption of one day cricket. A D-L methodology created alternative measure for evaluating of players performance proposed by Lewis (2005) rather than traditional measures. Brooker and Hogan (2011) discovered model that estimated first inning scores of ODI cricket based on conditions such as nature of pitch, size of ground and weather circumstances with the given amount of risk and it was alternative to Duckworth–Lewis method for predicting scores of match. They have been used Monte-Carlo method and Bayes’ approach to estimate parameters of functional form of model of the first inning scores. From these authors’ research project, Winning and Score Prediction (WASP) tool was introduced by Sky Sport New Zealand on November 2012 during Auckland’s HRV Cup Twenty20 game against Wellington. Also, Preston and Thomas (2002), Carter M and Guthrie G (2004), Stern (2009) and Asif (2013) have developed models comparable to Duckworth-Lewis method.
T-20 cricket became popular since from the inaugural T-20 world cup held in 2007. It was observed by players and coaches of the teams along with cricket officials of various cricket boards that the regulations about resetting the targets during interruptions cannot be applied directly from the one day matches regulations. They are happy with the regulations developed for one day matches but not the same for T-20 matches. This paper discusses more about the strategy of obtaining optimum score for the team batting first. This will help to develop a policy or regulation for resetting a target during interruptions.
Every year Indian premier league, popularly known as IPL, will be held during the months of April and May. It’s a cash rich tournament where many foreign players will participate and earn. There will be 8 teams/franchises compete for the trophy and cash award. The tenth edition of the Indian Premier League (IPL) commenced on April 5, 2017 and the opening ceremony of the cash-rich league held in the den of the defending champions-Sunrisers Hyderabad. A total of 60 matches played in the tournament spread over a span of 47 days. During the last 10 editions of IPL matches, international T-20 matches between two nations held so far since from inception and T-20 world cup matches, it was observed that a challenging question often arises to every coach of the team as “ how many runs to be scored for the team batting first”. Other cricket tournaments like Test cricket which will span for maximum 5 continuous days and a 50 over each tournament which will span for maximum 8 hours in a day. For these kinds of non T-20 cricket tournaments, results may change session by session and hence prediction of scores and results are highly non-deterministic/probabilistic unless one team is highly dominated over other. In test cricket, session will be of duration two hours whereas in one-day cricket session will be of 15 overs or one and half hour. Petersen, C., et al. (2008) analyzed the T-20 cricket performance by batting and bowling indicators of teams and suggested a strategy to team coach or captain about selecting batsman who have higher strike rate, and the bowling and field placement during first and last 6 overs, and field placing to restrict runs in the middle overs of the match. Whereas our study is help in a take optimal decision for coach or captain for adopting better strategy at any stage of the match to setting up about giving the right target for the opponent team.
3Objective of the problem
To develop a strategy for setting the right target for the team who is batting first. It’s a challenge to coach and skipper of the team.
4Methodology
Secondary data of IPL 2016 results have been used to test the model. This model is based on the mathematical functions in optimization. It’s a modification of the model defined earlier (Durga Prasad, 2012).
5T-20 model development
Stephen Clarke had used dynamic programming approach in one-day cricket. He used metric called optimal scoring rates. Many researchers have used mathematical, statistical and operations research techniques to the 50 overs one-day cricket matches to analyse various situations which include strength of batting in a team in terms of depth up to the batting position number versus strength of bowling in opposition team.
In the present T-20 cricket scenario, though not much academic research work is known in the form of both teams strategy as well as regulations for resetting targets during interruptions but some researchers have attempted. It is observed that if the length of the matches got reduced then there is more chance of estimating a deterministic model instead of non-deterministic/probabilistic models. Durga Prasad (2012) had presented a deterministic model with testing at few matches between two nations but not any full tournament matches. Let us present a deterministic model of T-20 cricket problem which is a modification of the model presented in (Durga Prasad, 2012).
As mentioned before that the objective of the problem is to develop a strategy for estimating the target runs for the team batting first. Let us divide the problem of batting side into 4 stages.
Stage 1 : 1–6 overs
Stage 2 : 7–11 overs
Stage 3 : 12–16 overs
Stage 4 : 17–20 overs
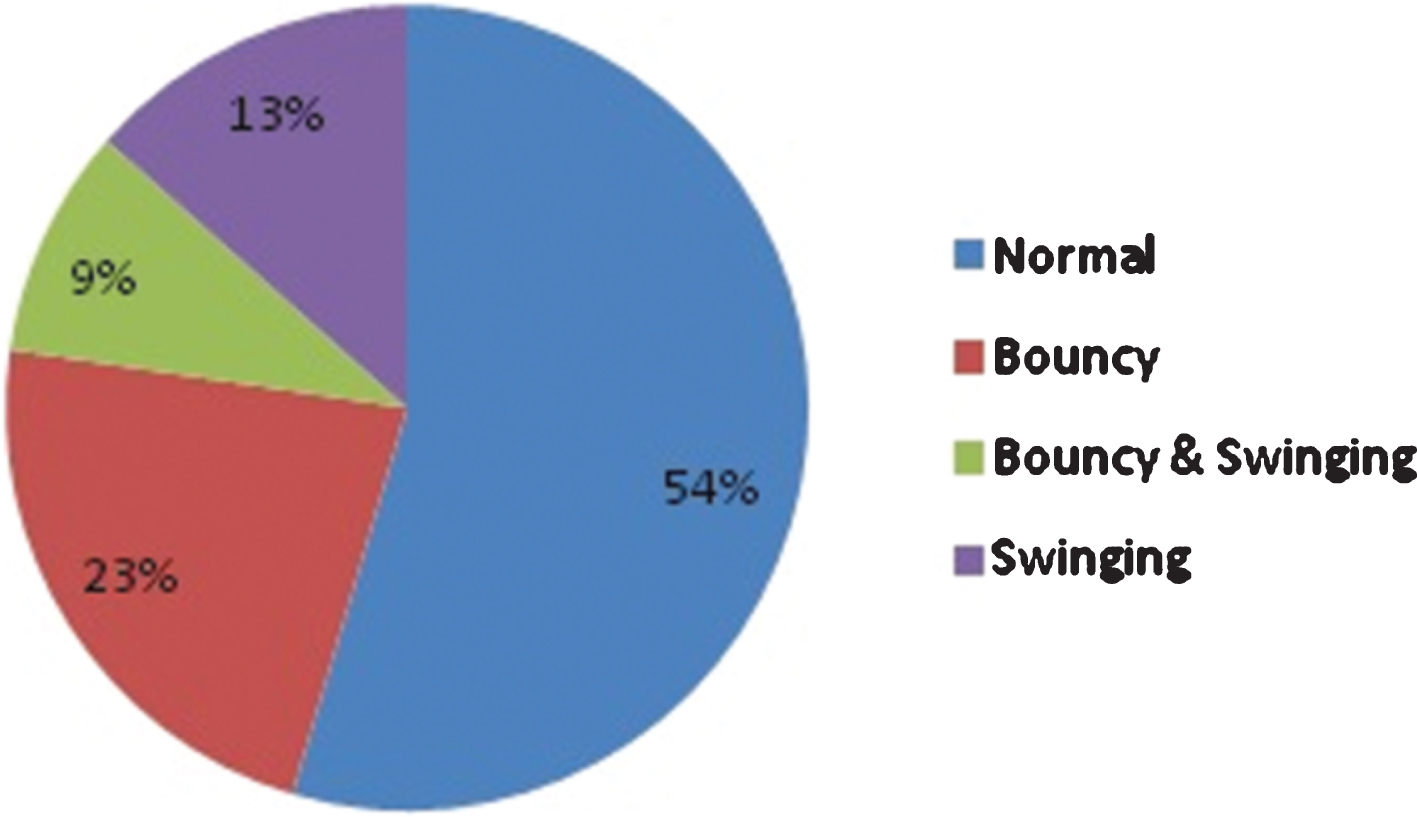
Here number of overs is unevenly distributed in different stages. It is due to the rule of field restrictions in the first six overs. Setting a run score target by first batting team is a real challenge. Here we make an attempt to develop a stage wise recursive relationship. Every stage is dependent upon the previous stage score and the number of wickets fell during the cumulative period. As runs scored by batting team is depending on the pitch as well as the bowling strength of the opponent team, pitch can be defined in four categories viz Bouncy, Swinging, Normal/flat and Bouncy & Swinging. In most of the cricket matches, there will be a pitch report which can be viewed through TV sports channels and it will be discussed by an expert about half an hour before start of the match. Also the ideal target for the team batting first will be discussed during the pitch report. Pitch report contains the level of difficulty in scoring runs at initial stage of six overs and later.
After the discussion of pitch report, toss will be made. Rival captains of the team and their coaches have already inspected the pitch quite before the toss. Inspection of pitch will be helpful in decision of batting first or later in case if the respective team win the toss. Before the toss is made rival captains have to provide the list of 11 players to the organizers. In cricket extra players can participate neither in batting nor bowling but only in fielding unlike in other popular sports viz football where replacement of players is 100% and can hit a goal. Once the list of 11 players is known to all, coach of the batting team will identify the batting strength and opponent’s bowling strength. Strengths will be identified by the coach related to type of pitch and also opposition team. It can be defined relatively in only two categories say AB or BA. AB can be defined as top order batting is relatively stronger than middle order. BA can be defined similarly. All batsmen may not be equal in strength with respect to either type of pitch or opponent team. Hence categories like AA or BB may not arise.
5.1Stage 1
In stage 1 one has to see how many runs scored during the period and also number of wickets fell during this period. Number of runs scored during stage 1 is denoted by f1 whereas number of wickets fell during the stage 1 is denoted by w1. First stage becomes a platform for other stages to plan for the target to set for the opposition team. Durga Prasad (2012) used local matches to estimate the coefficients of the variable wickets fell during that stage. Based on experience on T-20 cricket particularly IPL tournament with the very limited number of overs and the discussions with the senior coach of local cricket association, one can establish the recursive relations as follows:
5.2Stage 2
Note: In the above Equation, 5 is the number of overs in stage 2 to be multiplied with the respective run-rate obtained in the previous stage.
where
In the function
Table 1
Combination of pitch type and batting-bowling strengths in stage 1–2
| Pitch type | Batting team rank | Bowling team rank | p1 | p2 |
| Normal/flat | AB | AB | –2 | 0.02 |
| Normal/flat | BA | AB | 2 | 0.02 |
| Normal/flat | BA | BA | –2 | 0.02 |
| Normal/flat | AB | BA | –2 | 0.02 |
| Bouncy | AB | AB | 4 | 0.03 |
| Bouncy | BA | AB | 6 | 0.03 |
| Bouncy | BA | BA | 4 | 0.03 |
| Bouncy | AB | BA | 4 | 0.035 |
| Swinging | AB | AB | 4.5 | 0.035 |
| Swinging | BA | AB | 6.5 | 0.035 |
| Swinging | BA | BA | 4 | 0.035 |
| Swinging | AB | BA | 4.5 | 0.04 |
| Bouncy &Swinging | AB | AB | 7 | 0.04 |
| Bouncy &swinging | BA | AB | 7.5 | 0.035 |
| Bouncy &swinging | BA | BA | 7 | 0.04 |
| Bouncy &swinging | AB | BA | 7 | 0.045 |
So when we go to stage 2 it is important to know about the runs as well as wickets at stage 1. On this basis one can get the runs and in that process one may lose wickets more by taking more risk to accelerate batting to score runs. The degree of achieving the target score becomes reduced if any batting team loses wickets at regular intervals. If more wickets fall during one stage then in subsequent stages getting runs will be difficult. This can be well explained by the functional relationship. In the functional relationship a dividing factor 6 denotes the number of overs played during the previous stage so that total number of runs divided by 6 will become the run rate.
In Table 1 it is to be observed that p1 is higher for second category when compared to other 3 categories due to weak batting vs strong bowling followed by weak bowling vs strong batting. If it is survived with less number of wickets fell at initial stage then strong batting vs relatively weak bowling will follow.
5.3Stage 3
In this stage we develop the recursive relation as follows:
Note: In the above Equation 5 is the number of overs in stage 3 to be multiplied with the respective run-rate obtained in the previous stage.
where
p3 can be obtained from the following Table 2 for the right combination of pitch type and batting & bowling strengths of the respective teams. p3 is estimated after observing at local matches in the respective type of pitches and also discussions with the team coaches. As impact factor in run rate reduction is already been implemented in stage-2 for coefficients of w1, the coefficients of (w2 - w1) remains same for all the three cases in stage-3.
Table 2
Combination of pitch type and batting-bowling strengths in stage 3
| Pitch type | Batting team rank | Bowling team rank | p3 |
| Normal/flat | AB | AB | 0.01 |
| Normal/flat | BA | AB | 0.01 |
| Normal/flat | BA | BA | 0.01 |
| Normal/flat | AB | BA | 0.01 |
| Bouncy | AB | AB | 0.015 |
| Bouncy | BA | AB | 0.015 |
| Bouncy | BA | BA | 0.015 |
| Bouncy | AB | BA | 0.02 |
| Swinging | AB | AB | 0.02 |
| Swinging | BA | AB | 0.02 |
| Swinging | BA | BA | 0.02 |
| Swinging | AB | BA | 0.025 |
| Bouncy &swinging | AB | AB | 0.025 |
| Bouncy &swinging | BA | AB | 0.02 |
| Bouncy &swinging | BA | BA | 0.02 |
| Bouncy &swinging | AB | BA | 0.025 |
Table 3
Combination of pitch type and batting-bowling strengths in stage 4
| Pitch type | Batting team rank | Bowling team rank | p4 |
| Normal/flat | AB | AB | 0.01 |
| Normal/flat | BA | AB | 0.01 |
| Normal/flat | BA | BA | 0.01 |
| Normal/flat | AB | BA | 0.01 |
| Bouncy | AB | AB | 0.015 |
| Bouncy | BA | AB | 0.015 |
| Bouncy | BA | BA | 0.015 |
| Bouncy | AB | BA | 0.02 |
| Swinging | AB | AB | 0.02 |
| Swinging | BA | AB | 0.02 |
| Swinging | BA | BA | 0.02 |
| Swinging | AB | BA | 0.025 |
| Bouncy &swinging | AB | AB | 0.025 |
| Bouncy &swinging | BA | AB | 0.02 |
| Bouncy &swinging | BA | BA | 0.02 |
| Bouncy &swinging | AB | BA | 0.02 |
5.4Stage 4
This is the final stage and even the lower order batsmen will also try to score more runs and take risk and this will be explained in the functional relationship.
Note: In the above Equation 4 is the number of overs in stage 4 to be multiplied with the respective run rate obtained in the previous stage.
where
These functional relationships have been developed on the basis of run rate and it varies according to the number of wickets fell during the previous stage. p4 is estimated after observing at local matches in the respective type of pitches and also discussions with the team coaches. The coefficients of (w3 - w2) are estimated similar to that in stage-3.
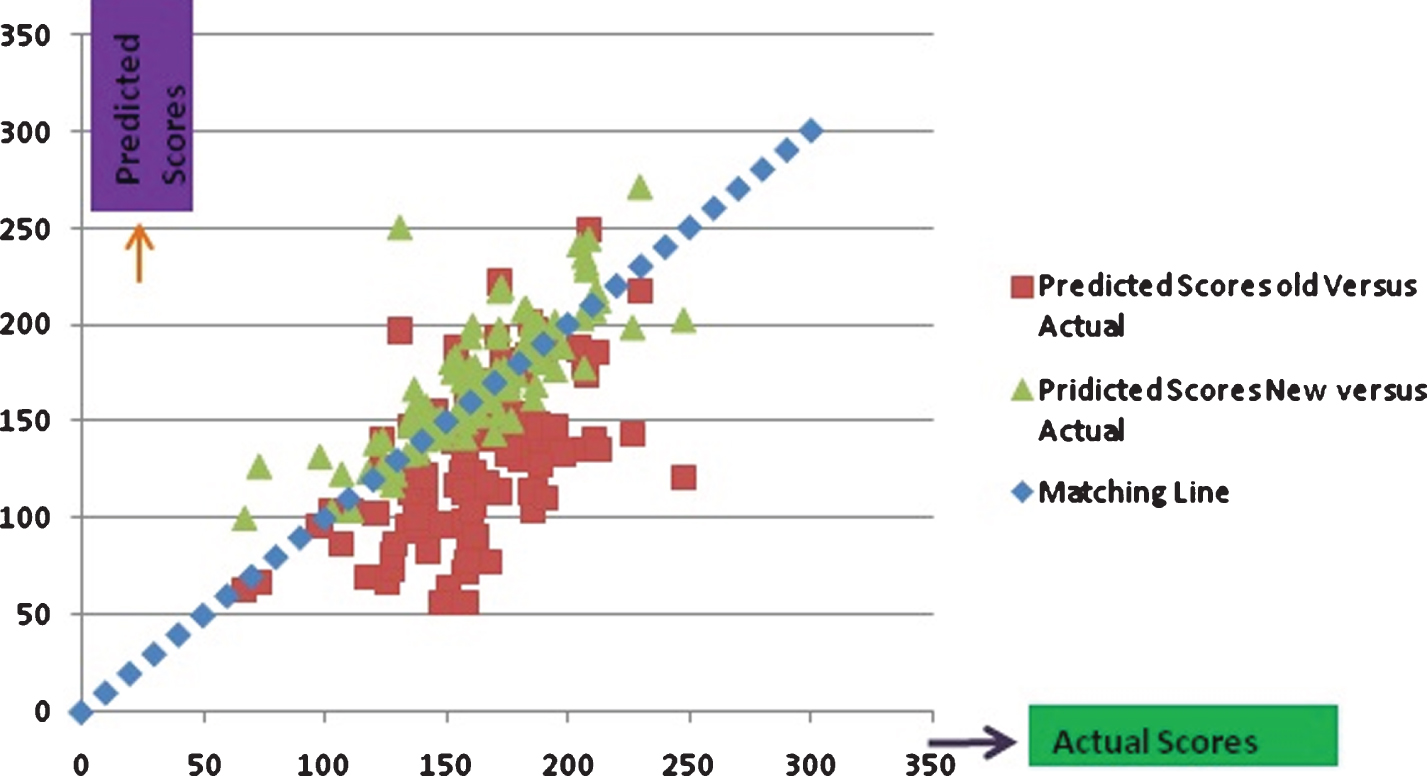
The above relationships have been tested on all IPL 2016–17 matches and results show very close to the score obtained in the proposed approach. This modified model had compared with the model considered in (Durga Prasad, 2012). It can be observed in Fig. 1 that scores predicted in the developed model is quite matching with the actual scores whereas the scores predicted in the model presented in (Durga Prasad, 2012) was quite lower than actual scores and hence the parameter p1 was added in order to match with the actual scores. It can be noted that the model presented in (Durga Prasad, 2012) was developed in 2011 and tested for very few matches. The model worked at that time but during these 5 years there were batting techniques innovated in order to improve scores in T-20 matches.
Fig. 1
Scores estimated through the model versus Actual scores.
Percentage wise category of pitches in IPL 2016–17 was provided in Fig. 2.
Fig. 2
Percentage wise category of pitches in IPL 2016–17.
Results under each stage can be computed after providing inputs through excel sheet. A sample excel format had been shown in the Fig. 3.
Fig. 3
Excel format for estimating the target score.
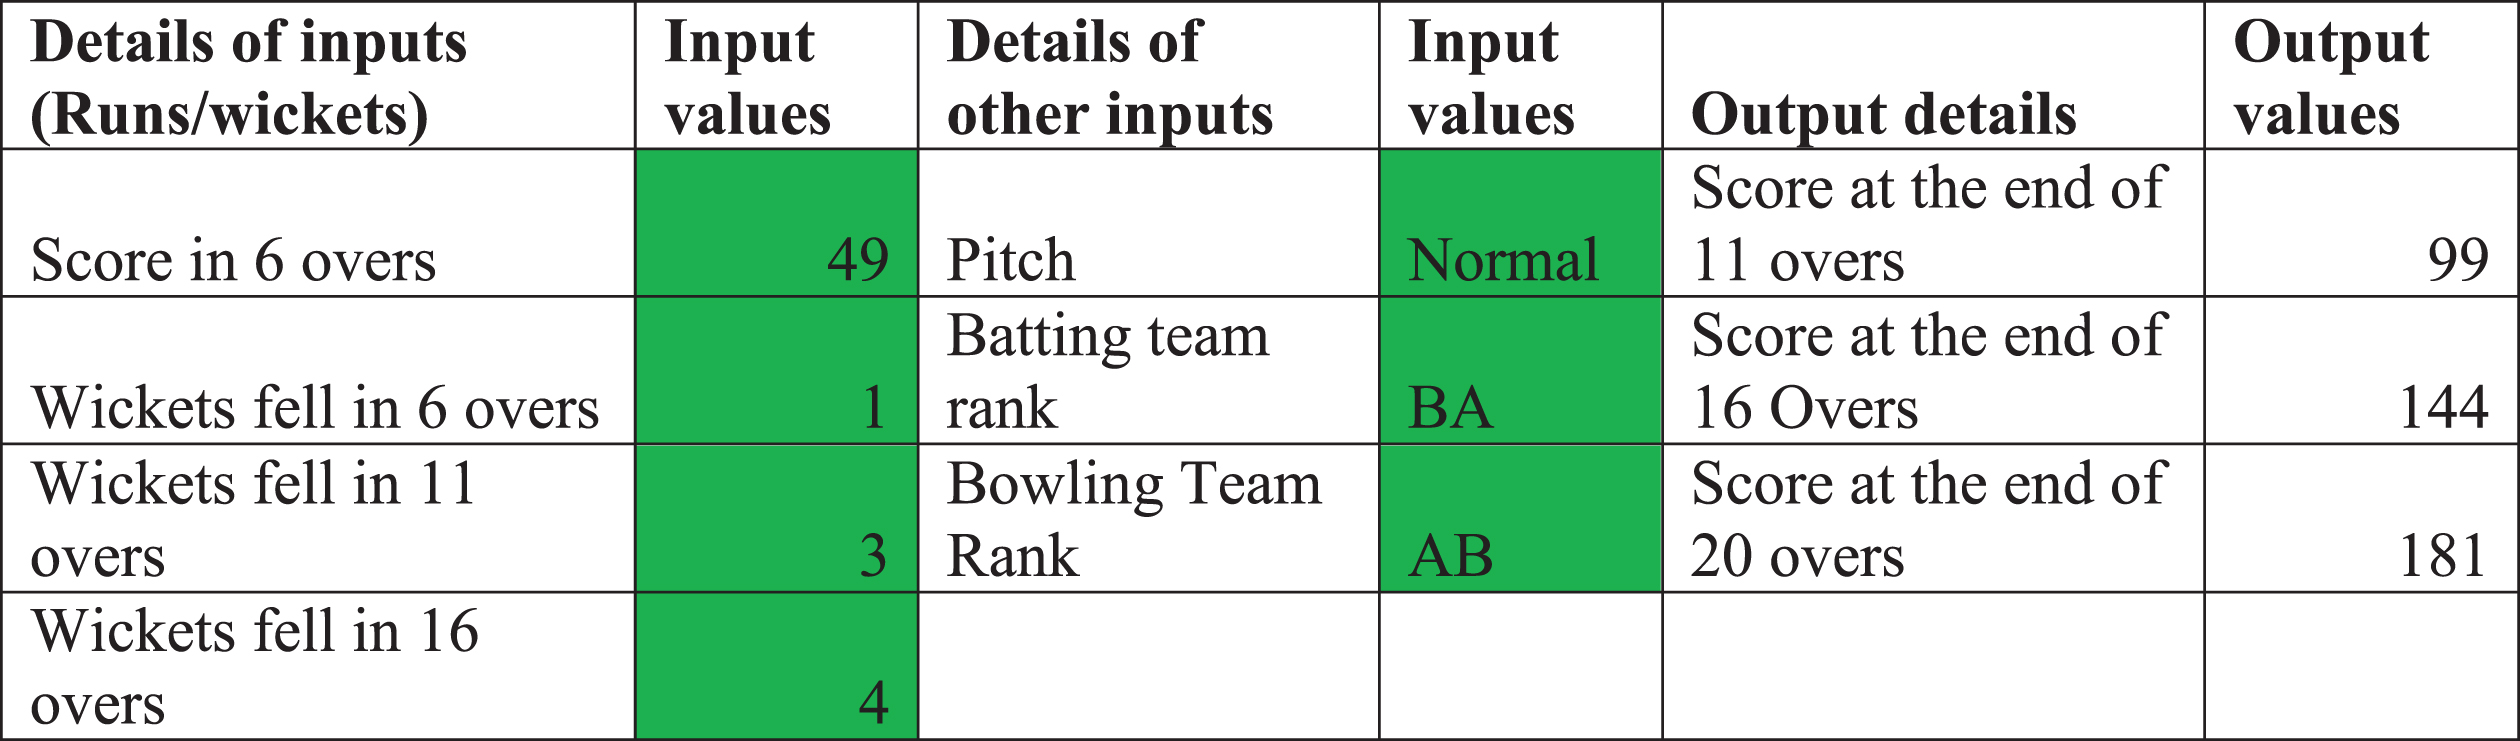
Inputs can be provided in second and fourth column cells. Results are computed in the last column cells. For setting target score by team batting first, coach and captain of the team can initially read the pitch and provide inputs of score in 6 overs and wickets fell likely at the end of 6, 11 and 16 overs along with the inputs like type of pitch, batting strength of their own team and bowling strength of opponent team. Coach can also find the likely score in 6 overs by giving all other inputs which include the target score at the end of 20 overs. This can be obtained by using “what if analysis” and “goal seek” under “data”. One can do similar analysis for target score at the end of 11 and 16 overs too.
For proving effectiveness of the model presented in this paper in comparison to the model presented in (Durga Prasad, 2012) it is observed that probability of target score for any sample match in IPL 2016 occurs in the domain of error range of –10 to +10 will be 0.54 for this model when compared to 0.22 for the model presented in (Durga Prasad, 2012). New model coincides with actual score on four matches of IPL 2016–17 when compared to only one match for the other model.
6Conclusions
The T-20 model presented in this paper is meant for coaches and captain of the team for better planning about giving the right target for the opponent team as well as for applying right strategy during the mid-innings. In IPL, two breaks will be given and this model will help the coach as well as captain to analyse and a better strategy can be applied and convey to the players on the field during these breaks. Sometimes bowling teams will change tactics during stage-I by bringing non-opening bowler to bowl during stage-I. Coach of the batting team should rearrange the strengths of opposing team to revise the plan and convey to the players either during the breaks or when a new batsman arrives at the field. Entire model can easily operate through an excel sheet format.
7Future research
The model so developed in this paper can be used to determine and reset the target score for the interrupted matches. As many coaches felt that the existing method of Duckworth-Lewis is not effective in T-20 matches, the proposed model may solve the problem. Duckworth-Lewis method was originally developed for one-day matches which will be of 50 overs each.
Acknowledgments
Author is thankful to Mr. Vineet Wadkar, a senior coach at Baroda Cricket Association, who gave valuable suggestions which improved substantially about the quality of the paper.
References
1 | Manage Ananda B.W. , Scariano Stephen M. and Hallum Cecil R. , (2013) , Performance Analysis of T20-World Cup Cricket 2012, Sri Lankan Journal of Applied Statistics, 14: (1), 1–14. |
2 | Bailey M.J. and Clarke S.R. , (2006) , Predicting the match outcome in one day international cricket matches while the match is in progress, Journal of Science and Sports Medicine, 5: (4), 480–487. |
3 | Dibyojyoti Bhattacharjee , Manish Pandey , Hemanta Saikia and Unni Krishnan Radhakrishnan , (2016) , Impact of Power Play Overs on the Outcome of Twenty20 Cricket Match, Annals of Applied Sport Science, 4: (1), 39–47. |
4 | Bhattacharya R. , Gill P.S. and Swartz T.B. , (2011) , Duckworth-Lewis and Twenty20 cricket, The Journal of the Operational Research Society, 62: (11), 1951–1957. |
5 | Scott Brooker and Seamus Hogan , (2011) , A Method for Inferring Batting Conditions in ODI Cricket from Historical Data, White Paper, University of Canterbury, No. 44. http://hdl.handle.net/10092/6406 |
6 | Carter M. and Guthrie G. , (2004) , Cricket interruptus: fairness and incentive in limited overs cricket matches, Journal of the Operational Research Society, 55: , 822–229. |
7 | Ge Cheng , Zhang Zhenyu , Ntanda Kyebambe Moses and Nasser Kimbugwe , (2016) , Predicting the Outcome of NBA Playoffs Based on the Maximum Entropy Principle, Entropy, 18: (12), 1–15. https://doi.org/10.3390/e18120450 |
8 | Stephen Clarke and John Norman , (1998) , Dynamic Programming in cricket: Protecting the weaker batsman, Asia-Pacific Journal of Operational Research, 15: . |
9 | Clarke S.R. , (1988) , Dynamic Programming in one-day cricket – optimal scoring rates, Journal of the Operational Research Society, 39: , 331–337. |
10 | Croucher J.S. , (1982) , Australia-England test cricket dismissals 1946–1980, Bull Appl Statis, 9: , 179–193. |
11 | Jack Davis , Harsha Perera and Swartz Tim B. , (2015) , A Simulator for Twenty20 Cricket, Australian & New Zealand Journal of Statistics, 57: (1), 55–71. |
12 | De Silva B.M. and Swartz T.B. , (1997) , Wining the coin toss and the home team advantage in one-day international cricket, Austr. New Zeal J Statisti, 32: , 16–22. |
13 | De Silva B.M. and Swartz T.B. , (2001) , Estimation of the magnitude of the victory in one-day cricket, Austr New Zeal J Statist, 43: , 1369–1373. |
14 | Duckworth F.C. and Lewis A.J. , (1998) , A fair method for resetting the target in interrupted one-day cricket matches, Journal of Operation Research Society, 49: , 220–227. |
15 | Duckworth F.C. and Lewis A.J. , (1998) , A fair method of resetting the target in interrupted one-day cricket matches, Journal of Operational Research Society, 49: (3), 220–227. |
16 | Durga Prasad M.V. , (2012) , Operations Research, Ch-10, Cengage Learning, ISBN-13:978-81-315-1625-6 |
17 | Munir Fahad , Kamrul Hasan Md. , Ahmed Sultan Sakib and Quraish Md. , (2015) , Predicting a T20 cricket match result while the match is in progress, Graduation Thesis, Department of Computer Science and Engineering, BRAC University. |
18 | Hayes M. and Norman J.M. , (1984) , Dynamic programming in orienteering: route choice and the siting of controls, Journal of Operations Research Society, 35: , 791–796. |
19 | Seamus Hogan , (2012) , Offsetting Behavior: Cricket and the Wasp: Shameless self-Promotion (Wonkish), Offsettingbehaviour.blogspot.in |
20 | Jayadevan V. , (2002) , A New Method for the Computation of target scores in interrupted, limited-over cricket matches, Current Science, 83: (5), 577–586. |
21 | Jayadevan V. , (2004) , An improved system for the Computation of target scores in interrupted, limited-over cricket matches adding variations in scoring range as another parameter, Current Science, 86: (4), 515–517. |
22 | Pankush Kalgotra , Ramesh Sharda and Goutam Chakraborty , (2013) , Predictive Modeling in Sports Leagues: An Application in Indian Premier League, Proceedings of the SAS Global Forum 2013 Conference, http://support.sas.com/resources/papers/proceedings13/019-2013.pdf. |
23 | Stylianos Kampakis and William Thomas , (2015) , Using machine learning to predict the outcome of English county twenty over cricket matches, Arxiv: Machine Learning, pp. 1-17. |
24 | Kimber A.C. and Hansford A.R. , (1993) , A statistics analysis of batting in cricket, Journal of the Royal Statistical Society series A, 156: , 443–445. |
25 | Lewis A.J. , (2005) , Towards fairer measures of player performance in one-day cricket, The Journal of the Operational Research Society, 56: (7), 804–815. |
26 | Dwight Lutz , (2012) , A cluster analysis of NBA players, In MIT Sloan Sports Analytics Conference. |
27 | Mankan Sapan H. , Chaudhary Anuj , Dalsniya Nikunj and Mandir Vivek , (2014) , Study and Analysis of Duckworth-Lewis Method, IJSRD, 2: (2), 469–473. |
28 | Asif Muhammad , (2013) , Statistical Modelling in Limited Overs International Cricket, Ph.D. Thesis, Salford Business School, University of Salford Manchester, UK, July. |
29 | Kalpdrum Passi and Nirav kumar Pandey , (2018) , Increased Prediction Accuracy in the Game of Cricket using Machine Learning, International Journal of Data Mining & Knowledge Management Process, 8: (2), 19–36. |
30 | Petersen C. , Pyne D.B. , Portus M.J. and Dawson B. , (2008) , Analysis of Twenty/20 Cricket performance during the 2008 Indian Premier League, International Journal of Performance Analysis in Sport, 8: (3), 63–69. |
31 | Prakash Deep C. , Patvardhan C. and Lakshmi Vasantha C. , (2016) , A new Machine Learning based Deep Performance Index for Ranking IPL T20 Cricketers, International Journal of Computer Applications, 137: (10). |
32 | Prakash Deep C. , Patvardhan C. and Lakshmi Vasantha C. , (2016) , Data Analytics based Deep Mayo Predictor for IPL-9, International Journal of Computer Applications, 152: (6), 6–11. |
33 | Ian Preston and Jonathan Thomas , (2002) , Rain Rules for Limited Overs Cricket and Probabilities of Victory, Journal of the Royal Statistical Society: Series D, 51: (2), 189–202. |
34 | Preeti Satao , Ashutosh Tripathi , Jayesh Vankar , Bhavesh Vaje and Vinay Varekar , (2016) , Cricket Score Prediction System Using Clustering Algorithm, International Journal Of Current Engineering and Scientific Research, 3: (4), 43–46. |
35 | Parag Shah , (2017) , Predicting Outcome of Live Cricket Match Using Duckworth-Lewis Par Score, International Journal of Systems Science and Applied Mathematics, 2: (5), 83–86. |
36 | Sricharan Shah , ParthaJyoti Hazarika and Jiten Hazarika , (2017) , A Study on Performance of Cricket Players using Factor Analysis Approach, International Journal of Advanced Research in Computer Science, 8: (3), 656–660. |
37 | Sharma S.K. , (2013) , A Factor Analysis Approach in Performance Analysis of T- Cricket, Journal of Reliability and Statistical Studies, 6: (1), 69–76. |
38 | Sharp G.D. , Brettenny W.J. , Gonsalves J.W. , Lourens M. and Stretch R.A. , (2011) , Integer Optimization for the Selection of a Twenty20 Cricket Team, Journal of the Operational Research Society, 62: , 1688–1694. |
39 | Sphicas G.P. and Ladany S.P. , (1976) , Dynamic policies in the long jump, In Management Science in Sports (R.E. Machol, S.P. Ladany and D.G. Morrison, eds), North Holland, Amsterdam, Pp. 113-124. |
40 | Stern S.E. , (2009) , An Adjusted Duckworth-Lewis Target in Shortened Limited Overs Cricket Matches, The Journal of the Operational Research Society, 60: (2), 236–251. |
41 | Stevenson Oliver G. and Brewer Brendon J. , (2017) , Bayesian survival analysis of batsmen in Test cricket, Journal of Quantitative Analysis in Sports, 13: (1), 25–36. |
42 | Tim Swartz , (2003) , The Best Batsmen and Bowlers in One-Day Cricket: General, South African Statistical Journal, 37: (2), 203–222. |
43 | Swartz Tim B. , Gill Paramjit S. and Saman Muthukumarana , (2009) , Modelling and simulation for one-day cricket, The Canadian Journal of Statistics, 37: (2), 143–160. |
44 | Viswanadha S. , Sivalenka K. , Jhawar M.G. and Pudi V. , (2017) , Dynamic Winner Prediction in Twenty20 Cricket: Based on Relative Team Strengths, Conference Proceedings, MLSA@PKDD/ECML, https://www.researchgate.net/publication/319335442 |


