
Strategic target setting in the heptathlon
Abstract
The purpose of this study was to examine scoring within the women’s Heptathlon to identify areas of performance where athletes could most improve their points total and propose an approach to target setting. Performance data were gathered from publically available sources for 409 performances of 155 heptathletes at 19 international championships between 2004 and 2017 inclusive. Based upon the interquartile ranges, the largest spread of points were seen for the High Jump and Javelin. Year to year improvement was analysed using the 186 pairs of performances by the same athletes in consecutive calendar years. This showed that the disciplines with the most scope for improvements were the Long Jump, High Jump and Javelin. The proposed target setting approach can be used to identify which disciplines an athlete should focus on to maximise improvement in their total points and to estimate the probability of the athlete exceeding the target that has been set. The approach should be used in conjunction with knowledge of the wider context of the athlete’s recent heptathlon performances.
1Introduction
The Heptathlon is a combined event within track and field athletics that includes seven disciplines performed over two days of competition (100 m Hurdles, High Jump, Shot Put, 200 m, Long Jump, Javelin Throw and 800 m); the first four events are completed on the first day and the remaining three on the second day. The Heptathlon first featured in the Summer Olympics in 1984 and has been ever-present in global competitions since. The point scoring system for the Heptathlon uses a series of formulae and scoring coefficients with the aim of giving a fair, regressive score for performances of different events. Equation (1) is used to determine points scored for timed running events where a lower time denotes a better performance, and Equation (2) is used for measured jumping and throwing field disciplines where a longer distance is a better performance. In Equations (1) and (2), X represents the athlete’s time or distance measured in the respective units. Table 1 shows the scoring coefficients used to calculate points scored in the different disciplines. The total score for the Heptathlon is the sum of the points scored in the seven disciplines.
(1)
(2)
Table 1
The scoring coefficients used for the Heptathlon (IAAF, 2001 : 25)
| Discipline | A | B | C |
| 100 m Hurdles (s) | 9.23076 | 26.7 | 1.835 |
| High Jump (cm) | 1.84523 | 75.0 | 1.348 |
| Shot Put (m) | 56.0211 | 1.50 | 1.05 |
| 200 m (s) | 4.99087 | 42.5 | 1.81 |
| Long Jump (cm) | 0.188807 | 210 | 1.41 |
| Javelin (m) | 15.9803 | 3.80 | 1.04 |
| 800 m (s) | 0.11193 | 254 | 1.88 |
Determining where best to seek support, decisions on training and the setting of feasible targets are traditionally left to the coach, athlete and specialists in the field (Alamar, 2013). However, analytics approaches are now being used to aid decision making in many levels of sports performance. High performance management uses data to support strategic decision making about funding priorities and talent development processes. The identification of specific areas for an athlete to improve, setting targets and determining training routines are all supported through sport analytics (Franks and Hughes, 2016). Analytics can support decision makers through tracking and projecting data to analyse the progress and potential of athletes (Alamar, 2013). Estimating scope for improvement and setting performance targets are areas associated with decisions made by sport’s national governing bodies (NGBs). Such decision-making is usually with respect to financial investments, where eligibility for funding in specific sports is dependent upon their likelihood of achieving medals at major championships such as the Olympic Games. Political figures and chief executives in charge of funding decisions rarely possess specialist sporting knowledge. Their decisions are majorly influenced by the assessment and achievement of predetermined targets from the NGBs of the sports in question. There is limited published research around specific applications of performance analysis to target-setting and decision-making, as this information can provide a competitive advantage, is sensitive and not made public.
Sports performance is often complex and represented by a selection of performance variables. In sports performance analysis, a performance profile is a collection of performance variables that together cover all important aspects of an athlete’s or team’s performance (Hughes and Bartlett, 2002). The variables are commonly known as performance indicators and they are often associated with performance outcome (Lames and McGarry, 2007). Coaches are often consulted in the process of identifying performance indicators to ensure the information used is valid and relevant to coaching processes (Jones et al.’s, 2004). The main profiling techniques used in sports performance analysis are those of James et al. (2005) and O’Donoghue (2005). Both of these techniques recognised the unstable nature of sports performance by representing variability in performance using confidence intervals and interquartile ranges respectively. Performance in track and field athletics events is less complex than performance in team sports. Specific performance variables within combined event sports are more straightforward to link to the performance outcome. For example, in the Heptathlon the performance variables are the results for the seven disciplines, with the sum of the points scored in these resulting in the final points total and placing. The profiling techniques of James et al. (2005) and O’Donoghue (2005) do not include the critical step of calculating final performance outcome from performance indicators within a profile. Therefore, an alternative approach is needed to analysing events such as the Heptathlon.
Previous research into multi-event sports has focussed on the scoring systems and disciplines they favour (Trkal, 2003; Westera, 2007; Slavek and Jović, 2012; Gassmann et al., 2016). Slavek and Jović’s (2012) Grey system theory study of Heptathlon point scoring found that the 100 m Hurdles and Long Jump were more preferentially awarded points than the throwing disciplines. The largest relative variability between performers in the Heptathlon is in the 100 m Hurdles and Long Jump while the lowest is in the Javelin and Shot Put (Westera, 2007). Therefore, the 100 m Hurdles and Long Jump have a much greater influence on the total score than the throw events. Gassmann et al. (2016) also found that the Heptathlon scoring system favoured sprint and jump events more than throwing events. Previous studies of the Heptathlon have also concluded that the scoring system favours athletes who specialise in events that contribute disproportionately to the overall score to the detriment of more versatile all-round athletes (Gassmann et al., 2016; Westera, 2007). Similar research has examined the Decathlon scoring system (Trkal, 2003; Barrow, 2014). Trkal stated the need for scoring systems to avoid the possibility of athletes who specialise in one discipline being more successful than more versatile athletes. Barrow (2014) analysed the top 100 all-time performances, showing favourable scoring for sprinting events (100 m, 400 m, 110 m Hurdles and Long Jump) and adverse scoring for the throwing events and the 1500 m, mostly agreeing with past findings by Slavek and Jović (2012) for the Heptathlon. Whilst Barrow’s (2014) study describes the best Decathlon performances, it fails to represent the spread of all performances. Additionally, advice is provided for combined event coaches to target disciplines with more favourable scoring, which whilst being good general advice, is not specific to each athlete as the study does not analyse or acknowledge the performance level of the athletes and corresponding scope for improvement in individual disciplines. Similar advice has been given about the Heptathlon, suggesting that increasing training based around the development of strength to improve throwing event performances could be beneficial for those considered as specialists in the sprints and jumps (Gassmann et al., 2016). They also proposed adding another throwing discipline to the Heptathlon, such as the Hammer Throw, to attempt to “level out” the scoring.
The current study aims to examine points scored in international Heptathlon competition and to propose an analytic approach to target setting to aid coach and athlete decision making in relation to future Heptathlon training and competitions. The questions listed below are investigated. The first three have already been investigated by previous research into multi-event sports (Trkal, 2003; Gassmann et al., 2016; Westera, 2007) but the last three are original.
• What are the ranges of points awarded in the seven disciplines?
• Are performances in different disciplines related?
• Are there different types of athlete who compete in the Heptathlon and are certain types of athlete advantaged by the current scoring system?
• What is the year to year improvement in different disciplines?
• Is the level of improvement in any discipline related to performance in the discipline?
• Do the areas for improvement identified by the proposed target setting approach reflect improvements actually made by international heptathletes?
The paper is structured into three sections. Firstly, the study of international Heptathlon performances addresses the first five aims listed previously. The methods and results of this part of the research are presented. The second section proposes a predictive modelling approach to setting targets for international heptathletes. The approach is based on the evidence of the first section and is evaluated considering the performances of two international heptathletes and their opportunities in the European Championships of 2018 and World Championships of 2019. The third section is an overall discussion of international Heptathlon performance and the approach to target setting.
2Methods
2.1Data collection
Heptathlon performance data from 19 major athletics competitions between 2004 and 2017 inclusive were included in the study; these competitions were the World Championships, Summer Olympic Games, European Championships and Commonwealth Games during these years. A total of 409 performances from 155 female athletes were analysed. The Commonwealth Games include athletes from the 53 nations of the Commonwealth (formerly known as the British Commonwealth). These include the home nations of the United Kingdom as well as countries in Asia, Oceania, Africa and the Americas. Competition data were recorded from a combination of publically available sources (https://en.wikipedia.org/wiki/Combined_events_at_the_Olympicshttps://en.wikipedia.org/wiki/Combined_events_at_the_Olympics#Women.27s_heptathlon, accessed: 5th Aug 2017; http://www.ten7events.com/eng/world-championships/heptathlon-world-championships-results/, accessed: 9th Aug 2017). Performance and point data were entered into Microsoft Excel for consistency checking and processing.
2.2Data checking
All distances and times recorded were converted into units used to determine points awarded in the Heptathlon. This included transforming all 800 m times from minutes and seconds into total seconds, and distances recorded in metres (Long Jump and High Jump) being changed into centimetres. Performances which did not contain results for all seven disciplines were excluded from the study. Reasons for missing results included an athlete not starting, not finishing, getting injured, recording no legitimate jumps or being disqualified. Towards the end of the data collection process, 7 performances by 3 different athletes were removed due to retrospective disqualifications made where the IAAF concluded that doping offences occurred.
The data were checked for any discrepancies in three stages. The first stage applied the Heptathlon point scoring Equations (1) and (2) to the performance scores in each discipline to confirm that the points calculated agreed with the points recorded from the data source. Any erroneous data were rechecked from the data source and amended if necessary. This process showed that all performance scores and corresponding points were consistent.
The second check determined whether or not the sum the points scored for each of the seven disciplines and the total Heptathlon points score were the same. Errors found from this checking process could be within the total points reported for the Heptathlon, or in an individual discipline score and corresponding points. The data source used was consulted to check when any inconsistencies were found between recorded and calculated points totals and the data were corrected if necessary. Thirteen cases from the same competition were rechecked and resolved through this process. The discrepancies resulted from incorrect manual input. In one additional case the error was still present, so the original source was consulted (https://www.iaaf.org/results, accessed: 15th Aug 2017), which exposed an inaccuracy in the source used allowing this case to be corrected.
The third and final check scrutinised the maximum and minimum point scores recorded within each discipline from all Heptathlon performances. From this check, two Long Jump performances were identified where the athlete recorded a point score of 0 points for not making a legitimate jump. The decision was taken to exclude these Heptathlon performances. The maximum point score given for a single discipline in the final 409 Heptathlon performances was 1211 points for a 198 cm High Jump, with the minimum point score recorded for a single discipline being 302 points for a 20.68 m Javelin throw. The total scores from the Heptathlon performances ranged from 4048 to 7032 points.
2.3Data analysis
Three versions of the data were analysed within the study. The full set of 409 heptathlon performances was analysed to determine spreads of point scores for the different disciplines as well as relationships between the disciplines. A second version only included the mean performance for each of the 155 heptathletes and was used to classify different types of heptathlete. The third version of the data was restricted to 186 pairs of heptathlon performances by the same athletes where the second performance within the pair took place in the calendar year that followed the first. These three versions of the data were imported into IBM SPSS Version 24 (SPSS: an IBM company, Armonk, NY) for statistical analyses to be conducted.
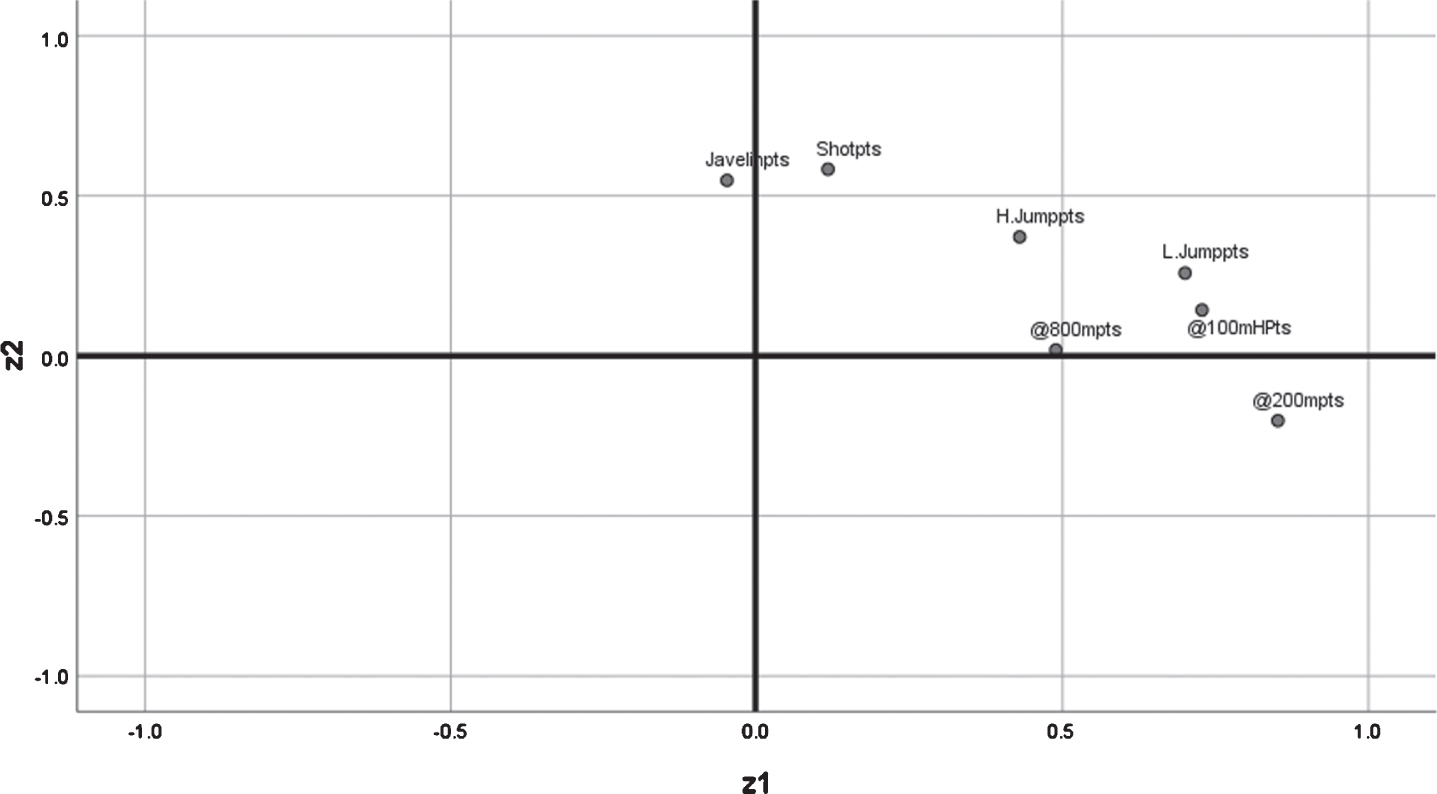
The first analysis was conducted on all 409 heptathlon performances to show the distribution of points awarded in the different disciplines using a box and whisker plot. This approach has a disadvantage of using non-independent data. However, an advantage of the approach is that it is more representative of the level of performance required in international competition where the most successful athletes qualify for more championships than less successful athletes. The points awarded in the seven disciplines were also correlated using Pearson’s r to evaluate relationships between each pair of disciplines. The coefficient of determination, r2, is the proportion of the points scored in one discipline that is directly explained by that scored in a correlated discipline. A threshold value of r2 > 0.15 (15% of the one performance score being directly explained by the other) was set to recognise a meaningful relationship between a pair of disciplines. Therefore, absolute correlation coefficients of 0.387 or greater indicated meaningful relationships between pairs of disciplines. A multivariate analysis of the points scored for each discipline was done including athletes’ biological ages (days) at the time of competition. The inclusions of biological age was to account for the possibility of athletes improving or declining with experience through their careers. An exploratory curve fitting analysis showed that performance tended to improve or decrease with age for six of the disciplines, with an optimal age being associated with peak performance in only one discipline, the Shot Put. Representing the quadratic form seen in one discipline would involve including a biological age squared term that has the disadvantage of being functionally dependent on the biological age term also being included. Therefore, the square of biological age was not included in the multivariate analysis. The multivariate analysis applied to the data was a principal axis factoring because it is suitable where the latent factors represent some fitness construct rather than an outcome construct. Three factors explaining 47.1% of the variance in the data were extracted and rotated using the Varimax technique with Kaiser normalistaion. Biological age was not highly correlated with any of the three factors – 0.144< = r< = 0.139. Therefore, it was decided to redo the principal axis factoring excluding biological age. This extracted two factors that explained 44.2% of the data. Varimax rotation with Kaiser normalisation was applied to these two factors (which we refer to as z1 and z2), resulting in them representing 31.2% and 13.0% of the variance in the data respectively. Figure 1 shows the factor loadings for z1 and z2. The level of internal consistency of the Heptathlon data (Cronbach’s α= 0.676) was below that required for the data to be interpreted as measuring a single construct (0.7) which may be expected given the different fitness components involved.
Fig. 1
Loading plot for the Principal Axis Factoring.
The second analysis was conducted on the mean performance for each of the 155 heptathletes. The purpose of this analysis was to determine if there are different types of heptathlete. The decision to use the mean performance for each athlete was to reduce the risk of athletes with multiple performances within the data set having an undue influence on the classification of heptathlete types. Using the mean performance for each athlete, rather than selecting a single performance at random, also reduced variability due to individual performance effects. A hierarchical cluster analysis was used to classify the heptathletes in terms of the factors z1 and z2. Ward’s method with squared Euclidean distances was used to classify the heptathletes into clusters using a range of solutions from 2 to 10 clusters. Identification of different types of heptathlete involved inspection of the dendogram produced by the hierarchical cluster analysis and the scatter plot of the z1 and z2 scores.
The third analysis described the range of year to year changes in points scores achieved in the different disciplines. The version of the data used in this analysis was restricted to performances by the same athletes in successive years, for which there were 186 such pairs. It was decided to use pairs of performances in consecutive years, because using three, four, five or six performances over consecutive years would have reduced the data set to 93, 52, 30 and 14 sequences of performances respectively. The first performance within each pair of performances was the one that occurred first with the second one being performed before the end of the calendar year that followed the first. A box and whisker plot compared the range of year to year improvements between the seven disciplines. Curve fitting was used to explore the nature of the relationship between biological age and year to year change in the seven disciplines. The strongest models were linear for the 100 m Hurdles, Shot Put, Long Jump, Javelin, z1 and z2. Inverse models were strongest for the other three disciplines, followed by logarithmic and linear models. However, there was practically no difference between the inverse, logarithmic and linear models when the curves were visually inspected. Age was not highly correlated with year to year change in the two factors (z1: r = – 0.076; z2: r = – 0.147) or the individual disciplines (100 m Hurdles: r = – 0.102; High Jump: 0.017; Shot Put: – 0.123; 200m: – 0.034; Long Jump: – 0.123; Javelin: – 0.147; 800m: – 0.070). Therefore, age was not included in any models of the year to year change in performance.
Curve fitting was used to explore the relationship between points scored in each discipline and the change in points scored in the year that followed. Prior to this, it was necessary to remove two extreme values for year to year change in the 100 m Hurdles, two extreme values for year to year change in the Long Jump and one year to year change value for the 800 m where the residual value was an extreme value. The most significant predictive model of year to year change was chosen for each discipline, with the predicted and residual values being saved so that the models could be tested with respect to the assumptions of regression analysis. Kolmogorov-Smirnov tests were used to test for the normality of residual values with p values greater than 0.05 indicating the assumption was satisfied. Homoscedasticity was tested by correlating the magnitude of residual values with the predicted values with correlations of less than 0.250 indicating that this assumption was satisfied. The independence of the residual values was tested by correlating them with the date of the second performance within each pair of performances in consecutive years with absolute correlations less than 0.316 (r2 < 0.1) indicating the assumption was satisfied.
3Results
3.1Spread of point scores for different disciplines
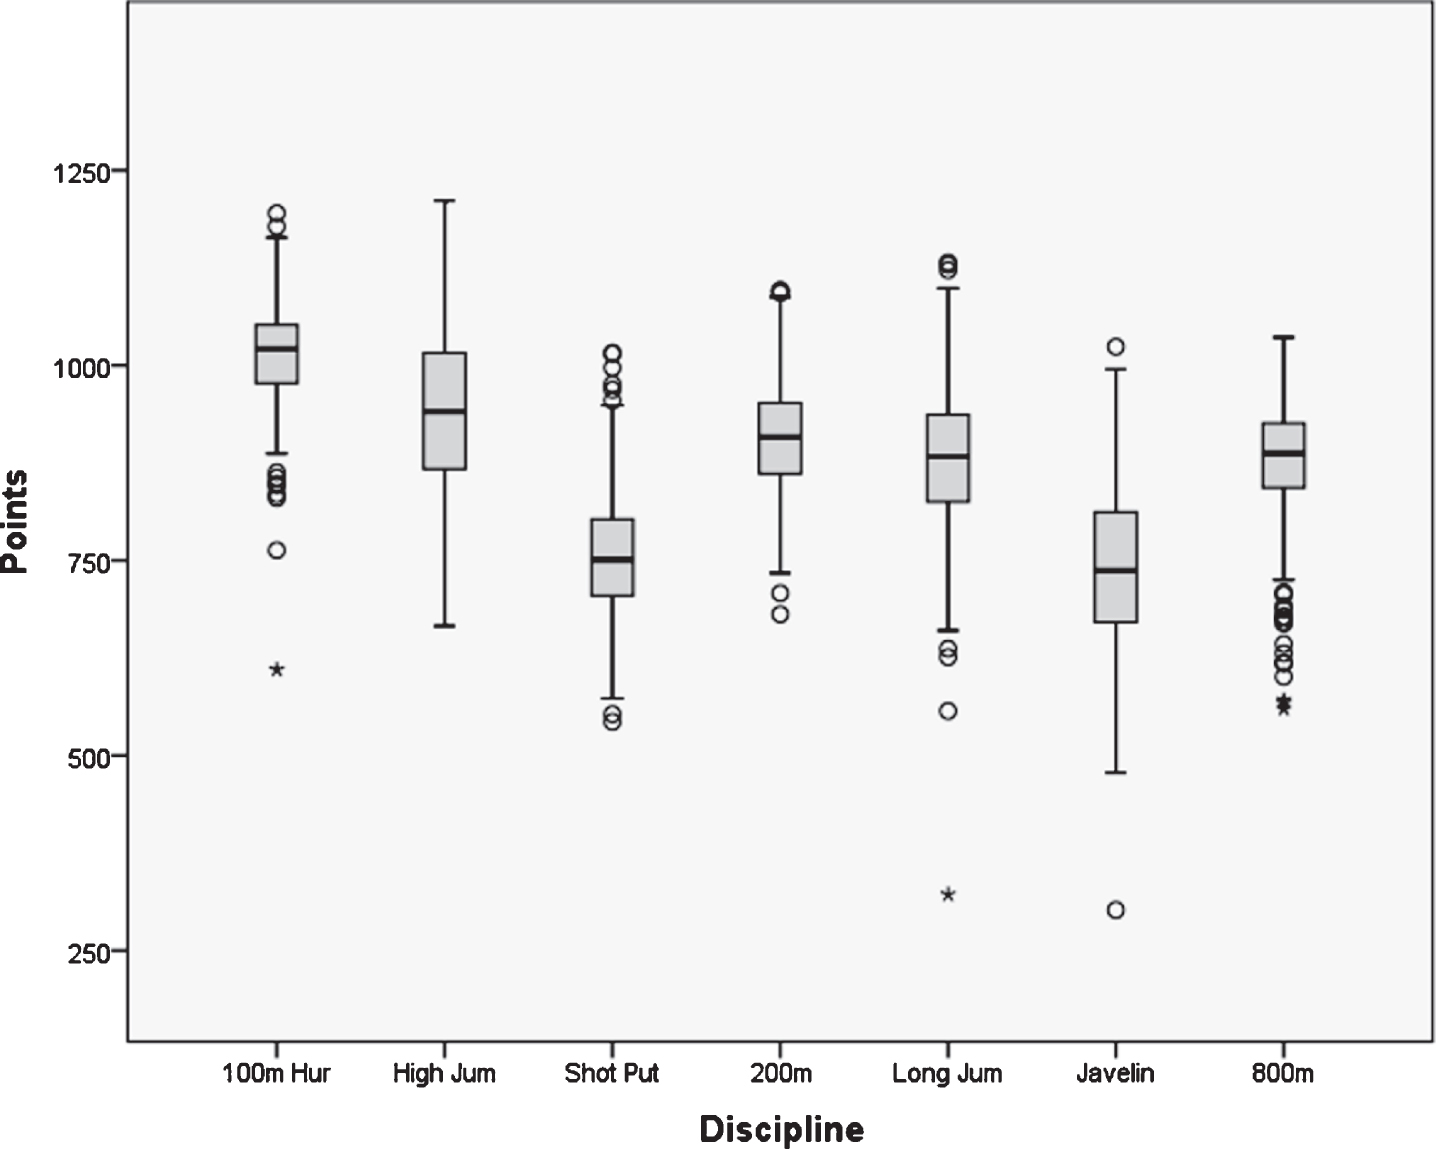
Figure 2 displays the spread of performances for the seven disciplines using the 409 heptathlon performances in the dataset. The largest inter-quartile ranges can be seen for the High Jump and Javelin, indicating that there is more scope to gain or lose points in these two disciplines than the other five. Additionally, the 800 m displays a large number of outliers compared to the other six disciplines for performances below the inter-quartile range for their respective points score.
Fig. 2
Distribution of points for the 7 Heptathlon disciplines (n = 409).
3.2Relationships between different disciplines
Table 2 shows the bivariate correlations between each pair of disciplines, the two factors and biological age. There are negative correlations between the 200 m and the Javelin and between the Javelin and the 800 m with the remaining correlations between pairs of disciplines being positive. The factor, z1, has good positive correlations (r > +0.5) with points scored in the 100 m Hurdles, 200 m, Long Jump and the 800 m, thus representing a speed dimension. The other extracted factor, z2, is highly correlated with Shot Put and Javelin with a lower positive correlation with the High Jump, thus being interpreted as a power dimension. Table 2 also shows that biological age is not significantly correlated with any discipline or factor. There are three subsets of disciplines with meaningful positive correlations (r2 > 0.15); the 200 m and 800 m (r = 0.392), the High Jump and Long Jump (r = 0.496), and the 100 m Hurdles, Long Jump and 200 m (correlations between 0.515 and 0.665).
Table 2
Pairwise bivariate correlation matrix by discipline
| Age in days | z2 | z1 | 800m | Javelin | Long Jump | 200m | Shot Put | High Jump | |
| 100 m Hurdles | 0.184** | 0.142 | 0.787** | 0.339** | 0.152** | 0.516** | 0.665** | 0.140** | 0.314** |
| High Jump | – 0.477** | 0.435** | 0.464** | 0.253** | 0.117* | 0.496** | 0.230** | 0.276** | |
| Shot Put | 0.748** | 0.774** | 0.126* | 0.091 | 0.345** | 0.198** | 0.018 | ||
| 200m | – 0.260** | – 0.187** | 0.921** | 0.392** | – 0.155** | 0.515** | |||
| Long Jump | 0.332** | 0.232** | 0.756** | 0.363** | 0.074 | ||||
| Javelin | 0.703** | 0.795** | – 0.053 | – 0.073 | |||||
| 800m | 0.023 | – 0.061 | 0.528** | ||||||
| z1 | – 0.081 | 0.016 | |||||||
| z2 | 0.141 |
Significance: *p < 0.05, **p < 0.01.
3.3Types of heptathlete
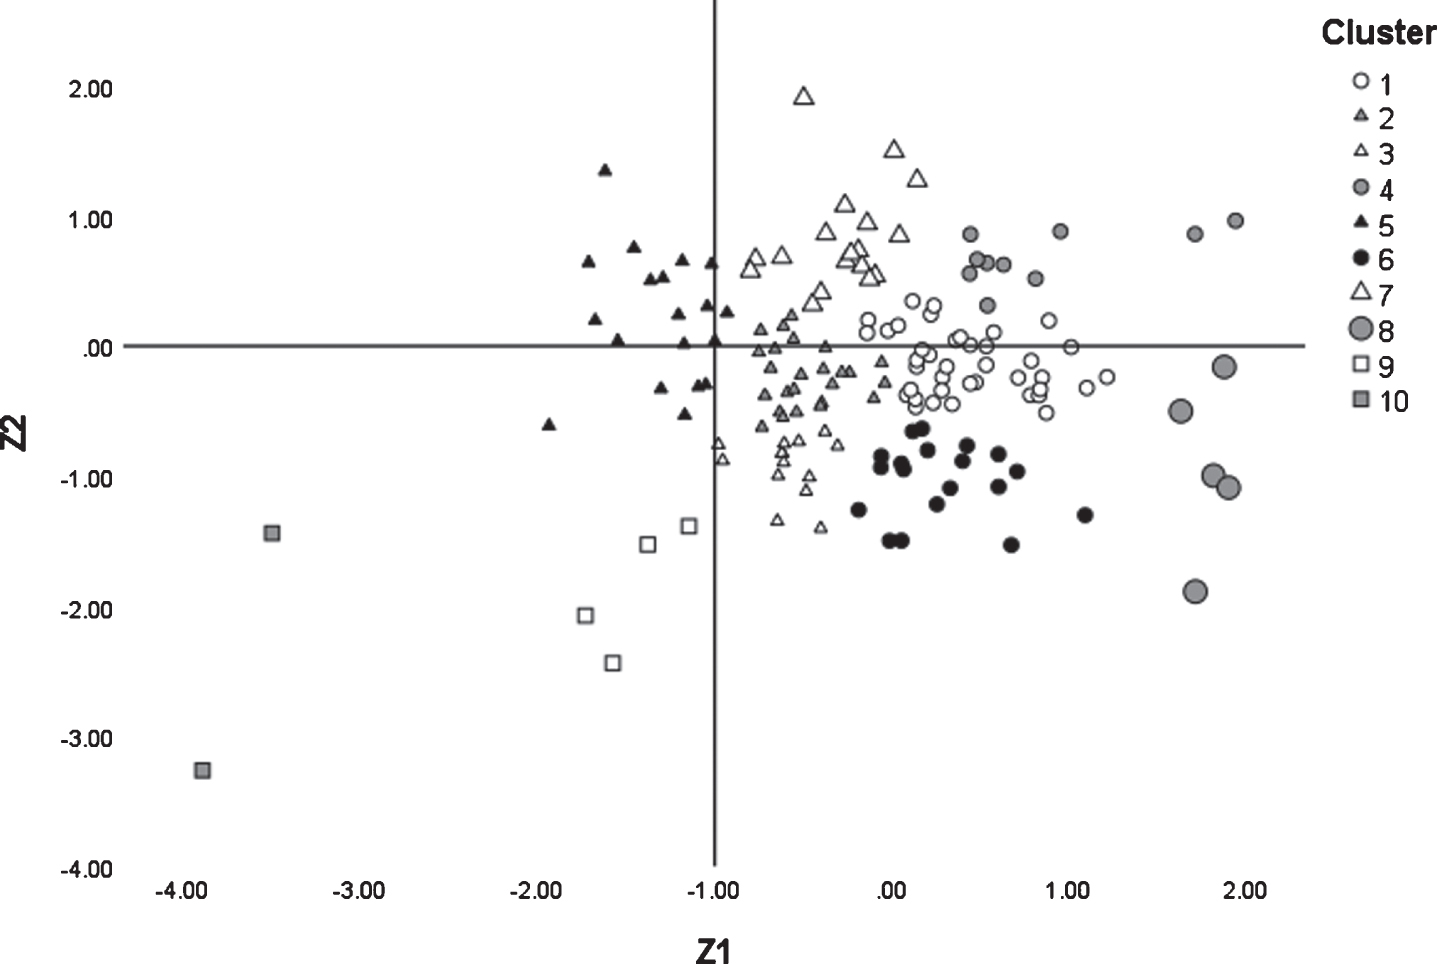
The hierarchical cluster analysis was used to divide the set of 155 heptathletes into clusters using a range of solutions from 2 to 10 clusters. Ward’s coefficients were 30.9 for 10 clusters, 109.0 for 3 clusters and 144.9 for 2 clusters. The two and three cluster solutions seemed to divide the sample based on ability rather than type. The mean athlete in the first cluster of the two cluster solution scored higher for z1 and points in the four disciplines that load onto z1 than the mean athlete of the other cluster. When the second cluster was split within the three cluster solution, one of the new clusters only contained six athletes. Figure 3 shows that the athletes are located throughout the range of values for the two factors. This was interpreted as heptathletes forming a continuum on each factor rather than forming distinct clusters. Therefore, it was decided not to analyse different clusters separately.
Fig. 3
The 10 cluster solution using Ward’s method with heptathletes plotted using the factors z1 and z2. The different shapes show the three cluster solution; circles, squares and triangles representing Clusters 1, 2 and 3 respectively.
3.4Feasible improvements
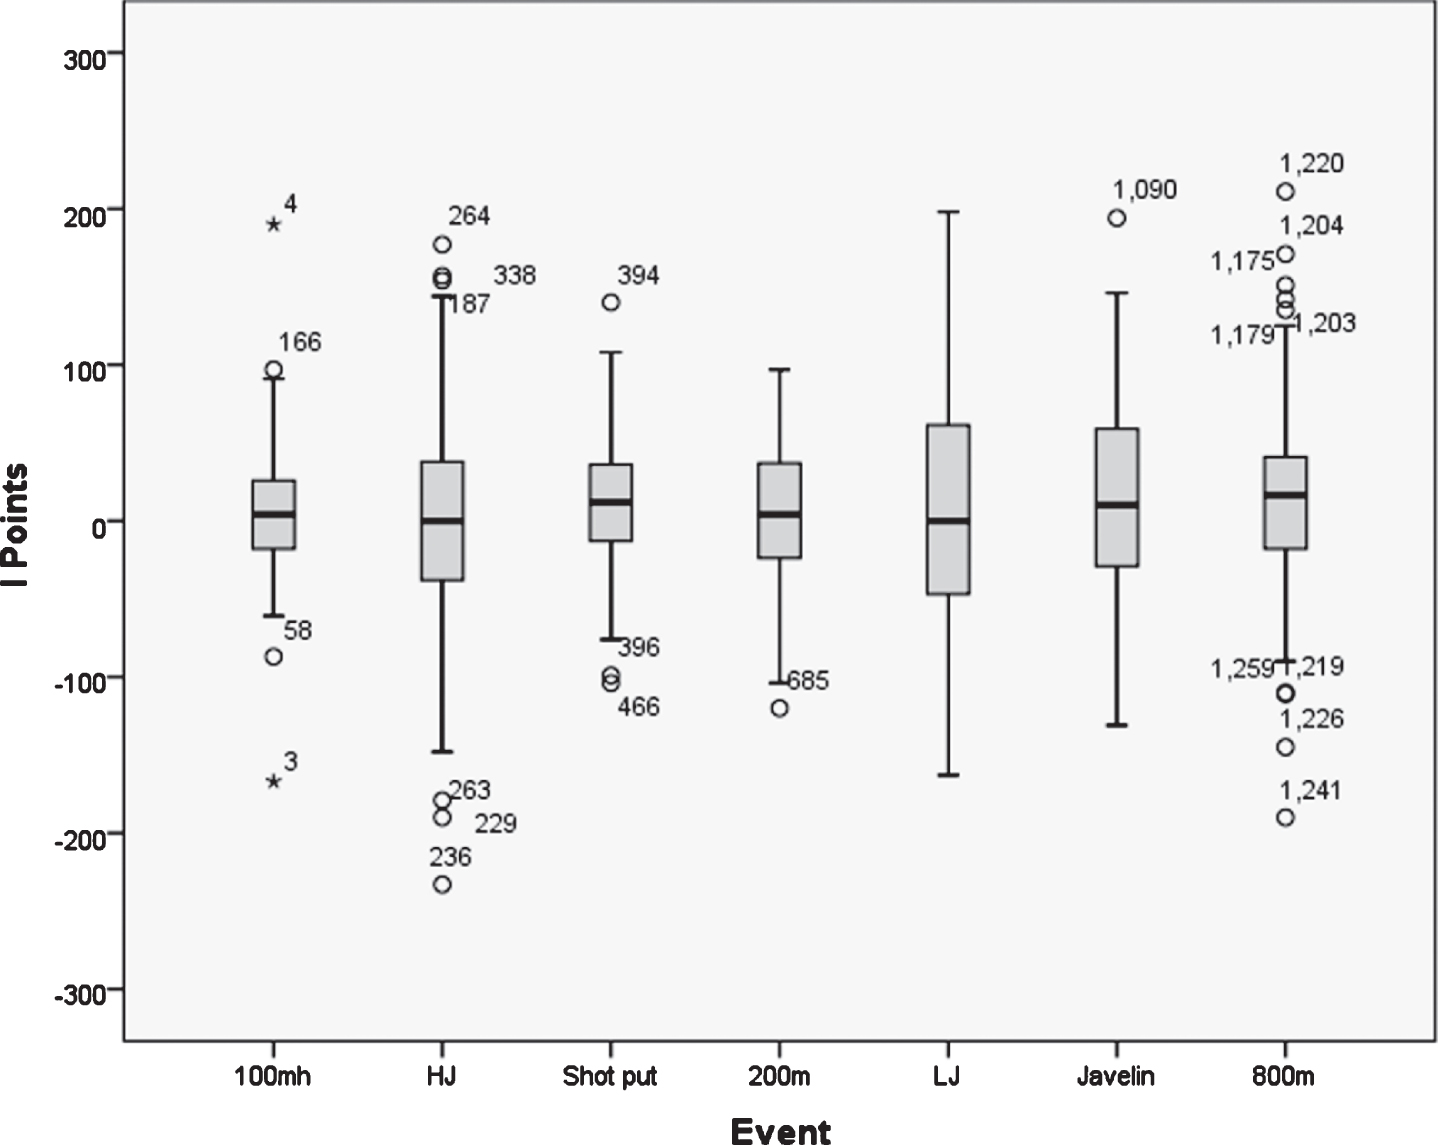
Figure 4 shows the range of year to year changes in Heptathlon performance for the 186 performances where the same athlete had completed a Heptathlon in the previous calendar year. Figure 4 reveals that while some athletes improve their performances in given disciplines, others see a decline in their points scored. The largest ranges of year to year changes in points scored are seen for the High Jump, Long Jump and Javelin, while the 100 m Hurdles has the smallest range. A reasonably large number of outlying performance changes were observed for the High Jump and 800 m.
Fig. 4
Range of consecutive year to year improvements in point scoring for the different Heptathlon disciplines (n = 186).
The initial performances and changes in performances between one calendar year and the next are summarised in Table 3. All disciplines have a negative correlation between the points scored in the previous year and change in points. This validates the notion that the better the athlete, the less scope there is for improvement. The regression models used to predict change in points were all significant except for the 100 m Hurdles which was very close to significant (p = 0.053). Table 3 also shows that the residual values for points improvements satisfy the assumptions of normality, homoscedasticity and independence for 6 of the disciplines. The residual values for year to year change in the 800 m show heteroscedasticity (r > 0.25) with the spread of residual values increasing with predicted change value.
Table 3
Descriptive statistics and coefficients between initial points awarded and positive improvements made in the different disciplines
| Discipline | Relationship between initial performance and improvement (points) | Improvement in points | Correlation between initial performance and improvement (points) | Regression coefficients | Distribution of residual values | Kolmogorov-Smirnov test of normality | Homoscedasticity test: association between predicted improvement and absolute residual value | Independence check: association between year of performance and residual value for | ||
| Most significant | Mean±SD | r | a | b1 | b2 | Mean±SD | p | r | r | |
| 100 m Hurdles | Inverse | 5.7±33.9 | – 0.136 | – 84.399 | 91976.339 | 0±33.587 | 0.200 | 0.137 | – 0.041 | |
| High Jump | Linear*** | 1.0±66.4 | – 0.339** | 246.877 | – 0.256 | 0±62.486 | 0.200 | – 0.120 | – 0.061 | |
| Shot Put | Linear*** | 11.5±38.4 | – 0.259** | 118.033 | – 0.139 | 0±37.128 | 0.200 | – 0.117 | – 0.086 | |
| 200 m | Quadratic** | 4.2±41.8 | – 0.178* | 1021.138 | – 2.109 | 0.001084 | 0±40.728 | 0.200 | – 0.060 | 0.057 |
| Long Jump | Linear*** | 7.2±72.6 | – 0.402** | 341.878 | – 0.371 | 0±66.431 | 0.057 | – 0.025 | – 0.122 | |
| Javelin | Linear*** | 13.4±63.7 | – 0.300** | 149.094 | – 0.180 | 0±60.753 | 0.200 | – 0.003 | 0.169* | |
| 800 m | Logarithmic*** | 13.8±50.7 | – 0.377** | 1694.055 | – 247.635 | 0±46.952 | 0.200 | 0.324** | 0.079 | |
Significance: *p < 0.05, **p < 0.01, ***p < 0.001.
The standard deviation of the residual values shown in Table 3 represents the spread of change in points scored for a given discipline. This standard deviation can be used throughout the range of predicted year to year change values for each discipline except for the 800 m where the data are heteroscedastic. The standard deviation for year to year change in 800 m performance shown in Table 3 applies to heptathletes who scored the mean number of points for this discipline. A regression equation describes how absolute residual value increases with predicted value for year to year improvement in the 800 m (|residual| = 28.637 + 0.513 predicted value). The mean absolute value of the standard normal distribution is 0.798 but the standard deviation of the standard normal distribution is 1. Therefore, these regression coefficients should be divided by 0.798 to determine an equation for the standard deviation to apply for a given predicted value of year to year change for the 800 m (SD = 35.886 + 0.643 predicted value).
Table 4 shows the correlations between the year to year points changes for the seven disciplines. Two pairs of disciplines have non-significant negative correlations for year to year points changes while the other pairs of events have positive correlations with 11 of these being significant. Therefore, year to year change in some disciplines may result in changes in some other disciplines.
Table 4
Pairwise bivariate correlations between year to year improvements in different pairs of disciplines
| 800 m | Javelin | Long Jump | 200m | Shot Put | High Jump | |
| 100 m Hurdles | 0.188* | 0.173* | 0.268** | 0.402** | 0.140 | 0.217 |
| High Jump | 0.187* | 0.028 | 0.230** | 0.170* | – 0.031 | |
| Shot Put | – 0.062 | 0.045 | 0.133 | 0.156* | ||
| 200 m | 0.324** | 0.065 | 0.403** | |||
| Long Jump | 0.273** | 0.012 | ||||
| Javelin | 0.083 |
Significance: *p < 0.05, **p < 0.01.
4Target setting process
This section of the paper proposes an approach to identifying areas where heptathletes can gain the most improvement in their total points score. Alternative strategies are considered that set different disciplines as priorities for improvement. These strategies are compared in terms of the probability of achieving a target point total. The approach commences by setting a “base” performance that represents the athlete’s current ability in each discipline. The next step applies univariate analysis that enters the “base” performance for each discipline into the regression models described in Table 3 to determine the “expected” improvement in each discipline. Once this has been done, the disciplines with the greatest scope for improvement are set as “priority” disciplines. The approach then uses a multivariate analysis to produce models for year to year change in the remaining disciplines in terms of the priority discipline(s). The independent variables of these models also include the “base” level of the discipline. For example, if we had prioritised the 200 m and were determining a model for year to year change in the 100 m Hurdles, we would include the initial points for the 100 m Hurdles and the expected change in the 200 m. This recognises that improving performance in a priority discipline may have a positive or negative impact on change in another discipline. The final step of the process involves simulating performance using the “base” performance, “expected” change in performance and the standard deviation of the residuals from each discipline’s year to year change model. This estimates the probability of achieving different point totals for the Heptathlon. This process is now described in detail in the following 8 steps:
1. “Base” performance: set the athlete’s current performance level. This could be their best performance for each discipline within a Heptathlon, or their performance in their best Heptathlon, or their best performance in the discipline outside the Heptathlon. The choice is a subjective one based on coaching knowledge and experience, considering the age of the athlete and how recent different performances are.
2. “Expected” change: use the univariate regression coefficients shown in Table 3 to determine the predicted improvement given the athlete’s base performance in each discipline.
3. “Priority” discipline: select a priority discipline(s) where the athlete has a relatively high expected change value.
4. Improvement level: decide on the level of improvement to aim for in the priority discipline(s). This represents the percentage of athletes of the given level that the improvement in the priority discipline should exceed. For example, 50% would mean the athlete’s improvement should be greater than the year to year change of 50% of heptathletes of their level. The corresponding z-score for this percentile is applied to the standard deviation of the residual values for the priority discipline(s) to determine the change in points being aimed for. For example, if the athlete aimed to improve more than 50% or 75% of athletes of their ability in the priority discipline, we would apply z-scores of 0 or 0.674 respectively. Where the residual values for the priority discipline exhibit heteroscedasticity (like in the 800 m), a scaling function is used to ensure the correct standard deviation of residuals is used for the given expected year to year change value.
5. Determine performance improvement required: the performance required to achieve the number of points aimed for in the priority discipline is determined using Equation (3) for timed running events and Equation (4) for measured throws and jumps events. These equations have changed the subject of the Equations (1) and (2) respectively to required performance in the discipline, X.
6. Multivariate analysis: the year to year change in each remaining discipline is modelled in terms of the initial points for that discipline set in step 1, and the change in the priority discipline(s) determined in step 4. This ensures that any positive or negative relationships between disciplines are addressed by adding change due the priority discipline(s). Curve fitting is used to determine the type of model for year to year improvement in the discipline that best fits the previous year’s performance in the discipline as well as the change in priority discipline(s). The multivariate regression analysis uses a stepwise approach. This may exclude the terms from the priority discipline meaning that the discipline is modelled using the regression coefficients shown in Table 3. Where a multivariate model is used, the standard deviation of the residual values is noted and the residual values are explored to ensure the model satisfies the assumptions of normality, homoscedasticity and independence of residual values. There are potentially many multivariate models that could be used in this step. There are 42 possible models given that any of the seven disciplines could be a priority discipline used in the model of any of the remaining six. Where pairs of disciplines are set as priorities, there are many more potential models that could be used.
7. Simulation: a simulator programmed in R is used to determine the probability of a full range of point totals for the Heptathlon. The expected change in each discipline, according to the models described in steps 4 and 6, is added to the base value to give the mean simulated points for the discipline. The points determined for the priority disciplines in step 4 are set as constants within the simulator. Random variation about this mean for the remaining disciplines is simulated using random probabilities between 0 and 1 which are mapped onto values from the given residual distribution. The random variance is added to the mean points to give the simulated points for the discipline. The sum of simulated points for the seven disciplines gives the simulated Heptathlon points. The simulator is run 1,000,000 times with the distribution of simulated Heptathlon points being saved.
8. Consider the next priority discipline: return to step 3 and apply steps 3 to 7 to the next priority discipline or set of priority disciplines. Once all of the priority disciplines have been analysed and simulated, compare the probability of achieving the target points between different the strategies.
(3)
(4)
5Evaluation study
This section of the paper evaluates the proposed target setting approach using two international heptathletes as example cases; Nadine Visser (Netherlands) and Katarina Johnson-Thompson (Great Britain). These case studies were done in 2017 and suggest targets and priorities which are evaluated using actual performances in the European Championships of 2018 and World Championships of 2019.
5.1Case study 1: Nadine Visser
The first case study examines Dutch heptathlete Nadine Visser. At the time of this study Visser was 23 years old and had finished 8th in the 2015 World Championships, 19th in the 2016 Olympic Games and 7th in the 2017 World Championships and had a personal best of 6467 points. The highest points score required to achieve a bronze medal at a major international Championship between 2004 and 2017 was 6683 points. Therefore, a target of 6700 points could be set for the athlete to win a medal in the 2018 European Championships or 2019 World Championships. Visser is an athlete who competed in both the Heptathlon and the individual 100 m Hurdles at the 2017 World Championships. She was the third fastest European athlete in the 100 m Hurdles with a time of 12.83 s (7th place) and she had a personal best of 12.78 s for this discipline, which was achieved during a Heptathlon. Therefore, she needed to consider whether she entered the Heptathlon, the 100 m Hurdles or both events during the 2018 European Championships and 2019 World Championships. Visser’s personal best performances for the seven disciplines of the Heptathlon can be seen in Table 5, with two of her best discipline performances occurring within her personal best Heptathlon, and the five other disciplines achieving personal best performances in years since. If Visser were to equal her 7 personal bests within a heptathlon within the same heptathlon, a points total of 6602 points would be achieved. The total of 6602 points is greater than her personal best for the Heptathlon which needs to be considered when using this as the “base” performance within the proposed approach.
Table 5
Personal best performances by individual discipline for Visser
| Discipline | Personal Best Heptathlon (2015) | Personal Bests within a Heptathlon | |||||
| Performance | Points | Rank | Year | Performance | Points | Additional Points | |
| 100 m Hurdles (s) | 13.04 | 1118 | 22 | 2017 | 12.78 | 1158 | 40 |
| High Jump (cm) | 177 | 941 | 184 | 2015 | 180 | 978 | 37 |
| Shot Put (m) | 13.15 | 737 | 232 | 2017 | 13.64 | 770 | 33 |
| 200 m (s) | 23.62 | 1017 | 31 | 2017 | 23.46 | 1031 | 14 |
| Long Jump (cm) | 648 | 1001 | 35 | 2015 | 648 | 1001 | 00 |
| Javelin (m) | 44.01 | 744 | 188 | 2015 | 44.01 | 744 | 00 |
| 800 m (min:s) | 2: 13.88 | 909 | 147 | 2015 | 2 : 13.08 | 920 | 11 |
| Total points | 6467 | 6602 | 135 | ||||
Table 6 shows “expected” year to year changes estimated for international heptathletes of Visser’s ability in the seven disciplines. The disciplines where she has the greatest scope for improvement are the Shot Put and the Javelin. If she made an improvement equivalent to the 50th percentile (z-score of 0) of changes in these disciplines, she would add 11.0 and 15.2 points respectively. If one considers the conditional probability of exceeding the 50th percentile in two events to be 0.25, then we can compare this strategy with aiming for an improvement equivalent to the 75th percentile in a single discipline. The 75th percentile for change in the Shot Put and Javelin of an athlete of Visser’s ability are 36.0 and 56.2 respectively.
Using Equation (4), we can determine the performances required to achieve the additional points set out in the three strategies being considered:
• Setting the Shot Put as the priority discipline and aiming for a 75th percentile improvement is equivalent to 806 points requiring 14.17 m for the discipline.
• Setting the Javelin as the priority discipline and aiming for a 75th percentile improvement is equivalent to 800.2 points requiring 46.88 m for the discipline.
• Setting the Shot Put and Javelin as the priority disciplines and aiming for a 50th percentile improvement in each is equivalent to 781 and 759.2 points respectively requiring 13.80 m and 44.75 m for the disciplines respectively.
There were two multivariate models where change in Shot Put performance was a significant predictor of change; these were the 100 m Hurdles and the 200 m. However, change in points in the Javelin was not a significant predictor of change in points in any other discipline. Table 6 shows the two multivariate models that include change of points in the Shot Put. The residual values of these models satisfied the assumptions of normality, homogeneity of variances and independence. All other disciplines used the univariate models shown in Table 3. The mean additional points achieved were 36.8, 32.3 and 3.8 when the Shot, Javelin and both disciplines were set as priorities respectively. The best strategy involved focussing on the Shot Put and would lead to a points total of 6638 points on average. Figure 5 shows the result of simulating the points changes under the three strategies. This suggests that focussing on improving in the Shot Put gives the highest probability (0.317) of exceeding the 6700 points deemed necessary to achieve a bronze medal in a major championship. Achieving this target would have been good enough for a bronze medal in the 2018 European Championships and the 2019 World Championship, as speculated. Indeed, equalling all of her personal bests within the Heptathlon would have resulted in a dead heat at 6602 points between Visser and the actual bronze medallist in the 2018 European Championships (Carolin Schäfer) and would have beaten the bronze medallist in the 2019 World Championship (Verena Preiner on 6560 points). Visser actually entered the 100 m Hurdles instead of the Heptathlon in both the 2018 European Championships and the 2019 World Championships. Her personal best, in 2017, of 12.78 s for this event was set within a heptathlon and was faster than all but one European finalist’s times in the 2017 World Championship and only 0.02 s behind the third fastest European finalist’s time in the 2016 Olympic Games. Indeed Visser, herself was the third fastest European athlete in the 100 m Hurdles in the 2017 World Championships. It must, therefore, be recognised that she may have had a better chance of a medal in the 100 m Hurdles than the Heptathlon in the 2018 European Championships given the ambitious “base” performance used in the current analysis. She finished 4th in the 100 m Hurdles at the 2018 European Championships with a time of 12.88. Her best time of 12.78 s would have been 0.01 s slower than the actual bronze medallist’s time, so in hindsight she would have required a new personal best in the event to win a medal. In the 2019 World Championships, Visser set a new Dutch national record of 12.62 s in the semi-final and was the fastest European athlete in the final with a time of 12.66 s. Entering an individual event as well as the Heptathlon is a possibility for international heptathletes, as Visser did at the 2017 World Championships. There were four of the heptathletes who competed in the 2018 European Heptathlon who had a performance in one discipline each that would have bettered at least one finalist in the corresponding individual event. This was not the case for any of the male athletes who competed in the Decathlon at the 2018 European Championship. Whether Visser competes in one or both of the Heptathlon and individual 100 m hurdles in the 2020 Olympic Games depends on qualifying as well as the timetable for these events in Tokyo. Given her success in 2019 in the 100 m Hurdles, she may be best advised to concentrate on the individual 100 m Hurdles in the 2022 European Championships where she can expect to be contender for the gold medal.
Fig. 5
Nadine Visser simulation.
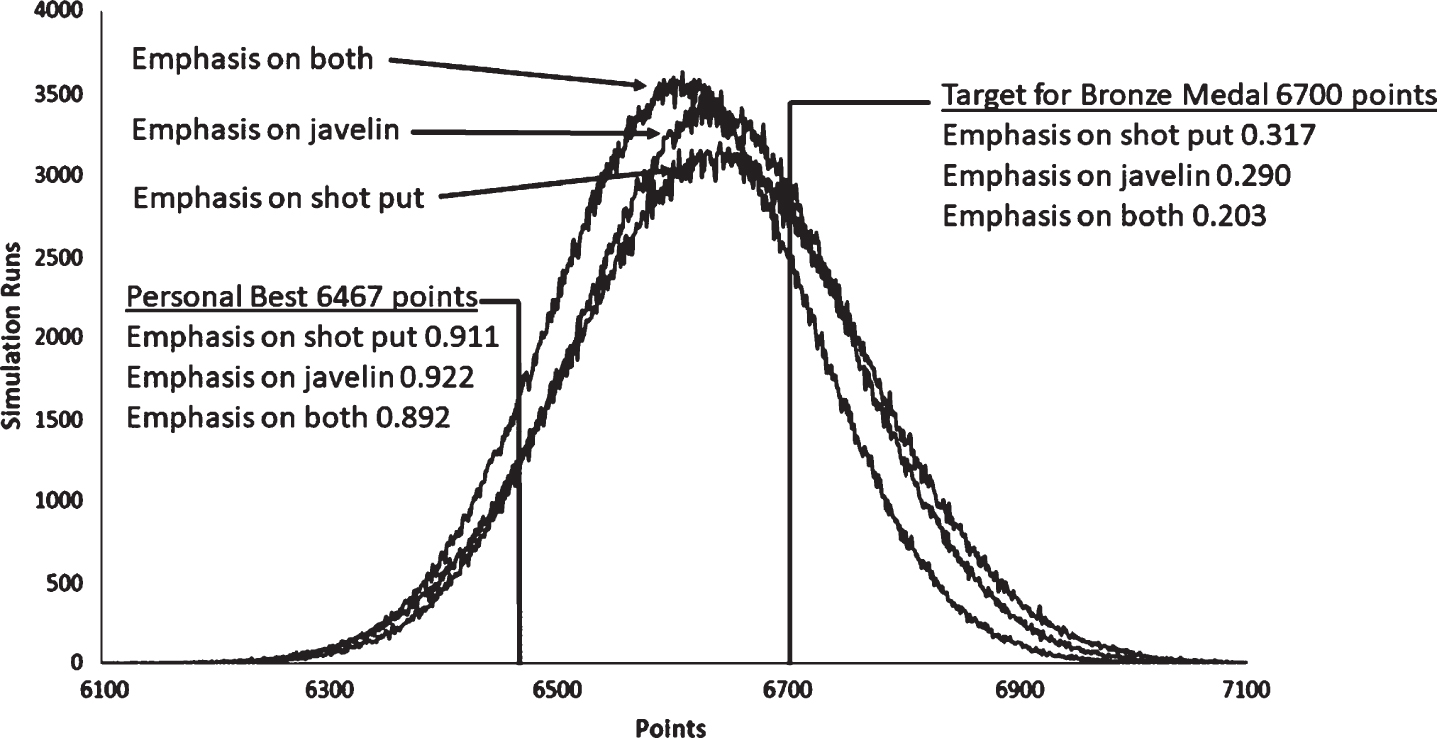
Table 6
Visser (x1 = base points in the 100 m Hurdles, Δx1 = change in points in the 100 m Hurdles, Δx3 = change in points in the Shot Put, x4 = base points in the 200 m, Δx4 = change in performance in the 200 m
| Discipline, y | Base | Univariate | Relation to Shot Put | Relation to Javelin | Multivariate model in terms of priority discipline(s) | Shot Put 75% | Javelin 75% | Both | |
| Exp, y’ | SD | Exp±SD | Exp±SD | Exp±SD | |||||
| 100 m Hurdles | 1158 | – 5.0 | 33.6 | Linear* | Linear | Δx1 = 4.081 + 0.141 Δx3 | 9.2 ± 36.4 | – 5.0 ± 33.6 | 5.6 ± 36.4 |
| High Jump | 978 | – 3.5 | 62.5 | Cubic | Quadratic | – 3.5 ± 62.5 | – 3.5 ± 62.5 | – 3.5 ± 62.5 | |
| Shot Put | 770 | 11.0 | 37.1 | Cubic | 36.0 | 11.0 ± 37.1 | 11.0 | ||
| 200 m | 1031 | – 1.0 | 40.7 | Linear* | Linear | Δx4 = 1071.636 – 2.226x4 + 0.00115x42 + 0.173Δx3 | 5.3 ± 40.2 | – 1.0 ± 40.2 | 0.9 ± 40.2 |
| Long Jump | 1001 | – 29.5 | 66.4 | Linear | Quadratic | – 29.5 ± 66.4 | – 29.5 ± 66.4 | – 29.5 ± 66.4 | |
| Javelin | 744 | 15.2 | 60.8 | Cubic | 15.2 ± 60.8 | 56.2 | 15.2 | ||
| 800 m | 920 | 4.1 | 38.5 | Linear | Cubic | 4.1 ± 38.5 | 4.1 ± 38.5 | 4.1 ± 38.5 | |
| Total | 6602 | – 8.7 | 36.8 | 32.3 | 3.8 | ||||
5.2Case study 2: Katarina Johnson-Thompson
The second case study examines British heptathlete Katarina Johnson-Thompson. Aged 24 years old at the time this study, she finished in 13th, 5th, 6th and 5th positions at the 2012 Olympic Games, 2013 World Championships, 2016 Olympic Games and 2017 World Championships respectively. Johnson-Thompson’s personal best prior to 2018 was 6558 points. Table 7 shows that her best Heptathlon performance at the time does not actually contain a best performance within a Heptathlon for any of the seven disciplines. Using Johnson-Thompson’s personal bests within heptathlons gives a “base” of 6979 points, which is 421 points greater than her personal best for the Heptathlon and a greater score than the British Record of 6955 points held by Jessica Ennis-Hill at the time. This target is, therefore, a very ambitious one. With the 2017 Gotiz Hypo-Meeting winning score of 7013 points by Nafissatou Thiam (IAAF, 2017 – Accessed: 4th December 2017), it could be forecast that to achieve a Gold medal at the 2018 European Championships or 2019 World Championships could require more than 7000 points. With this prospect, it is worthwhile looking marginally further to the European Record of 7032 points held by Carolina Kluft (Sweden) as a primary target.
Table 7
Personal best performances by each discipline for Johnson-Thompson
| Discipline | Personal Best Heptathlon (2017) | Personal Bests within a Heptathlon | |||||
| Performance | Points | Rank | Year | Performance | Points | Additional Points | |
| 100 m Hurdles (s) | 13.33 | 1075 | 54 | 2017 | 13.29 | 1081 | 06 |
| High Jump (cm) | 180 | 978 | 116 | 2016 | 198 | 1211 | 233 |
| Shot Put (m) | 12.47 | 692 | 323 | 2016 | 13.14 | 737 | 45 |
| 200 m (s) | 22.86 | 1093 | 04 | 2016 | 22.79 | 1100 | 07 |
| Long Jump (cm) | 656 | 1027 | 15 | 2014 | 692 | 1145 | 118 |
| Javelin (m) | 41.72 | 700 | 268 | 2015 | 42.01 | 706 | 06 |
| 800 m (min:s) | 2 : 08.10 | 993 | 15 | 2013 | 2 : 07.64 | 999 | 06 |
| Total | 6558 | 6979 | 421 | ||||
Table 8 shows the year to year changes estimated for international heptathletes of Johnson-Thompson’s ability in the seven disciplines. Like Nadine Visser, the disciplines where she has the greatest scope for improvement are the Shot Put and Javelin. Therefore, the same univariate and multivariate models are used but with different values due to the different “base” level set for Johnson-Thompson. As can be seen in Table 8, athletes at a level close to 7000 points are expected to have a lower score a year later. The best strategy for Johnson-Thompson is to focus on the Shot Put which gives a mean change of points of – 68.3 implying a points total of 6911 points.
Table 8
Johnson-Thompson (x1 = base points in the 100 m Hurdles, Δx1 = change in points in the 100 m Hurdles, Δx3 = change in points in the Shot Put, x4 = base points in the 200 m, Δx4 = change in performance in the 200 m
| Discipline, y | Base | Univariate | Relation to Shot Put | Relation to Javelin | Multivariate model in terms of priority discipline(s) | Shot Put 75% | Javelin 75% | Both | |
| Exp, y’ | SD | Exp±SD | Exp±SD | Exp±SD | |||||
| 100 m Hurdles | 1081 | 0.7 | 33.6 | Linear* | Linear | Δx1 = 4.081 + 0.141 Δx3 | 9.8 ± 36.4 | 0.7 ± 33.6 | 6.2 ± 36.4 |
| High Jump | 1211 | – 63.1 | 62.5 | Cubic | Quadratic | – 63.1 ± 62.5 | – 63.1 ± 62.5 | – 63.1 ± 62.5 | |
| Shot Put | 737 | 15.6 | 37.1 | Cubic | 40.6 | 15.6 ± 37.1 | 15.6 | ||
| 200 m | 1100 | 12.9 | 40.7 | Linear* | Linear | Δx4 = 1071.636 – 2.226x4 + 0.00115x42 + 0.173Δx3 | 21.6 ± 40.2 | 12.9 ± 40.2 | 17.2 ± 40.2 |
| Long Jump | 1145 | – 82.9 | 66.4 | Linear | Quadratic | – 82.9 ± 66.4 | – 82.9 ± 66.4 | – 82.9 ± 66.4 | |
| Javelin | 706 | 22.0 | 60.8 | Cubic | 22.0 ± 60.8 | 63.0 | 22.0 | ||
| 800 m | 999 | – 16.3 | 25.4 | Linear | Cubic | – 16.3 ± 25.4 | – 16.3 ± 25.4 | – 16.3 ± 25.4 | |
| Total | 6979 | – 111.2 | – 68.3 | – 70.2 | – 101.2 | ||||
Using Equation (4), we can determine the performance improvements required to achieve the points aimed for in the three strategies under consideration:
• Setting the Shot Put as the priority discipline and aiming for a 75th percentile improvement is equivalent to 777.6 points requiring 13.75 m for the discipline.
• Setting the Javelin as the priority discipline and aiming for a 75th percentile improvement is equivalent to 769.0 points requiring 45.26 m for the discipline.
• Setting the Shot Put and Javelin as the priority disciplines and aiming for a 50th percentile improvement in each is equivalent to 752.6 and 728 points respectively requiring 13.37 m and 43.13 m for the disciplines respectively.
Fig. 6
Johnson-Thompson simulation.
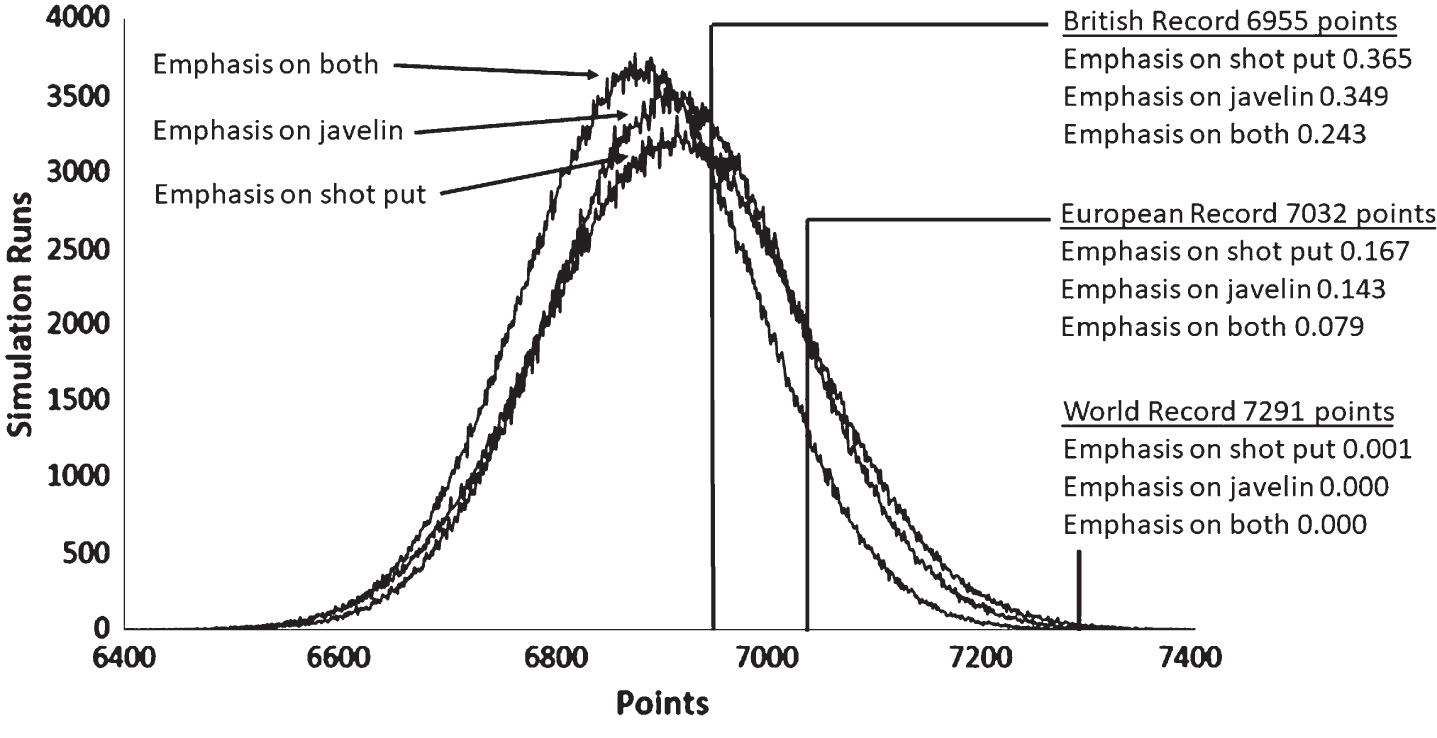
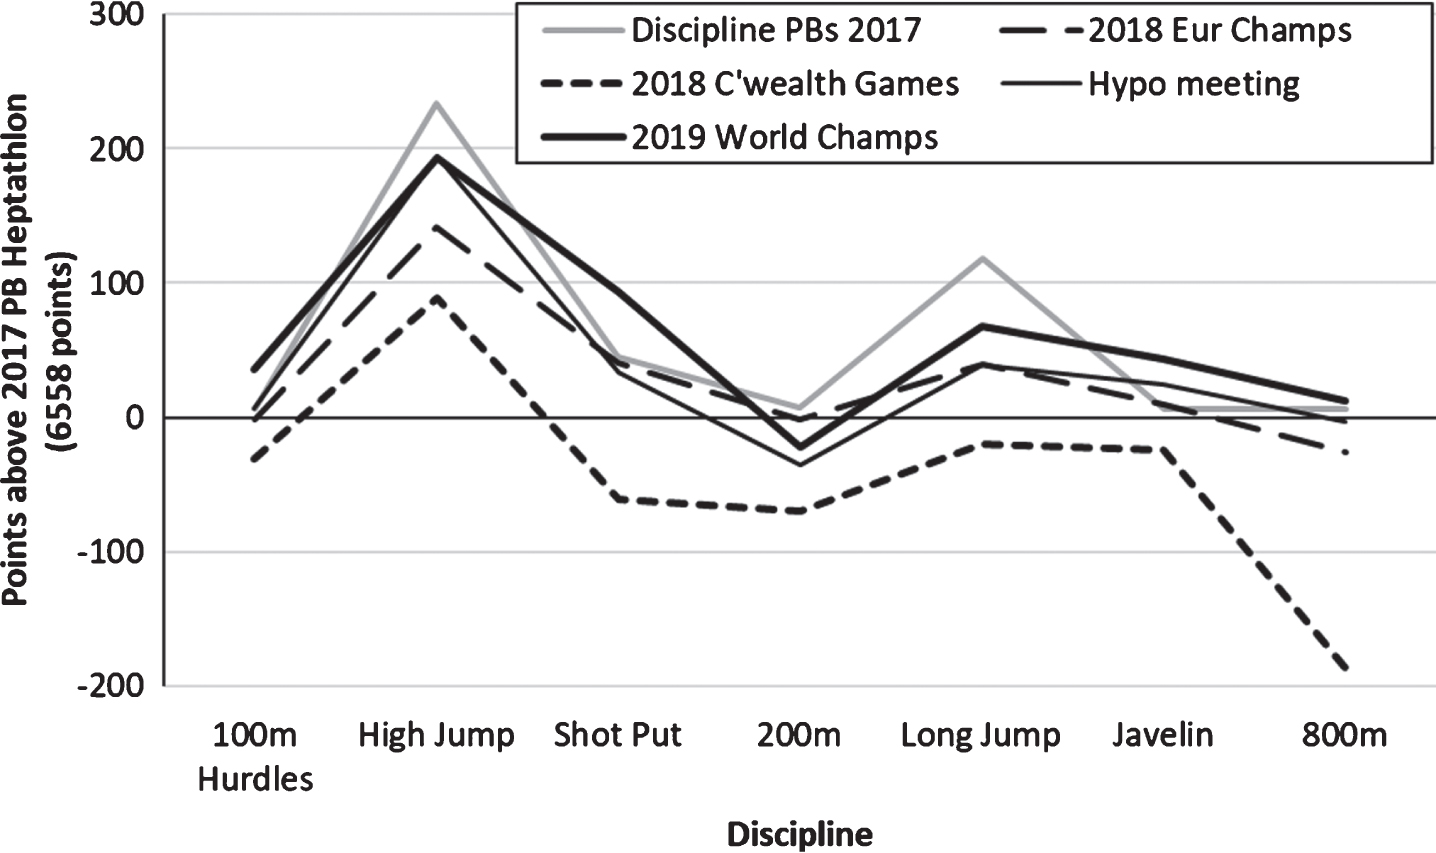
Figure 7 uses Katarina Johnson-Thompson’s 2018 and 2019 Heptathlon performances in evaluating the target setting approach proposed in this paper. This relates the points she achieved to her personal best Heptathlon performance of 6558 points (pre-2018). Her 2018 Commonwealth Games points total of 6255 was sufficient to win the gold medal ahead of the second placed athlete’s total of 6133 points. This is potentially an example of a target changing during a Heptathlon event. A new personal best was a possibility after 3 events but not after 6 events; hence the relatively modest 2 : 21.24 time in the 800 m to complete the Heptathlon in first place. Her 2018 European Championships performance of 6816 points was a new personal best just 57 points behind Nafissatou Thiam’s championship winning score. Thiam’s best javelin throw within the European Championships Heptathlon was 57.91 m which was worth 85 points more than her second best throw of 53.55 m. Thus, without her best throw she would not have finished ahead of Johnson-Thompson. This raises an interesting discussion point which is within-discipline variability. A heptathlete with a high variability in a discipline with multiple trials (such as the Javelin, High Jump, Shot Put, and Long Jump) may achieve more points than a more consistent athlete with a better mean performance across trials. Ultimately, it is only the best performance within a series of throws (or jumps) that counts towards the points total. Johnson-Thompson won the 2019 World Championship, breaking the UK record with a points total of 6981. In so doing, she improved her Shot Put and Javelin points to 785 and 743 respectively. This new personal best contains her best performances within heptathlons for the 100 m Hurdles, Shot Put, Javelin and 800 m. The primary target of 7032 points to break the European record is an ambitious one, but with Nafissatou Thiam having a personal best of 7013 points, a score of over 7000 points may be required to win in the 2020 Olympic Heptathlon.
Fig. 7
Evaluation of Katarina Johnson-Thompson’s 2018 and 2019 international championship Heptathlons.
The process of identifying the disciplines a heptathlete can gain most additional points in recognises that the scope for improvement is negatively associated with their current level of performance in the discipline. This is illustrated by the lower mean improvement scores predicted for Katarina Johnson-Thompson than Nadine Visser for High Jump, Long Jump and 800 m. The most challenging aspect of the approach is setting the current performance level of the athlete. This requires coach knowledge of the athlete, their experience level, performances within heptathlon events as well as other performances. The interpretation of the case study simulations may appear inconsistent and this is largely due to consideration of the context of previous performances. Katarina Johnson-Thompson’s Heptathlon performances prior to 2018 are widely viewed as below her capabilities to a greater extent that those of Nadine Visser. Hence the type of ambitious improvement suggested for Katarina Johnson-Thompson may be considered more feasible than similar improvements suggested for Nadine Visser. Those using this approach should consider the specific circumstances surrounding a heptathlete’s personal best performance, especially if they under performed in one or more disciplines. The positive and significant associations between improvements in many pairs of disciplines suggest that it may be more beneficial for some athletes to develop common fitness attributes that contribute to these disciplines than to focus on a single discipline. However, the simulations suggested that both Johnson-Thompson and Visser would achieve greater improvements focussing on the Shot Put rather than on the Shot Put and Javelin. The predictions recognise the possibility of lower than best performance in one or more disciplines during future heptathlons.
6Discussion
The largest variances in points scored were in the High Jump and Javelin disciplines. One explanation for this is that there is a genuine high range spread of ability amongst heptathletes in these two disciplines, which could be shown if potentially compared with the performances of these disciplines in their usual non-combined event format. Alternatively, the current scoring equations create wider spreads of points for these two disciplines than for the other five. This concurs with previous research that concludes that points awarded in the different disciplines are not uniform (Westera, 2007; Gassmann et al., 2016). This suggests that the Heptathlon advantages specialists with greater speed than all-round athletes (Gassmann et al., 2016). While the focus of previous research has been to assess these issues with the scoring system, heptathletes should seek to maximise their points score under this system while the sport continues to use it. The non-uniform spread of points awarded in different disciplines has also been found in the Decathlon (Barrow, 2014). However, Barrow (2014) speculated that running disciplines are “weighted” more favourably in that there are more running events than throwing events within the Decathlon. Knowledge about the spread of points scored in different disciplines can be applied from a performance perspective, by identifying specific disciplines to target to exploit the imperfections in the scoring system. This was the motivation for the proposed process described in this paper. The largest number of outliers below the inter-quartile range was observed in the 800 m. This could be explained by the 800 m being the last discipline of the Heptathlon so there is the chance that some athletes may have acquired injuries, as well as finishing positions having already been predetermined before the 800 m. An example of this was the 800 m that Katarina Johnson-Thompson ran at the end of the Commonwealth Games Heptathlon.
Table 2 shows that the factors representing speed and power dimensions do have some negative correlations with some events. The speed dimension has a low negative correlation with Javelin performance while the power dimension has a low negative correlation with the 200 m and the 800 m. This partially agrees with previous research on the Heptathlon by Gassmann et al. (2016), who also found negative correlations between their speed dimension and the Shot Put and between their strength dimension and the 100 m Hurdles. These differences between the current findings and those of Gassmann et al. (2016) may be explained by the different samples used with Gassmann’s data coming from 10 heptathletes who had won World or Olympic Championships while the current study used 409 athletes who competed in international championship heptathlons with the majority not being medallists. An interesting contrast between the two studies is that the current data revealed higher correlations between the power dimension and all seven disciplines than those observed in Gassmann et al.’s study. This may be due to a wider range of values for each discipline in the current study where a wider range of athletes were included.
The power dimension, being highly positively correlated with performance in the two throw disciplines, agrees with the findings of Gassmann et al. (2016), indeed the positive correlations are higher in the current data. The Javelin and Shot Put both require similar physiological strength and explosive power elements, in addition to analogous technical aspects of upper body movement for throwing, so would likely both benefit from associated throwing technique exercises and training of the same muscle groups (Silvester, 2003). The lower positive correlation of the High Jump and the power dimension (r = 0.435) is comparable with that found in Gassmann et al.’s (2016) study (r = 0.37). A further similarity to Gassmann et al.’s findings is that the High Jump has a higher positive correlation with the speed dimension than the power dimension. The positive correlation between the Long Jump and High Jump (r = 0.496) may be explained by these jumping disciplines sharing the technical aspect of a jump take-off, in addition to physical power, especially of the lower limbs to generate height and distance (Van Damme et al., 2002). Training aspects of jumping and take-off technique, along with physical enhancement of the lower limbs for generating power would be beneficial to performance in both jumping disciplines. Running disciplines were found to be significantly correlated with each other and with the Long Jump. All of these disciplines can be identified as being sprint-related, utilising similar applications of speed applied across short distances, with running efficiency and technique as prominent contributors in the 800 m also supporting performance in the Long Jump and shorter distance sprints (Lease, 1999). Positive relationships between these disciplines were also found by Fanshawe (2012) and Gassmann et al (2016) who acknowledged these disciplines as being the highest scoring. The majority of heptathletes perform superiorly in the sprinting and jumping disciplines in comparison to the throwing disciplines. This could be due to throwing events requiring less running and shorter explosive power efforts, and so a stronger, more powerful physique would be beneficial, as opposed to a slighter, faster anatomy for sprinting and jumping (Van Damme et al., 2002). Given the contribution of running and jumping disciplines to the heptathlon, it is recommended that athletes focus their training efforts upon developing speed, as improvement of this fitness component would likely benefit five of the seven disciplines, whilst not being detrimental to performance in the other two disciplines.
The cluster analysis conducted in the current investigation did not split the sample into the generalist and specialist classes identified by Gassmann et al. (2016). Indeed, the data analysed in the current study seemed to show a continuum of performers on each of the two broad dimensions of speed and power. The two and three cluster solutions attempted in the current research classified hepthathletes according to ability rather than type. The decision not to analyse different clusters of heptathletes is consistent with previous research on the Decathlon (Jayal et al., 2018) that found a predominant type of decathlete who was relatively strong in the 100 m, 400 m, Long Jump and 110 m Hurdles.
The current study found that year to year improvements were negatively related to initial performance; hence the better an athlete is at a discipline, the more difficult it is to improve. This has also been found to be the case in the decathlon (Jayal et al., 2018). Thus the proposed approach recognised the likelihood of athletes scoring highly in some disciplines being expected to score fewer points in future heptathlon competitions. For example, Katarina Johnson-Thompson was expected to lose between 68 and 101 points depending on the strategy chosen. The approach needs to draw on coach knowledge of athletes, when subjectively choosing improvement levels to generate targets in different disciplines. Indeed, any such analytics approach needs to use predictive modelling drawing on rich contextual information (Alamar, 2013). The method for performance target setting is ‘prior performance driven’ where targets are set based on past performance and then fed forward to set incremental improvements on these performances in each discipline. The simulations estimate the probabilities of exceeding targets that are based on the necessary points total needed to achieve a certain finishing position. The creation of the target setting approach in this study enables a combination of the methods aforementioned to be applied and utilised by practitioners with greater sport-specific experience and knowledge.
The proposed approach to identifying the disciplines where heptahtletes can make the biggest improvement to their total points score is only recommended for senior international heptathletes whose performances are within the range of performances of the 186 pairs of performances used in the third analysis of the data. This is because the models for year to year improvement were developed using these data. Extrapolating the approach beyond this range of performances is not appropriate. It is also worth acknowledging the limitations of the current research. The data used in the first analysis (409 heptathlon performances) contain non-independent data in that the data come from 155 different athletes, some of whom are represented more than once. The benefit of this is that the demands of the Heptathlon are represented better by including multiple performances of those who qualify more frequently for major championships than others. The main limitation of using non-independent data is that the magnitude of correlations achieved are lower than the equivalent correlations when calculated from the mean performances of the 155 heptathletes; this is the case for all but three pairs of disciplines. This is because individual performances may include additional variance due to exceptional performances, under-performance in some disciplines, fatigue, injury or lower effort in day 2 events if a heptathlete’s target is not achievable after the first day. Therefore, the correlations shown in Table 2 may under-estimate the relationships between pairs of disciplines. This has implications for the proposed target setting approach and it is recommended that those applying this approach are aware of relationships between different disciplines, especially negative relationships that have also been found in previous research (Gassmann et al., 2016). A further limitation is in the third analysis where the 186 year to year improvements were analysed. Performances in the Commonwealth Games had lower total points scores (846 points on average) than Olympic (887), World (881) and European Championships (877). Indeed Katarina Johnson-Thompson’s Gold medal in the 2018 Commonwealth Games was achieved with a lower total points score than her Silver medal in the 2018 European Championships. While neither of these performances were included in 186 year to year pairs of performances, it is possible that some year to year improvements may be due to under-performance in the first performance of the pair rather than an improvement in personal best performance. Hence the targets set using the proposed approach may seem very ambitious if year to year improvements used to evidence improvement levels includes below-standard initial performances. For example, athletes in the data set used to create the models may have had difficulties in disciplines where some attempts may not have counted, for example High Jump attempts not being cleared or foul throws in the Javelin. Practitioners should also be aware that the estimated probabilities in the current approach are based on distributions that excluded extreme changes in performances in the 100 m Hurdles and Long Jump as well as an extreme difference between actual and expected performance in the 800 m. There is always a possibility of falling at a hurdle, not making valid attempts at the Long Jump or carrying an injury into the 800 m which is the final event.
7Conclusions
This study aimed to examine scoring within the Heptathlon to identify areas of performance to subsequently inform future training and target setting. Subsets of disciplines were strongly and positively correlated such as the throwing, jumping and sprinting disciplines. The throwing disciplines were found to provide a smaller percentage contribution to the overall performance than the other disciplines. The implications of this could inform either changes to the Heptathlon scoring system, or identification of which disciplines to target for feasible improvements from a performance perspective.
The approach for calculating feasible improvements supported the notion that better athletes have less scope to improve. This method can inform coaches and athletes of statistically feasible improvements relative to the ability of the athlete within individual disciplines.
Future research could look to apply the approach used for generating feasible improvements and target setting to other combined events such as the Decathlon, or could be modified to be applied to other sporting areas such as the triathlon. Additionally, the scope of this process could be broadened by aligning itself with coaching to gain a better insight into the process of planning a training programme, competition calendar and setting future targets for performance.
References
1 | Alamar,B. , (2013) , Sports Analytics: A Guide for Coaches, Managers and Other Decision Makers, New York: Columbia University Press. |
2 | Barrow, J. , (2014) , Decathlon: The Art of Scoring Points. In: 50 Visions of Mathematics, edited by D.O’Briain, 11-15, Oxford, UK: Oxford University Press. |
3 | Fane, T. , (2012) , Seven into two: Principal components analysis and the Olympic heptathlon, Significance, 9: , 40–42. |
4 | Franks, I.M. , Hughes, M. , (2016) , Soccer analytics: successful coaching through match analysis, Maidenhead, UK: Meyer and Meyer Sport. |
5 | Gassmann, F. , Fröhlich, M. , Emrich, E. , (2016) , Structural analysis of women’s heptathlon, Sports, 4: (1), 12. |
6 | Hughes, M.D. , Bartlett, R.M. , (2002) , The use of performance indicators in performance analysis, Journal of Sports Sciences, 20: (10), 739–754. |
7 | IAAF, 2001, IAAF Scoring Tables for Combined Events, 1-25. |
8 | IAAF, 2017, IAAF – Results: Heptathlon Women. 43rd Hypo Meeting” 28th May 2017. https://www.iaaf.org/results/iaaf-world-combined-events-challenge/2017/43rd-hypo-meeting-6077/women/heptathlon/800-metres/points#resultheader, accessed: 4th December 2017. |
9 | James, N. , Mellalieu, S.D. , Jones, N.M.P. , (2005) , The development of position specific performance indicators in professional rugby union, Journal of Sports Sciences, 23: , 63–72. |
10 | Jayal, A. , McRobert, A. , Oatley, G. , O’Donoghue, P.G. , (2018) , Sports Analytics: analyzing, visualization and decision making in sports performance, London: Routledge. |
11 | Jones, P.D. , James, N. , Mellalieu, S.D. , (2004) , Possession as a performance indicator in soccer as a function of successful and unsuccessful teams, Journal of Sports Science, 22: (6), 507–508. |
12 | Lames, M. , McGarry, T. , (2007) , On the search for reliable performance indicators in game sports, International Journal of Performance Analysis in Sport, 7: (1), 62–79. |
13 | Lease, D. , (1999) , Combined Events, 4th ed. Birmingham: UK Athletics, p11-20. |
14 | O’Donoghue, P.G. , (2005) , Normative profiles of sports performance, International Journal of Performance Analysis of Sport, 5: (1), 104–119. |
15 | Silvester, L.J. , (2003) , Complete book of throws: strength and power development for the throws, Champaign, Il: Human Kinetics. |
16 | Slavek,N. , Jovic,A. , (2012) , Heptathlon evaluation model using Grey system theory, Tehnicki Vjesnik, 19: , 327–331. |
17 | Trkal, V. , (2003) , The development of combined events scoring tables and implications for the training of decathletes, New Studies in Athletics, 18: , 7–12. |
18 | Van Damme, R. , Wilson, R.S. , Vanhooydonck, B. , Aerts, P. , (2002) , Evolutionary biology: performance constraints in decathletes, Nature, 415: (6873), 755. |
19 | Westera, W. 2007, Under attack: the heptathlon scoring method, Canadian Athletics Coaching Centre. Available as e-paper at http://www.athleticscoaching.ca. http://dspace.ou.nl/handle/1820/2089 |
20 | Wikipedia 2017, Combined Events at the Olympics: Heptathlon, Wikipedia. 29th Dec 2017. https://en.wikipedia.org/wiki/Combined_events_at_the_Olympics, accessed 12th October 2017. |


