
Use of mobile digital footprint to understand how COVID-19 impacts the visitors to art places in Singapore
Abstract
As Singapore strengthens its position as a Creative City, the importance of art places is increasingly evident. The time and frequency of visitors spent on the art places are indications of how successful the art places are. The understanding of the footfall for art places using traditional methods, such as ticket sales, and person-count can be expensive and inaccurate. With the prevalence of mobile phone adoption, our digital footprints are silently collected. These digital footprints can be used to understand the number of visitors who have visited art places, as well as their time spent at the different art places. This data is collected by CITYDATA.ai, a geospatial AI platform and registered data broker compliant with global and regional privacy regulations. An interesting but almost unobserved trend is to understand how COVID-19 affects the visitors to art places. During this period, there could also be a fundamental shift in how people feel and react towards art places. The contribution of this paper helps planners to understand the dynamics of change for the visitors to art places and subsequently enables the planners to have the right strategies to reposition Singapore as a Creative City.
1.Introduction
As Singapore is strengthening its position as a Creative City, the importance of art places is increasingly evident [1,9]. One key measurable criterion for successful art places depends on the number of visitors as it reflects the visitors’ satisfaction and their likelihood of revisiting the place and recommending others to visit [3,5]. However, the understanding of the footfall for art places using traditional methods, such as ticket sales, and person-count can be expensive and inaccurate. Using ticket sales as a method to gauge the number of visitors to art places is inaccurate, given that many art places are free to visit. Even for those that require tickets, it is resource-challenged to understand how much time was spent on the art places. As such, there is not enough data to understand the number of visitors as well as their time spent in art places.
With the prevalence of mobile phone adoption, our digital footprints are silently collected. This mobile data provides an understanding of human mobility [4]. The challenges of smart cities and the need for trade-offs between the use of data and privacy are discussed [2] There are several research papers on the adoption of mobile data to understand urban mobility in urban landscapes [8,14,18]. These digital footprints can be used to understand the number of visitors who have visited art places, as well as their time spent at the different art places. In this paper, the data collection was done by CITYDATA.ai, a geospatial AI platform and registered data broker compliant with global and regional privacy regulations.
The paper aims to understand the change in visitor footfall in urban art places in Singapore in the post-COVID-19 situation by examining (1) the number of visitors, as well as (2) the time spent on art places, in a pre-post COVID-19 situation.
An interesting but almost unobserved trend is to understand how COVID-19 affects the visitation to art places. The hypothesis is that people tend to spend more time at home due to various travel restrictions and stay-home policies. However, during this period, there could also be a fundamental shift in how people feel towards art places, such as it could be an extension of their expression by spending more time in art places.
The COVID-19 situation is a paradigm-shifting event. Several COVID-19 related studies in Singapore highlighted the challenges and changes brought to individuals due to the COVID-19 pandemic. In [17], it first discussed mitigation strategies, such as isolation and lockdowns can have negative social consequences in many areas, such as mental health, education, food security and access to healthcare. In [12], it discussed that there are social, political and economic impacts to be considered. Similarly, in [16], it discussed that the COVID-19 pandemic causes many disruptions in multiple areas, such as socio-political, economic and healthcare fronts, leading to the need for mental health support. In [11], it also highlighted the COVID-19-affected individuals, resulting in both positive and negative impacts across their occupations, productivity, leisure and Instrumental activities of daily living (IADL).
There is also much research on how arts can help people to have a more holistic mental health. In [15], it found that participation in art activity is an important process to engage individuals with mental challenges. In [19], it also highlighted that social and mental well-being can be improved through participation in arts-based projects. In [7], it found that art-based mindfulness has improved the students’ moods and improve their general well-being. In [10], it discussed that there is increasing interest in integrating creative activities into statutory mental health practice, especially in high-income countries. In the same study, the art project is found to engage individuals and improve general mental well-being. As such, given the challenging time, it is crucial to understand how the public consumes art places in a pre-post COVID-19 setting to cater and design art places in future to address the growing needs.
All the above-mentioned studies have highlighted that COVID-19 impacted many people and has profound changes to their responses and emotions. The relationship between the urban landscape and individuals might have also undergone some profound changes. Using the digital footprint collected, this study intends to provide insights into how people interact with art places in general in pre- and post-COVID-19 situations.
1.1.COVID-19 timeline in Singapore
The timeline for the COVID-19 measures in Singapore is critical for this study as it provides insights into the developments and subsequently explains the rationale for choosing certain timeframe as pre- and post-COVID-19 measures. Post-COVID-19 is more related to the end of restrictive measures in Singapore instead of the end of the pandemic.
![COVID-19 timeline in Singapore. Source: [6,13].](https://ip.ios.semcs.net:443/media/scs/2023/2-4/scs-2-4-scs230017/scs-2-scs230017-g001.jpg)
In [6], it summarized the timeline of the COVID-19 measures in Singapore. Singapore had its first Covid-19 case on 23 Jan 2020. The group size was first capped at 10 people on 27 March 2020. Subsequently, more restrictive measures were kicked in, such as households not allowed to receive visitors and no social gatherings. The first phase of reopening was on 2 June 2020, with further relaxation until 8 May 2021. Since then, the group size was again reduced. From 8 May 2021 to 10 August 2021, the number of persons within a group allowed to gather is constantly moving between 2 to 8. On 10 August 2021, the Singapore government announced it to be in the “preparatory stage of reopening”. On 27 September 2021, it is labelled as the “stabilization phase” while on 22 November 2021, it is labelled as the “transition phase”. On 29 March 2022, outdoor mask-wearing is no longer mandatory. By the start of 2022, Singapore feels it is in the stage of opening its border and economy.
2.Methodology
2.1.Data collection and processing
Data was collected via CITYDATA.ai, which collects trillions of data points every month. This is based on movement signals at relevant moments and without accessing the personal information of the mobile phone users. The users’ identity is hash-coded and anonymized to ensure privacy and accountability of users’ movements.
The first chart (Fig. 2) shows the raw data provided by CITYDATA.ai. In unfiltered and untreated data, the data collected has the key information such as (1) its identifier as “device id” in hash-coded, (2) the precise time of the data collection, and (3) the GPS signal in both latitude and longitude as well as the horizontal accuracy. The individual movement can be traced using the device ID.
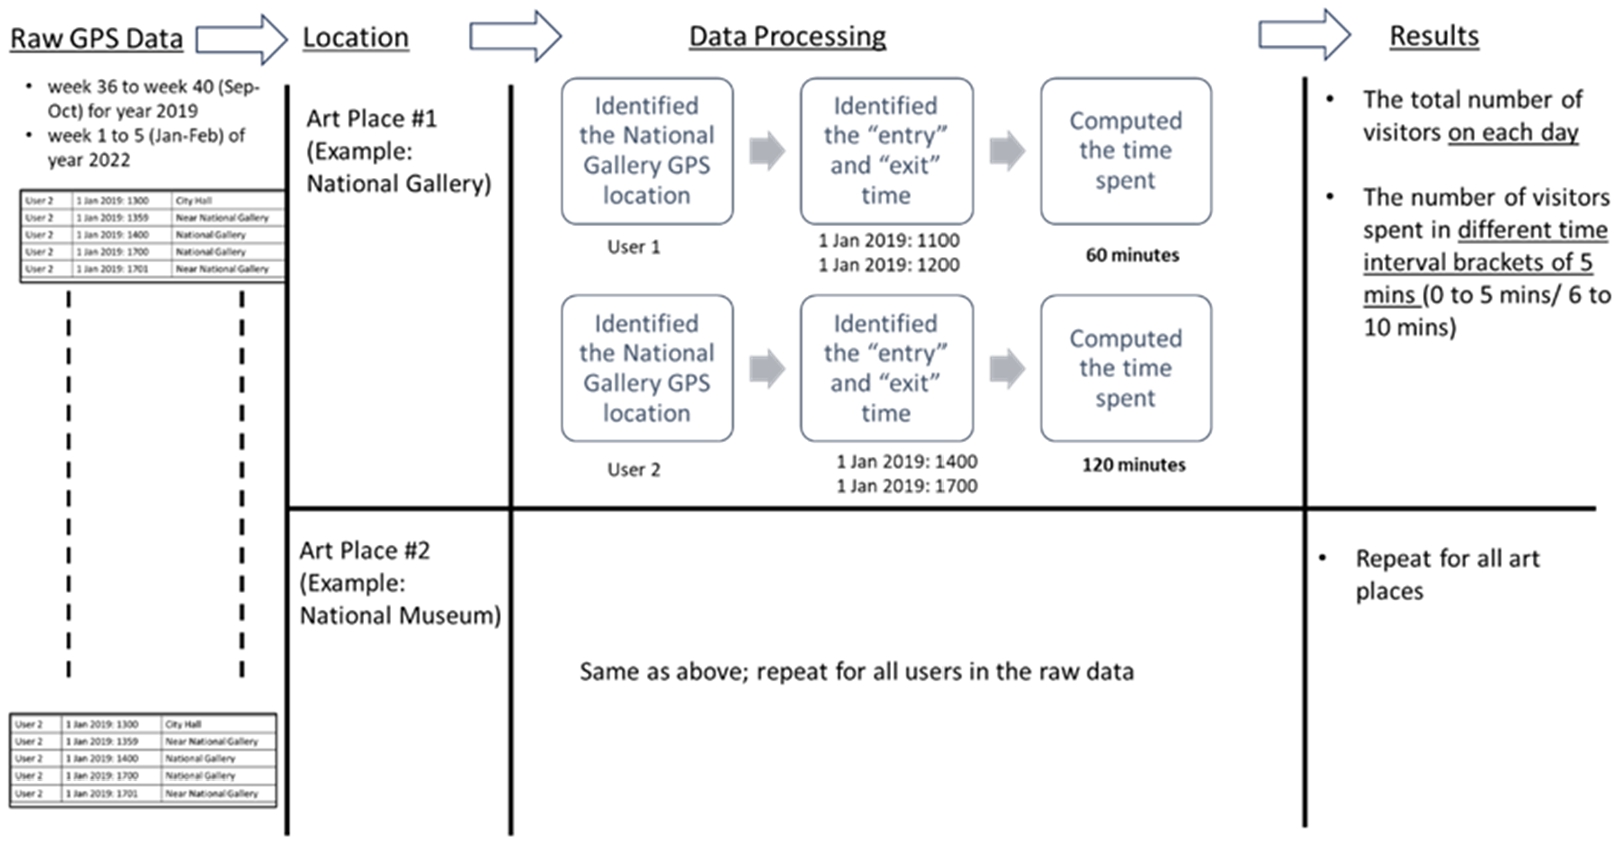
The second chart (Fig. 3) illustrates how the data collected was analysed in this paper. Based on the list of art places with their geospatial details (or points of interest “POI”) provided to CITYDATA.ai, the corresponding data in its anonymized and aggregated format was generated. Based on the specified timeframe period, the big database can identify which “device” has visited the POI. As such, further details, such as the duration of which individual device has been within the same destination can be inferred from the big database. All these individual devices on an aggregated basis can provide meaningful data, such as the number of devices that have been to the POI and how long the devices in total stayed within the POI boundaries.
Fig. 2.
Example of the raw data collected by CitiData.Ai, a third-party registered data broker.
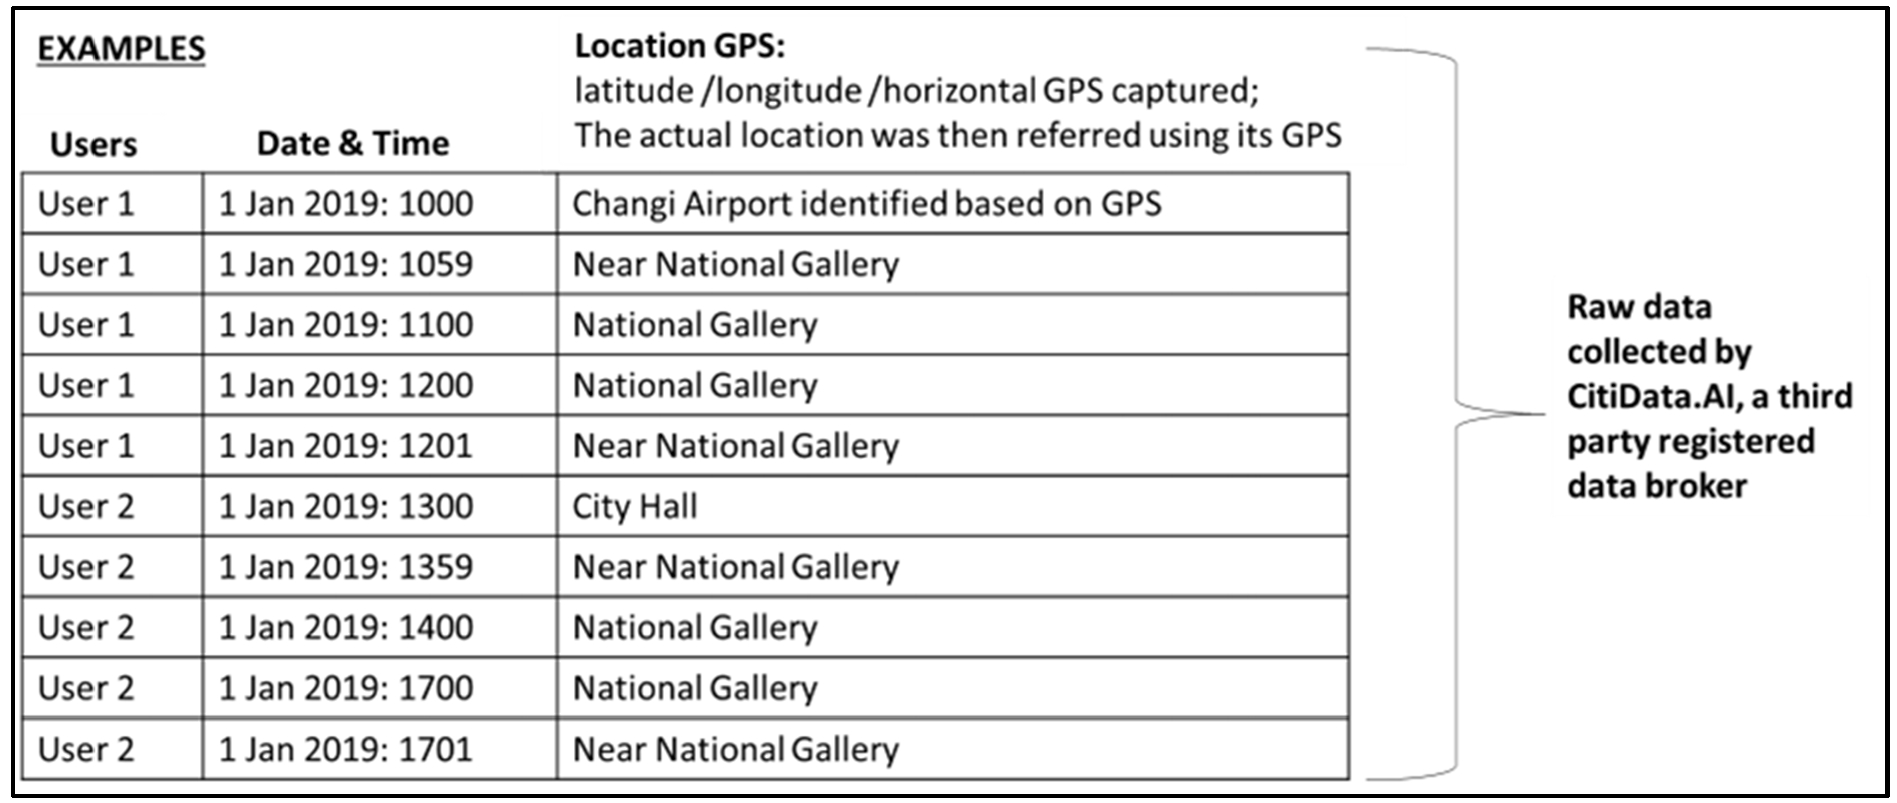
Fig. 3.
Data analysis based on the raw information collected by Citidata.Ai.
The period selected for this study for the pre-COVID-19 period is between week 36 to week 40 (Sep–Oct) for the year 2019 (5 weeks in total). This is approximately 3 months before the COVID-19 outbreak. The post-COVID-19 selected is between weeks 1 to 5 (Jan–Feb) of year 2022 (5 weeks in total). This is the period during which the Singapore government has started to resume normalcy after the “preparatory stage of reopening” in August 2021, the “stabilization phase” on 27 September 2021 and the “transition phase” starting from 22 November 2021.
Using the aggregated results of each POI or art place, insights on each art place, such as the number of visitors for the pre-post COVID-19 periods is gathered. Furthermore, the time spent on each art place can also be provided. Trend analysis and big data analysis then further reflected the consumption patterns of art places in a pre-post COVID-19 period. Comparison can be made between a myriad of combinations, such as different art places, weekday vs weekend patterns, and pre vs. post-period.
2.2.List of art places in Singapore
The list of arts places in Singapore was created from (1) the National Arts Council (NAC), (2) the National Heritage Board (NHB), (3) visitsingapore.com by Singapore Tourism Board (STB) and (4) roots.gov.sg by NHB. These 4 sources are statutory authorities of Singapore with a special focus on the arts, heritage, tourism as well and historical preservation of Singapore. These themes are closely aligned to the area of study. In total, there are 199 places identified based on one or more of the following criteria as below:
1. As for the sites under NAC, the categories under “education”, “art space/venue”, and “art housing scheme” are singled out.
2. All the sites listed Under “Museum Roundtable” by the National Heritage Board are included in the list of art places.
3. Based on the places of interest recommended by visitsingapore.com, the categories under “art museums and institutions”, “performance and exhibitions”, “culture – place of worship” and “culture-heritage discovery” are singled out. In addition, the street art provided by visitsingapore.com was also included in the art places.
4. The National Monuments as gazetted by NHB were provided in roots.gov.sg and used as part of the art places.
3.Results
3.1.Most visited and least visited art places for 2019 and 2022
Based on the CITYDATA.ai information for the period of week 36 to week 40 in the year 2019, the most visited art places are TAS Theatre in the Chinatown area, Singapore City Gallery which is housed in the Urban Redevelopment Authority (URA) and HDB Livingspace which is housed in the Housing Development Board (HDB) Headquarters. The average number of visitors is approximately 13,000 per week. On another hand, the least popular art places are Fort Siloso, Army Museum of Singapore and Sustainable Singapore Gallery at Marina Barrage.
Table 1
Most visited and least visited art places for 2019, Source:CITYDATA.ai
| Top 10 | Average 2019 visitors (in a week) |
| TAS Theatre Co Ltd | 13,023 |
| Singapore City Gallery | 12,848 |
| HDB Livingspace | 12,733 |
| Indian Heritage Centre | 12,381 |
| Drama Box | 12,208 |
| Alive @ Clive By Traseone | 12,174 |
| Kreta Ayer Heritage Gallery | 11,478 |
| Masjid Abdul Gaffoor | 11,348 |
| Working Class Hero by Zero | 11,333 |
| Mural of Bruce Lee by School of Design | 11,329 |
| Fort Siloso | 15 |
| Army Museum of Singapore | 34 |
| Sustainable Singapore Gallery | 51 |
| Saint George’s Church | 72 |
| Haw Par Villa | 77 |
| Singapore Discovery Centre | 92 |
| Grassroots Heritage Centre | 156 |
| Command House, Former | 163 |
| NUS Museum | 169 |
| Science Centre Singapore | 172 |
Based on the CITYDATA.ai information for the period of week 1 to week 5 in the year 2022, the most visited art places are Tan Tock Seng Hospital’s Heritage Museum, Buddha Tooth Relic Temple and Museum and Kreta Ayer Heritage Gallery which is near the Buddha Tooth Relic Temple. The average number of visitors is approximately 2,000 to 5,000 per week. On another hand, the least popular art places are Jurong Town Hall, NTU Centre for Contemporary Art Singapore and the Istana.
Table 2
Most visited and least visited art places 2022, Source:CITYDATA.ai
| Top 10 | Average 2022 visitors (in a week) |
| Tan Tock Seng Hospital’s Heritage Musuem | 5,602 |
| Buddha Tooth Relic Temple and Museum | 2,496 |
| Kreta Ayer Heritage Gallery | 2,407 |
| The Necessary Stage | 1,859 |
| Various pieces along Jalan Klapa | 1,724 |
| Working Class Hero by Zero | 1,697 |
| Keng Teck Whay | 1,640 |
| Nagore Durgha | 1,586 |
| Mural of Bruce Lee by School of Design | 1,558 |
| Singapore Repertory Theatre | 1,496 |
| Jurong Town Hall | 2 |
| NTU Centre for Contemporary Art Singapore | 2 |
| The Istana | 2 |
| Army Musuem of Singapore | 3 |
| Gillman Barracks | 3 |
| Haw Par Villa | 3 |
| Raffles College | 3 |
| Science Centre Singapore | 3 |
| Fort Siloso | 3 |
| Grassroots Heritage Centre | 4 |
The most frequent art places that appear for both the studied periods in 2019 and 2022 are (1) Kreta Ayer Heritage Gallery, (2) Working Class Hero by Zero and (3) Mural of Bruce Lee by School of Design. The Kreta Ayer Heritage Gallery and Mural of Bruce Lee by the School of Design are located in the ‘Chinatown’, a traditional Chinese enclave in Singapore while the mural ‘Working Class Hero by Zero’ is located in ‘Little India”, a traditional Indian enclave in Singapore.
The least frequent art places that appear for both the studied period in 2019 and 2022 are (1) Fort Siloso, (2) Army Museum of Singapore, (3) Haw Par Villa and (4) Science Centre Singapore.
3.2.Number of visitors in 2019 vs 2022
Weekday vs Weekend for 2019:
Based on the CITYDATA.ai information for the period of week 36 to week 40 in the year 2019, the average daily visitors for all the art places compiled on weekdays and weekends are 155,237 and 122,020 respectively. This represented that the weekend visitors are 22% less than the weekday visitors. The data set provided is unable to distinguish if the visitors are residents or non-residents. However, the lower percentage of visitors on weekends indicates that the majority of the visitors could be non-residents, as they can afford to visit the art places during workdays.
Below are the top 10 places that attract visitors on weekends more than a weekday. These 10 places have some trends such as it attracts visitors that are more likely to be of family or couple setting. For example, Singapore Discovery Centre targets families with young kids. Singapore Sports Museum caters to both families and couples who like to engage in sports activities. Gillman Barrack and Esplanade are suitable places for dating and going for a walk on the weekend.
Table 3
Top 10 art places in weekend compared to weekday in 2019, Source:CITYDATA.ai
| Top 10 | 2019 Weekend/weekday |
| Command House, Former | 381% |
| Lim Bo Seng Memorial, Tan Kim Seng Fountain and The Cenotaph | 66% |
| Singapore Discovery Centre | 65% |
| Sun Yat Sen Villa, currently the Sun Yat Sen Nanyang Memorial Hall | 45% |
| Church of the Nativity of the Blessed Virgin Mary | 42% |
| Singapore Sports Museum | 33% |
| Former Ford Factory | 32% |
| Prinsep Street Presbyterian Church | 31% |
| Gillman Barracks | 30% |
| Esplanade – Theatres on the Bay | 26% |
Below are the top 10 places that attract visitors on weekdays more than weekends. One of the common features of these 10 places is that most of them cater more for educative purposes for a certain group that works or studies on weekdays. For example, the Home Team Gallery is dedicated to homeland security forces, while Army Museum of Singapore is dedicated to Singapore armed forces. IRAS Gallery is dedicated to the tax authority of Singapore. NTU Centre, Raffles College, Chung Cheng High School, National University of Singapore are educational institutions.
Table 4
Bottom 10 art places in weekend compared to weekday in 2019, Source:CITYDATA.ai
| Bottom 10 | 2019 Weekend/weekday |
| Home Team Gallery | −94% |
| Grassroots Heritage Centre | −93% |
| Army Museum of Singapore | −93% |
| NTU Centre for Contemporary Art Singapore | −92% |
| Raffles College, Former, | −92% |
| Chinese Heritage Centre | −85% |
| Chung Cheng High School (Main)Â (1965) | −85% |
| The Istana | −84% |
| National University of Singapore | −84% |
| The IRAS Gallery | −79% |
Weekday vs weekend for 2022
Based on the CITYDATA.ai information for the period of week 1 to week 5 in the year 2022, the average daily visitors for all the art places compiled on weekdays and weekends are 24,042 and 19,901 respectively. This represented that the weekend visitors are 17% less than the weekday visitors.
Below are the top 10 places that attract visitors on weekends more than weekdays. Excluding the art places that have less than 10 visitors on average on weekends, these remaining art places generally are more focused on the creative or performing arts, such as STPI, TheatreWorks, and Esplanade – Theatre on the Bay. It is also interesting to note that more people visit Woodbridge Museum which is dedicated to the mental wellness hospital on weekends.
Table 5
Top 10 art places in weekend compared to weekday in 2022, Source:CITYDATA.ai
| Top 10 | 2022 Weekend/weekday |
| Woodbridge Museum | 1443% |
| Fort Siloso | 983% |
| STPI | 581% |
| Chung Cheng High School (Main) | 383% |
| Gillman Barracks | 300% |
| Jurong Town Hall | 221% |
| Theatreworks | 173% |
| Esplanade – Theatres on the Bay | 96% |
| MOE Heritage Centre | 90% |
| Republic of Singapore Air Force Museum | 85% |
Below are the top 10 places that attract visitors on weekdays more than weekends. Similarly, if excluding the art places that have less than 10 visitors on average on weekdays, most of the remaining art places are either a government institution, such as Home Team Gallery, SG Mobility Gallery or a religious institution, such as Masjid Al-Abrar, Thian Hock Keng, Telok Ayer Chinese Methodist Church. Only the Singapore Musical Box Museum caters to the creative aspects.
Table 6
Bottom 10 art places in weekend compared to weekday in 2022, Source:CITYDATA.ai
| Bottom 10 | 2022 Weekend/weekday |
| Saint George’s Church | −96% |
| Home Team Gallery | −95% |
| Science Centre Singapore | −92% |
| SG Mobility Gallery | −89% |
| Singapore Musical Box Museum | −89% |
| Masjid Al-Abrar | −86% |
| Thian Hock Keng | −83% |
| Haw Par Villa | −81% |
| Telok Ayer Chinese Methodist Church | −78% |
| Singapore Discovery Centre | −78% |
2019 vs 2022 weekday
Only 3 art places have increased in the daily average visitors for the weekday period in year 2022 compared to the period in the year 2019, namely, the Command House, NEWater Visitor Centre and Tan Tock Seng Hospital’s Heritage Museum. There is no common feature among these 3 art places. In this list below, most of the art places are heritage-related, such as Common House, Reflections at Bukit Chandu, Old Supreme Court, and the Empress Place Building. There are also 2 hospital-related art places, such as Tan Tock Seng Hospital’s Heritage Museum and Kwong Wai Shui Hospital Heritage Gallery.
The review of the art places that have fewer visitors for weekdays in 2022 compared to 2019 is not meaningful, as more than 170 art places have seen a minimal 70% drop and about 100 art places have a minimal 90% drop.
Table 7
Top 10 art places in weekday for 2019 vs 2022, Source:CITYDATA.ai
| Top 10 | Weekday 2022/2019 |
| Command House | 676% |
| NEWater Visitor Centre | 88% |
| Tan Tock Seng Hospital’s Heritage Museum | 87% |
| Reflections at Bukit Chandu | −2% |
| Home Team Gallery | −9% |
| The Necessary Stage | −12% |
| Kwong Wai Shiu Hospital Heritage Gallery | −24% |
| Various pieces along Jalan Klapa | −26% |
| Supreme Court, Old, currently the National Gallery Singapore | −38% |
| Empress Place Building, currently the Asian Civilisations Museum | −47% |
2019 vs 2022 weekend
Only 4 art places have increased in the average number of visitors for the weekend in the year 2022 compared to the period in the year 2019, namely, the Command House, Fort Siloso, Republic of Singapore Air Force Museum and Nagore Durgha. Other than Nagore Durgha which is a religious place, the 3 other art places are war-related.
Table 8
Top 10 art places in weekend for 2019 vs 2022, Source:CITYDATA.ai
| Top 10 | Weekday 2022/2019 |
| Command House, Former | 62% |
| Fort Siloso | 24% |
| Republic of Singapore Air Force Museum | 16% |
| Nagore Durgha | 2% |
| Supreme Court, Old, currently the National Gallery Singapore | −1% |
| NEWater Visitor Centre | −10% |
| Tan Tock Seng Hospital’s Heritage Museum | −14% |
| Reflections at Bukit Chandu | −20% |
| Buddha Tooth Relic Temple and Museum | −21% |
| Home Team Gallery | −28% |
Similar to the above comparison on a weekday in 2022 vs 2019, the review of the art places that have fewer visitors for the weekend in 2022 compared to 2019 is not meaningful.
3.3.Time spent in art places in 2019 vs 2022
For the period in 2019, 89.4% of the visitors spent less than 15 minutes in the art places, while only 2.8% of visitors spent more than 30 minutes and the remaining 7.8% spent 15 to 30 minutes. For the period in 2022, 85.8% of the visitors spent less than 15 minutes, while 6.2% of the population spent more than 30 minutes and the remaining 8.0% spent between 15 to 30 minutes. It seems like a higher percentage of visitors in the period for 2022 compared to the period for 2019 spent more time on art places.
Fig. 4.
Time spent for 2019 vs 2022.
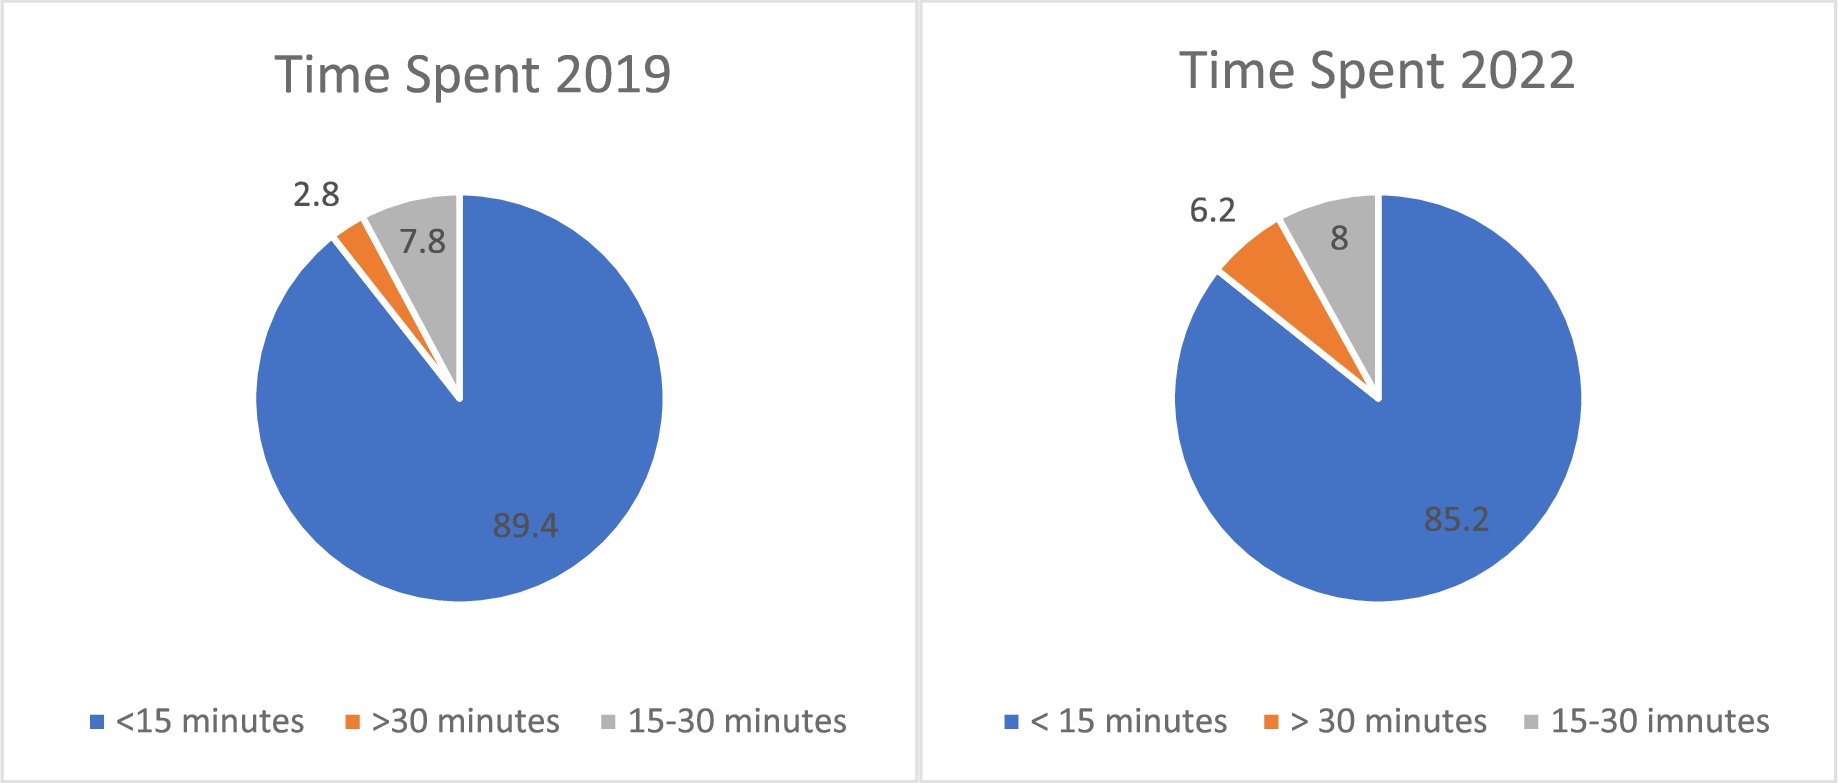
To have a more meaningful study, visitors who spent less than 15 minutes are considered to be ‘passers-by’ instead of genuine visitors. This normalized set of data further confirmed that more visitors in the period 2022 generally spent more time in art places compared to those for the period 2019.
Table 9
Time spent in art places for 2019 and 2022, Source:CITYDATA.ai
| 2019 (week 36 to week 40) | 2022 (week 1 to week 5) | |
| 15 to 30 minutes | 73.7% | 56.6% |
| 31 to 60 minutes | 19.6% | 29.6% |
| 61 to 120 minutes | 5.1% | 9.6% |
| >120 minutes | 1.6% | 4.3% |
Using the normalized data for the period for 2019, there are the top 5 places in which people spent more than 30 minutes are as the list below. Only 3 art places have more than 50% of the visitors who spent more than 30 minutes in the art places. This list shows that most of them are Museums except for the street arts along Jalan Kledek, which also has a stretch of eateries and pubs.
Table 10
Art place with a high percentage of visitors spent more than 30 minutes in 2019, Source:CITYDATA.ai
| Art places | % of visitors spent more than 30 minutes |
| NEWater Visitor Centre | 79% |
| Republic of Singapore Air Force Museum | 60% |
| Asian Civilisations Museum | 51% |
| Woodbridge Museum | 49% |
| Various pieces along Jalan Kledek | 49% |
Using the normalized data for the period for 2022, there are top 10 places in which people spent more than 30 minutes are as the list below. The reason for using an expanded list compared to the period of 2019 is that 42 art places have more than 50% of visitors who spent more than 30 minutes. This list shows a diverse range of outcomes, suggesting that post-COVID, individuals are inclined to engage in a broader spectrum of interests or pursue more specialized activities.
Table 11
Art place with a high percentage of visitors spent more than 30 minutes in 2022, Source:CITYDATA.ai
| Art places | % of visitors spent more than 30 minutes |
| The Istana | 100% |
| Chinese High School Clock Tower Building | 100% |
| Singapore Sports Museum | 100% |
| Theatreworks | 90% |
| Thian Hock Keng | 78% |
| Bowyer Block, Singapore General Hospital | 77% |
| Keng Teck Whay | 76% |
| Lantern Festival by Yip Yew Chong | 66% |
| Singapore Musical Box Museum | 66% |
| NUS Baba House | 61% |
The top 10 art places where a higher percentage of people spent more than 30 minutes for the period in 2022 compared to the period in 2019 are as the list below. Similar to the top 10 places in which people spent more than 30 minutes, this is a mixed bag of results, implying people do start to have a more varied interest post-Covid.
Table 12
Art place with the highest percentage of visitors spent more than 30 minutes in 2022 vs 2019, Source:CITYDATA.ai
| Art places | % difference of visitors spent more than 30 minutes in 2022 compared to 2019 |
| Singapore Sports Museum (Sports Museum, Niche) | 85% |
| Chinese High School Clock Tower Building (Monument, Niche) | 70% |
| Theatreworks (Performing Art, Niche) | 69% |
| Thian Hock Keng (Cultural Site, Niche) | 66% |
| Keng Teck Whay (Ethnicity Site, Niche) | 66% |
| The Istana (Presidential Site) | 65% |
| Pasar and Fortune Teller (Niche Street Arts, Niche) | 51% |
| Singapore Musical Box Museum (Musical, Niche) | 51% |
| National Healthcare Group Polyclinics’ Gallery of Memories (Health Museum, Niche) | 51% |
| MINT Museum of Toys (Toy Museum, Niche) | 45% |
The top 10 art places that a less people spent more than 30 minutes for the period in 2022 compared to the period in 2019 are as the list below. In this list, it is observed that it comprises mostly Museums. This implies that in the post-COVID-19 period, visitors tend to spend less time on more ‘curated’ arts such as various museums.
Table 13
Art place with the lowest percentage of visitors spent more than 30 minutes in 2022 vs 2019, Source:CITYDATA.ai
| Art places | % difference of visitors spent more than 30 minutes in 2022 compared to 2019 |
| NEWater Visitor Centre (Educational Museum, National Level) | −42% |
| National University of Singapore (Art School) | −42% |
| Church of the Nativity of the Blessed Virgin Mary (National Monument) | −41% |
| Masjid Hajjah Fatimah (National Monument) | −38% |
| Woodbridge Museum (Health Museum) | −36% |
| Asian Civilisations Museum (Art Museum, National Level) | −36% |
| Sun Yat Sen Villa (Historical Museum) | −35% |
| The Changi Museum (Cultural Museum) | −35% |
| National Museum of Singapore (Art Museum, National Level) | −32% |
| St George’s Church (National Monument) | −31% |
4.Discussion
4.1.Summary of major findings and recommendations
The mobile data footprint is collected by CITYDATA.ai. This data can show (1) how many visitors visited the art places each day and (2) the time each visitor spent on the art places data.
Generally, the number of visitors to art places based on the CITYDATA.ai collection has decreased by approximately 84% for the period in the year 2022 (week 1 to week 5, Jan–Feb) compared to the period in the year 2019 (week 36 to 40, Sep–Oct). This trend is consistent for most art places. Furthermore, the decrease in visitors is generally the same for both weekday and weekend visitors.
In general, there are fewer daily visitors at weekends compared to weekdays. For 2019, there are 22% fewer daily visitors for weekends compared to weekdays; For 2022, there are 17% fewer daily visitors for weekends compared to weekdays. There are 33 places out of the 199 art places for the year 2019 that see more daily visitors on weekends than weekdays. However, there are 72 places out of 199 art places for the year 2022 that see more daily visitors on weekends than weekdays.
In 2019, the art places that attract more weekend visitors compared to weekday visitors are more likely to be in family or couple settings. In 2022, there is a shift in preferences. Art places that are creative or performing arts attract more weekend visitors than weekday visitors.
In 2019, the art places that have more weekday visitors are for educational purposes. Again, there is a shift of preference. In 2022, the art places that attract more visitors are religious-related.
Although the number of visitors decreased for the period for 2022 compared to the period for 2019, the time spent on the art places generally increased. Excluding the ‘passerby visitors’ (spend less than 15 minutes), the visitors who spent more than 30 minutes increased to approximately 44% from 26%.
5.Conclusion
The post-COVID-19 period showed a shift of preference. People tend to have more varied interests and have spent more time in different art places. Visitors spend less time on more ‘curated’ art spaces, such as National-level Museums (for example the National Museum of Singapore, Asian Civilization Museum, see Table 13) and tend to spend more time in art places that are more niche and catered to their specific preferences (for example, Sports Museum, Pasar Fortune Teller, and MINT Museums of Toys, see Table 12).
For recommendation, this implies that the urban planners must dedicate more resources to museums or galleries that address niche interests (such as toys, golf, video games, etc) rather than the generic national-level museums (such as National Arts Gallery, etc) as there is a shift of preferences of the visitors in a post-COVID-19 environment. The results of this study can also encourage art space managers and operators to organize more varied and niche themes and in return enable the general public to have a different art experience that they might not even have thought of. This can then strengthen the bid for Singapore to be a Creative City.
While the study provides great insights into the public consumption of art places in a pre-post COVID-19 setting, the data source from CITYDATA.ai has its inherent limitations. First, the mobile footprint is collected from smartphone devices. In other words, this does not reflect all the residents especially the underprivileged groups without access to smartphone devices. Second, due to privacy regulations, the data only reflects non-minors who are above the age of 16 years. The demand for art places by the youth is not captured in this study. Lastly, this study reflects only an aggregated representation of the population and is not able to further analyse the different attitudes of different social groups, such as couples or families with young children.
Acknowledgements
The authors thank the anonymous reviewers for their useful comments and guidance on the earlier versions of this paper.
Conflict of interest
None to report.
References
[1] | S. Chiu, K.C. Ho and T.L. Lu, City-States in the Global Economy: Industrial Restructuring in Hong Kong and Singapore, 1st edn, Routledge, (2018) . doi:10.4324/9780429501609. |
[2] | S. Choenni et al., Data governance in smart cities: Challenges and solution directions, Journal of Smart Cities and Society 1: (1) ((2022) ), 31–51. doi:10.3233/SCS-210119. |
[3] | K. Cotter, A. Fekete and P. Silvia, Why do people visit art museums? Examining visitor motivations and visit outcomes, Empirical Studies of the Arts 40: ((2020) ), 275–295. doi:10.1177/02762374211011740. |
[4] | Z. Du, Y. Yang, C. Gao et al., The temporal network of mobile phone users in Changchun Municipality, Northeast China, Sci Data 5: ((2018) ), 180228. doi:10.1038/sdata.2018.228. |
[5] | P. Foroudi, T. Akarsu, E. Ageeva, M. Foroudi, C. Dennis and T. Melewar, PROMISING THE DREAM: Changing destination image of London through the effect of website place, Journal of Business Research 83: ((2018) ), 97–110. doi:10.1016/J.JBUSRES.2017.10.003. |
[6] | T. Goh, Straits Times, New COVID-19 rules kick in, timeline of S’pore’s measures over the last 2 years. Singapore: Straits Times, (2022) . Accessed on 29 May 2022. Available from: https://www.straitstimes.com/singapore/two-years-of-twists-and-turns-a-timeline-of-singapores-covid-19-measures. |
[7] | J.M. Jones and L.H. Lee, Art-based mindfulness at school: A culturally responsive approach to school mental health, Psychology in the schools 59: (10) ((2022) ), 2085–2105. doi:10.1002/pits.22660. |
[8] | C. Kang, S. Li, F. Wang and Y. Liu, How urban places are visited by social groups? Evidence from matrix factorization on mobile phone data, Transactions in GIS 24: (6) ((2020) ), 1504–1525. doi:10.1111/tgis.12654. |
[9] | L. Kong, C. Ching and T. Chou, Arts, Culture and the Making of Global Cities: Creating New Urban Landscapes in Asia, Edward Elgar, Cheltenham. Research Collection School of Social Sciences. Paper 1776. https://ink.library.smu.edu.sg/soss_research/1776. |
[10] | C. Laver et al., ‘You don’t take things too seriously or un-seriously’: Beyond recovery to liminal and liminoid possibility in a community arts and mental health project, Journal of community & applied social psychology 32: (4) ((2021) ), 653–664. doi:10.1002/casp.2583. |
[11] | P.N. Lee, J.A. How and T. Xu, Exploring the impacts of COVID-19 on the lifestyles of community-living adults in Singapore: A qualitative study, Australian Occupational Therapy Journal 69: (5) ((2022) ), 546–558. doi:10.1111/1440-1630.12812. |
[12] | J.M. Lim, Z.M. Tun, V. Kumar, S.E.D. Quaye, V. Offeddu, A.R. Cook, M.O. Lwin et al., Population anxiety and positive behaviour change during the COVID-19 epidemic: Cross-sectional surveys in Singapore, China and Italy, Influenza and other respiratory viruses 15: (1) ((2020) ), 45–55. doi:10.1111/irv.12785. |
[13] | Ministry of Health, Past updates on COVID-19 local situation, Singapore, (2022) . Accessed on 7 Jul 2022. Available from: https://www.moh.gov.sg/covid-19/past-updates. |
[14] | K. Mohamed Ridhwan and C.A. Hargreaves, Leveraging Twitter data to understand public sentiment for the COVID-19 outbreak in Singapore, International Journal of Information Management Data Insights 1: (2) ((2021) ). doi:10.1016/j.jjimei.2021.100021. |
[15] | K.B. Ørjasæter et al., ‘I now have a life!’ Lived experiences of participation in music and theater in a mental health hospital, PloS one 13: (12) ((2018) ). doi:10.1371/journal.pone.0209242. |
[16] | V. Renjan and D.S.S. Fung, Debate: COVID-19 to the under 19 – a Singapore school mental health response, Child and adolescent mental health 25: (4) ((2020) ), 260–262. doi:10.1111/camh.12426. |
[17] | J.B. Tan, M.J. Cook, L. Prishanee, L. Rozanova and A. Wilder-Smith, Singapore’s pandemic preparedness: An overview of the first wave of COVID-19, International Journal of Environmental Research and Public Health 18: (1) ((2020) ), 252. doi:10.3390/ijerph18010252. |
[18] | Z. Tian, Y. Liu, Y. Wang and L. Wu, A tourist behavior analysis framework guided by geo-information tupu theory and its application in Dengfeng City, China, ISPRS International Journal of Geo-information 11: (4) ((2022) ), 250. doi:10.3390/ijgi11040250. |
[19] | E. Williams et al., Identification with arts-based groups improves mental wellbeing in adults with chronic mental health conditions, Journal of Applied Social Psychology 49: (1) ((2019) ), 15–26. doi:10.1111/jasp.12561. |


