
Opioid prescription patterns among commercially insured children with and without cerebral palsy
Abstract
PURPOSE:
This study aimed to describe opioid prescription patterns for children with vs. without cerebral palsy (CP).
METHODS:
This cohort study used commercial claims from 01/01/2015–12/31/2016 and included children aged 2–18 years old with and without CP. Opioid prescription patterns (proportion exposed, number of days supplied) were described. A zero-inflated generalized linear model compared the proportion exposed to opioids in the follow-up year (2016) and, among those exposed, the number of days supplied opioids between cohorts before and after adjusting for age, gender, race, U.S. region of residence, and the number of co-occurring neurological/neurodevelopmental disabilities (NDDs).
RESULTS:
A higher proportion of children with (n = 1,966) vs. without (n = 1,219,399) CP were exposed to opioids (12.1% vs. 5.3%), even among the youngest age group (2–4 years: 9.6% vs. 1.8%), and had a greater number of days supplied (median [interquartile range], 8 [5–13] vs. 6 [4–9] days; P < 0.05). Comparing children with opioid exposure with vs. without CP, a greater number of days supplied was identified for older age, Asian race/ethnicity, and without co-occurring NDDs, and a lower number of days supplied was observed for Black race/ethnicity and with ≥1 co-occurring NDDs.
CONCLUSION:
Children with CP are more likely to be exposed to opioids and have a higher number of days supplied.
1Introduction
Acute and chronic pain are common symptoms among children with cerebral palsy (CP) that can negatively impact development and quality of life [1–3]. There are multiple pain generators for children with CP, such as musculoskeletal deformities, surgeries to correct these deformities, and spasticity [2, 3]. Opioids are one pharmacological approach that can be used to manage pain, but there is therapeutic uncertainty and a lack of established treatment protocols for children [4, 5]. Moreover, opioids may be less effective for managing chronic vs. acute pain [6] and therefore may be an inappropriate choice of therapy for the ∼ 1 in 3 children with CP who experience chronic pain [2]. While children with CP may have a greater risk of opioid exposure [7], little is known about opioid prescription patterns and associated risks among this population.
The risk-benefit ratio of opioid therapy is not well studied among children. Studies in adults have found an association between opioid therapy for chronic pain management with overdose, addiction, substance abuse, and adverse events, including fracture and myocardial infarction [8–10]. Bone fragility and cardiovascular diseases are well-established health issues for individuals with CP [11, 12]. Children with CP may therefore be particularly susceptible to skeletal and cardiovascular side effects of opioids.
Respiratory depression is another serious side effect of opioids that should be considered in the risk-benefit balance for children with CP. Opioids activate receptors predominately in the brain stem that regulate breathing rhythm and control. Opioid-induced respiratory depression and irregular breathing can result in low oxygen levels and increased arterial hypercapnia [13], which can lead to serious consequences if left untreated (e.g., brain damage, death) [14]. Children with CP may be vulnerable to neural-derived respiratory complications associated with opioid therapy owing in part to their altered central nervous system anatomy and physiology, brain stem depression independent of opioid therapy, and high risk of respiratory morbidity and mortality [15, 16]. Opioid therapy may further complicate neurological regulation of an already compromised respiratory system for some children with CP.
A better understanding of opioid prescription patterns among children with CP is needed. Such information may reveal the extent of opioid exposure at the population level, providing novel information for surveillance efforts. This information may also inform clinical practice in managing adults with CP, as knowledge of prior opioid exposure during growth may alter clinical decision-making for assessment, monitoring, treatment, and prevention. Finally, this information may lead to future research, such as identifying factors explaining differences in opioid exposure patterns between children with and without CP. Therefore, the primary objective was to describe opioid prescription patterns among a large, nationwide sample of children with CP as compared to children without CP.
2Methods
2.1Design and database
This retrospective cohort study used patient-level claims from 01/01/2015–12/31/2016 from Optum’s de-identified Clinformatics® Data Mart Database. This time period was selected as it predates major state-level policy changes in opioid prescribing to minors, whereby states implemented different policies at various times after 2016 thus creating state-level heterogeneity in opioid prescriptions that could impact national-level estimates [17]. Thus, findings can be interpreted as a “baseline” of opioid prescription patterns prior to policy changes. This administrative claims database contains medical and outpatient pharmacy claims and has representation across the U.S. For research purposes, outpatient pharmacy prescriptions and medical conditions are identified by unique codes or medications attached to patient-level claims. A list of codes used to identify medical conditions in this study is presented in Table 1. All data are de-identified and patient consent was not required. The University Institutional Review Board approved this study as non-regulated.
Table 1
International Classification of Diseases, Ninth (ICD-9) and Tenth (ICD-10) Revision, Clinical Modification and Healthcare Common Procedure Coding System (HCPCS) codes to identify variables for this study
| ICD-9 codes | ICD-10 codes | HCPCS codes | |
| Cerebral palsy | 333.71, 343.0–343.4, 343.8, 343.9 | G80.x | |
| Epilepsy | 345.x | G40.x | |
| Intellectual disabilities | 317.x–319.x | F70.x–F73.x, F78.x, F79.x | |
| Autism spectrum disorders | 299.00, 299.01, 299.10, 299.11, 299.80, 299.81, 299.90, 299.91 | F84.0, F84.3, F84.5, F84.8, F84.9 | |
| Wheelchair (and accessories) | V46.3 | Z99.3 | E095.x–E099.x, E10.x–E12.x, E22.x, E23.x, E26.x, K000.x–K01.x, K0813–K0899 |
| Walker, gait trainer, or cane | E010.x–E015.9, E800.x |
2.2Sample selection
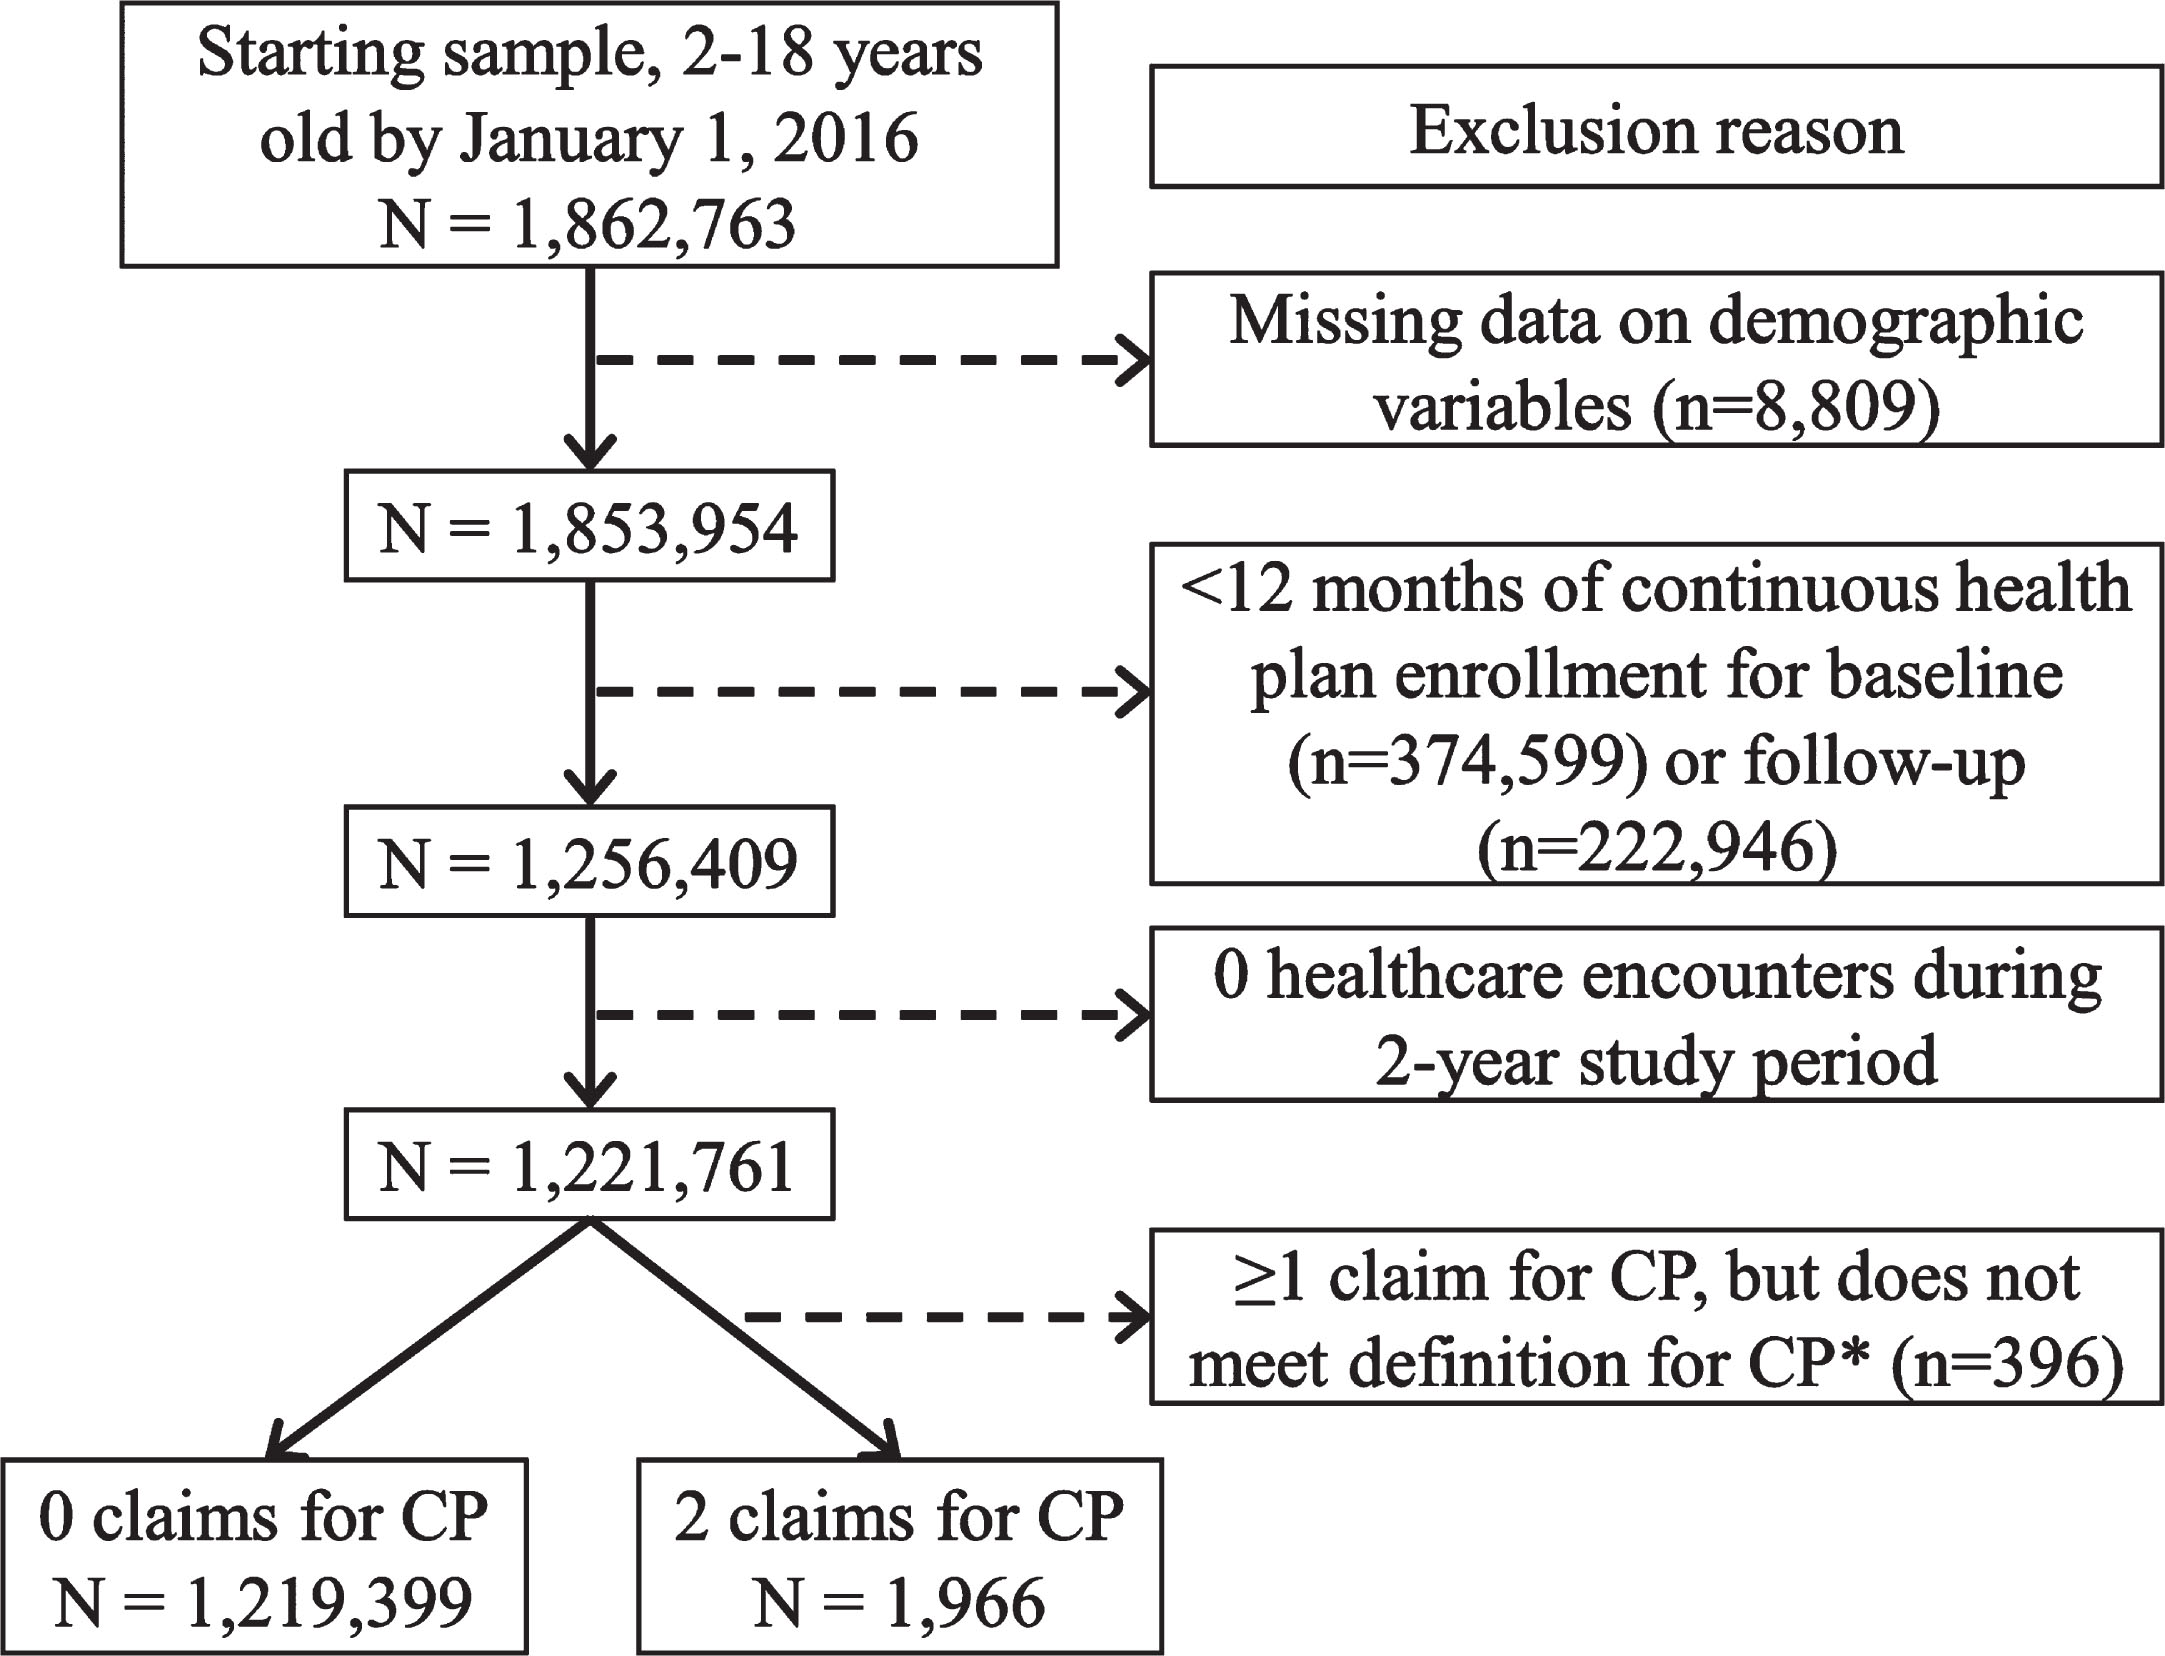
Children with and without CP, 2–18 years of age by 01/01/2016 (index date), and with continuous enrollment in a commercial health plan from 01/01/2015–12/31/2016 (two-year period) were included for analysis (flow chart presented in Fig. 1). The year 2015 was considered the baseline period and the year 2016 was considered the follow-up period. Children with CP were identified by ≥2 claims (any position), where each claim was on a separate day within 12 months of one another, containing a pertinent International Classification of Diseases, Ninth/Tenth Revision, Clinical Modification (ICD) code for CP at any point during the two-year period. Children without CP were included if they had zero claims for CP and ≥1 healthcare encounter during the two-year period.
Fig. 1
Flow chart of inclusion/exclusion criteria to obtain the analytic samples of children with and without cerebral palsy (CP). *CP was identified by ≥2 claims, where each claim was on a separate day within 12 months of one another, containing a pertinent code for CP at any point during the two-year period.
2.3Opioids
Opioids were analyzed as a single indictor and included ≥1 prescription for a product containing codeine, tramadol, oxycodone, hydrocodone, hydromorphone, oxymorphone, buprenorphine, morphine, methadone, or fentanyl. Binary variables (yes/no) were created to indicate ≥1 opioid prescription in the one-year baseline and follow-up periods. The total days supplied (from one or multiple prescriptions) for the one-year baseline and follow-up periods were summed.
2.4Characteristics
Gender, race, and U.S. region of residence were determined from the baseline period data. Age by 01/01/2016 was examined as continuous and by the following age groups: 2–4 years, 5–8 years, 9–13 years, and 14–18 years. Claims did not provide information about pubertal status. Therefore, the age categories reflected general, non-gender-specific developmental stages. A binary variable was created to indicate the presence of an assistive mobility device as a proxy for ambulatory ability, including wheelchair, cane, walker, or gait trainer. Type of CP was described based on available ICD codes. Co-occurring neurological/neurodevelopmental disabilities (NDDs) are relatively common in CP and can increase medical complexity. The NDDs examined in this study were epilepsy, intellectual disabilities, and autism spectrum disorders, which were identified in the same manner as CP. To provide a sense of the medication complexity, the total number of unique non-opioid chronic and “as needed” medications were summed from the one-year baseline period; “as needed” medications for the common cold, flu, allergies, and immediate pre/post-operative use for diarrhea/nausea were excluded. The list included >300 medications, which were selected based on the available prescriptions in the database as led by the team’s pharmacist, as previously described [18]. All-cause healthcare resource use was assessed as the total count for any medical service [19].
2.5Statistical analysis
Baseline characteristics were described for children with and without CP. Opioid exposure was described for the full cohort and then by age group as percent (n) and, among those with opioid exposure, median (interquartile range) days supplied with opioids for the baseline and follow-up periods. This was repeated for the follow-up period after excluding those with baseline opioid exposure to estimate new exposures in the study period. Differences between cohorts were tested using the independent t-test or Mann-Whitney U test for continuous data based on distribution, the Chi-squared test for binary data, and the Cochran-Armitage trend test for ordinal categorical variables.
To compare opioid exposure between children with and without CP, unadjusted and adjusted generalized linear models with zero-inflated Poisson distribution were developed. This two-part model is useful for dealing with overdispersion common to medication use data [20]; it also provides information about the proportion exposed to opioids as well as the as the number of days supplied with opioids conditional on opioid exposure. The first part modeled the probability of zero values and the effect estimate was presented as the odds ratio (OR, with 95% confidence intervals [CIs]) of having a zero vs. non-zero value. An OR < 1.00 indicated the cohort was less likely to have a zero value, i.e., more likely to have exposure to opioids (opposite of how logistic regression models are typically interpreted in biomedical research). The second part modeled the days supplied as count data conditional on non-zero values (i.e., conditional on opioid exposure). The effect estimate was presented as the incidence rate ratio (IRR, with 95% CI) and interpreted as expected rates of days supplied with opioids. The following covariates were used to adjust for confounding: age group, gender, race, U.S. region of residence, and number of co-occurring NDDs (0, 1, or ≥2). As this study did not include a group without prior opioid exposure or model for time to new opioid exposure, the model can be interpreted as a cross-sectional analysis. It was postulated that the number of non-opioid medications and healthcare utilization may have been mediators or colliders on the path between CP status and opioid exposure, and therefore the analysis did not adjust for these variables. For example, the exposure (CP) and outcome (opioid prescription) may each “cause” higher healthcare utilization. Possible moderating effects of age group, gender, race, U.S. region of residence, and number of co-occurring NDDs were examined in the fully adjusted model, analyzing each moderator separately.
Analyses were performed using SAS version 9.4 (SAS Institute, Cary, NC, USA), and P≤0.05 (two-tailed) was considered statistically significant.
3Results
Of the 1,221,365 children 2–18 years of age, 1,966 met the definition of CP for this study with a prevalence of 1.61 per 1,000. Baseline descriptive characteristics for children with and without CP are presented in Table 2. Children with CP had the same mean (standard deviation; SD) age of 10.5 (4.8) years and similar proportions across age groups as those without CP, but there was a higher proportion of males, users of assistive mobility device, and each NDD. Children with CP also had a higher number of co-occurring NDDs, unique non-opioid medications, and all-cause healthcare resource use than those without CP.
Table 2
Baseline descriptive characteristics of children with cerebral palsy (CP) and without (w/o) CP
| CP | w/o CP | P-value | |
| (n = 1,966) | (n = 1,219,399) | ||
| Age, mean (SD) | 10.5 (4.8) | 10.5 (4.8) | 0.975 |
| 2–4 years, % (n) | 20.2 (397) | 20.0 (244,168) | |
| 5–8 years, % (n) | 16.3 (320) | 16.7 (203,361) | |
| 9–13 years, % (n) | 31.3 (616) | 30.7 (374,749) | |
| 14–18 years, % (n) | 32.2 (633) | 32.6 (397,121) | |
| Gender, % (n) | <0.001 | ||
| Female | 42.6 (838) | 49.0 (597,612) | |
| Male | 57.4 (1,128) | 51.0 (621,787) | |
| Race, % (n) | <0.001 | ||
| Asian | 3.6 (71) | 5.4 (65,859) | |
| Black | 6.8 (134) | 6.7 (81,801) | |
| Hispanic | 10.0 (197) | 11.7 (142,754) | |
| White | 68.4 (1,345) | 66.2 (806,649) | |
| Other/unknown | 11.1 (219) | 10.0 (122,336) | |
| U.S. region of residence, % (n) | 0.016 | ||
| West | 20.4 (401) | 22.2 (270,784) | |
| Midwest | 31.4 (618) | 28.5 (347,023) | |
| South | 38.0 (746) | 39.4 (480,811) | |
| Northeast | 10.2 (201) | 9.9 (120,781) | |
| Use of assistive mobility device, % (n) | 23.3 (457) | 0.1 (1,245) | <0.001 |
| Wheelchair | 22.0 (432) | 0.1 (1,081) | <0.001 |
| Walker, gait trainer, cane | 3.5 (68) | <0.1 (299) | <0.001 |
| Type of CP, % (n) | |||
| Spastic, quadriplegic | 24.5 (482) | – | |
| Spastic, diplegic | 25.4 (499) | – | |
| Spastic, hemiplegic | 21.9 (431) | – | |
| Athetoid | 2.4 (48) | – | |
| Other/unknown | 25.7 (506) | – | |
| Co-occurring neurological/neurodevelopmental disabilitiesa, % (n) | <0.001 | ||
| 0 | 55.2 (1,086) | 98.4 (1,199,223) | |
| 1 | 33.3 (655) | 1.6 (18,876) | |
| 2 | 10.2 (201) | 0.1 (1,187) | |
| 3 | 1.2 (24) | <0.1 (113) | |
| Epilepsy | 34.3 (675) | 0.5 (5,756) | <0.001 |
| Intellectual disabilities | 11.0 (216) | 0.2 (2,209) | <0.001 |
| Autism spectrum disorders | 12.1 (238) | 1.1 (13,624) | <0.001 |
| Median (IQR) of non-opioid medications | 1 (0–3) | 0 (0–0) | <0.001 |
| All-cause healthcare resource use, median (IQR) annual count per person | 37 (15–75) | 6 (3–11) | <0.001 |
SD, standard deviation; IQR, interquartile range. aThe neurological/neurodevelopmental disabilities include epilepsy, intellectual disabilities, and autism spectrum disorders.
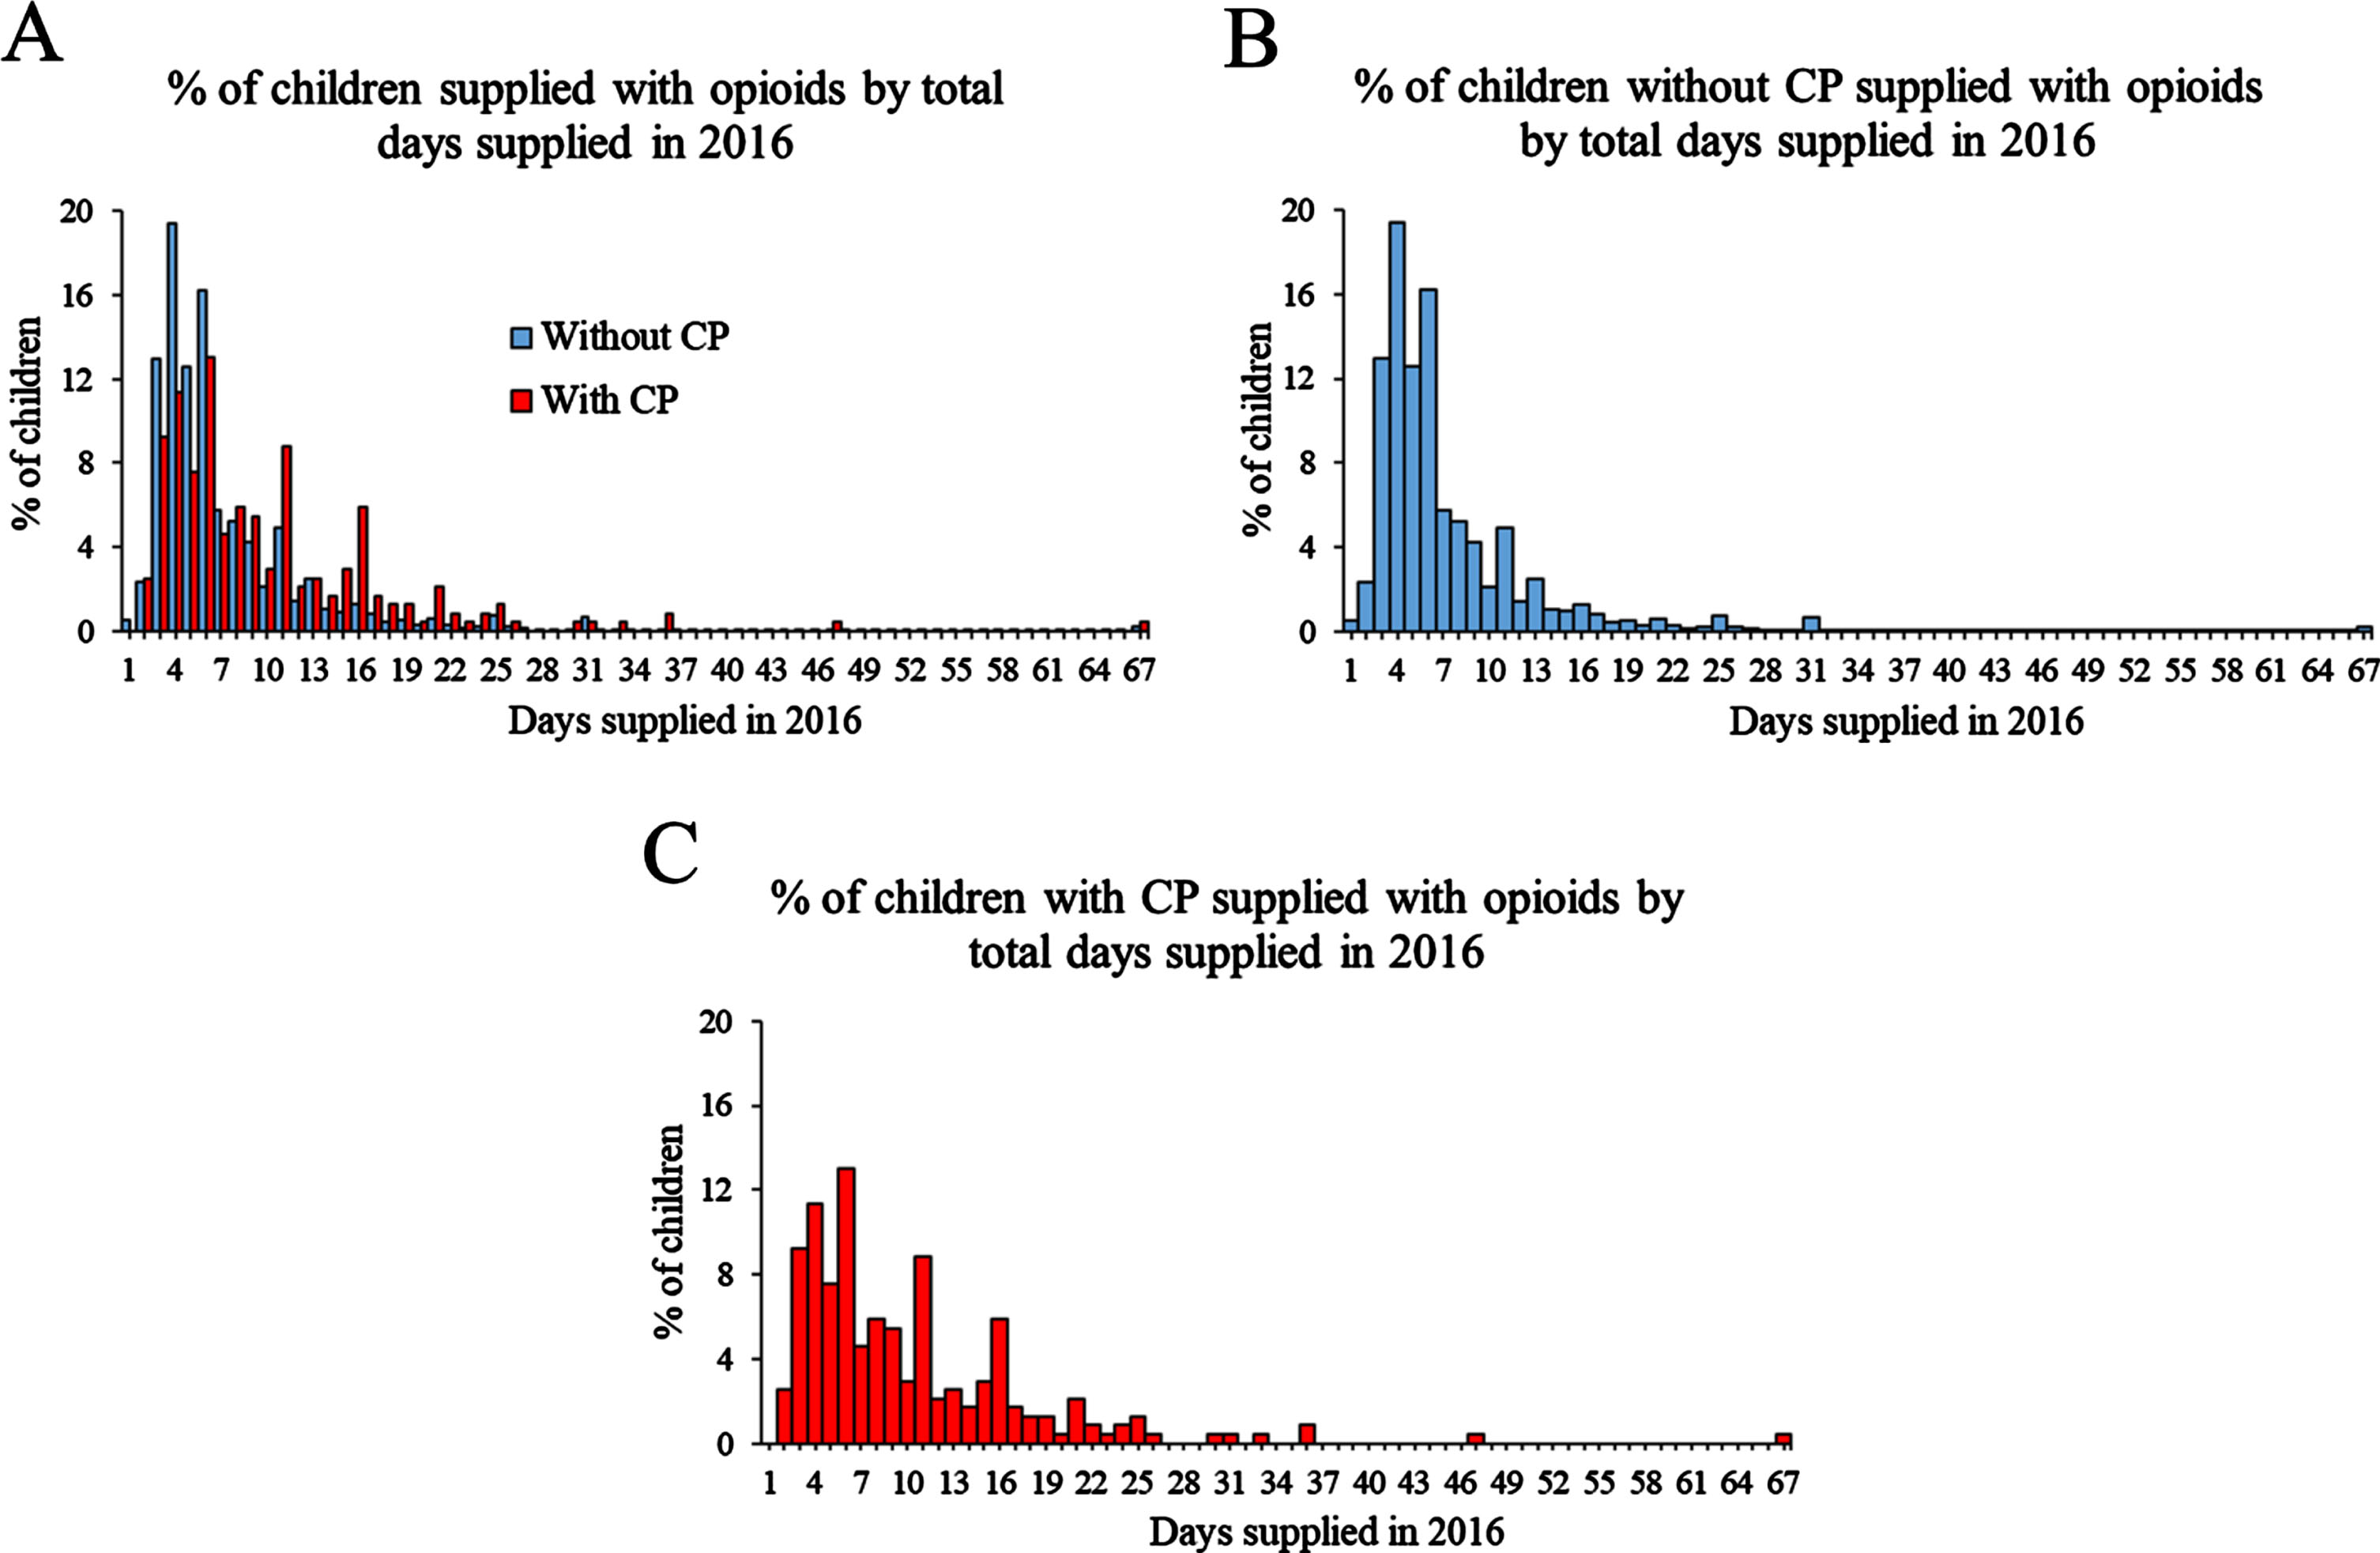
During the baseline year, 12.1% and 4.8% of children with and without CP, respectively, were exposed to opioids, which was similar in the follow-up year (Table 3). Among children exposed to opioids, children with CP had a higher number of days supplied for the baseline and follow-up periods. The proportion exposed to opioids increased with older age groups for children with and without CP. While the relative difference between children with and without CP decreased with the older age groups, a higher proportion of those with CP were exposed to opioids across all age groups. Notably, children with CP in the youngest age group, 2–4 years old, had a relatively high proportion of exposure to opioids (8.6% in the baseline year, 9.6% in the follow-up year) as compared to children without CP (1.7% in the baseline year, 1.8% in the follow-up year; Table 3). The distribution of days supplied among children with opioid exposure for the follow-up year is displayed in Fig. 2.
Table 3
Proportion of children with cerebral palsy (CP, n= 1,966) and without (w/o) CP (n= 1,219,399) exposed to opioids per study year and the number of days supplied
| Proportion exposed to opioids | Days supplied with opioidsa | |||
| CP | w/o CP | CP | w/o CP | |
| Full cohorts | % (n) | % (n) | Median (IQR) | Median (IQR) |
| Baseline year | 12.1 (237)b | 4.8 (58,526) | 7 (5–13)b | 6 (4–9) |
| Follow-up year | 12.1 (238)b | 5.3 (65,097) | 8 (5–13)b | 6 (4–9) |
| Follow-up year without baseline exposure | 9.8 (169)b | 4.8 (55,272) | 7 (5–11)b | 6 (4–8) |
| By age group | ||||
| Baseline year | ||||
| 2–4 years | 8.6 (34)b | 1.7 (4,248) | 9 (6–19) | 7 (5–11) |
| 5–8 years | 9.1 (29)b | 2.8 (5,640) | 6 (5–11)c | 7 (5–11) |
| 9–13 years | 10.1 (62)b | 3.4 (12,575) | 7 (5–13) | 6 (4–10) |
| 14–18 years | 17.7 (112)b | 9.1 (36,063) | 8 (5–14)b | 6 (4–8) |
| Follow-up year | ||||
| 2–4 years | 9.6 (38)b | 1.8 (4,329) | 10 (6–14) | 7 (5–11) |
| 5–8 years | 9.7 (31)b | 2.5 (5,120) | 8 (6–11) | 7 (5–11) |
| 9–13 years | 11.0 (68)b | 3.3 (12,200) | 7 (4–12) | 6 (4–9) |
| 14–18 years | 16.0 (101)b | 10.0 (43,448) | 8 (4–14)b | 5 (4–8) |
| Follow-up year without baseline exposure | ||||
| 2–4 years | 6.9 (25)b | 1.6 (3,900) | 7 (6–11) | 7 (5–11) |
| 5–8 years | 9.3 (27)b | 2.3 (4,548) | 8 (6–11) | 7 (5–11) |
| 9–13 years | 9.8 (54)b | 3.0 (10,674) | 8 (5–12)c | 6 (4–9) |
| 14–18 years | 12.1 (63) | 10.0 (36,150) | 7 (4–11)b | 5 (4–7) |
aAmong children exposed to opioids. bP < 0.01 for CP compared to w/o CP. cP < 0.05 for CP compared to w/o CP.
Fig. 2
Distribution of days supplied with opioids among children without cerebral palsy (CP, A) and with CP (B) with exposure to opioids in the follow-up year, 2016. The data are presented for each day, while the x-axis shows every three days to avoid overcrowding the text. The number of days is capped at 67 as this was the highest number of days for children with CP, which is the primary cohort of interest. For children without CP (A), 0.20% were prescribed 68 days or more of opioids, but this is difficult to visualize in the graph given the small proportion.
Children with CP had a significantly lower OR of zero-values in the unadjusted and adjusted zero-inflation model, indicating a higher proportion were exposed to opioids (Table 4). Among those exposed to opioids, children with CP had a higher number of days supplied with opioids in the unadjusted and adjusted count model than those without CP. There was evidence of moderation by age group for both the zero-inflated and count models (P for interaction, both <0.001), race for the count model (P for interaction, 0.008), and number of NDDs for the count model (P for interaction, <0.001). The results of the stratified adjusted analyses are also presented in Table 4. The proportion of 14–18 year olds exposed to opioids was less disparate compared to younger age groups but still higher for children with CP than without (zero-inflated model). Further, 14–18 year olds with CP had a 23% higher adjusted number of days supplied (count model) than those without CP. Asian children with CP had a 43% higher adjusted number of days supplied, while Black children with CP had a 33% lower adjusted number of days supplied (count model) than those without CP. Among children with no NDDs, those with CP had a higher adjusted number of days supplied than those without CP (count model). This association was reversed when comparing children with and without CP with one or ≥2 NDDs, such that children with CP with ≥1 NDD had a lower adjusted number of days supplied compared to children without CP with ≥1 NDD (count model).
Table 4
Results for the main effect (full cohort) and effect modification (interactions) of zero-inflated Poisson model for opioid exposure (zero-inflation model) and days exposed to opioids (count model) in the follow-up year comparing children with cerebral palsy (CP, n= 1,966) to children without (w/o) CP (n= 1,219,399)
| Zero-inflated model | Count model | |||
| Unadjusted | Adjusted | Unadjusted | Adjusted | |
| OR (95% CI) | OR (95% CI) | IRR (95% CI) | IRR (95% CI) | |
| Full cohort | ||||
| CP vs. w/o CP | 0.41 (0.36, 0.47) | 0.41 (0.35, 0.47) | 1.31 (1.26, 1.37) | 1.08 (1.03, 1.12) |
| Interactions | ||||
| Age group | ||||
| CP vs. w/o CP | ||||
| 2–4 years | – | 0.22 (0.15, 0.31) | – | 1.06 (0.95, 1.18) |
| 5–8 years | – | 0.28 (0.19, 0.41) | – | 1.12 (1.00, 1.26) |
| 9–13 years | – | 0.32 (0.25, 0.42) | – | 0.92 (0.85, 1.00) |
| 14–18 years | – | 0.61 (0.49, 0.76) | – | 1.23 (1.15, 1.31) |
| Race | ||||
| CP vs. w/o CP | ||||
| Asian | – | – | – | 1.43 (1.09, 1.88) |
| Black | – | – | – | 0.67 (0.57, 0.79) |
| Hispanic | – | – | – | 1.09 (0.94, 1.25) |
| White | – | – | – | 1.08 (1.03, 1.14) |
| Other/unknown | – | – | – | 1.33 (1.18, 1.50) |
| Number of NDDs | ||||
| CP vs. w/o CP | ||||
| 0 | – | – | – | 1.36 (1.29, 1.44) |
| 1 | – | – | – | 0.91 (0.85, 0.98) |
| ≥2 | – | – | – | 0.68 (0.60, 0.77) |
OR, odds ratio; CI, confidence interval; IRR, incidence rate ratio; NDDs, neurological/neurodevelopmental disabilities including epilepsy, intellectual disabilities, and autism spectrum disorders. The covariates in the adjusted model include age group, gender, race, U.S. region of residence, and the number of co-occurring NDDs as 0, 1, or ≥2. The zero-inflation model is a logistic regression model, predicting whether the individual had zero vs. non-zero days exposed to opioids. An OR < 1.00 indicates a lower likelihood of having zero days exposed to opioids. The count model is a Poisson regression model, predicting the number of days exposed to opioids among those with non-zero values.
4Discussion
Among this nationwide, commercially insured cohort, ∼ 1 in eight children with CP were exposed to opioids annually, which was more common than the ∼ 1 in 20 from the general population of children without CP. Additionally, among those exposed to opioids, children with CP had a higher number of days supplied with opioids than those without CP, especially among 14–18 year olds.
It is important to highlight that while children with CP had a higher proportion of exposure to opioids and days supplied with opioids, there was no strong evidence indicating that opioids were being used to manage chronic pain given the short duration of annual number of days supplied with opioids (Fig. 1). This is reassuring as opioids have limited effectiveness for treating chronic pain [6], and it has recently been recommended to avoid them for the treatment of chronic pain or for use in the outpatient pediatric setting [21].
The scope of this early work was focused on establishing the epidemiology of opioid prescription patterns among commercially insured children with CP, as it was uncertain whether opioids were being used acutely or chronically for this pediatric population. Further, the study time period was selected as it was prior to major changes in policy and public health as they relate to opioid prescriptions. Thus, study findings can be interpreted as a “baseline” exposure pattern among commercially insured children with CP prior to the changing landscape of opioid prescription and administration. These findings lay the foundation for future studies to examine changes in opioid prescription patterns before and after opioid administration-related legislation and the growing clinical awareness of the need for alternative, non-opioid approaches for pain management. Further, study findings can inform future research into the reasons why opioids are prescribed and side effects of short-term opioid prescriptions. For example, the differences in opioid prescribing patterns between cohorts may have been due to the relatively high frequency of surgeries to manage post-surgical pain among children with CP [22]. In addition, children with CP commonly present with increased muscle tone and discomfort during acute illness (e.g., infections) or other complications (e.g., pressure ulcer, constipation), which may also explain short-term opioid prescription.
Increasing age was associated with a greater likelihood of opioid exposure in the current study. This is concerning, as the risk of respiratory depression increases from the toddler to adolescent years among individuals with neurodevelopmental disabilities, including CP [23]. However, it is important to note that a substantial portion of children with CP were exposed to opioids at young ages. For example, ∼ 9–10% of 2–4 and 5–8 year olds with CP were exposed to opioids in a single year, compared to ∼ 2–3% for the same age groups without CP. It is unknown if this early acute opioid exposure alters neuro-biological development that could compound and lead to lasting ramifications on physical and mental health, especially if opioid exposure is repeated multiple times during growth. For example, a study in preterm infants (<32 gestational weeks) with a birth weight < 1,500 grams found that infants exposed to morphine in the first week of life were more likely to develop cerebellum and white matter injury and small cerebellar volume than infants who were not exposed [24].
This study found an interaction between cohort and race, such that Asian children with CP were prescribed 43% more days of opioids than those without CP, while Black children with CP were prescribed 33% fewer days than those without. The reason for the differential opioid prescribing pattern for children with CP based on race was not clear. However, ∼ 1 in 10 children with and without CP had “other/unknown” race, which limited the interpretation of the observed interaction. Further, as discussed in more detail below, the proportion of Black children with CP with private insurance is very low [25], further limiting the interpretation of the observed interaction.
This study also found an interaction between cohort and the number of NDDs. When analyses were examined based on the number of NDDs, children with CP were prescribed 36% more days of opioids for those with 0 NDDs and 32% fewer days for those with ≥2 NDDs than children without CP. It is important to note that these effect estimates are relative differences. Co-occurring NDDs increase medical complexity and likelihood of opioid exposure for individuals with CP [7]. Therefore, these findings suggest that the presence of CP may be associated with fewer days supplied with opioids among children with NDDs. One possible explanation may relate to clinician recognition of complex medical profiles and concerns over risk of negative opioid interactions with drugs used to manage other symptoms associated with CP and NDDs. However, this study did not examine the composition of NDDs, which may have helped to explain a portion of these findings. For example, the most common NDD in the cohort with CP was epilepsy (34.3%) followed by autism spectrum disorders (12.1%) and intellectual disabilities (11.0%), while for the cohort without CP, it was autism spectrum disorders (1.1%) followed by epilepsy (0.5%) and intellectual disabilities (0.2%).
Evidence that children with special health care needs, including CP, are more likely to receive opioids and for more days is beginning to accumulate [26]. The main benefit of opioids is acute pain relief, which is important given the evidence that pain is negatively associated with quality of life, daily activity, and sleep [2, 3, 27, 28]. However, these benefits need to be weighed with risks of opioid use, especially considering that there are other available acute and chronic pain management strategies using pharmacological and non-pharmacological approaches. Opioids can have many side effects including constipation, nausea, sedation, pruritis, and respiratory depression, which may be exacerbated in children with CP [21]. Future studies are needed to identify the risk-benefit balance of opioid use, even short-term such as in this study, and if other pain management strategies may offer an improved risk-benefit balance.
The limitations of this study must be discussed. First, this study used claims data which has limitations regarding suboptimal detection (e.g., sensitivity), errors in coding, and not fully recognized or unknown methodological rigor in identifying variables of interest. For example, this study used ICD codes for identifying the diagnosis of CP and NDDs, which can be prone to errors such as suboptimal sensitivity. This may limit the anticipated representativeness of this cohort and bias generalizations. Further, the assistive mobility device variable has not been validated and may have better detection if related claims were searched over a longer period than this study used. Additionally, in this study, ∼ 34% of children with CP had epilepsy, ∼ 11% had intellectual disabilities, and ∼ 12% had autism spectrum disorders. These prevalence estimates are similar to the ∼ 35–39% rates (epilepsy), lower than the 28% (intellectual disabilities), and slightly higher than the ∼ 8% (autism spectrum disorders), respectively, reported in population-based studies among children with CP [29, 30]. Differences in diagnoses of intellectual disabilities and autism spectrum disorders likely stem from the different methodologies used for diagnosis and the time period examined. Second, this study accessed private (commercial) insurance data and may not be representative of the greater pediatric population with CP. The prevalence of CP in this cohort was 1.61 per 1,000, which is lower than the 2.1 to 3.1 per 1,000 reported in population-based studies [31, 32]. However, the lower proportion of children with CP is not necessarily surprising as children with CP can also receive Medicaid insurance coverage, possibly at a disproportionate rate. Based on population-based estimates from a nationally representative database of children 0–17 years of age in the U.S., 65.3% of children with CP were covered by private insurance in 2016 [33]. Compared to children with CP with public-only insurance, those with private insurance showed no differences in age, sex, or severity of CP (56.0–60.6% were parent-reported to have “moderate or severe” CP). However, the group with CP with private insurance had a lower prevalence of Black children (6.8% vs. 35.8%) than those with public-only insurance. In a different nationally representative study among the general pediatric population 0–17 years of age, there was a similar proportion of children exposed to opioids when comparing children with private vs. public insurance [25]. Taken together, findings from this study should be interpreted within the context of this commercially insured cohort with possible insufficient racial representation. Third, this study did not have access to inpatient pharmacy claims and may have underestimated the extent and duration of opioid exposure. Fourth, the claims data provided information on medications prescribed, the fill date, and days supplied but not whether the individual took the medication timely and correctly. Lastly, the administrative data lacked information about the severity of CP. However, adjustment of co-occurring NDDs provided necessary information relevant to the scope of this early work establishing epidemiologic evidence of opioid prescriptions patterns.
5Conclusion
Study findings suggest that children with CP are more likely to be prescribed opioids and for a longer duration than children without CP. Nevertheless, the total days supplied were more aligned with acute rather than chronic pain management. Future studies are needed to determine if children with CP are susceptible to acute and long-term harmful effects of opioid exposure and if non-opioid pain management strategies are suitable alternatives.
Acknowledgments
The authors have no acknowledgments.
Declaration of interest
The authors have no conflict of interest to report.
References
[1] | Whitney DG , Warschausky SA , Peterson MD . Mental health disorders and physical risk factors in children with cerebral palsy: A cross-sectional study. Dev Med Child Neurol. (2019) ;61: (5):579–585. doi: 10.1111/dmcn.14083 |
[2] | Ostojic K , Paget S , Kyriagis M , Morrow A . Acute and Chronic Pain in Children and Adolescents With Cerebral Palsy: Prevalence, Interference, and Management. Arch Phys Med Rehabil. (2020) ;101: (2):213–219. doi: 10.1016/j.apmr.2019.08.475 |
[3] | Penner M , Xie WY , Binepal N , Switzer L , Fehlings D . Characteristics of pain in children and youth with cerebral palsy. Pediatrics. (2013) ;132: (2):e407–413. doi: 10.1542/peds.2013-0224 |
[4] | Matson KL , Johnson PN , Tran V , Horton ER , Sterner-Allison J . Opioid Use in Children. J Pediatr Pharmacol Ther. (2019) ;24: (1):72–75. doi: 10.5863/1551-6776-24.1.72 |
[5] | Kelley-Quon LI , Kirkpatrick MG , Ricca RL , et al. Guidelines for Opioid Prescribing in Children and Adolescents After Surgery: An Expert Panel Opinion. JAMA Surg. (2021) ;156: (1):76–90. doi: 10.1001/jamasurg.2020.5045 |
[6] | Chou R , Turner JA , Devine EB , et al. The effectiveness and risks of long-term opioid therapy for chronic pain:Asystematic review for a National Institutes of Health Pathways to Prevention Workshop. Ann Intern Med. (2015) ;162: (4):276–286. doi: 10.7326/M14-2559 |
[7] | Garca Jalon EG , Maguire A , Perra O , Gavin A , O’Reilly D , Thurston A . Data linkage and pain medication in people with cerebral palsy: A cross-sectional study. Dev Med Child Neurol. (2021) ;63: (9):1085–1092. doi: 10.1111/dmcn.14854 |
[8] | Banta-Green CJ , Merrill JO , Doyle SR , Boudreau DM , Calsyn DA . Opioid use behaviors, mental health and pain–development of a typology of chronic pain patients. Drug Alcohol Depend. (2009) ;104: (1–2):34–42. doi: 10.1016/j.drugalcde2009.03.021 |
[9] | Carman WJ , Su S , Cook SF , Wurzelmann JI , McAfee A . Coronary heart disease outcomes among chronic opioid and cyclooxygenase-2 users compared with a general population cohort. Pharmacoepidemiol Drug Saf. (2011) ;20: (7):754–762. doi: 10.1002/pds.2131 |
[10] | Li L , Setoguchi S , Cabral H , Jick S . Opioid use for noncancer pain and risk of fracture in adults: A nested case-control study using the general practice research database. Am J Epidemiol. (2013) ;178: (4):559–569. doi: 10.1093/aje/kwt013 |
[11] | Whitney DG , Bell S , Etter JP , Prisby RD . The cardiovascular disease burden of non-traumatic fractures for adults with and without cerebral palsy. Bone. (2020) ;136: :115376.. doi: 10.1016/j.bone.2020.115376 |
[12] | Barja S , Le Roy C , Sepúlveda C , Guzmán ML , Olivarez M , Figueroa MJ . Obesity and cardio-metabolic risk factors among children and adolescents with cerebral palsy. Nutr Hos. (2020) ;37: (4):685–691. doi: 10.20960/nh.03009 |
[13] | Leino K , Mildh L , Lertola K , Seppälä T , Kirvelä O . Time course of changes in breathing pattern in morphine- and oxycodone-induced respiratory depression. Anaesthesia. (1999) ;54: (9):835–840. doi: 10.1046/j.1365-2044.1999.00946.x |
[14] | Lee LA , Caplan RA , Stephens LS , et al. Postoperative opioid-induced respiratory depression: A closed claims analysis. Anesthesiology. (2015) ;122: (3):659–665. doi: 10.1097/ALN.0000000000000564 |
[15] | Jiang ZD , Wu YY , Liu XY , Wilkinson AR . Depressed brainstem auditory function in children with cerebral palsy. J Child Neur. (2011) ;26: (3):272–278. doi: 10.1177/0883073810379913 |
[16] | Boel L , Pernet K , Toussaint M , et al. Respiratory morbidity in children with cerebral palsy: An overview. Dev Med Child Neurol. (2019) ;61: (6):646–653. doi: 10.1111/dmcn.14060 |
[17] | State laws limiting prescriptions for opioid analgesics.Prescription Drug Abuse Policy System; 2019 [cited 28 February 2023]. Available from: https://pdaps.org/datasets/opioid-analgesics-prescribing-limits |
[18] | Pruente J , Daunter AK , Bowman A , Erickson SR , Whibley D , Whitney DG . Trajectories of medication use and polypharmacy among children with cerebral palsy. J Manag Care Spec Pharm. (2023) ;29: (1):58–68. doi: 10.18553/jmc2023.29.1.58 |
[19] | Whitney DG , Kamdar NS , Ng S , Hurvitz EA , Peterson MD . Prevalence of high-burden medical conditions and health care resource utilization and costs among adults with cerebral palsy. Clin Epidemiol. (2019) ;11: :469–481. doi: 10.2147/CLEP.S205839 |
[20] | Lambert D . Zero-Inflated Poisson Regression, with an Application to Defects in Manufacturing. Technometrics. (1992) ;34: (1):1–14. doi: 10.2307/1269547 |
[21] | Parikh JM , Amolenda P , Rutledge J , Szabova A , Chidambaran V . An update on the safety of prescribing opioids in pediatrics. Expert Opin Drug Saf. (2019) ;18: (2):127–143. doi: 10.1080/14740338.2019.1571037 |
[22] | Rehbein I , Teske V , Pagano I , Cúneo A , Pérez ME , von Heideken J . Analysis of orthopedic surgical procedures in children with cerebral palsy. World J Ortho. (2020) ;11: (4):222–231. doi: 10.5312/wjo.v11.i4.222 |
[23] | Jay MA , Thomas BM , Nandi R , Howard RF . Higher risk of opioid-induced respiratory depression in children with neurodevelopmental disability: A retrospective cohort study of 12 904 patients. Br J Anaesth. (2017) ;118: (2):239–246. doi: 10.1093/bja/aew403 |
[24] | Al-Mouqdad MM , Jamjoom DZ , Huseynova R , et al. Association between morphine exposure and impaired brain development on term-equivalent age brain magnetic resonance imaging in very preterm infants. Sci Rep. (2022) ;12: (1):4498. doi: 10.1038/s41598-022-08677-0 |
[25] | Groenewald CB , Rabbitts JA , Gebert JT , Palermo TM . Trends in opioid prescriptions among children and adolescents in the United States: A nationally representative study from 1996 to 2012.. Pain. (2016) ;157: (5):1021–1027. doi: 10.1097/j.pain.0000000000000475 |
[26] | Feinstein JA , Rodean J , Hall M , et al. Outpatient Prescription Opioid Use in Pediatric Medicaid Enrollees With Special Health Care Needs. Pediatrics. (2019) ;143: (6):e20182199.. doi: 10.1542/peds.2018-2199 |
[27] | Whitney DG , Peterson MD , Warschausky SA . Mental health disorders, participation, and bullying in children with cerebral palsy. Dev Med Child Neurol. (2019) ;61: (8):937–942. doi: 10.1111/dmcn.14175 |
[28] | Whitney DG , Shapiro DN , Peterson MD , Warschausky SA . Factors associated with depression and anxiety in children with intellectual disabilities. J Intellect Disabil Res. (2019) ;63: (5):408–417. doi: 10.1111/jir.12583 |
[29] | Hollung SJ , Bakken IJ , Vik T , et al. Comorbidities in cerebral palsy: A patient registry study. Dev Med Child Neuro. (2020) ;62: (1):97–103. doi: 10.1111/dmcn.14307 |
[30] | Kirby RS , Wingate MS , Van Naarden Braun K , et al. Prevalence and functioning of children with cerebral palsy in four areas of the United States in A report from the Autism and Developmental Disabilities Monitoring Network. Res Dev Disabil. (2011) ;32: (2):462–469. doi: 10.1016/j.ridd.2010.12.042 |
[31] | Christensen D , Van Naarden Braun K , Doernberg NS , et al. Prevalence of cerebral palsy, co-occurring autism spectrum disorders, and motor functioning –Autism and Developmental Disabilities Monitoring Network, USA, 2008. Dev Med Child Neurol. (2014) ;56: (1):59–65. doi: 10.1111/dmcn.12268 |
[32] | Oskoui M , Coutinho F , Dykeman J , Jetté N , Pringsheim T . An update on the prevalence of cerebral palsy: A systematic review and meta-analysis. Dev Med Child Neurol. (2013) ;55: (6):509–519. doi: 10.1111/dmcn.12080 |
[33] | Whitney DG , Hurvitz EA , Caird MS . Critical periods of bone health across the lifespan for individuals with cerebral palsy: Informing clinical guidelines for fracture prevention and monitoring. Bone. (2021) :150: :116009. doi: 10.1016/j.bone.2021.116009 |


