
Ankle proprioception in children with cerebral palsy
Abstract
PURPOSE:
There is no established clinical standard to evaluate ankle proprioception in children with cerebral palsy (CP). This study compared ankle position sense of children with CP to age-matched children who are typically developing (TD).
METHODS:
Children aged 6–17 years participated (15 CP, 58 TD). Using a custom-built device, the ankle was passively rotated to two positions for 25 trials. Using a psychophysical forced-choice paradigm, participants indicated which position was more plantarflexed. A psychometric function was fitted to the response data to determine the just noticeable difference (JND) threshold and the associated uncertainty (random error) for ankle position sense.
RESULTS:
Median JND thresholds for the CP group were elevated (CP: 4.3°, TD: 3.0°). Three children with CP exceeded the 95th percentile of TD. No differences in random error were found.
CONCLUSION:
This method assessed ankle proprioception relative to norm data and identified position sense impairments in children with CP. Using this method can provide data on proprioceptive status in CP, augmenting the assessment of motor impairment.
1Introduction
Proprioceptive signals from peripheral mechanoreceptors form the basis of conscious awareness of body or joint position or movement [1] and are used to control posture and gait. Lower limb proprioceptive impairment likely contributes to the high rate of falls reported in children with cerebral palsy (CP) [2]. However, proprioceptive status is almost never assessed clinically, and no comprehensive data exists on the breadth and severity of proprioceptive dysfunction in CP [3]. Previous research examining lower extremity proprioceptive function in CP applied joint position matching or movement detection methods at various joints [4–13]. Yet, there are limitations to these approaches. For example, the movement detection method is commonly used in clinical sensory tests (e.g., Nottingham Sensory Assessment or Erasmus MC modified Nottingham Sensory Assessment; Rivermead Assessment of Somatosensory Performance), in which participants, with eyes closed, identify if, or in which direction, a limb was moved. The proportion of correct responses is summed over 3-6 trials. While quick, this method cannot quantify the extent of the proprioceptive deficit since it yields only dichotomous classification. Joint position matching methods address some of the above shortcomings but often they require participants to actively move their limb. Consequently, motor impairments may confound the proprioceptive (somatosensory) function one aims to measure [4–8, 10, 11, 13, 14]. Only Damiano et al. [4] accounted for this motor impairment by subtracting out the joint position matching error during a vision condition compared to a no-vision condition. Another problem with many existing methods is the lack of age-matched data for peers who are typically developing (TD), making it difficult to contextualize proprioceptive impairment among individuals with CP [5, 6, 8, 11, 12]. Lastly, none of the previous CP proprioception studies used the method of constant stimulus, which is considered the most accurate of the three psychophysical methods to quantify proprioceptive acuity [1, 15]. Acuity reflects the sharpness of a sense, that is, the ability to discriminate between small stimuli.
This study utilized the method of constant stimulus, in which participants were repeatedly presented pairs of joint positions in a two-alternative forced-choice paradigm to determine their smallest perceived angular difference. This method affords the necessary sensitivity and accuracy lacking in the available clinical tests. Importantly, it provides information about two aspects of position sense acuity –the bias, or systematic error, in the form of the just noticeable difference (JND) threshold, and precision, or random error, in the form of the uncertainty area (UA). Here, the UA corresponds to the variability in making repeated judgements about ankle positions. The method requires an attentive participant, short-term memory to compare the pairs of stimuli, and more trials than the other two methods. The purpose of this proof-of-concept study was to document that the proposed method can be used in children with CP who can walk and is able to identify children with abnormal ankle position sense when compared to TD children. Based on moderate to large effect sizes for proprioceptive impairments observed in other studies [4, 10, 13, 14], it was hypothesized that children with CP would collectively show evidence of impaired ankle position sense compared to a TD cohort.
2Methods
2.1Participants
A power analysis using an effect size estimated from between group differences observed in Zarkou et al. informed the target sample size of children with CP [14]. For power = 0.8, alpha = 0.05, and Cohen’s d ≈ 0.96, a minimum of 15 participants per group were necessary to detect a statistically significant difference in ankle position sense acuity. Fifteen children with CP (mean [M] age: 11 years 10 months; standard deviation [SD]:±2 years 10 months; range: 6 years 8 months –15 years 9 months; 6 males, 9 females) and 58 TD children (M age: 12 years 3 months; SD:±3 years 2 months; range: 7 –17 years; 34 males, 24 females) were able to follow the instructions and complete the study (Table 1). All children with CP were recruited from patients undergoing, or who had recently undergone, a clinical gait analysis at Gillette Children’s. All but four completed the proprioception test immediately after a 2.5-hour clinical gait analysis. Inclusion criteria were 1) a diagnosis of CP, 2) Gross Motor Function Classification System (GMFCS) level I-III, 3) age six to < 18 years, 4) able to comprehend English, and 5) expected to be able to follow instructions. Ambulatory individuals were enrolled as part of a larger project that required participants to be able to ambulate and perform other standing balance tasks. Exclusion criteria were any surgery in the past nine months or botulinum toxin injection in the past three months. One participant was receiving intrathecal baclofen. All TD children were recruited and tested at the 2019 Minnesota State Fair. Inclusion criteria were 1) no reported history of central or peripheral nervous system disorder, 2) no current injury to the lower limbs, and 3) no exposure to chemotherapy which could have affected somatosensory and motor function. Before testing, TD children completed the footedness questionnaire to determine the dominant foot to be tested [16]. Appropriate written parental consent and child assent were obtained prior to data collection. The studies were approved by the University of Minnesota Institutional Review Board.
Table 1
Participant demographics
| n | Age, mean (SD) [range] | Male sex, n (%) | GMFCS level, n (%) | Topography, n (%) | Tone type, n (%) | Prior Treatment, n (%) | |
| Typically developing | 58 | 12 y* (3 y) [7 y –17 y] | 24 (41) | ||||
| Cerebral palsy | 15 | 11 y 10 mo (2 y 10 m) [6 y 8 mo –15 y 10 mo] | 11 (73) | I: 6 (40) II: 7 (47) III: 2 (13) | Hemi: 6 (40) Di: 7 (47) Tri: 2 (13) | Spastic: 13 (87) Mixed: 2 (13) | Orthopedic: 4 (27) Selective dorsal rhizotomy: 3 (20) Tone: 9 (60) |
Tone treatments included intrathecal baclofen pump, botulinum toxin, and phenol. *Age in months was not collected for the typically developing population. Di: diplegic, GMFCS: Gross Motor Function Classification System, Hemi: hemiplegic, mo: months, n: sample size, SD: standard deviation, Tri: triplegic, y: years.
2.2Apparatus
Data were collected using the manual Ankle Proprioceptive Acuity System for all participants (Fig. 1A). Feasibility of this system for measuring human ankle position sense acuity had been established previously [17]. Moreover, intra- and inter-rater reliability concerns were negligible because the applied psychophysical method was not subject to researcher bias. The researcher did not rate a perceiver’s performance but only rotated the joint to the position indicated by the psi-marginal adaptive algorithm. With respect to test-retest reliability, the only source of variability was the inherent variability of the responder’s perception of ankle position. Unpublished data from eight healthy adults tested on three consecutive days showed very low test-retest variability (standard error of measurement = 0.09°).
Fig. 1
A. Front and side view of the manual Ankle Proprioceptive Acuity System. Rotating the handle by the researcher rotates the ankle. Desired degree of rotation can be set by mechanical stops in the semicircular pegboard at 0.1° increments. The system components can be adjusted to the leg anthropometrics of the participant, so that the approximate ankle joint axis aligns with the axis of rotation of the device. B. Example of the time course of a single trial. All trials started at the neutral 45° position. Reference position was always at 15° plantarflexion. Here, the researcher rotates the foot to the reference position, then returns the footrest to the initial position before rotating it to the comparison position (10° plantarflexion in this example). Thus, the stimulus difference is 5°. The participant indicates which experienced position (1st or 2nd) was closer to the floor. C. Example of a derived psychometric function. The just noticeable difference threshold corresponds to the difference between reference and comparison position at the 75% correct response rate. The uncertainty area is defined as the distance between the stimulus size differences at the 60th and 90th percentiles.
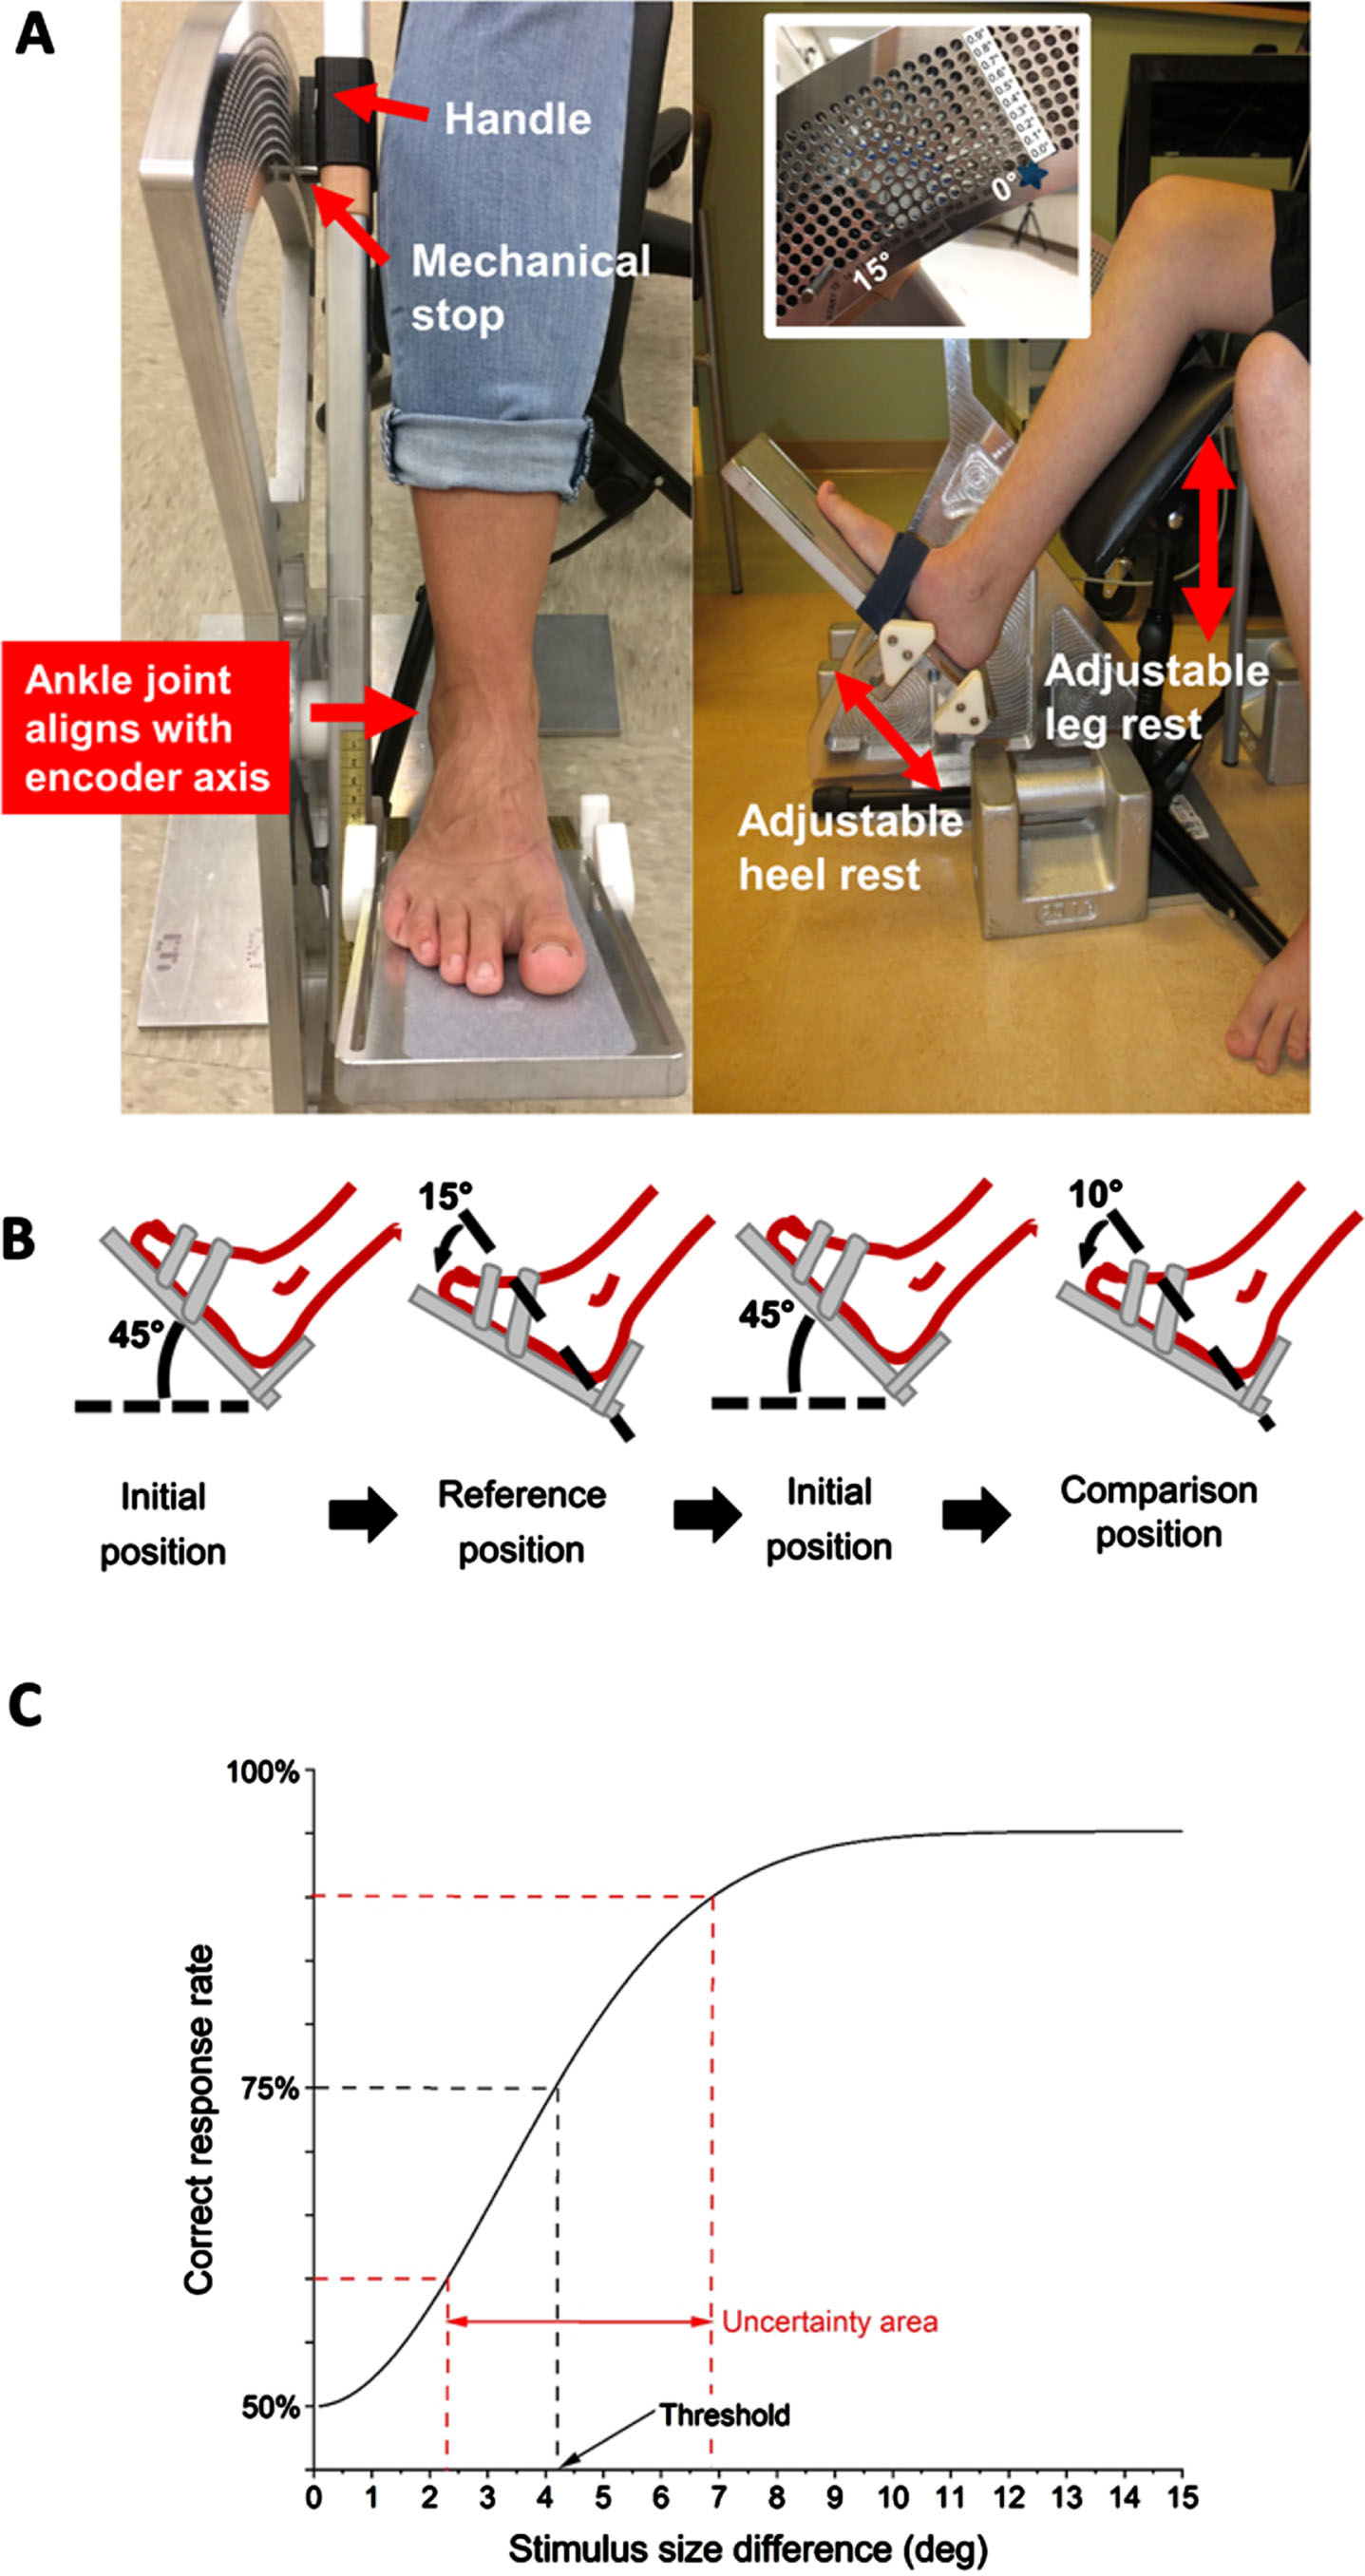
The system allowed for manual plantarflexion/dorsiflexion of the tested ankle to distinct ankle positions with a pegboard position resolution of 0.1°. Angular position and velocity were recorded by a US Digital H6 Optical Encoder (resolution: 0.036°) embedded in the device and aligned with the participant’s ankle joint axis (sampling frequency 100 Hz).
2.3Assessment procedure
Participants were barefoot and seated on a chair to perform the ankle position discrimination test on the more-involved (CP) or dominant ankle (TD). The more-involved side was determined by clinical diagnosis or a comprehensive exam (e.g., contracture, spasticity, weakness, selective motor control) by the physical therapist during the gait analysis. The footrest height and heel rest position were adjusted to align the ankle center, approximated as the lateral malleolus, with the device axis of rotation. The tested foot, stabilized by a strap, sat on the footrest with the participant’s ankle at approximately 90° relative to the shank. Participants wore vision occluding glasses to remove possible visual cues of ankle position during testing.
One of three researchers slowly plantarflexed the participant’s foot from an initial neutral position (0° plantarflexion) to a reference (15° plantarflexion) or comparison (0-15° plantarflexion) position. The participant’s foot was held for approximately two seconds, then moved back to the initial neutral position before moving to the other reference or comparison position (Fig. 1B). Participants were asked to verbally indicate in which of the two positions (first or second) their toes were closer to the floor. They were told to provide their best guess if they were unsure. Also, they were allowed to repeat a trial if they were not paying attention. Before the testing, there were at least three practice trials with or without vision occluding glasses to help participants acclimate to the device and testing procedure. The practice trials began with a large difference between the reference and comparison position (approximately 10°), to ensure that participants were able to discriminate and to understand the testing scheme. During actual testing, a participant’s verbal response (incorrect/correct) in the previous trial was used as input for an adaptive psi-marginal algorithm to determine the comparison position for the next trial within the allowable 15° stimulus range [18]. A total of 25 trials were performed. After 10 trials or when participants requested, a break was given. Instructions were reiterated when necessary. The complete protocol including practice and 25 test trials took 15-30 minutes to complete.
2.4Psi-marginal adaptive algorithm
The psi-marginal adaptive algorithm was used to update which comparison ankle position to present to the participant for each test trial [18]. This algorithm effectively decreased the number of trials (and thus time) necessary to determine the smallest detectable stimulus difference that a participant could perceive. The four parameters for this algorithm include the threshold (alpha), slope (beta), upper asymptote (i.e., lapse rate; lambda), and lower asymptote (i.e., guess rate; gamma). The threshold was of primary interest and was the stimulus intensity (difference between the reference and comparison ankle positions, in degrees) at which a participant would discriminate two different ankle positions at 75% accuracy. The range in which each participant’s threshold was assumed to fall was 0-15° of plantarflexion, with an increment of 0.1°. The slope measured the variability in perceptual judgments during an assessment. The range in which each participant’s slope was assumed to fall was -1.2 to 1.2. Lapse rate represented the proportion of trials the participant incorrectly answered because of inattentiveness for stimuli that the participant was truly capable of differentiating when vigilant. The range in which each participant’s lapse rate was assumed to fall was 0 to 0.1. Guess rate for this two-alternative forced choice task was 0.5, meaning that participants could have guessed correctly 50% of the time. Wait time was set to four, which represented the number of trials after the maximum stimulus intensity was presented (15° in this study) in which lapse rate was assumed fixed (0.1 in this study). Thus, if a wrong answer occurred during this wait time, lapse rate was not updated in the posterior distribution but rather stayed fixed.
2.5Psychometric function fitting
A logistic Weibull function (i.e., Gumbel function) was fitted to the stimulus difference-response data (i.e., the difference in the reference and comparison ankle angular positions and the incorrect/correct verbal response data for each participant) [19]. Based on the fitted function (Fig. 1C), two components of ankle position sense acuity were calculated: bias (systematic error) and precision (random error). Bias was measured as the JND threshold, the stimulus difference between the reference and comparison angular positions (in degrees) at the 75% probability of correct response of the function [15, 20]. Smaller JND thresholds (or less bias) represented higher ankle position sense acuity, which implied that the participant could discriminate between smaller differences in ankle position. Precision reflected how consistently a participant responded across all trials, represented by the UA of the fitted function. UA was calculated as the range of the stimuli (in degrees) between the 60% and 90% probabilities of a correct response [20]. A smaller UA value represented a higher ankle position sense precision, that is, the participant was more certain in their responses. The function fit allowed a range of UA≤25°.
2.6Statistical analysis
The statistical analysis was based on custom-written code in R (version 4.1.2). Shapiro-Wilk tests were performed to determine the normality of the outcome variables. Given that all variables were non-normal, subsequent non-parametric Wilcoxon rank sum tests were applied to determine group differences (TD vs. CP) for JND threshold and UA. Statistical significance was defined as p < 0.05.
3Results
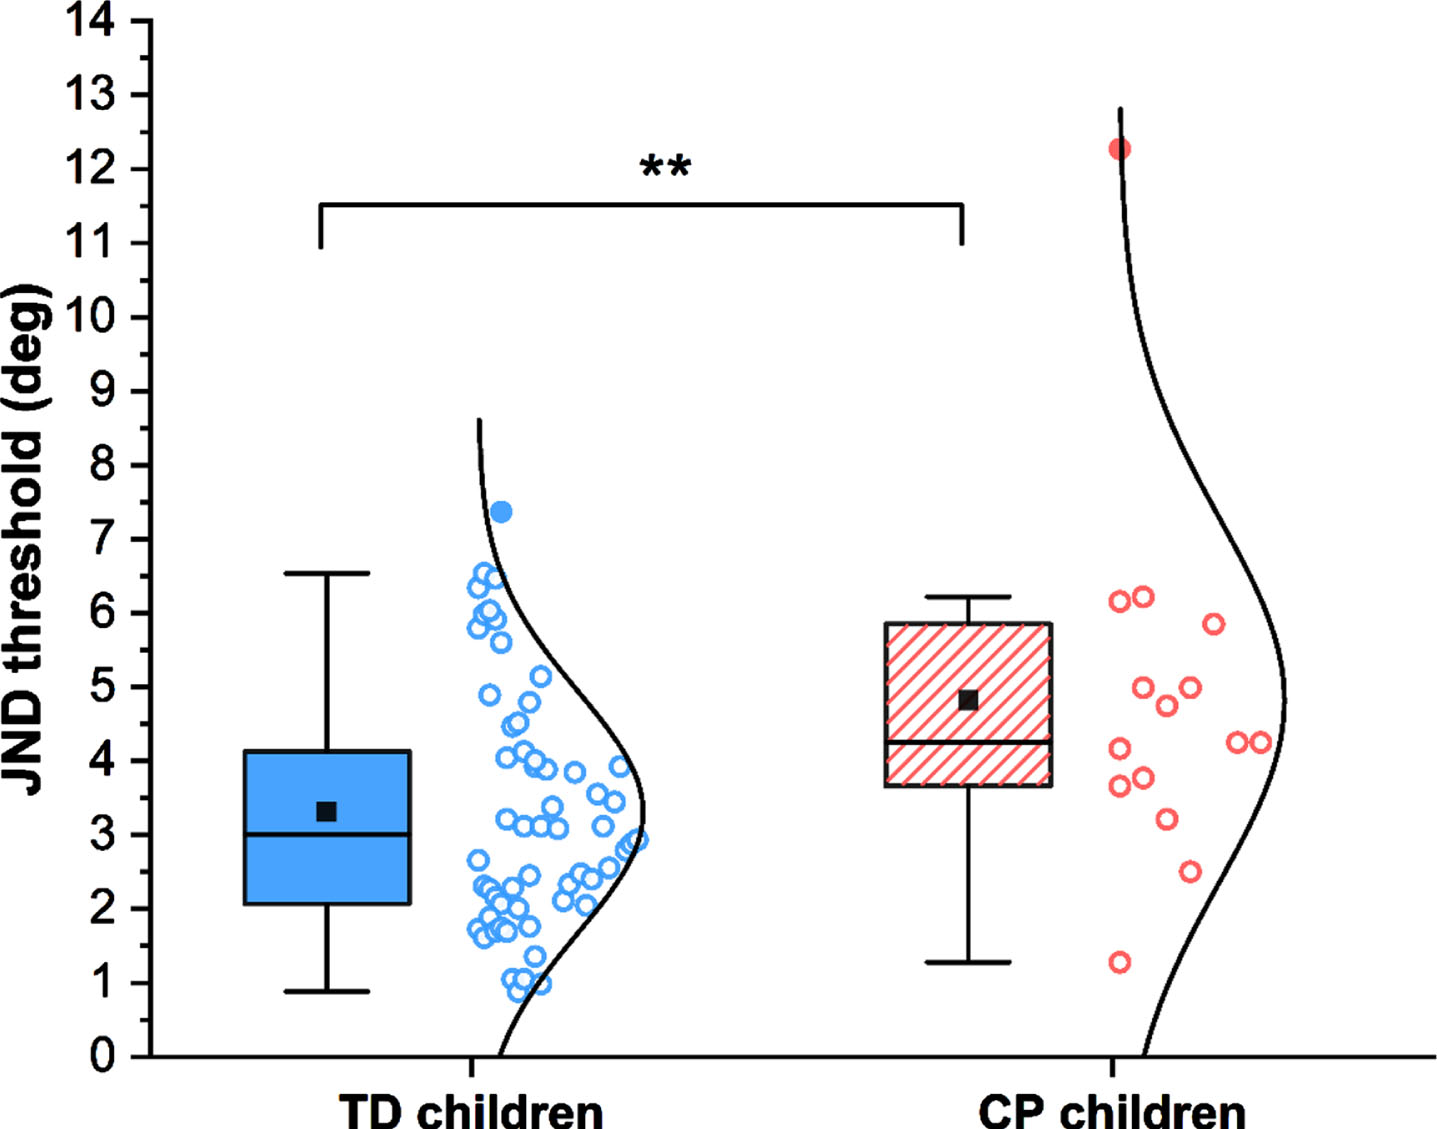
All individual JND threshold data for children with CP were compared to the age-appropriate median and quartiles from the TD cohort (Fig. 2). Most children with CP (9/15; 60%, standard error: 13%) exhibited JND thresholds within the third and fourth quartiles of the TD cohort, with three children (20%, standard error: 10%) exhibiting thresholds above the 95th percentile. There was no clear indication that JND threshold was related to a child’s GMFCS level. With respect to discerning differences at the group level (CP vs. TD), the Wilcoxon rank sum test showed a significant difference (W = 243.5, p = 0.009) between the JND threshold in TD children, compared to those with CP. The median JND threshold was 3.0° (range: 0.9 –7.4°) compared to 4.3° (range: 1.3 –12.3°), respectively (see Fig. 3).
Fig. 2
Just noticeable difference (JND) thresholds of all participants with cerebral palsy (CP) relative to chronological age of the (typically developing) TD cohort. Data of those who were TD were fitted with a 2nd order polynomial function. Black line represents the median; dark and light gray bands represent the distribution between the 25–75th and the 5–95th percentiles, respectively. GMFCS: Gross Motor Function Classification System.
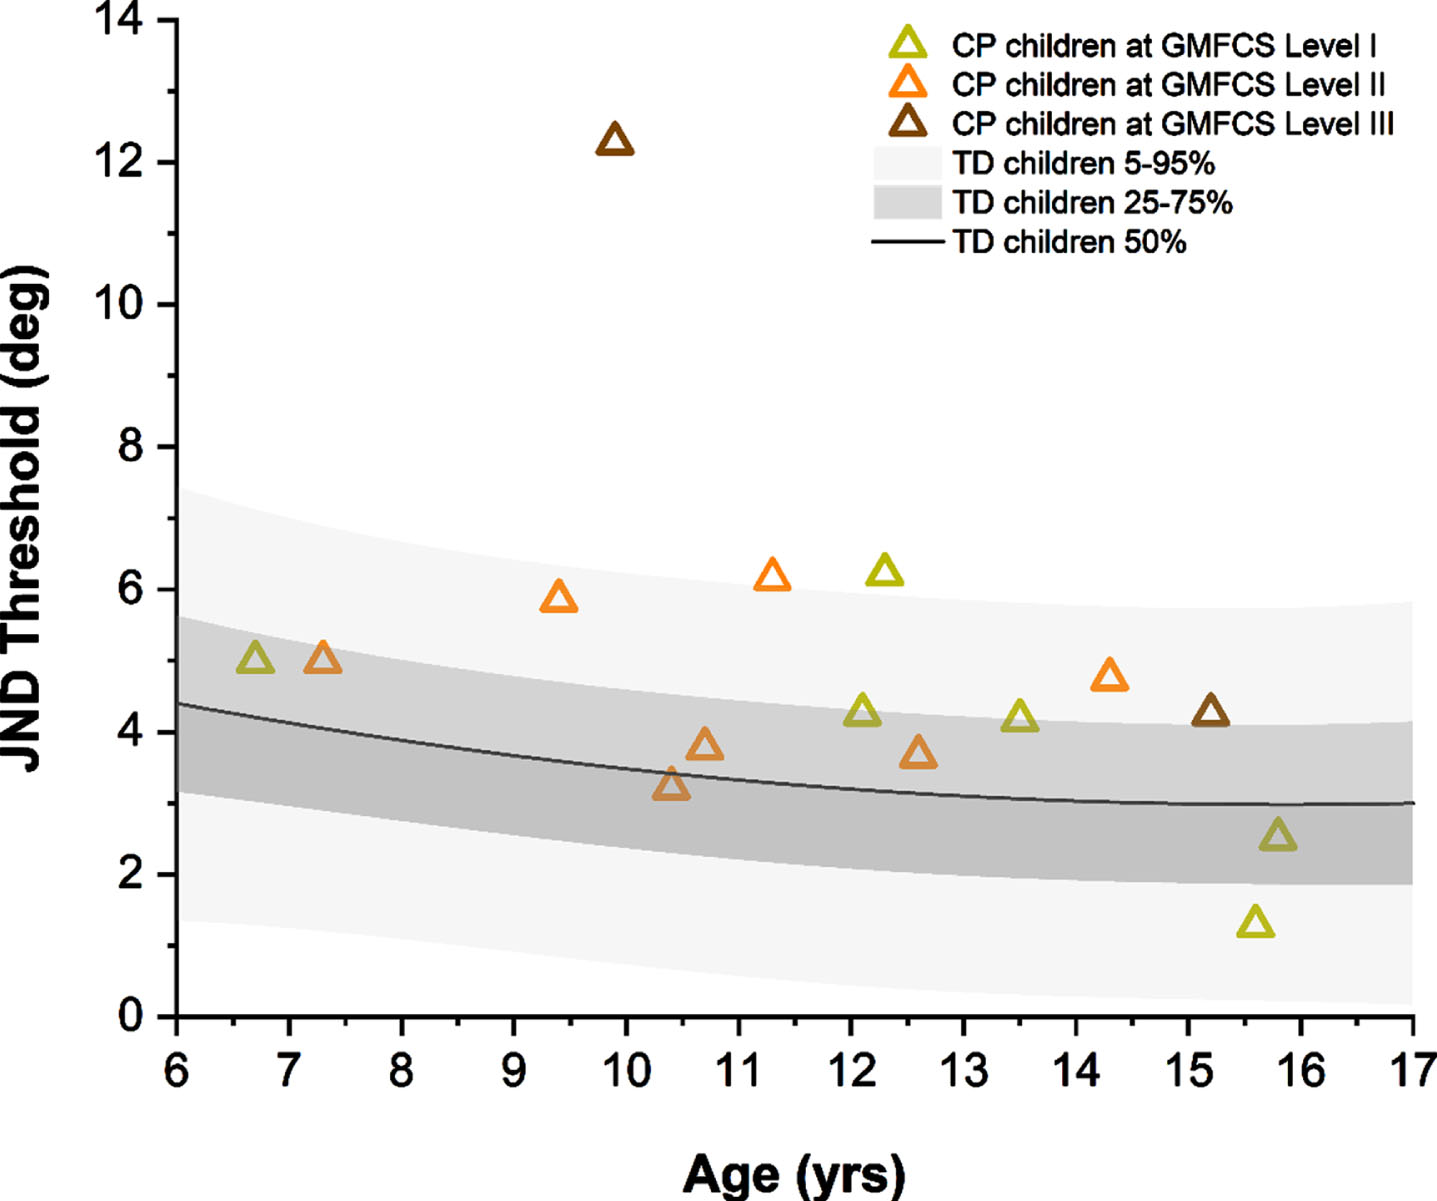
Fig. 3
Bias of ankle position sense as measured by the just noticeable difference (JND) threshold. The lower and upper limit of each box represents the 25th and 75th percentile, the whiskers the 5th and 95th percentile. Circle symbols represent individual participants, with filled circles representing participants that fell outside 1.5×the interquartile range of their respective group. ** indicates statistically significant between-group differences. TD: typically developing; CP: cerebral palsy.
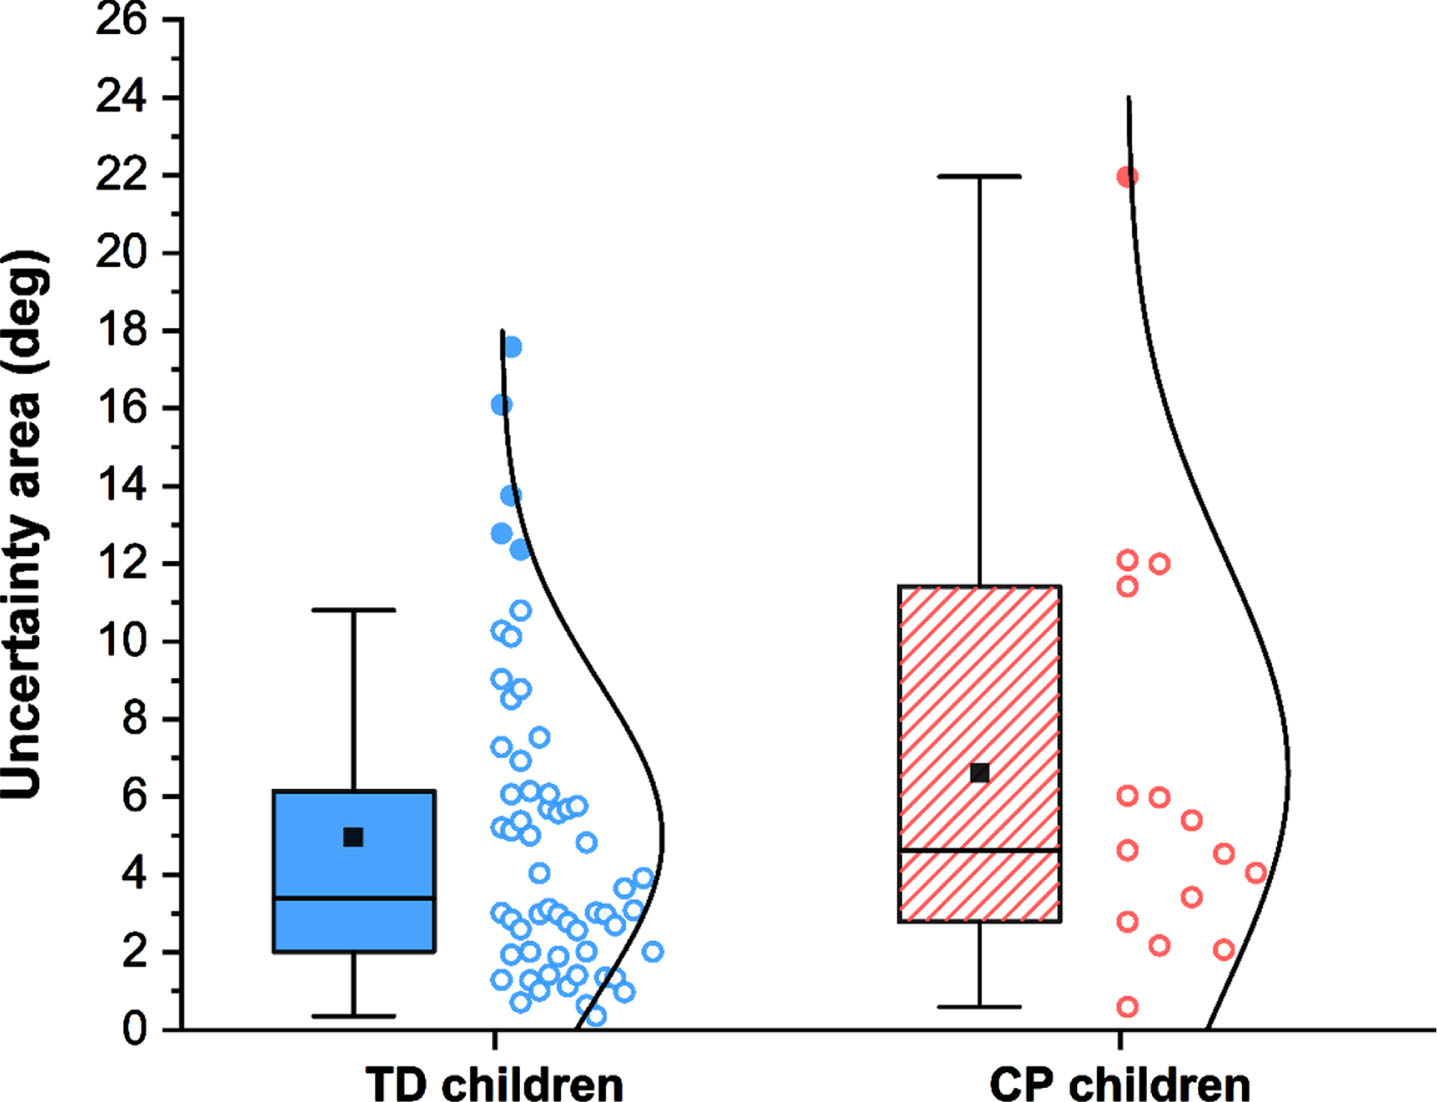
The UA (precision or random error) of ankle position sense acuity was unaltered in these children with CP with respect to TD children (Fig. 4). The median UA was 4.6° (range: 0.6 –22°) in the group with CP and 3.4° (range: 0.4 –17.6°; W = 353, p = 0.27) in the TD group.
Fig. 4
Precision of ankle position sense as measured by the uncertainty area. The lower and upper limit of each box represents the 25th and 75th percentile, the whiskers the 5th and 95th percentile. Circle symbols represent individual participants, with filled circles representing participants that fell outside 1.5×the interquartile range of their respective group. TD: typically developing; CP: cerebral palsy.
4Discussion
The goal of this study was to objectively quantify ankle position sense acuity (bias and precision) in a pediatric CP sample. The results supported the hypothesis that the CP group tended to have impaired ankle position sense. When considering these markers of proprioceptive function, it is important to note that both groups presented with higher thresholds than healthy young adults (2.4°) [17], indicating that ankle position sense acuity continues to develop until young adulthood [21].
The results suggested that impaired ankle position sense can be a clinical feature of children with CP in GMFCS levels I-III since 20% exhibited JND thresholds above the 95th percentile of TD children. This also means that approximately 80% of those with CP may present with ankle position sense JND thresholds within the range of TD children, although most of the CP group were distributed above the median. In fact, the median JND threshold of the CP group was 43% higher than the TD group. This study applied a paradigm in which the ankle was passively rotated to exclude any possible confounding due to impaired motor function in CP. The between-group differences aligned with results reported by Zarkou et al., who used an active plantarflexion joint position matching task [14]. Both studies included individuals in GMFCS level I-III. Currently, there are no data to indicate that the degree of proprioceptive dysfunction observed in ambulatory individuals with CP is correlated with symptom severity as determined by GMFCS level. However, it is known that the initial brain injury experienced by children with CP may damage ascending somatosensory tracts and their projections in addition to the descending motor pathways [22–24]. This finding provides a neurophysiological rationale for expecting proprioceptive deficits in CP, observed here as between-group differences.
There was no evidence that precision, the random error in making repeated judgements about ankle positions, was systematically affected in the group with CP. It is known from other studies of upper limb proprioception in TD children that proprioceptive bias already reaches adult levels in early childhood, but proprioceptive precision continues to improve until late adolescence [25]. In this study, the precision of ankle position sense in children with CP fell within the range of the age-matched TD cohort. If confirmed in a larger sample, this implies proprioceptive dysfunction in CP is characterized by a shift in proprioceptive bias, not random error. This contrasts with reports on children with developmental coordination disorders. As a group, those children do not exhibit elevated upper extremity JND thresholds but have higher values of random error when making judgements about wrist and elbow positions [26].
Implementing clinical evaluations of proprioceptive function and expanding research in this area will help to establish the prevalence and magnitude of proprioceptive deficits in CP and to relate such somatosensory impairment to the observable motor problems. Having access to this knowledge has implications for prognosis and rehabilitation. Someone with widespread proprioceptive impairments may have a poorer gross motor prognosis than someone with intact proprioceptive function but profound weakness, which is more amenable to resistance training. However, there is evidence that proprioception or somatosensory training can improve proprioceptive and motor function in other populations, as well as the upper extremity in CP [27, 28]. Future studies should explore if that effect is replicated in the lower extremity of the CP population.
Intact proprioception is essential for motor control and learning. Proprioceptive impairment at the ankle is known to have profound impact on balance and gait control. Empirically, lower limb proprioceptive dysfunction is associated with increased number of falls in people with a variety of neurological conditions, such as stroke or Parkinson’s disease [29–31]. Anecdotally, individuals with CP (or parent-proxy) sometimes report challenges with spatial awareness, which they attribute to their increased fall frequency. More studies are needed in CP to elucidate the possible causal contributions of proprioceptive impairment on motor learning and balance outcomes in CP.
4.1Study limitations
There were several limitations to this study that need to be considered. First, this proof-of-concept study, which focused on high functioning children at GMFCS levels I-III, only examined a relatively small group of children with CP. Currently, there is limited or no data on children in GMFCS levels IV-V. Yet, it would be imperative to obtain such data to discern how proprioceptive dysfunction involving the ankle contributes to deficits in gross motor ability. Second, like all psychophysical testing procedures, the method applied here required that the examinee had the cognitive ability to comprehend the task and stay focused and attentive during testing. This limited the applicability of the test to school-age children and to the approximately half of the CP population without an intellectual disability [32]. Variability of maintaining attention, especially in younger children, was evident in this study. Only 29% (2/7) of the children with CP younger than nine years old successfully completed the testing, compared to 62% (13/21) of those 9-15 years old. Other researchers who have performed sensory testing with children also noted that younger children are less likely to be able to fully participate and yield valid data [7]. To ensure that psychophysical testing of children with CP yields meaningful data, researcher need to create a test environment that allows for breaks and keeps the children engaged throughout testing. Third, the dominant ankle in the TD group was compared to the more involved/non-dominant ankle in the CP group. This approach was chosen since no significant differences between dominant and non-dominant ankle proprioception have been reported in TD individuals [33] and because the more-involved side has the most impairment in CP. Future studies should explore the differences between sides of asymmetrically involved individuals and the impact on gross motor function. Fourth, siblings were allowed to participate, so the TD group may not all be independent observations. Finally, high lapse rates can spuriously increase JND thresholds [19, 34, 35]. While the participants’ lapse rates in this study were not objectively measured, it was assumed that they ranged from 0-30% as others have observed [34, 35]. If true lapse rate (denoted as lambda in the psychophysical function) was greater than the estimated lambda from the adaptive psi-marginal algorithm (restricted to≤10%), JND thresholds presented here would be overestimated, indicating poorer acuity than their true ability [19]. However, there is a practical trade-off between more precise estimates of JND threshold and UA by collecting more trials and increased likelihood of attentional lapses with longer testing.
5Conclusions
This study provides initial evidence that higher functioning children with CP can present with impaired ankle position sense acuity, but such proprioceptive impairment may not be widespread. The outcome measures herein most closely represent “pure” proprioceptive function as it does not rely on active movement, which would make it difficult to distinguish between sensory and motor impairment in CP. This research begins to address the knowledge gap around prevalence and severity of lower extremity proprioceptive impairment in individuals with CP. It outlines a more systematic approach to investigate how proprioceptive impairment affects balance control, whether it is associated with higher fall frequency, and how it impacts the motor learning ability of these children.
Conflict interest
The authors have no conflicts of interest to report.
Ethical considerations
These studies (STUDY00009461 and STUDY00003446) were approved by the University of Minnesota Institutional Review Board on May 15th, 2020, and May 3rd, 2019, respectively. Informed consent was obtained for all participants in both studies.
Acknowledgments
The authors extend their gratitude to all participants for volunteering for this study and Dr. Jessica Holst-Wolf for help with data collection and training. This work was supported by the Endowed Fund for Research in Cerebral Palsy Treatment and Gait and Motion Outcomes Fund of Gillette Children’s and research funds by JK. The device for assessing ankle proprioception was designed by the Human Sensorimotor Control Laboratory of the University of Minnesota.
References
[1] | Han J , Waddington G , Adams R , Anson J , Liu Y . Assessing proprioception: A critical review of methods, J Sport Heal Sci (2016) ;5: (1):80–80-90. doi: 10.1016/j.jshs.2014.10.004 |
[2] | Boyer ER , Patterson A Gait pathology subtypes are not associated with self-reported fall frequency in children with cerebral palsy, Gait Posture (2018) ;63: :189–94. doi: 10.1016/j.gaitpost.2018.05.004 |
[3] | Yardímcí-Lokmanoglu BN , Bingöl H , Mutlu A . Theforgotten sixth sense in cerebral palsy: do we have enough evidencefor proprioceptive treatment? Disabil Rehabil (2020) ;42: (25):3581–3590. doi: 10.1080/09638288.2019.1608321 |
[4] | Damiano DL , Wingert JR , Stanley CJ , Curatalo L . Contribution of hip joint proprioception to static and dynamic balance in cerebral palsy: A case control study, J Neuroeng Rehabil (2013) ;10: (1):57. doi: 10.1186/1743-0003-10-57 |
[5] | Zarkou A , Lee SCK , Prosser LA , Jeka JJ . Foot and Ankle Somatosensory Deficits Affect Balance and Motor Function in Children With Cerebral Palsy, Front Hum Neurosci. (2020) ;14: :45. doi: 10.3389/fnhum.2020.00045 |
[6] | Nageeb Abdin MM , Abdelazeim F , Elshennawy S . Immediate effect of induced fatigue of the unaffected limb on standing balance, proprioception and vestibular symptoms in children with hemiplegia, J Pediatr Rehabil Med (2020) ;13: (2):119–125. doi: 10.3233/PRM-180587 |
[7] | McLaughlin JF , Felix SD , Nowbar S , Ferrel A , Bjornson K , Hays RM . Lower extremity sensory function in children with cerebral palsy, Pediatr Rehabil (2005) ;8: (1):45–52. doi: 10.1080/13638490400011181 |
[8] | Ko M-S , Sim YJ , Kim DH , Jeon H-S . Effects of three weeks of whole-body vibration training on joint-position sense, balance, and gait in children with cerebral palsy: A randomized controlled study, Physiother Can (2016) ;68: (2):99–105. doi: 10.3138/ptc.2014-77 |
[9] | Kenney WE . Certain sensory defects in cerebral palsy, Clin Orthop Relat Res (1963) ;27: :193–5. |
[10] | Uzun Akkaya K , Elbasan B . An investigation of the effect of the lower extremity sensation on gait in children with cerebral palsy, Gait Posture (2021) ;85: :25–30. doi: 10.1016/j.gaitpost.2020.12.026 |
[11] | Elnaggar RK . An analytical insight into how walking speed and spatial- and temporal-symmetry are related to ankle dysfunctions in children with hemiplegic cerebral palsy, Am J Phys Med Rehabil (2021) ;100: (5):458–464. doi: 10.1097/phm.0000000000001576 |
[12] | Hoon AH , Stashinko EE , Nagae LM , et al. Sensory and motor deficits in children with cerebral palsy born preterm correlate with diffusion tensor imaging abnormalities in thalamocortical pathways, Dev Med Child Neurol (2009) ;51: (9):697–704. doi: 10.1111/j.1469-8749.2009.03306.x |
[13] | Chen BP-J , Manikowska F , Jóźwiak M , Lebiedowska MK . Thesagittal plane knee proprioception in ambulatory individuals withcerebral palsy: a single-center pilot study in Poland, IssuesRehabil Orthop Neurophysiol Sport Promot (2020) ;30: :7–12. doi: 10.19271/IRONS-000108-2020-30 |
[14] | Zarkou A , Lee SCK , Prosser L , Hwang S , Franklin C , Jeka J . Foot and ankle somatosensory deficits in children with cerebral palsy: A pilot study, J Pediatr Rehabil Med (2021) ;14: (2):247–255. doi: 10.3233/PRM-190643 |
[15] | Elangovan N , Herrmann A , Konczak J . Assessing Proprioceptive Function: Evaluating Joint Position Matching Methods Against Psychophysical Thresholds, Phys Ther (2014) ;94: (4):553–61. doi: 10.2522/ptj.20130103 |
[16] | van Melick N , Meddeler BM , Hoogeboom TJ , Nijhuis-van der Sanden MWG , van Cingel REH . How to determine leg dominance: The agreement between self-reported and observed performance in healthy adults, PLoS One. (2017) ;12: (12):e0189876. doi: 10.1371/journal.pone.0189876 |
[17] | Mahnan A , Holst-Wolf J , Konczak J A new system to objectively measure ankle proprioception. Frontiers in Biomedical Devices. 2020;2020 Design of Medical Devices Conference:V001T10A017. doi:10.1115/DMD2020-9094 |
[18] | Prins N . The psi-marginal adaptive method: How to give nuisance parameters the attention they deserve (no more, no less), J Vis (2013) ;13: (7):3. doi: 10.1167/13.7.3 |
[19] | Wichmann FA , Hill NJ . The psychometric function: I, Fitting, sampling, and goodness of fit. Percept Psychophys. (2001) ;63: (8):1293–313. doi: 10.3758/BF03194544 |
[20] | Konczak J , Aman JE , Chen Y-W , Li K , Watson PJ Impaired limb proprioception in adults with spasmodic dysphonia, J Voice (2015) ;29: (6):777.e17–23. doi: 10.1016/j.jvoice.2014.12.010 |
[21] | Yang N , Waddington G , Adams R , Han J . Age-related changes in proprioception of the ankle complex across the lifespan, J Sport Health Sci (2019) ;8: (6):548–554. doi: 10.1016/j.jshs.2019.06.003 |
[22] | Scheck SM , Boyd RN , Rose SE . New insights into the pathology of white matter tracts in cerebral palsy from diffusion magnetic resonance imaging: A systematic review, Dev Med Child Neurol (2012) ;54: (8):684–96. doi: 10.1111/j.1469-8749.2012.04332.x |
[23] | Mailleux L , Franki I , Emsell L , et al. The relationship between neuroimaging and motor outcome in children with cerebral palsy: A systematic review –Part B Diffusion imaging and tractography, Res Dev Disabil (2020) ;97: :1035–69. doi: 10.1016/j.ridd.2019.103569 |
[24] | Tsao H , Pannek K , Boyd RN , Rose SE . Changes in the integrity of thalamocortical connections are associated with sensorimotor deficits in children with congenital hemiplegia, Brain Struct Funct (2015) ;220: (1):307–18. doi: 10.1007/s00429-013-0656-x |
[25] | Holst-Wolf JM , Yeh I-L , Konczak J . Development of proprioceptive acuity in typically developing children: Normative data on forearm position sense, Front Hum Neurosci (2016) ;10: :436. doi: 10.3389/fnhum.2016.00436 |
[26] | Tseng Y-T , Tsai C-L , Chen F-C , Konczak J . Position Sense Dysfunction Affects Proximal and Distal Arm Joints in Children with Developmental Coordination Disorder, J Mot Behav (2019) ;51: (1):49–58. doi: 10.1080/00222895.2017.1415200 |
[27] | Aman JE , Elangovan N , Yeh I-L , Konczak J . The effectiveness of proprioceptive training for improving motor function: A systematic review, Front Hum Neurosci (2015) ;8: :1075. doi: 10.3389/fnhum.2014.01075 |
[28] | Barati AA , Rajabi R , Shahrbanian S , Sedighi M . Investigation of the effect of sensorimotor exercises on proprioceptive perceptions among children with spastic hemiplegic cerebral palsy, J Hand Ther (2020) ;33: (3):411–417. doi: 10.1016/j.jht.2019.12.003 |
[29] | Gorst T , Freeman J , Yarrow K , Marsden J Assessing lower limb position sense in stroke using the gradient discrimination test (GradDTTM) and step-height discrimination test (StepDTTM): a reliability and validity study, Disabil Rehabil (2020) ;42: (15):2215–2223. doi: 10.1080/09638288.2018.1554008 |
[30] | Gorst T , Marsden J , Freeman J . Lower Limb Somatosensory Discrimination Is Impaired in People With Parkinson’s Disease: Novel Assessment and Associations With Balance, Gait, and Falls, Mov Disord Clin Pract (2019) ;6: (7):593–600. doi: 10.1002/mdc3.12831 |
[31] | Richardson JK , Demott T , Allet L , Kim H , Ashton-Miller JA . The hip strength:ankle proprioceptive threshold ratio predicts falls and injury in diabetic neuropathy, Muscle Nerve (2014) ;50: (3):437–42. doi: 10.1002/mus.24134 |
[32] | Novak I . Evidence-based diagnosis, health care, and rehabilitation for children with cerebral palsy, J Child Neurol (2014) ;29: (8):1141–56. doi: 10.1177/0883073814535503 |
[33] | Aydin T , Yildiz Y , Yildiz C , Atesalp S , Kalyon TA . Proprioception of the ankle: A comparison between female teenaged gymnasts and controls, Foot Ankle Int (2002) ;23: (2):123–9. doi: 10.1177/107110070202300208 |
[34] | Farahbakhsh M , Dekker TM , Jones PR . Psychophysics with children: Evaluating the use of maximum likelihood estimators in children aged 4-15 years (QUEST+), J Vis (2019) ;19: (6):22. doi: 10.1167/19.6.22 |
[35] | Manning C , Jones PR , Dekker TM , Pellicano E . Psychophysics with children: Investigating the effects of attentional lapses on threshold estimates, Atten Percept Psychophys (2018) ;80: (5):1324. doi: 10.3758/s13414-018-1510-2 |


