
Site, frequency, and duration of pain in young children with spina bifida
Abstract
PURPOSE:
To investigate the: (1) percent of children with spina bifida (SB) complaining of pain, (2) frequency, duration, and cause of pain by sex, level of lesion type of SB, and ambulation status, (3) body sites reported to hurt, by variables in objective 2, and (4) associations between physical and mental/emotional health between caregiver and child.
METHODS:
Cross-sectional study of 101 caregivers of children (3 to 6 years old) with SB. Survey data and information from medical records were included. Pearson chi-square, one-way ANOVA, Fisher’s exact test, logistic regressions, and bivariate correlations were used.
RESULTS:
Seventy percent reported that their child complained of pain, which did not significantly differ by sex, level of lesion, type of SB, or ambulation status. Most (86%) were reported to have experienced pain for less than 24 hours. The most frequently reported pain site was the head, followed by the abdomen and the lower body. Number of pain sites was moderately correlated with frequency of pain complaints. Correlations between how caregivers reported their own physical/mental/emotional health and how they rated that of their children ranged from weak (r = 0.22) to moderate (r = 0.55).
CONCLUSION:
Almost seven of ten children reportedly complained of pain ranging from at least once a month to everyday. Pain needs to be routinely assessed and treated in this population.
1Background
Spina bifida (SB) is a neural tube defect (NTD) manifesting as a complex condition associated with urological, neurological, and musculoskeletal complications [1]. The estimated prevalence in the United States is 2–3 per 10,000 live births [2, 3]. SB encompasses a variety of open/closed spinal NTDs, including myelomeningocele (MMC), myeloschisis, hemimyelomeningocele, meningocele, and lipomatous malformations [4]. MMC is the most frequent and the most involved type [5]. Comorbidities and secondary conditions are frequently associated with SB and can have a substantial negative effect on quality of life (QoL) and participation in school, work life, and recreational activities [6–8]. Whereas comorbidities occur irrespective of the underlying condition, secondary conditions are direct yet preventable consequences of the main condition [6]. Hydrocephalus has been reported in 80–85%of individuals with MMC [9], with many experiencing urinary/fecal incontinence. Gross motor function and body composition are often affected [10–12].
Individuals with SB are exposed to many risk factors for pain [13], such as musculoskeletal deformities, clogged/infected shunts, urinary tract infections, bowel problems, compromised positioning, pressure injuries, and surgeries/rehabilitation efforts [14–16]. The International Association for the Study of Pain defines pain as an unpleasant sensory and emotional experience associated with actual/potential tissue damage [17]. Although a crucial protective warning signal in the short term, pain can become intractable and negatively affect life [18, 19]. It is difficult to classify pain [20, 21] due to the many aspects involved, such as anatomy (body site), duration (chronic, intermittent, or acute), cause/type of pain (neuropathic or nociceptive), and neurophysiology/body system [20, 21]. Pain is subjective and no diagnostic tests can measure it accurately and objectively. Therefore, self-report is considered the gold standard. Pain is associated with a greater number of mental health disorders [22]. In a Norwegian study, musculoskeletal pain in adolescence was significantly associated with an increase in mental health disorders and mental healthcare use in young adulthood, in particular for mood disorders and anxiety [22]. There is a dearth of research on pain as a secondary condition in SB, as well as of pain in physical disabilities in general. In the case of SB, this maybe due to a misguided perception that because sensation might be compromised, the person cannot experience pain. However, pain has been frequently reported in adults with SB [23–27], although not consistently [28]. Also, it has been found in other complex congenital/early onset conditions that pain increases significantly with age [29]. However, it is not known if this is the case for SB. It is not known when/where pain occurs, and if it differs by sex, type of SB, or other SB-specific variables. This information is needed to allow proactive work on the prevention, management, and minimization of pain.
The purpose of this report was to assess the proxy-reported presence, frequency, duration, and body sites affected by pain in young children with SB, and how these differed by a number of non-modifiable factors. It was assessed if caregivers’ self-reported physical, mental and emotional health scores correlated with how they rated the health of their children. The following specific aims were investigated:
(1) overall frequency of pain complaints and duration of pain experienced,
(2) pain complaints, pain duration, and cause of pain by the child’s sex, level of lesion, type of SB, and ambulation status,
(3) body sites where it hurt, and how many body sites were reported to hurt, by the child’s sex, level of lesion, type of SB, ambulation status, and comorbidity, and
(4) association between physical and mental/emotional health in the past month, in both caregiver and child.
2Methods
2.1Procedure and participants
This study was part of a multi-site study on development, health, and condition progression described elsewhere [30]. The data on pain were part of the larger study. Legal caregivers of children who were 3 years to 6 years and 11 months old, who have SB (International Statistical Classification of Diseases 9 codes of 741.0, SB with hydrocephalus and 741.9, SB without hydrocephalus), and were born between September 1, 2004, and August 31, 2009 were included, provided that caregivers were≥18 years old and English/Spanish-speaking. Eligible participants had to reside in one of the two catchment areas in Arizona and Utah. In Utah, children with SB were identified using population-based statewide surveillance data from the Utah Birth Defect Network. Parents of eligible children with SB who were attending the SB clinic during the study period were also invited to participate. Occasionally, eligible children with SB and their parents traveling from Idaho, Wyoming, and Nevada who were to attend the SB clinic in Salt Lake City were also invited to participate. In Arizona, eligible children with SB were identified through the birth defects monitoring program, hospital discharge databases, SB multispecialty clinics, and the primary children’s hospitals in Tucson and Phoenix to gather the eligible population, including health and demographic characteristics of the children. Three non-randomized options of participation were available: (1) in-person clinic visit that included neuropsychological testing of the child, caregiver surveys, and an administered survey (full protocol); (2) phone-administered survey (administered survey) and a mailed questionnaire (without neuropsychological testing; partial protocol 1); or (3) mailed questionnaire (without neuropsychological testing or administered caregiver survey; partial protocol 2). For Spanish-speaking participants, the consent, parental permission, and medical records release forms, parent interview, and parent surveys, which had been translated by translation services at Centers for Disease Control and Prevention, were conducted in Spanish. In Utah, a translator was available to assist for appointments with Spanish speakers. In Arizona, all appointments were conducted by bilingual professionals. In total, 152 individuals with SB were eligible, and 101 caregivers took part. Gift cards were given to caregivers who participated. Institutional review board (IRB) approvals were obtained at both sites.
Data were obtained from the administered study survey and medical records. Demographic information, level of lesion, type of SB, and comorbidities/conditions secondary to SB were extracted from the medical records.
2.2Measures
2.2.1Demographics
Demographic variables included the child’s race/ethnicity, primary language spoken at home, marital status of caregiver, mother’s highest level of education, and type of insurance.
2.2.2Medical conditions
Level of lesion was reported using four categories (sacrum, lumbar-sacral, lumbar, and thoracic) and recoded based on the highest level, such that lumbar-sacral was recoded into lumbar. Individuals were categorized into having either MMC, meningocele, or lipomeningocele, and recoded into MMC/other SB. Additional conditions included were categorized as central nervous system (Chiari-II malformation, “other” central nervous system); musculoskeletal (spinal curvature/scoliosis, tethered cord, talipes equinovarus, joint deformities, “other musculoskeletal”), and dermatology (pressure injuries, “other dermatology”). Information on shunt/shunt revisions was also included.
2.2.3Ambulation status
Ambulation status was computed based on the Hoffer scale, which consists of five ordinal levels defined as complete ambulator, community ambulator (walks indoors/outdoors, may need crutches/braces, wheelchair only for longer distances, household ambulator (walks only indoors with apparatus, wheelchair for some indoor activities and for all activities in the community), non-functional ambulator (uses wheelchair, walks for training/rehabilitation only), and non-ambulator (uses wheelchair but can usually transfer to and from bed) [31]. Three survey items were used to classify ambulation status (below).
(1) Is “X” able to walk even if it is just for a few steps?” (No, full time in wheelchair/Yes/ Don’t know/Refused),
(2) Does “X” use mobility aids like crutches or braces or assistance from another person to walk for more than a few steps? (No (completely independent)/Yes/Don’t know/Refused), and
(3) When does “X” need to use a wheelchair? (Only for long distances or extended time outside/For all outdoor and community activities including school/For most indoor and outdoor activities (only walks at home or in clinic)/ Never/Other (specify)/Don’t know/Refused).
Individuals were categorized as ambulatory if they indicated “Yes” to item 1. Complete ambulators were those who indicated “Yes” to item 1 and “No, completely independent” to item 2. Community ambulators were those who said “Yes” to item 1, “Yes” to item 2, and “Only for long distances or extended time outside” or “Never” to item 3. Household ambulators were those who indicated “For all outdoor and community activities including school” for item 3. Non-functional ambulators were those who responded, “For most indoor and outdoor activities” to item 3. When a respondent indicated “Other” to item 3, it was not possible to determine ambulation status.
2.2.4Pain
Because of the young ages of the children and of time constraints, the caregivers reported on their children’s pain. Data on pain complaints, duration, body site, and potential cause of pain were used to measure pain. Caregivers reported the frequency of complaints, “How often would you say X complains of pain?” (1 = never, 2 = once a month or less, 3 = more than once a month but less than once a week, 4 = once a week, 5 = more than once a week, 6 = everyday). If the child was reported to complain of pain, the caregivers were asked about the duration of the pain. Duration was measured by the length of time the child experienced pain, “How long has X experienced the pain? Would you say. . . ” (1 = not experiencing pain, 2 = less than once a month, 3 = between 1 and 3 months, 4 = more than 3 months to 1 year, 5 = more than a year). Pain duration was also measured dichotomously, “During the past month, has X had a problem with pain that lasted more than 24 hours?” (Yes/No). Pain site was measured based on the location of the pain on the body, “Regarding X’s pain, which regions are generally affected?” Finally, potential cause of pain was assessed by one item, “In general, when X complains of pain has the pain been caused by a specific injury (e.g., because of a fall)” (Yes/No).
2.2.5Perceived health (physical, mental, emotional)
Both the caregiver’s and the child’s physical, mental, and emotional health were assessed based on caregiver report using Likert-type scales, “How would you rate [X’s/your own] physical health in the past month?”, “How would you rate [X’s/your own] mental and emotional health in the past month” (1 = Poor, 2 = Fair, 3 = Good, 4 = Very Good, 5 = Excellent).
2.3Statistical analysis
Descriptive statistics were presented as raw numbers and percentages (Aim 1). Differences in pain frequency, pain duration (length), and cause of pain (injury or not) were compared by sex, level of lesion, type of SB, and ambulation status (Aim 2). A Pearson chi-square test (two-sided) was used to compare the presence of pain (pain/no pain) by sex. One-way ANOVAs were used to test mean differences in pain frequency and pain duration by level of lesion (sacral/lumbar/ thoracic) and type of SB (MMC/other SB). Pain duration (length) was recoded into three groups to indicate chronicity of pain; no pain, pain for less than three months, pain for three months or longer, and were reported as raw numbers and percentages. Four univariate binary logistic regressions were conducted to assess the likelihood that pain complaints, when they occur, are due to a specific injury or not, as predicted by sex, level of lesion, type of SB, and ambulation status. Reference groups were coded as 1 and were male, MMC, lumbar level of lesion, and completely ambulatory.
The pain sites were presented as raw numbers and percentages by sex, level of lesion, type of SB, ambulation status, and presence of comorbidities (central nervous system/musculoskeletal/ dermatology) (Aim 3). Group differences on number of pain sites by sex, SB type, level of lesion, and ambulation status were assessed using t-tests and ANOVAs. Pairwise correlations were calculated between child and the caregivers’ self-reported physical, and mental and emotional health in the past month (Aim 4).
The data were non-normally distributed for pain frequency and duration but the t-test is generally robust against violation of normality assumption. However, non-parametric tests (Mann-Whitney as alternative to t-test and Kruskal-Wallis as alternative to ANOVA), resulted in the same findings. For all tests, statistical significance was set at the alpha.05 level and initial analyses were run in SPSS [32] and replicated in SAS Version 9.4 [33].
3Results
One-hundred and one caretakers participated, 73 from Utah and 28 from Arizona. Ninety-two (91%) caretakers were biological parents, five (5%) were adoptive parents, and one (1%) was a legal guardian. Ninety-one (90%) of the caretakers were female, seven (7%) were male, and three (3%) had missing gender information. Sixty-three (62%) of the children were boys. Other data on sociodemographic status and medical/mobility status are presented in Tables 1 and 2 respectively.
Table 1
Site-specific sociodemographic characteristics of caregivers and of children with spina bifida who are in early childhood
| Utah n = 73 (%) | Arizona n = 28 (%) | Total n = 101 (%) | |
| Child’s race and ethnicity | |||
| White/Non-Hispanic | 60 (82) | 8 (29) | 68 (67) |
| Hispanic | 10 (14) | 18 (64) | 28 (28) |
| Asian/Pacific Islander | 3 (4) | 1 (4) | 4 (4) |
| Other | – | 1 (4) | 1 (1) |
| Primary language spoken at home | |||
| English | 63 (86) | 13 (46) | 75 (74) |
| Mostly English | 3 (4) | 2 (7) | 5 (5) |
| English and another language equally | 1 (1) | 7 (25) | 8 (8) |
| Mostly another language | 1 (1) | 5 (18) | 2 (2) |
| Another language only | 2 (3) | 1 (4) | 5 (5) |
| Missing | 3 (4) | – | 3 (3) |
| Caregiver current marital status | |||
| Married | 61 (84) | 9 (32) | 70 (69) |
| Unmarried | 7 (10) | 4 (14) | 11 (11) |
| Missing | 5 (7) | 15 (54) | 20 (20) |
| Mother’s highest level of education | |||
| < 12 years (no diploma) | 5 (7) | 1 (4) | 6 (6) |
| 12 years (diploma or GED) | 16 (22) | 1 (4) | 17 (17) |
| 13–15 years (some college/associates) | 22 (30) | 1 (4) | 23 (23) |
| 16 + years (college graduate/above) | 21 (29) | 1 (4) | 22 (22) |
| Missing | 9 (12) | 24 (86) | 33 (33) |
| Primary Insurance | |||
| Private insurance | 14 (19) | 2 (7) | 16 (16) |
| Medicaid/federal | 14 (19) | 14 (50) | 28 (28) |
| Self-pay | – | 1 (4) | 1 (0) |
| Missing | 45 (62) | 11 (39) | 56 (55) |
Note. Percentages may not add up to 100%because of rounding. Unavailable or unknown data were counted as missing. The data source was a survey of caregivers.
Table 2
Main clinical characteristics and mobility status of children with spina bifida who are in early childhood, by sex
| Boys n = 63 (%) | Girls n = 38 (%) | Total n = 101 (%) | |
| Level of lesion | |||
| Sacral | 2 (3) | 4 (11) | 6 (6) |
| Lumbar | 54 (86) | 31 (82) | 85 (84) |
| Thoracic | 4 (6) | 3 (8) | 7 (7) |
| Missing | 3 (5) | – | 3 (3) |
| Type of spina bifida | |||
| Myelomeningocele | 51 (81) | 33 (87) | 84 (83) |
| Lipomyelomeningocele | 7 (11) | 5 (13) | 12 (12) |
| Meningocele | 5 (8) | - | 5 (5) |
| Ambulation* | |||
| Complete | 18 (29) | 12 (32) | 30 (30) |
| Community | 20 (32) | 10 (26) | 30 (30) |
| Household | 6 (10) | 2 (5) | 8 (8) |
| Non-functional | 4 (6) | 3 (8) | 7 (7) |
| Non-ambulator | 13 (21) | 8 (21) | 21 (21) |
| Unclassified | – | 1 (3) | 1 (1) |
| Missing | 2 (3) | 2 (5) | 4 (4) |
| Comorbidity** | |||
| Central nervous system | 50 (79) | 29 (76) | 79 (78) |
| Musculoskeletal | 46 (73) | 25 (66) | 71 (70) |
| Dermatology | 10 (16) | 2 (5) | 12 (12) |
| Shunt (respondent-reported) | |||
| Yes | 43 (68) | 25 (66) | 68 (67) |
| No | 18 (29) | 12 (32) | 30 (30) |
| Missing | 2 (3) | 1 (3) | 3 (3) |
| Shunt Revised*** | |||
| Yes | 20 (29) | 9 (13) | 29 (43) |
| No | 23 (34) | 16 (24) | 39 (57) |
| Diagnosed UTI† | |||
| Yes | 34 (54) | 28 (74) | 62 (61) |
| No | 27 (43) | 9 (24) | 36 (36) |
| Missing | 2 (3) | 1 (3) | 3 (3) |
Percentages may not add up to 100%because of rounding. *Based on Hoffer Scale. Please see methods for detailed information on how ambulation status was coded. **Comorbidities are not mutually exclusive. ***Count and percentages are based on the 68 children who were reported to have a shunt. UTI = urinary tract infection. The data source was medical records.
3.1Description of the frequency of pain complaints and duration (Aim 1)
3.1.1Pain complaints
In regard to frequency of pain (i.e., “How often. . . ”), 69 (70%) caretakers reported that their children complained of pain, and 28 (28%) indicated that their children never complained of pain, and one did not know (three responses missing). Of the 69 caretakers who reported that their child complained of pain, 32 (46%) stated that the child complained of pain once a month or less; 21 (30%) more than once a month but less than once a week; seven (10%) complained of pain once a week; six (9%) more than once a week, and three (4%) every day.
3.1.2Pain duration
For the 69 who reported pain, 12 (17%) said that the child was not experiencing pain, 18 (26%) said that their child had been experiencing pain for less than a month, 13 (17%) said between one and three months, five (7%) reported more than three months to a year, and 15 (22%) for more than one year (six respondents did not know).
Of 101 participants, 87 (86%) indicated that their child had experienced no pain that lasted more than 24 hours in the previous month, 10 (10%) reported yes, and one (1%) did not know (three (3%) missing responses). Of the 101 participants, 41 (41%) caregivers reported that the pain was due to a specific injury (e.g., because of a fall). Of the 10%whose pain had lasted more than 24 hours, only one had pain due to a specific injury.
3.2Pain by sex, level of lesion, type of SB, and ambulation status (Aim 2)
3.2.1Pain complaints
Frequency counts of pain complaints by sex, level of lesion, type of SB, ambulation status, and comorbidity are presented in Table 3. A t-test indicated that frequency of complaints of pain did not differ significantly between boys (M = 2.4, SD = 1.4) and girls (M = 2.4, SD = 1.2), t(95) = –0.043, p = 0.966. One-way ANOVA revealed that level of lesion was not significantly associated with pain complaint frequency with means of 2.83 (SD = 1.33) at the sacral level, 2.35 (SD = 1.36) at the lumbar level, and 2.00 (SD = 0.63) at the thoracic level, F(2, 91) = 0.61, p = 0.548. SB type (MMC versus other-SB) was not significantly associated with frequency of pain, MMC = 2.31 (SD = 1.26) and other-SB = 2.71 (SD = 1.53), t(95) = –1.13, p = 0.263. Finally, a one-way ANOVA did not support a difference in pain frequency by ambulation status, F(4,90) = 1.27, p = 0.288.
Table 3
Frequency of pain complaints in children with spina bifida in early childhood, by sex, level of lesion, type of spina bifida, ambulatory status, and comorbidity
| Frequency of Pain Complaints, n (%) | ||||||
| Never | Once a month or less | More than once a a month but less than once a week | Once a week | More than once a week | Everyday | |
| Sex (n) | ||||||
| Boys (63) | 20 (32) | 18 (29) | 12 (19) | 4 (6) | 5 (8) | 2 (3) |
| Girls (38) | 8 (21) | 14 (37) | 9 (24) | 3 (8) | 1 (3) | 1 (3) |
| Level of lesion (n) | ||||||
| Sacral (6) | – | 4 (67) | – | 1 (17) | 1 (17) | – |
| Lumbar (85) | 27 (32) | 23 (27) | 19 (22) | 5 (6) | 5 (6) | 3 (4) |
| Thoracic (7) | 1 (14) | 4 (57) | 1 (14) | – | – | – |
| Spina bifida type (n) | ||||||
| MMC (84) | 24 (29) | 27 (32) | 17 (20) | 6 (7) | 4 (5) | 2 (2) |
| Non-MMC† (17) | 4 (24) | 5 (29) | 4 (24) | 1 (6) | 2 (12) | 1 (6) |
| Ambulation†† (n) | ||||||
| Complete (30) | 8 (27) | 10 (33) | 8 (27) | 3 (10) | 1 (3) | – |
| Community (30) | 6 (20) | 10 (33) | 7 (23) | 3 (10) | 1 (3) | 2 (7) |
| Household (8) | 2 (25) | 3 (38) | 1 (13) | 1 (13) | 1 (13) | – |
| Non-functional (7) | 2 (29) | – | 4 (57) | – | 1 (14) | – |
| Non-ambulator (21) | 10 (48) | 9 (43) | – | – | 1 (5) | 1 (5) |
| Unclassified (1) | – | – | – | – | 1 | – |
| Comorbidity (n) | ||||||
| Central Nervous System (79) | 22 (28) | 27 (34) | 14 (18) | 6 (8) | 4 (5) | 3 (4) |
| Musculoskeletal (71) | 22 (31) | 21 (30) | 14 (20) | 6 (8) | 5 (7) | 1 (1) |
| Dermatology (pressure injuries) (12) | 5 (42) | 3 (25) | 1 (8) | – | 2 (17) | – |
Denominators for frequency of pain proportions are the total counts for each level of the independent variable, not row totals. Percentages may not add up to 100%because of rounding. †meningocele or lipomyelomeningocele, ††Based on Hoffer Scale. Please see methods for detailed information on how ambulation status was coded. Comorbidities are not mutually exclusive. The data sources were a survey of caregivers (pain frequency) and medical records (other data). Never = 1, Once a month or less = 2, More than once a month but less than once a week = 3, Once a week = 4, More than once a week = 5, Everyday = 6.
3.2.2Pain duration
Duration of pain was assessed for those children who complained of pain; that is, those who indicated experiencing pain with greater frequency than never (Table 4). A t-test on the duration of time pain was experienced did not differ between boys (M = 2.9, SD = 1.5) and girls (M = 2.9, SD = 1.4), t(61)=0.20, p = 0.846. One-way ANOVA results suggested that duration of pain also did not differ based on level of lesion (Msacrum = 3.3 (SD = 1.6), Mlumbar = 2.9 (SD = 1.4), Mthoracic = 1.5 (SD = 0.6), F(2,58) = 2.2, p = 0.120). A t-test did not support that there was a difference in pain duration between children who had MMC (M = 2.8, SD = 1.4) and other-SB (M = 3.4, SD = 1.6), t(61) = –1.40, p = 0.168. A one-way ANOVA indicated no support for differences in duration of pain among ambulation status groups (Mcomplete = 3.14 (SD = 1.53) Mcommunity = 2.36 (SD = 1.14), Mhousehold = 3.50 (SD = 1.29), Mnonhboxfunctional = 3.60 (SD = 0.89), Mnonhboxambulator = 2.70 (SD = 1.89), F(4,57) = 1.47, p = 0.224).
Table 4
Reported duration of pain in children with spina bifida in early childhood, by sex, level of lesion, type of spina bifida, ambulatory status, and comorbidity
| Pain Duration*, n (%) | |||
| No pain, n = 12 | Pain up to 3 months, n = 31 | Pain lasting longer than 3 months, n = 20 | |
| Sex (n) | |||
| Boys (41) | 7 (17) | 18 (44) | 12 (29) |
| Girls (28) | 5 (18) | 13 (46) | 8 (29) |
| Level of lesion (n) | |||
| Sacral (6) | 1 (17) | 2 (33) | 3 (50) |
| Lumbar (55) | 9 (16) | 26 (47) | 16 (29) |
| Thoracic (5) | 2 (40) | 2 (40) | – |
| Spina bifida type (n) | |||
| MMC (56) | 10 (18) | 26 (46) | 14 (25) |
| Non-MMC† (13) | 2 (15) | 5 (38) | 6 (46) |
| Ambulation†† (n) | |||
| Complete (22) | 2 (9) | 10 (45) | 9 (41) |
| Community (23) | 5 (22) | 15 (65) | 2 (9) |
| Household (6) | – | 2 (33) | 2 (33) |
| Non-functional (5) | – | 3 (60) | 2 (40) |
| Non-ambulator (11) | 5 (45) | 1 (9) | 4 (36) |
| Unclassified (1) | – | – | 1 (100) |
| Comorbidity (n) | |||
| Central Nervous System (54) | 9 (17) | 26 (48) | 15 (28) |
| Musculoskeletal (47) | 10 (21) | 21 (45) | 14 (30) |
| Dermatology (pressure injuries) (6) | – | 3 (50) | 2 (33) |
Denominators for pain duration proportions are the total number of individuals who responded more than never to frequency of pain complaints for each level of independent variable. Percentages may not add up to 100%because of rounding. *“How long has “X” experienced pain?”(Pain duration data includes only those responding more than never to frequency of pain complaints); †Non-myelomeningocele (Non-MMC) are meningocele or lipomyelomeningocele, ††Ambulation was based on Hoffer Scale. Comorbidities are not mutually exclusive. The data sources were a survey of caregivers (pain duration) and medical records (other data).
Because only 10 caregivers reported that their child’s pain lasted longer than 24 hours, there were not enough data to detect between-group effects of sex, level of lesion, SB type, and ambulation status.
3.2.3Cause of pain
All participants were included in analyses, unless their data were missing, for the likelihood that a pain complaint was due to an injury. Fifty-six (55%) caregivers reported that when their child complained of pain, it was not caused by a specific injury. Forty-one (41%) indicated that the pain was usually caused by a specific injury (4 did not know/had missing data). Null results from four univariate binary logistic regressions did not support a difference between boys and girls in the likelihood that a pain complaint was due to injury or not (odds ratio (OR) = 1.25, 95%confidence interval (CI):0.54–2.89, p = 0.605), indicated no support for different likelihood between those who have myelomeningocele and those who did not (OR = 1.27, 95%CI:0.44–3.6, p = 0.660), did not support a difference in likelihood between those with lumbar level of lesion and those who did not (OR = 0.71, 95%CI:0.21–2.4, p = 0.578), and showed no support for a difference in likelihood between those who had complete ambulation and those who did not (OR = 1.07, 95%CI:0.45–2.5, p = 0.887).
3.3Pain site, and number of painful body sites, by sex, level of lesion, type of SB, ambulation status, and comorbidity (Aim 3)
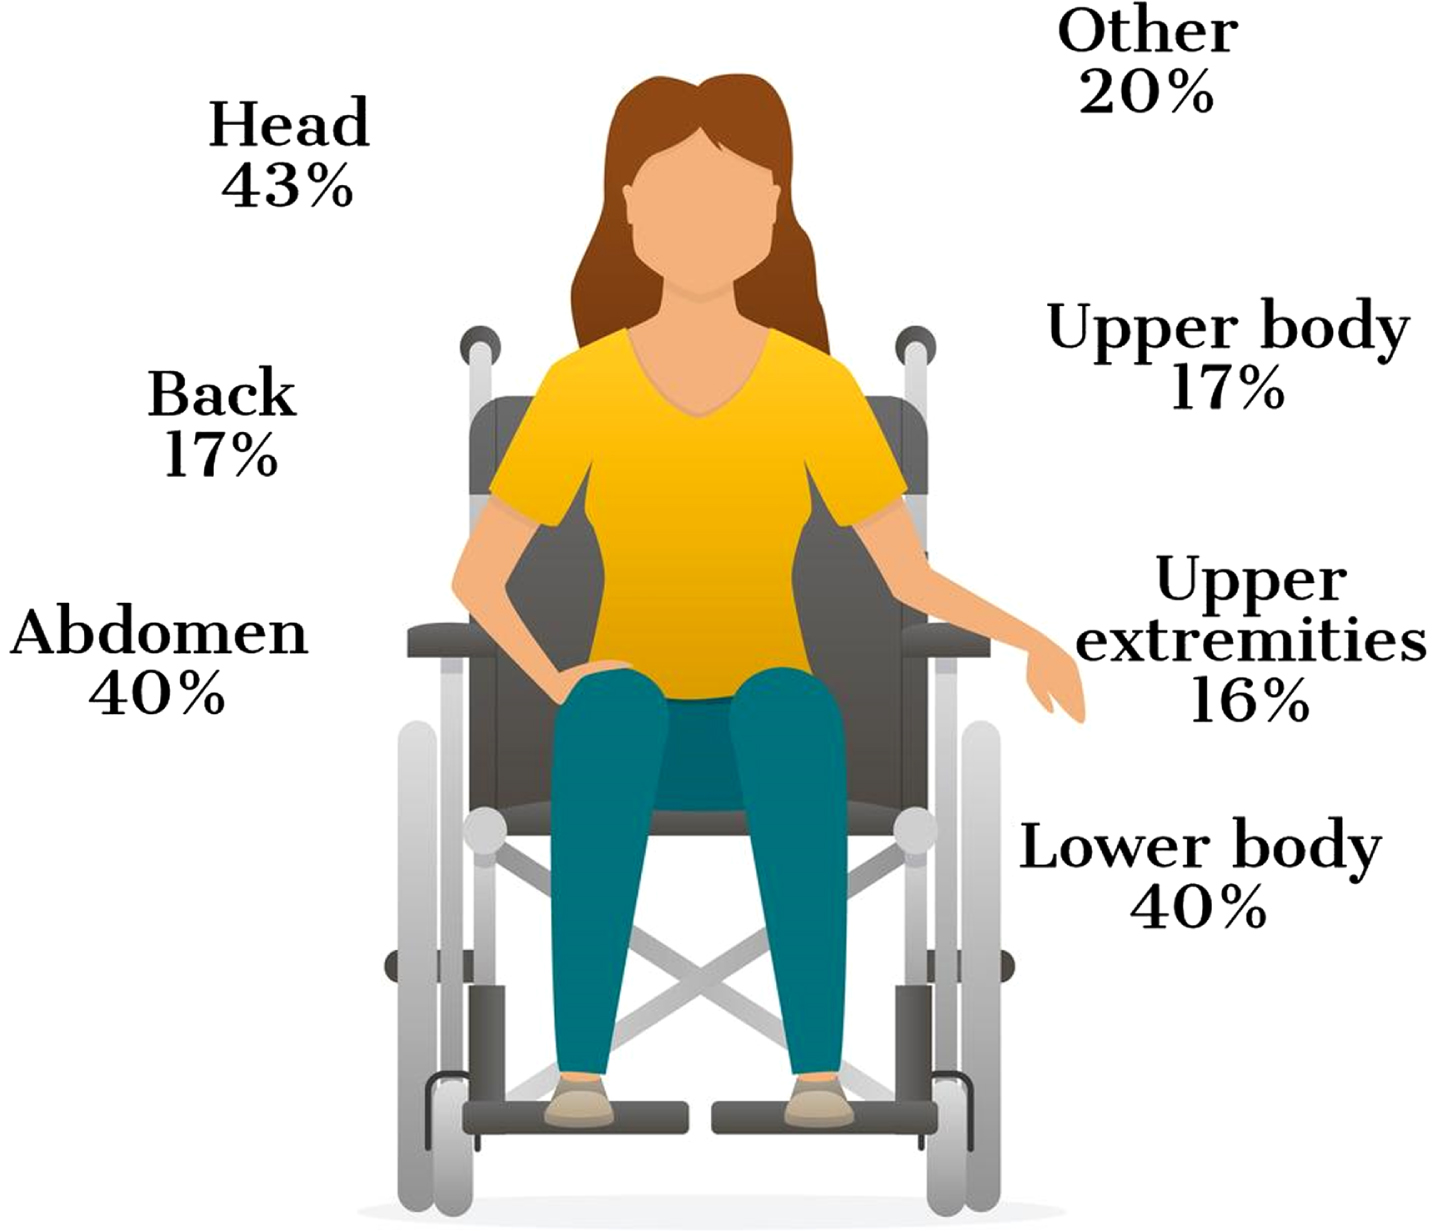
The head was the most commonly reported pain site, followed by the abdomen and the lower body. The number of pain sites ranged from zero to seven, with a median of two pain sites (Table 5). Painful body sites by sex, level of lesion, type of SB, ambulation status, and comorbidity are presented in Table 6 and the regions that were most reported are presented in Fig. 1. Pearson correlation coefficients indicated that the number of pain sites was positively correlated with more frequent complaints of pain, r(97) = 0.38, p < 0.001. As with the other pain outcomes, t-tests and ANOVAs did not support differences by sex (t(99) = –.22, p = 0.83), level of lesion (F(2, 95) = 2.66, p = 0.075), SB type (myelomeningocele versus non-myelomeningocele type, t(99) = –1.13, p = 0.260) or ambulation status (F(5,91)=0.77, p = 0.571) on number of pain sites.
Table 5
Reported number of pain sites in children with spina bifida in early childhood, by sex
| Boys 63 (%) | Girls 38 (%) | Total 101 (%) | |
| Pain sites | |||
| None | 13 (21) | 5 (13) | 18 (18) |
| One | 10 (16) | 11 (29) | 21 (21) |
| Two | 13 (21) | 7 (18) | 20 (20) |
| Three | 13 (21) | 5 (13) | 18 (18) |
| Four | 8 (13) | 5 (13) | 13 (13) |
| Five | 3 (5) | 3 (8) | 6 (6) |
| Six | 2 (3) | 1 (3) | 3 (3) |
| Seven | 1 (2) | 1 (3) | 2 (2) |
| Median, Mean (SD) | 2.0, 2.2 (1.7) | 2.0, 2.3 (1.8) | 2.0, 2.3 (1.8) |
Table 6
Distribution of pain sites according to sex, level of lesion, type of spina bifida, ambulatory status, and comorbidity in 3–6 year old children with spina bifida
| Median number of pain sites | Head n (%) | Abdomen n (%) | Lower body n (%) | Upper n (%) | Back (spine) n (%) | Upper extremities n (%) | Other n | |
| Sex (n) | ||||||||
| Boys (63) | 2 (7) | 24 (38) | 27 (43) | 28 (44) | 12 (19) | 6 (10) | 9 (14) | 13 (21) |
| Girls (38) | 2 (7) | 19 (50) | 13 (34) | 12 (32) | 5 (13) | 11 (29) | 7 (18) | 7 (18) |
| Level of lesion (n) | ||||||||
| Sacral (6) | 2.5 (5) | 3 (50) | 2 (33) | 3 (50) | 1 (17) | 2 (33) | 2 (33) | – |
| Lumbar (85) | 2 (7) | 38 (45) | 35 (41) | 34 (40) | 16 (19) | 14 (16) | 14 (16) | 17 (20) |
| Thoracic (7) | 1 (2) | 1 (14) | 1 (14) | 2 (29) | 1 (14) | 1 (14) | ||
| Spina bifida type (n) | ||||||||
| MMC (84) | 2 (7) | 40 (48) | 34 (40) | 29 (35) | 15 (18) | 15 (18) | 12 (14) | 17 (20) |
| Non-MMC (17) | 2 (7) | 3 (18) | 6 (35) | 10 (59) | 2 (12) | 2 (12) | 4 (24) | 3 (18) |
| Ambulatory status (n) | ||||||||
| Complete (30) | 2 (7) | 11 (37) | 9 (30) | 14 (47) | 4 (13) | 3 (10) | 4 (13) | 5 (17) |
| Community (30) | 2.5 (6) | 14 (47) | 14 (47) | 16 (53) | 4 (13) | 9 (30) | 6 (20) | 5 (17) |
| Household (8) | 2.5 (4) | 5 (63) | 5 (63) | 3 (38) | 1 (13) | 1 (13) | 2 (25) | 2 (25) |
| Non-functional (7) | 2 (7) | 3 (43) | 1 (14) | 5 (71) | 3 (43) | 1 (14) | – | 2 (29) |
| Non-ambulator (21) | 2 (5) | 10 (48) | 10 (48) | 1 (5) | 5 (24) | 3 (14) | 4 (19) | 6 (27) |
| Unclassified (1) | – | – | 1 (100) | 1 (100) | – | – | – | – |
| Comorbidity (n) | ||||||||
| Central Nervous System (79) | 2 (7) | 38 (48) | 32 (41) | 31 (39) | 17 (22) | 15 (19) | 12 (15) | 16 (20) |
| Musculoskeletal (71) | 2 (7) | 28 (39) | 30 (42) | 30 (42) | 15 (21) | 13 (18) | 13(18) | 15 (21) |
| Dermatology (12) | 2 (7) | 7 (58) | 6 (50) | 5 (42) | 3 (25) | 1 (8) | 1 (8) | 3 (25) |
Note. Proportions are based on row totals. The data sources were a survey of caregivers (for pain sites) and medical records (other data).
Fig. 1
Location of pain (percentage).
3.4Correlations between child- and caregiver physical, mental, and emotional health (Aim 4)
The pairwise correlations between how caregivers reported their own physical, mental, and emotional health and how they rated that of their children ranged from weak to moderate; that is, from r = 0.22 (child physical health and caregiver mental and emotional health) to r = 0.55 (caregiver physical health and caregiver mental and emotional health). All correlations were statistically significant (Table 7).
Table 7
Pearson correlation coefficients for physical and mental health of 3–6 year old children with spina bifida and their caregivers
| 1 | 2 | 3 | 4 | M (SD) | |
| 1. Child physical health | 1 | 3.9 (0.9) | |||
| 2. Child mental and emotional health | 0.53** | 1 | 3.9 (1.0) | ||
| 3. Parent physical health | 0.49** | 0.34** | 1 | 3.7 (1.0) | |
| 4. Parent mental and emotional health | 0.22* | 0.22* | 0.55** | 1 | 3.5 (1.1) |
Note. *p < 0.05 **p < 0.01. Sample size for each correlation ranged from 96 to 98. M = mean, SD = standard deviation. The data source was the caregiver respondents.
4Discussion
We investigated proxy-reported pain in young children with SB and if complaints, duration, and causes of pain (injury or not) significantly differed by sex of the child, level of lesion, type of SB, and ambulatory status. We also examined what parts of the body hurt, and delineated the pain patterns according to socio-demographic variables, and the presence of certain comorbidities. The correlation between the caregivers’ self-reported physical, mental, and emotional health, and how they reported their child’s health was also assessed. Most of the children included were males, Caucasian, affected at lumbar level, had a diagnosis of MMC, and six out of ten were ambulatory or community ambulators.
4.1Overall frequency of pain
Seven out of ten children complained of pain, ranging from once a month or less to every day. Most (63%) reported that it had been experienced for up to three months, yet four out of ten reported that the pain had been experienced longer than three months. To study pain in more depth would require additional information beyond what was collected in this study. However, pain that lasts greater than three months, even if intermittent (most stated that the pain had lasted less than 24 hours) might be indicative of chronic pain.
4.2Pain by sex, level of lesion, type of SB or ambulatory status
No statistically significant differences were found on complaints/duration of pain according to the child’s sex, level of lesion, type of SB, or ambulatory status. One reason for the null effects may be in the way that pain was measured in this study. The focus was on chronicity and frequency of pain. Potential differences in pain intensity or pain interference were not captured. For example, those who have MMC are likely to have hydrocephalus and might experience greater pain; however, this was not found in the analysis. As found here, individuals with MMC subtype may indeed experience pain with the same frequency as other subtypes, but the intensity of pain when it does occur could be greater for this group, though this hypothesis was not investigated in this study. The severity in which pain is experienced and its effect on functioning is an area for future research. In previous research on older children and adolescents with SB, greater pain was associated with reduced social activity involvement. Also, pain was indirectly associated with lower social competence [13]. Strong associations have been found between pain and lower health-related quality of life and higher depression scores [8]. That pain is not influenced by the predictors included in this study should be interpreted with caution, bearing in mind that it could be evaluated with greater depth and dimensionality [34] than what was captured in this study and by including a larger sample.
The results indicate that, according to the caregivers, pain is common across a population of young children with SB. These results are in line with previous research on pain in children with SB from different age groups. In a study of older children and adolescents with SB, 56%reportedly experienced pain once a week or more often [14]. Furthermore, level of lesion and ambulatory status were not significantly associated with pain [14]. Similar findings have been reported also in adults [27].
4.3Body site
Headaches, pain in the abdomen, and pain in the lower body were reported most frequently. Headaches might be a sign of shunt dysfunction, and pain in the abdomen might be associated with constipation and urinary tract infections [35]. Clancy et al. [14] also reported the head and the abdomen as the most frequently reported painful body sites. Pain in the neck and shoulders were more commonly reported in older children [14] than in the current study. Surprisingly, children who had a shunt were not reported to have greater pain than those without a shunt. The null effect may be due to the lack of variation in the frequency of pain when it was reported. Fifty-three or 77%of the 69 who had pain indicated that their frequency of it was either once a month or less or more than once a month but less than once a week.
Recent findings on pain in adults with SB also support that pain in the upper body is more frequent [27]. In a Dutch study, young adults with SB and hydrocephalus reported significantly worse scores on body pain than a comparison group, with head, neck, and back being the most frequently reported sites [25]. Bellin and colleagues reported similar findings in terms of painful body sites [36] with shoulders, back, and head being most commonly reported in young adults with SB [36]. The variation in where the pain manifests –from pain in the lower body at younger ages to pain in the upper body in adulthood –might reflect a change in ambulation status over time. Young children might be more able or encouraged to walk, whereas later on in life they might be more likely to use a wheelchair. It might also represent differences in study designs or ambulatory status across different studies. Most of the children included in this study were ambulators/community ambulators, and most likely had sensation in their lower bodies. In the Oddson et al study [8], 38%of the children ambulated full-time. More than half of those who were reported experiencing pain had pain in more than one body site, and the number of pain sites was significantly positively correlated with more frequent complaints of pain.
4.4Associations between physical and mental/emotional health
Caregivers who themselves reported worse scores on physical and mental health were more likely to report worse scores in their children. This is a cross-sectional study and cause and effect cannot be implied. To have a child with poor physical, mental, or emotional health might affect the health of the caregiver, or a caregiver who is not feeling well might be more likely to report that their child is also experiencing problems with their health.
4.5Limitations
There were a number of limitations to the current study. MMC is a rare condition, which means that it is difficult to recruit large generalizable samples. This might result in studies that are under-powered. However, the study was population-based and attempts were made to recruit as many participants as possible. The measurement of pain here was frequency of pain complaints and duration. The degree to which complaints of pain is a good indicator of actual pain is unclear. The study also does not assess the intensity of pain or pain interference. More nuanced measures of pain that evaluate frequency, duration, and intensity would be more indicative of its adverse effect on the QoL. If and how pain interfered with participation was not included in the assessments. Severe chronic pain is quite different and likely would have other ramifications in terms of personal suffering and participation in school and leisure activities than would, for instance, mild, intermittent pain. Treatment modalities might also differ. Some of the items included were screening items or single items from validated measures. For instance, it would have been preferable to have used validated measures on caregivers’ self-rated mental and physical health. However, the scope of the study was already large and because it was not the main focus of the study this was not done.
An additional concern might be that proxies reported on the children’s pain. This decision was made not to overload the children who participated in the full protocol and because of the age of the target demographic. For those who participated in the partial protocols, it was not possible to reliably obtain child report on pain. The concordance between caregiver and child report of pain is a concern; both under-reporting and over-reporting are possible. In research on pediatric chronic pain, the concordance between maternal and child/adolescent agreement on pain location varied from fair to moderate agreement [37]. In the Clancy et al. study, the concordance between self- and parent report on child pain was the highest for location of pain [14]. Moreover, in younger children, the parents tended to underestimate the occurrence of the child’s current pain [14]. Also, it is possible that the correlations between child and parent “perceived health”, both reported by the caregiver, could be prone to a method effect, which could inflate the correlations. Almost all caregivers were mothers. It is possible that fathers would have reported on their children’s pain differently.
Although the intensity or the ramifications of the pain could not be determined, many of the young children included in the study seemed to deal with some pain. Playtime with peers is an important factor in children’s emotional and cognitive development. Experiences of pain are likely to reduce children’s desire to participate in developmentally appropriate activities. A physical disability, compounded with pain, can limit children’s participation in activities that enhance QoL, such as leisure activities and play. Cognitive challenges for some children with SB may make communicating pain experiences to their clinician or caregiver difficult and may require prompting from the clinician or caregiver. It should not be assumed that the individuals will mention the pain on their own accord. Difficulties with executive function or having gotten used to the pain might make it less likely for them to do so. Clinicians working with individuals with SB should be cognizant to inquire specifically about pain because pain in children with SB may be common, may be overlooked, and may reduce the QoL of those affected. Both self-report and proxy report of pain are strongly encouraged in clinical encounters.
Acknowledgments
This publication was supported by cooperative agreement # DD000690 and # DD000691, funded by the Centers for Disease Control and Prevention. Its contents are solely the responsibility of the authors and do not necessarily represent the official views of the Centers for Disease Control and Prevention or the Department of Health and Human Services.
UTAH: Data were provided by the Utah Birth Defect Network, a program within the Utah Department of Health. This project is supported by the Health Resources and Services Administration (HRSA) of the U.S. Department of Health and Human Services (HHS) under grant number B04MC25374 with a title of Maternal and Child Health Services. This information or content and conclusions are those of the authors and should not be construed as the official position or policy of, nor should any endorsements be inferred by HRSA, the U.S. Government or the Utah Department of Health. The first author (A-S) was partly supported by a grant by Stiftelsen för Bistånd åt Rörelsehindrade i Skåne.
Conflict of interest
The authors have no conflict of interest to report.
Supplementary material
[1] The supplementary material is available in the electronic version of this article: https://dx.doi.org/10.3233/PRM-190661.
References
[1] | Alriksson-Schmidt AI , Thibadeau JK , Swanson ME , Marcus D , Carris KL , Siffel C , et al. The natural history of spina bifida in children pilot project: Research Protocol. JMIR Res Prot. (2013) ;2: (1):e2. doi: 10.2196/resprot.2209 |
[2] | Agopian AJ , Canfield MA , Olney RS , Lupo PJ , Ramadhani T , Mitchell LE , et al. National Birth Defects Prevention Study Spina bifida subtypes and sub-phenotypes by maternal race/ethnicity in the National Birth Defects Prevention Study. Am J Med Genet A. (2012) ;158A: (1):109–15. doi: 10.1002/ajmg.a.34383 |
[3] | Shin M , Besser LM , Siffel C , Kucik JE , Shaw GM , Lu C , et al. Congenital Anomaly Multistate Prevalence and Survival Collaborative Prevalence of spina bifida among children and adolescents in 10 regions in the United States. Pediatrics. (2010) ;126: (2):274–9. doi: 10.1542/peds.2009-2084 |
[4] | McComb JG . A practical clinical classification of spinal neural tube defects. Childs Nerv Syst. (2015) Oct;31 (10):1641–57. doi: 10.1007/s00381-015-2845-9 |
[5] | Bowman RM , McLone DG . Neurosurgical management of spina bifida: research issues. Dev Disabil Res Rev. (2010) ;16: (1):82–7. doi: 10.1002/ddrr.100 |
[6] | Simeonsson RJ , Sturtz McMillen J , Huntington GS . Secondary conditions in children with disabilities: Spina bifida as a case example. Ment Retard Dev Disabil Res Rev. (2002) ;8: (3):198–205. doi: 10.1002/mrdd.10038 |
[7] | Burmeister R , Hannay HJ , Copeland K , Fletcher JM , Boudousquie A , Dennis M . Attention problems and executive functions in children with spina bifida and hydrocephalus. Child Neuropsychol. (2005) ;11: (3):265–83. doi: 10.1080/092970490911324 |
[8] | Oddson BE , Clancy CA , McGrath PJ . The role of pain in reduced quality of life and depressive symptomology in children with spina bifida. Clin J Pain. (2006) ;22: (9):784–9. doi: 10.1097/01.aj0000210929.43192.5d |
[9] | Burmeister R , Hannay HJ , Copeland K , Fletcher JM , Boudousquie A , Dennis M . Attention problems and executive functions in children with spina bifida and hydrocephalus. Child Neuropsychol. (2005) ;11: (3):265–83. doi: 10.1080/092970490911324 |
[10] | Verhoef M , Lurvink M , Barf HA , Post MWM , van Asbeck FWA , Gooskens RHJM , et al. High prevalence of incontinence among young adults with spina bifida: description, prediction and problem perception. Spinal Cord. (2005) ;43: (6):331–40. doi: 10.1038/sj.sc.3101705 |
[11] | Stark C , Hoyer-Kuhn H-K , Semler O , Hoebing L , Duran I , Cremer R , et al. Neuromuscular training based on whole body vibration in children with spina bifida: a retrospective analysis of a new physiotherapy treatment program. Childs Nerv Syst. (2015) ;31: (2):301–9. doi: 10.1007/s00381-014-2577-2 |
[12] | Polfuss M , Bandini LG , Sawin KJ . Obesity prevention for individuals with spina bifida. Curr Obes Rep. (2017) ;6: (2):116–126. doi: 10.1007/s13679-017-0254-y |
[13] | Essner BS , Murray CB , Holmbeck GN . The influence of condition parameters and internalizing symptoms on social outcomes in youth with spina bifida. J Pediatr Psychol. (2014) ;39: (7):718–34. doi: 10.1093/jpepsy/jsu036 |
[14] | Clancy CA , McGrath CJ , Oddson BE . Pain in children and adolescents with spina bifida. Dev Med Child Neurol. (2005) ;47: (1):27–34. doi: 10.1017/s0012162205000058 |
[15] | Thomson JD , Segal LS . Orthopedic management of spina bifida. Dev Disabil Res Rev. (2010) ;16: (1):96–103. doi: 10.1002/ddrr.97 |
[16] | Wang H-HS , Wiener JS , Ross SS , Routh JC . Emergent care pattern in patients with spina bifida: a case-control study. J Urol. (2015) ;193: (1):268–73. doi: 10.1016/j.juro.2014.06.085 |
[17] | International Association for the Study of Pain. IASPTaxonomy [Internet]. Washington: International Association for the Study of Pain; 2012. (cited 2017 October 20, 2017]. Available from: http://www.iasp-pain.org/Taxonomy. |
[18] | Turk DC , Wilson HD , Cahana A . Treatment of chronic non-cancer pain. Lancet. (2011) ;377: (9784):2226–35. doi: 10.1016/S0140-6736(11)60402-9 |
[19] | Goldberg DS , McGee SJ . Pain as a global public health priority. BMC Public Health. (2011) ;11: :770. doi: 10.1186/1471-2458-11-770 |
[20] | Raffaeli W , Arnaudo E . Pain as a disease: an overview. J Pain Res. (2008) ;10: :2003–2008. doi: 10.2147/JPR.S138864 |
[21] | Treede R-D , Rief W , Barke A , Aziz Q , Bennett MI , Benoliel R , et al. A classification of chronic pain for ICD-11. Pain. (2015) ;156: (6):1003–1007. doi: 10.1097/j.pain.0000000000000160 |
[22] | Eckhoff C , Straume B , Kvernmo S . Multisite musculoskeletal pain in adolescence and later mental health disorders: a population-based registry study of Norwegian youth: the NAAHS cohort study. BMJ Open. (2017) ;7: (2):e012035. doi: 10.1136/bmjopen-2016-012035 |
[23] | Weenboer PW , Procee AI , Verheijden JMA , Ruud Bosch JLH , van Asbeck FWA , de Kort LMO . Medical and psychosocial problems in middle-aged spina bifida patients: survey among members of the Dutch patients’ association. Disabil Rehabil. (2014) ;36: (7):539–45. doi: 10.3109/09638288.2013.801522 |
[24] | Wagner R , Linroth R , Gangl C , Mitchell N , Hall M , Cady R , et al. Perception of secondary conditions in adults with spina bifida and impact on daily life. Disabil Health J. (2015) ;8: (4):492–8. doi: 10.1016/j.dhjo.2015.03.012 |
[25] | Verhoef M , Post MWM , Barf HA , van Asbeck FWA , Gooskens RHJM , Prevo AJH . Perceived health in young adults with spina bifida. Dev Med Child Neurol. (2007) ;49: (3):192–7. doi: 10.1111/j.1469-8749.2007.00192.x |
[26] | Edwards RJ , Witchell C , Pople IK . Chronic headaches in adults with spina bifida and associated hydrocephalus. Eur J Pediatr Surg. (2003) ;13 Suppl 1: :S13–7. doi: 10.1055/s-2003-44751 |
[27] | Alriksson-Schmidt A , Lundkvist Josenby A , Lindquist B , Westbom L . Pain and health status in adults with myelomeningocele living in Sweden. J Pediatr Rehabil Med. (2018) ;11: (4):255–264. doi: 10.3233/PRM-170517 |
[28] | Werhagen L , Hulting C , Borg K . Pain, especially neuropathic pain, in adults with spina bifida, and its relation to age, neurological level, completeness, gender and hydrocephalus. J Rehabil Med. (2010) ;42: (4):374–6. doi: 10.2340/16501977-0529 |
[29] | Alriksson-Schmidt A , Hägglund G . Pain in children and adolescents with cerebral palsy: a population-based registry study. Acta Paediatr. (2016) ;105: (6):665–70. doi: 10.1111/apa.13368 |
[30] | Thibadeau J , Reeder MR , Andrews J , Ong K , Feldkamp ML , Rice S , et al. Understanding the natural progression of spina bifida: Prospective study. JMIR Res Protoc. (2017) ;6: (9):e180. doi: 10.2196/resprot.7739 |
[31] | Hoffer MM , Feiwell E , Perry R , Perry J , Bonnett C . Functional ambulation in patients with myelomeningocele. J Bone Joint Surg Am. (1973) ;55: (1):137–48. |
[32] | IBM Corp. Released 2018. IBM SPSS Statistics for Windows, Statistics Subscription. Armonk, NY: IBM Corp. |
[33] | SAS Institute Inc. SAS 9.4. Cary, NC: SAS Institute, Inc. |
[34] | Breivik H , Borchgrevink PC , Allen SM , Rosseland LA , Romundstad L , Breivik Hals EK , et al. Assessment of pain. Br J Anaesth. (2008) ;101: (1):17–24. doi: 10.1093/bja/aen103 |
[35] | Sandler AD . Children with spina bifida: Key clinical issues. Pediatr Clin North Am. (2010) ;57: (4):879–92. doi: 10.1016/j.pcl.2010.07.009 |
[36] | Bellin MH , Dicianno BE , Osteen P , Dosa N , Aparicio E , Braun P , et al. Family satisfaction, pain, and quality-of-life in emerging adults with spina bifida: a longitudinal analysis. Am J Phys Med Rehabil. (2013) ;92: (8):641–55. doi: 10.1097/PHM.0b013e31829b4bc1 |
[37] | Schwartz LF , Seidman LC , Zeltzer LK , Tsao JCI . Mother-childconcordance for pain location in pediatric chronic pain sample. JPain Manag. (2013) ;6: (2):135–145. |


