
Remote Sensing Data as a Tool for Studying Environmental Aspects of Parkinson’s Disease
Dear Editor:
Parkinson’s disease is one of the most common neurodegenerative disorders with a complex etiology. Based on several research reports, the environment plays a significant role in the development of idiopathic forms of the disease [1]. Furthermore, recent evidence suggests a rise in incidence in low and middle income countries (LMIC). Correlating environmental factor to the disease process, however, is still challenging due to several factors, globally, and more acutely in LMIC. First off, a long latency period separates exposure from the disease manifestations. Secondly, retrospective evaluation of past exposure is subject to many recall biases, as they rely on histories provided by the subject. And finally, the many technical and resources challenges in sampling and assessment of exposure to multiple pollutants persist [2, 3].
Archived and long-term collected satellite aerosol data records if supported by ground ambient monitoring data could present an excellent solution for the above-mentioned challenges [4]. These records can provide added value in modeling an individualized exposure profile, occupationally and residential, for each subject. In essence, providing accurate and unbiased retrospective environmental data devoid of recall problems and technical challenges.
In our study, we recruited 50 idiopathic PD patients and a similar number of matched controls. Patients with PD were diagnosed using the UK Brain Bank Criteria. Patients with atypical, secondary or familial forms of Parkinsonism or other neurodegenerative diseases were excluded. Data including age, gender, address, age at onset, motor and non-motor scales, cognitive scores, and Hoehn & Yahr scale were systemically collected [5]. Healthy controls without neurodegenerative diseases, as ascertained by history and neurological examination were also recruited. All subjects provided their signed informed consent, and the study protocol was approved by the American University in Cairo IRB before starting.
A retrospective analysis of the air quality, that the recruited individuals experienced over the preceding 10 years, was conducted. We built an exposure profile for each recruited subject using air pollution data provided by the National Authority of Remote Sensing and Space Sciences. These data related to cumulative exposure in the last 10 years were extracted from two sources; the first is ground-level ambient monitoring data, and the second obtained through the long satellite aerosol data record at 1 km spatial resolution, which includes aerosol optical depth identifying air pollution in different regions. The air pollution data was based on the individual’s residences and coupled to a detailed questionnaire that included their place of residences across their lives. It worth mentioning that it is common among Egyptian citizens to settle in one city for their whole lives.
Per the Air Quality Index (AQI) [6], average PM2.5 concentration in Egypt is 9.3 times the WHO annual air quality guideline value. The values, however, change across the year time with highest levels in September to November. When compared to the rest of the world, Egypt ranked as the 56th most polluted out of a total of 98.
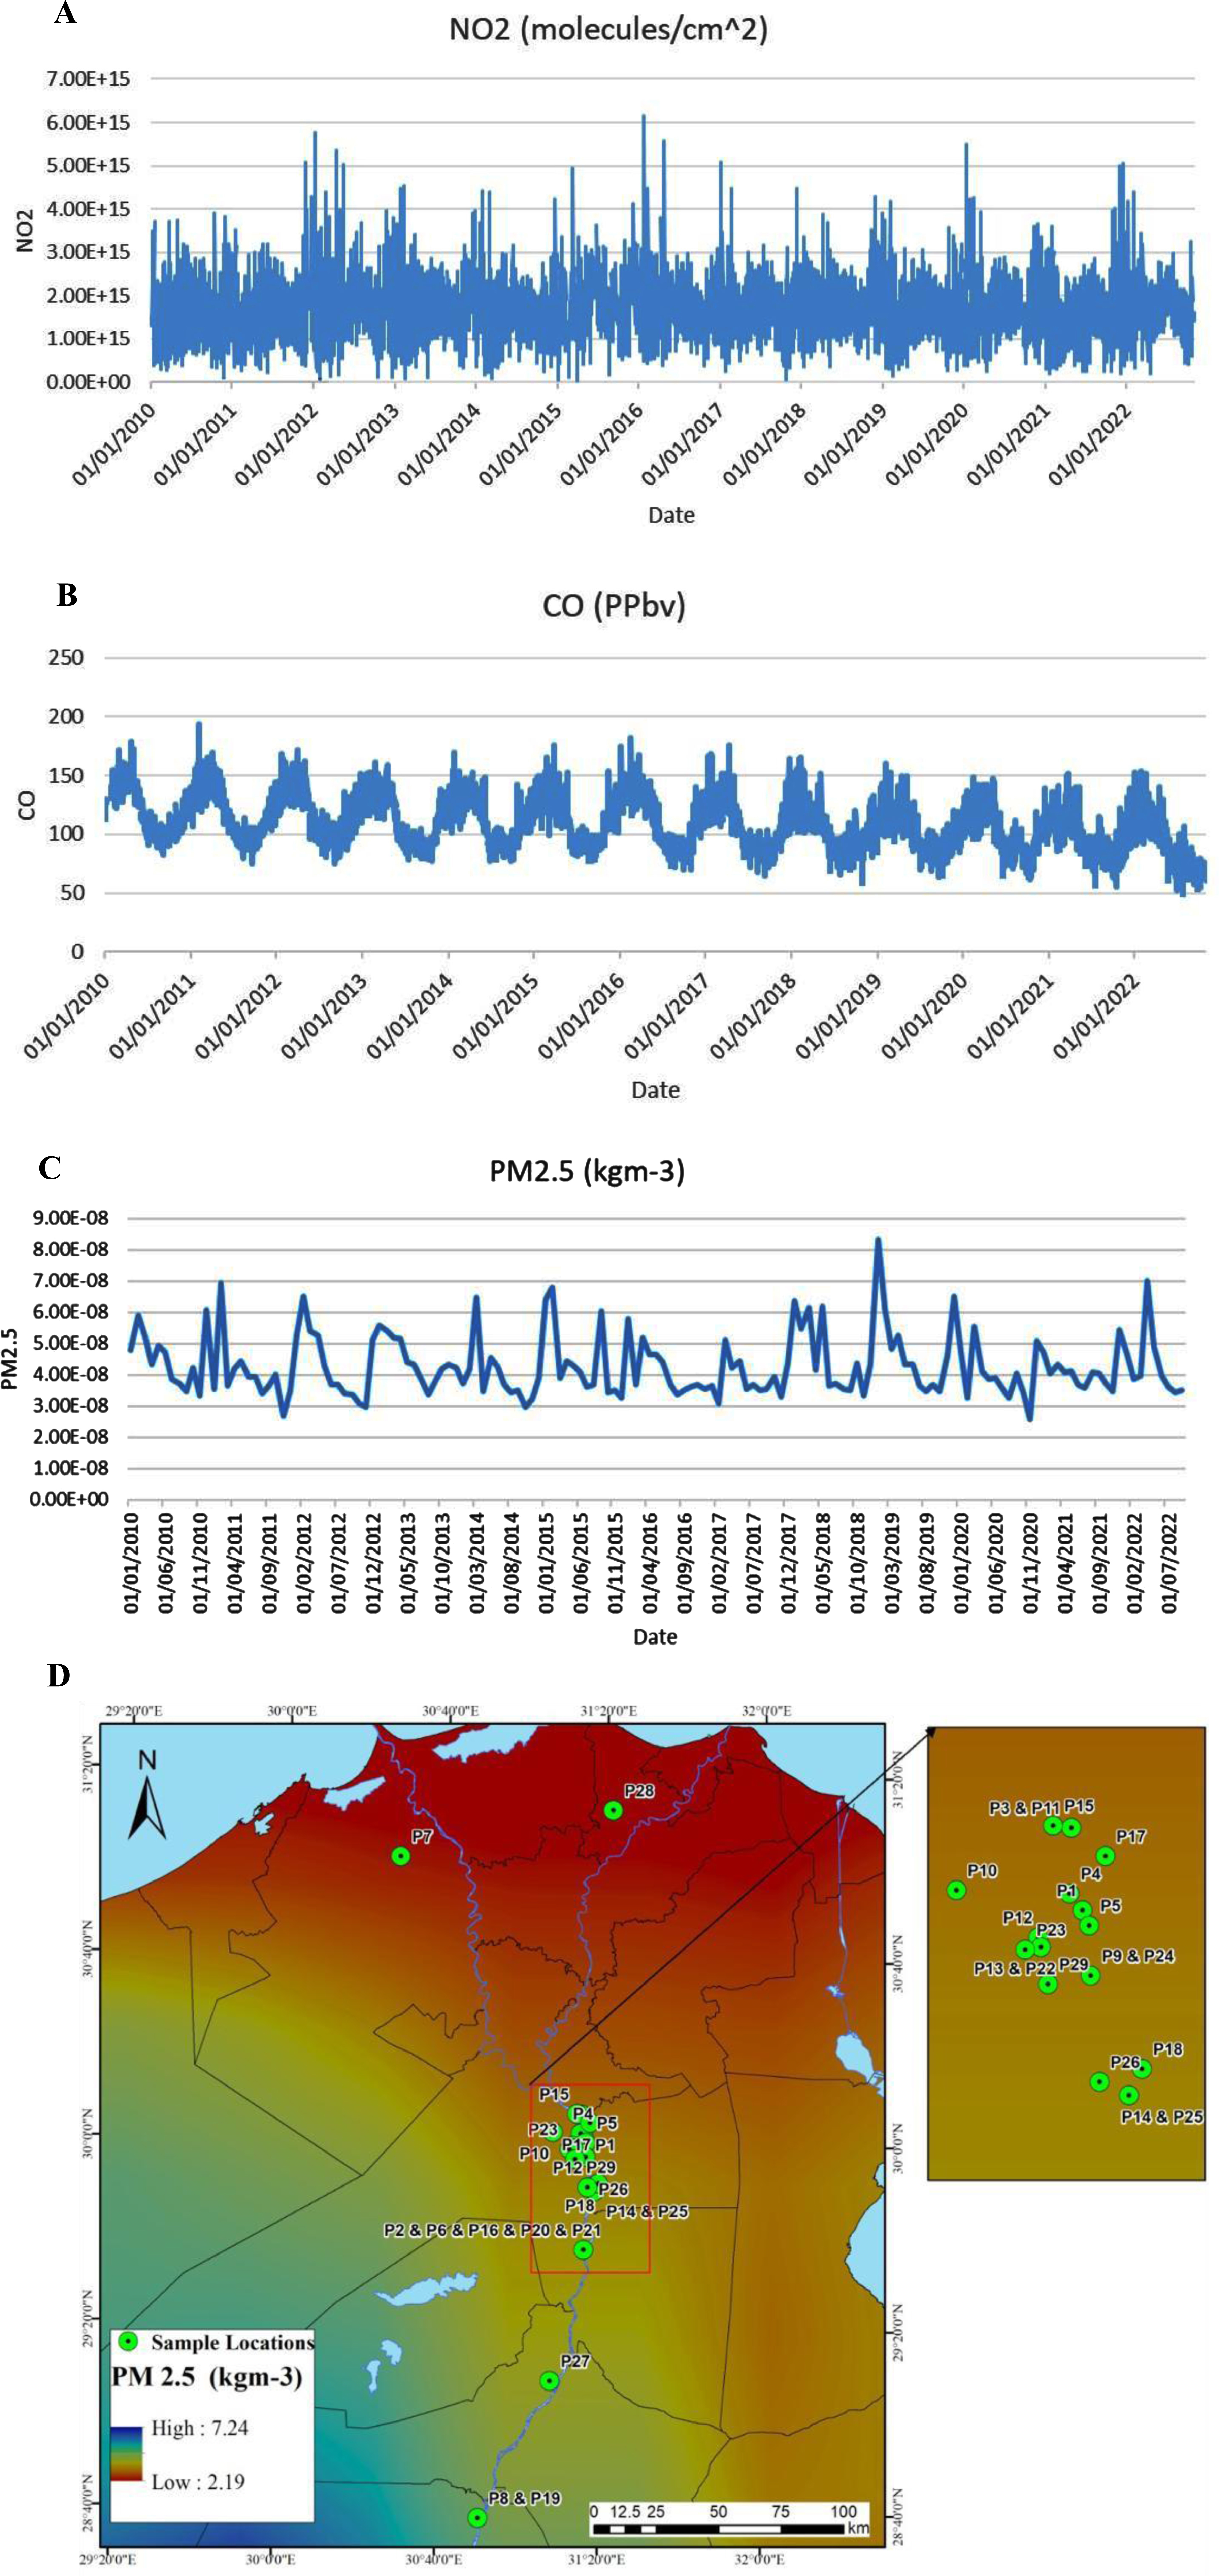
As presented in Fig. 1, we were able to build an air pollution profile for each recruited subject that record the probable past exposure for 10 years to different pollutants based on their addresses during that time period. The profiles show fluctuations as reported by AQI across the year which can be correlated to different seasons, holidays, and incidents (e.g., COVID-19 pandemic).
Fig. 1
Concentrations of individual pollutants through the period from 2010-2022 showing NO2 (A), CO (B), and PM2.5 (C). Panel D shows a heat map describing the address of each patient against Egypt’s map with a gradient of PM 2.5 from the lowest (red): 2.19 to the highest (blue): 7.24 kgm-3.
Our study shows that building a cumulative environmental exposure profile for recruited subjects was feasible using existing data from remote sensing. Building on these exposure profiles we can enrich the environmental component of future epidemiological studies involving several complex disease and linking them to internal effects on body functions and processes, e.g., genetics, metabolomics, and proteomics. While this is an approximation, in absence of individual prospective exposure assessments, not justifiable in the absence of overt clinical diagnoses, and the presence of technological challenges, particularly of emerging economies, this approach provides a value-added facet to our defining risk factors of PD and other disorders. Limitations of the first stage of the project presented here, include the small sample size with distribution of the majority of cases within Cairo, this led to lower ability of discrimination between different participants, however, the second stage of the project is involving recruiting additional subjects from different regions of Egypt (target 1, 000 participants) with adding silicone wrist bands analysis to identify exposure to persistent organic pollutants and investigating biological changes, e.g., metabolomic profiles. This will improve our ability to identify external exposures and link them to internal responses to achieve the goals of the “Egyptian Exposome Project for Parkinson’s Disease”.
ACKNOWLEDGMENTS
The authors have no acknowledgments to report.
FUNDING
This study was supported by the American University in Cairo (Bartlett Fund for Critical Challenges -2021 and Faculty Support Grants-2021 [MS]).
CONFLICT OF INTEREST
The authors have no conflict of interest to report.
REFERENCES
[1] | GBD 2016 Neurology Collaborators ((2019) ) Global, regional, and national burden of neurological disorders, 1990-2016: A systematic analysis for the Global Burden of Disease Study 2016. Lancet Neurol 18: , 459–480. |
[2] | Rösler TW , Salama M , Shalash AS , Khedr EM , El-Tantawy A , Fawi G , El-Motayam A , El-Seidy E , El-Sherif M , El-Gamal M , Moharram M , El-Kattan M , Abdel-Naby M , Ashour S , Müller U , Dempfle A , Kuhlenbäumer G , Höglinger GU ((2018) ) K-variant BCHE and pesticide exposure: Gene-environment interactions in a case-control study of Parkinson’s disease in Egypt. Sci Rep 8: , 16525. |
[3] | Hu CY , Fang Y , Li FL , Dong B , Hua XG , Jiang W , Zhang H , Lyu Y , Zhang XJ ((2019) ) Association between ambient air pollution and Parkinson’s disease: Systematic review and meta-analysis. Environ Res 168: , 448–459. |
[4] | Xiao Q , Chang HH , Geng G , Liu Y ((2018) ) An ensemble machine-learning model to predict historical PM2.5 concentrations in China from satellite data. Environ Sci Technol 52: , 13260–13269. |
[5] | Goetz CG , Tilley BC , Shaftman SR , Stebbins GT , Fahn S , Martinez-Martin P , Poewe W , Sampaio C , Stern MB , Dodel R , Dubois B , Holloway R , Jankovic J , Kulisevsky J , Lang AE , Lees A , Leurgans S , LeWitt PA , Nyenhuis D , Olanow CW , Rascol O , Schrag A , Teresi JA , van Hilten JJ , LaPelle N; Movement Disorder Society UPDRS Revision Task Force ((2008) ) Movement Disorder Society-sponsored revision of the Unified Parkinson’s Disease Rating Scale (MDS-UPDRS): scale presentation and clinimetric testing results. Mov Disord 23: , 2129–2170. |
[6] | IQAir.com. Air quality in Egypt: Air quality index (AQI) and PM2.5 air pollution in Egypt.https://www.iqair.com/Egypt.Accessed December 6, 2023. |


