
Reduced Prevalence of Parkinson’s Disease in Patients Prescribed Calcineurin Inhibitors
Abstract
Background:
Preclinical evidence suggests calcineurin inhibitors (CNIs) combat α-synuclein-induced neuronal dysfunction and motor impairments. However, whether CNIs prevent or treat Parkinson’s disease (PD) in humans has never been investigated.
Objective:
We seek to ascertain if prescription of CNIs is linked to a decreased prevalence of PD in a varied patient population and to glimpse into the mechanism(s) and target site through which CNIs might decrease PD prevalence.
Methods:
We analyzed electronic health records (EHRs) from patients prescribed the brain penetrant CNI tacrolimus (TAC), the peripherally restricted CNI cyclosporine (CySp), or the non-CNI sirolimus (SIR). For comparison, EHRs from a diverse population from the same network served as a general population-like control. After propensity-score matching, prevalence, odds, and hazards of PD diagnoses among these cohorts were compared.
Results:
Patients prescribed CNIs have decreased odds of PD diagnosis compared to the general population-like control, while patients prescribed SIR do not. Notably, patients prescribed TAC have a decreased prevalence of PD compared to patients prescribed SIR or CySp.
Conclusions:
Our results suggest CNIs, especially those acting within the brain, may prevent PD. The reduced prevalence of PD in patients prescribed TAC, compared to patients prescribed SIR, suggests that mechanisms of calcineurin inhibition— other than immunosuppression, which is common to both drugs— are driving the reduction. Therefore, CNIs may provide a promising therapeutic approach for PD.
INTRODUCTION
Parkinson’s disease (PD) is a progressive movement disorder and ranks among the most prevalent neurodegenerative diseases. Hallmarks of PD include accumulation of Lewy bodies, composed of aggregated α-synuclein, and the progressive degeneration of dopaminergic neurons within the substantia nigra pars compacta [1]. The loss of these neurons leads to a dopamine deficiency, which manifests as typical PD motor symptoms such as bradykinesia, muscle rigidity, and resting tremor. Additionally, many PD patients suffer from non-motor symptoms including cognitive impairment and gastrointestinal symptoms [2]. While current treatments for PD primarily focus on alleviating motor symptoms, largely through dopamine replacement, they do not address the underlying pathology. Current PD treatments fall short of preventing, reversing, or decelerating the inherent neurodegeneration, emphasizing a significant gap in our therapeutic arsenal [3].
Delving into the underlying pathology, key pathogenic mechanisms such as neuroinflammation, disrupted autophagy, and impaired calcium (Ca2 +) homeostasis stand as central players in the progression of PD [1]. Sustained increases in Ca2 +, induced by aberrant α-synuclein for example, activate calcineurin (CaN) and subsequently contribute to neuronal toxicity [4]. CaN, a calmodulin-dependent protein phosphatase, is found in high concentrations in the central nervous system (CNS) [5]. CaN’s roles within the CNS encompass modulation of synaptic stability, control of neuroinflammation, and mediation of neural degeneration [6, 7]. Strikingly, elevated levels of the active form of CaN have been reported in post-mortem brain tissue from patients with confirmed α-synuclein pathology [4]. A growing body of evidence underscores the centrality of CaN in the pathogenesis and progression of PD, particularly through its regulation of downstream transcription factors [4, 7–13]. Notably, CaN inhibition may extend dopamine action by preventing dephosphorylation of Dopamine- and cAMP-regulated phosphoprotein (DARPP-32) [13]. Furthermore, CaN inhibition counteracts α-synuclein-induced toxicity, including neurodegeneration and motor impairments, in preclinical models of PD pathology [4, 8, 12]. However, the therapeutic manipulation of CaN demands precision, as both its deletion and overexpression have been linked to amplified α-synuclein toxicity [10].
Integral to its functions, CaN mediates the immune response. CaN dephosphorylates nuclear factor of activated T-cells (NFAT), triggering its relocation to the nucleus and subsequent activation of immune response genes [14–16]. Alongside its well-recognized role in peripheral immune modulation, NFAT activation within the CNS contributes to neuroinflammation and neuronal death [12, 17]. Consequently, immunomodulatory strategies, particularly CaN inhibition, emerge as a promising avenue for therapeutic intervention in PD. In the past, the U.S. Food and Drug Administration (FDA) approved several immunosuppressants to prevent graft rejection in solid organ transplant patients [18, 19]. These include CaN inhibitors (CNIs) like tacrolimus (TAC; FK506) and cyclosporine (CySp) and non-CNI immunosuppressants like sirolimus (SIR; rapamycin) [15, 16, 20, 21]. While TAC and CySp exert their immunosuppressive effects via CaN inhibition, SIR targets mammalian target of rapamycin (mTOR) [22]. Notably, among the CNIs, TAC exerts action in the CNS [23]. This trait distinguishes it from CySp, which poorly crosses the blood-brain barrier, if at all [24].
Building upon the concept of drug repurposing, a strategy that seeks new applications for FDA-approved medications, our study sought to evaluate the potential of CNIs in reducing the prevalence of PD [25]. We tested the hypotheses that patients prescribed CNIs exhibit a reduced prevalence of PD compared to both a general population-like control and patients prescribed a non-CNI immunosuppressant. Further, by comparing patients prescribed SIR or CySp directly to those prescribed TAC, we ventured to shed light on potential mechanisms through which these drugs might influence PD prevalence.
METHODS
Dataset and study population
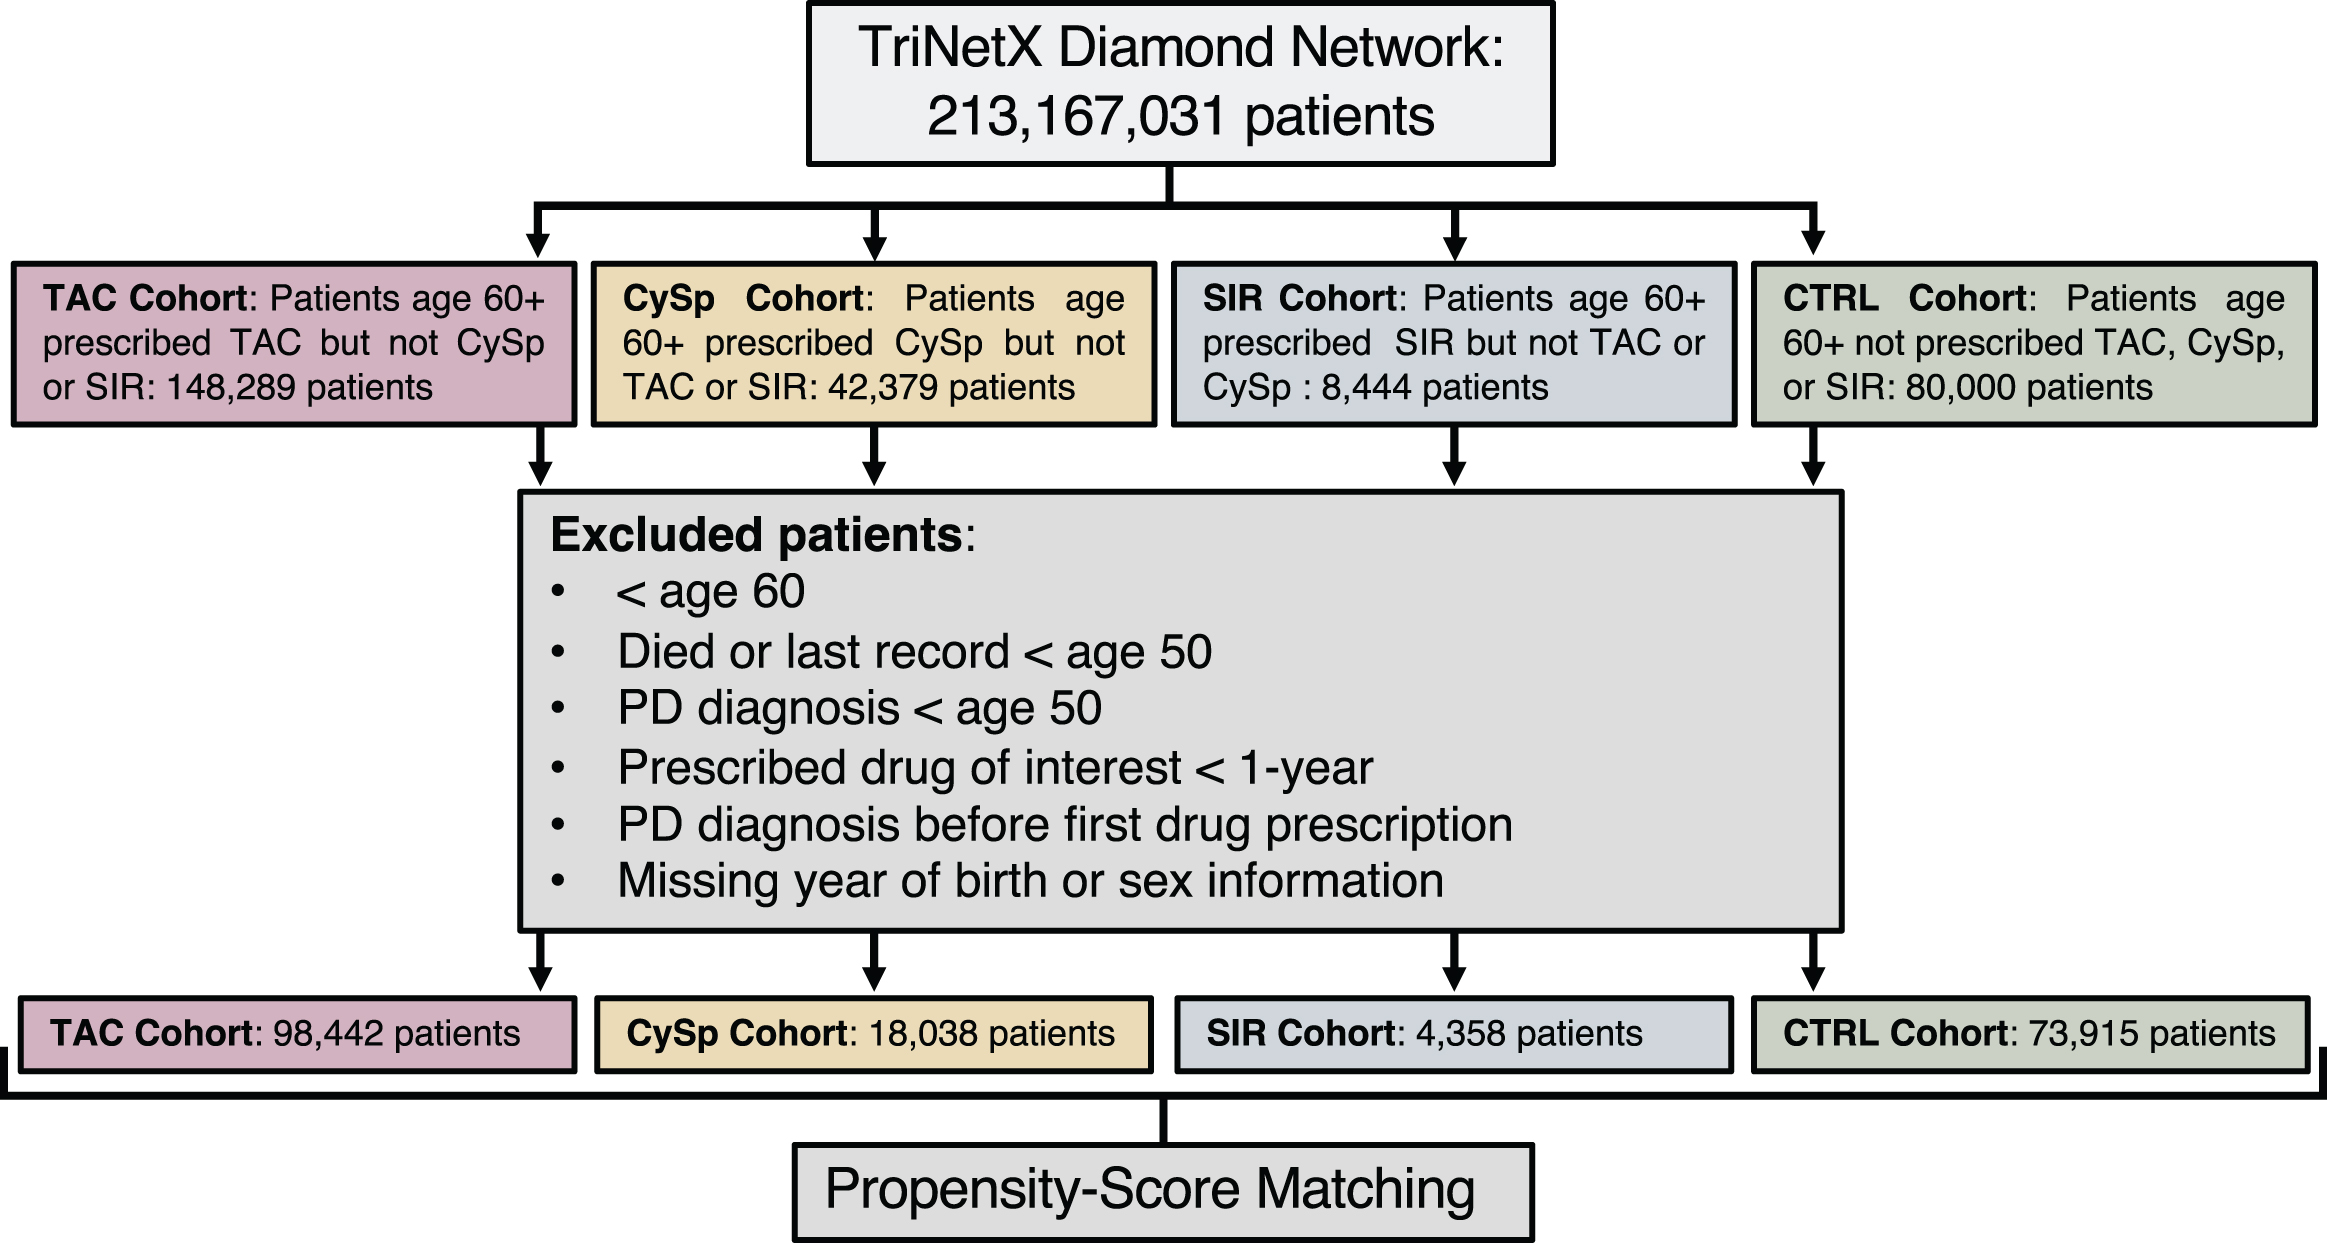
On July 11, 2022, we sourced data from the TriNetX Diamond Network, a comprehensive repository that includes a longitudinal collection of medical and pharmacy claims, as well as primary and specialty care EHRs. This network provides an extensive range of healthcare records, encompassing diagnoses, procedures, medications, and laboratory results, thereby offering access to curated data from approximately 213 million patients [26]. Given that TriNetX aligns with the Health Insurance Portability and Accountability Act (HIPAA) standards and only includes de-identified records, this study did not require Institutional Review Board approval. We acquired EHRs for patients aged 60 and older who were prescribed TAC, SIR, or CySp— but not a combination of these drugs— via TriNetX. Each drug under investigation represented a distinct cohort. The initial recorded prescription of the drug signified the index event for that cohort. Length of prescription was estimated by subtracting the year of initial drug prescription from the year of final drug prescription for each patient. Before drawing comparisons, these cohorts were matched based on propensity scores, as detailed further. As a general population-like control (CTRL), we retrieved a diverse random sample of 80,000 patients aged 60 and above from the TriNetX Diamond Network on November 22, 2022. These patients had an EHR entry (diagnosis, procedure, lab test, or medication) but were not prescribed TAC, SIR, or CySp. The CTRL cohort’s index event encompassed any medical diagnosis, procedure, lab test, or medication. Before initiating comparisons, patients from the CTRL group were matched to each drug cohort based on propensity scores. Specifics about each cohort are detailed in Table 1.
Table 1
Matched cohort characteristics
| CTRL | TAC | SMD | CTRL | SIR | SMD | CTRL | CySp | SMD | SIR | TAC | SMD | CySp | TAC | SMD | |
| Total Number | 73,916 | 73,916 | 4,358 | 4,358 | 18,038 | 18,038 | 4,358 | 4,358 | 18,038 | 18,038 | |||||
| Sex (%) | 0.09 | <0.001 | <0.001 | 0.002 | 0.003 | ||||||||||
| Male | 45.6 | 50.3 | 63.2 | 63.2 | 55.8 | 55.8 | 63.2 | 63.3 | 55.8 | 55.6 | |||||
| Female | 54.4 | 49.7 | 36.8 | 36.8 | 44.2 | 44.2 | 36.8 | 36.7 | 44.2 | 44.4 | |||||
| Race (%) | 0.02 | <0.001 | 0.001 | 0.004 | 0.005 | ||||||||||
| Asian | 0.3 | 0.3 | 0.3 | 0.3 | 0.9 | 0.9 | 0.3 | 0.3 | 0.9 | 0.8 | |||||
| Black | 2.5 | 2.5 | 3.7 | 3.7 | 3.0 | 3.0 | 3.7 | 3.8 | 3.0 | 3.0 | |||||
| Unknown | 77.5 | 76.6 | 72.2 | 72.2 | 69.4 | 69.4 | 72.2 | 72.2 | 69.4 | 69.3 | |||||
| White | 19.7 | 20.6 | 23.8 | 23.8 | 26.7 | 26.7 | 23.8 | 23.7 | 26.7 | 26.9 | |||||
| Ethnicity (%) | 0.03 | <0.001 | <0.001 | 0.003 | 0.004 | ||||||||||
| Hispanic or Latino | 2.3 | 2.6 | 2.8 | 2.8 | 2.5 | 2.5 | 2.8 | 2.8 | 2.5 | 2.5 | |||||
| Not Hispanic or Latino | 22.0 | 22.7 | 26.8 | 26.8 | 30.1 | 30.1 | 26.8 | 26.9 | 30.1 | 30.2 | |||||
| Unknown | 75.6 | 74.6 | 70.4 | 70.4 | 67.4 | 67.4 | 70.4 | 70.3 | 67.4 | 67.3 | |||||
| Comorbidities (%) (ICD-10 code) | 0.02 | <0.001 | 0.002 | 0.005 | 0.005 | ||||||||||
| Traumatic Brain Injury (S06) | 1.6 | 1.9 | 3.1 | 3.1 | 2.8 | 2.9 | 3.1 | 3.0 | 2.9 | 2.9 |
Cohort characteristics after propensity-score matching. Variables with SMD < 0.1 were considered balanced. *SMD, standardized mean difference; NA, not applicable.
ICD-reported diagnosed Parkinson’s disease
Parkinson’s disease was identified using the ICD-9 code 332.0 and the ICD-10 code G20.
Exclusion criteria
Patients were excluded if they died, had their last record, or were diagnosed with PD before age 50 to avoid cases of young-onset PD, which may have different etiological factors (Fig. 1) [27]. Those lacking birth year or gender data were also excluded due to the potential incompleteness of their medical records. Drug administration methods such as injectable, topical, ophthalmic, and unidentified routes were not considered. Hence, only oral medications were included. For the TAC, SIR, and CySp cohorts, patients who were prescribed the medication for less than 1 year or were diagnosed with PD before their first noted drug prescription were also omitted.
Fig. 1
Patient flow diagram.
Propensity-score matching
To ensure comparable groups by balancing confounders, propensity-score matching was carried out in R using the MatchIt package [28, 29]. Propensity scores were approximated with a generalized linear model and the nearest neighbor method was employed for matching. Cohorts were matched based on age at the initial prescription of TAC, SIR, or CySp (where applicable), sex, race, ethnicity, and traumatic brain injury (S06; TBI). A balanced status between cohorts was acknowledged if the standardized mean difference (SMD) for each matched variable was less than 0.1 (Table 1).
Statistical analysis
R Statistical Software (v4.2.2; R Core Team 2022) was employed to conduct all analyses, setting a predetermined alpha of 0.05 [30]. Bivariate analyses examined PD risk factors. Chi-squared tests analyzed differences for categorical variables, while logistic regression analyses evaluated differences in continuous variables (Table 2). Both unconditional and conditional logistic regression analyses gauged the influence of drug cohort on PD occurrences (Table 3). The conditional logistic regression analysis particularly considered the matched pairs formed during propensity-score matching. Competing risk regression curves with death as the competing risk were produced and assessed using the tidycmprsk package in R (Figs. 2–6) [31].
Table 2
Bivariate analysis
| CTRL v TAC | CTRL v SIR | CTRL v CySp | SIR v TAC | CySp v TAC | |||||||||||||||||
| Category | Variable | OR | 95% CI | p | n | OR | 95% CI | p | n | OR | 95% CI | p | n | OR | 95% CI | p | n | OR | 95% CI | p | n |
| Age | Current | 1.10 | 1.10–1.10 | <0.001 | 147832 | 1.10 | 1.07–1.13 | <0.001 | 8716 | 1.10 | 1.08–1.11 | <0.001 | 36076 | 1.09 | 1.05–1.12 | <0.001 | 8716 | 1.10 | 1.08–1.11 | <0.001 | 36076 |
| First Prescription | NA | NA | NA | NA | NA | NA | NA | NA | NA | NA | NA | NA | 1.07 | 1.04–1.10 | <0.001 | 8716 | 1.07 | 1.06–1.09 | <0.001 | 36076 | |
| Sex | Male | 1.52 | 1.13–2.05 | 0.006 | 147832 | 1.31 | 0.43–4.84 | 0.653 | 8716 | 1.69 | 1.38–2.09 | <0.001 | 36076 | 2.19 | 1.29–3.94 | 0.005 | 8716 | 1.72 | 1.34–2.21 | <0.001 | 36076 |
| Race | Black | 0.74 | 0.18–1.95 | 0.600 | 147832 | 0.00 | NA | 0.988 | 8716 | 1.26 | 0.68–2.11 | 0.427 | 36076 | 1.35 | 0.33–3.71 | 0.620 | 8716 | 1.35 | 0.67–2.43 | 0.360 | 36076 |
| Asian | 0.00 | NA | 0.969 | 147832 | 0.00 | NA | 0.997 | 8716 | 2.30 | 0.97–4.55 | 0.032 | 36076 | 0.00 | NA | 0.981 | 8716 | 1.39 | 0.34–3.68 | 0.573 | 36076 | |
| White | 1.51 | 1.08–2.08 | 0.014 | 147832 | 0.55 | 0.09–2.06 | 0.440 | 8716 | 1.52 | 1.23–1.87 | <0.001 | 36076 | 2.14 | 1.33–3.40 | 0.002 | 8716 | 1.54 | 1.20–1.96 | 0.001 | 36076 | |
| Ethnicity | Not Hispanic or Latino | 0.85 | 0.40–2.23 | 0.717 | 147832 | 0.00 | NA | 0.986 | 8716 | 0.85 | 0.52–1.51 | 0.550 | 36076 | 1.59 | 0.48–9.87 | 0.527 | 8716 | 0.73 | 0.42–1.36 | 0.276 | 36076 |
| Unknown | 0.71 | 0.34–1.81 | 0.408 | 147832 | 0.48 | 0.10–8.84 | 0.487 | 8716 | 0.58 | 0.36–1.03 | 0.043 | 36076 | 0.89 | 0.27–5.45 | 0.867 | 8716 | 0.46 | 0.27–0.86 | 0.008 | 36076 | |
| TBI (S06) | 5.44 | 3.12–8.81 | <0.001 | 147832 | 5.77 | 0.89–21.6 | 0.023 | 8716 | 2.87 | 1.94–4.09 | <0.001 | 36076 | 5.00 | 2.39–9.40 | <0.001 | 8716 | 3.35 | 2.18–4.93 | <0.001 | 36076 | |
Statistical analysis of each variable within the propensity-score matched cohorts. Chi-squared tests were used for categorical variables and logistic regression was used for continuous variables (age). *OR, odds ratio; CI, confidence interval; NA, not applicable.
Table 3
Logistic regression analysis
| CTRL v TAC | CTRL v SIR | CTRL v CySp | SIR v TAC | CySp v TAC | |||||||||||
| Type | OR | 95% CI | p | OR | 95% CI | p | OR | 95% CI | p | OR | 95% CI | p | OR | 95% CI | p |
| Unmatched | 1.68 | 1.52–1.86 | <0.001 | 1.10 | 0.83–1.50 | 0.521 | 1.28 | 1.09–1.52 | 0.003 | 1.52 | 1.12–2.03 | 0.005 | 1.31 | 1.10–1.54 | 0.002 |
| Matched | 1.84 | 1.65–2.06 | <0.001 | 1.26 | 0.86–1.86 | 0.242 | 1.44 | 1.18–1.76 | <0.001 | 1.63 | 1.03–2.62 | 0.040 | 1.36 | 1.08–1.72 | 0.010 |
| Conditional Matched | 1.84 | 1.64–2.06 | <0.001 | 1.26 | 0.86–1.84 | 0.245 | 1.44 | 1.18–1.76 | <0.001 | 1.62 | 1.02–2.57 | 0.041 | 1.36 | 1.08–1.71 | 0.010 |
Logistic regression analyses between cohorts. Unmatched: analysis performed in unmatched cohorts; matched: analysis performed in matched cohorts; conditional –matched: analysis performed in matched cohorts, with conditional logistic regression. *OR, odds ratio; CI, confidence interval.
Fig. 2
The general population has an increased risk of Parkinson’s disease compared to patients prescribed tacrolimus. Competing risk regression analysis of PD and death between patients prescribed tacrolimus or in the general population-like control. Patients in the general population-like control have an increased risk of PD but a decreased risk of death. n = 73,916 patients/cohort *CRR, competing risk regression; HR, hazard ratio; CI, confidence interval.
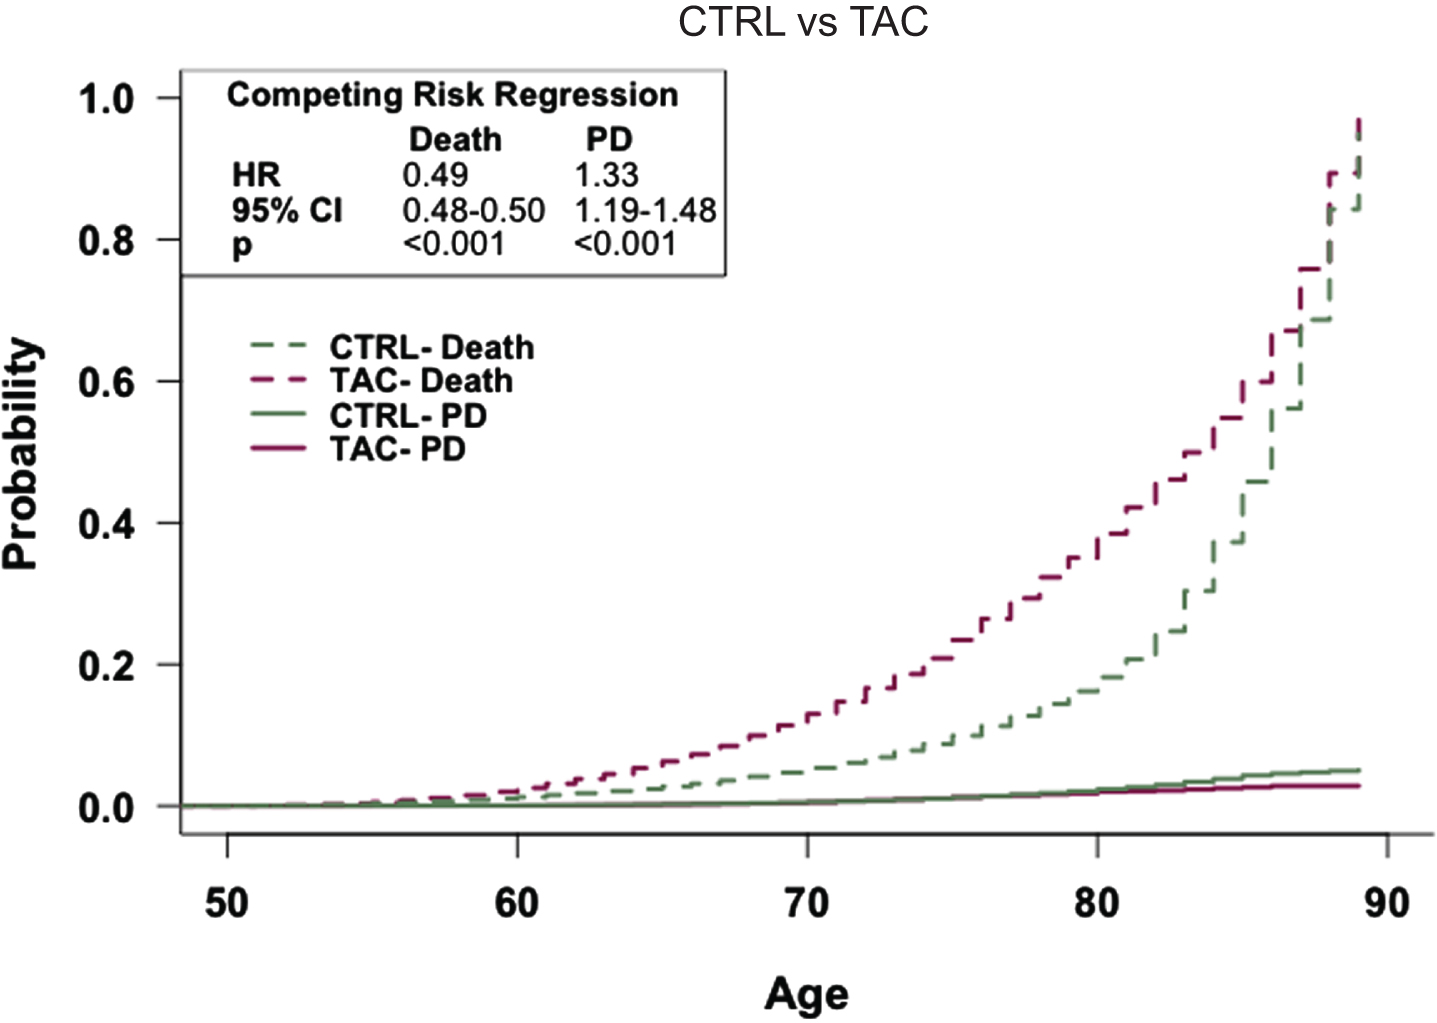
Fig. 3
The general population has an increased risk of Parkinson’s disease compared to patients prescribed cyclosporine. Competing risk regression analysis of PD and death between patients prescribed cyclosporine or in the general population-like control. Patients in the general population-like control have an increased risk of PD but a decreased risk of death. n = 18,038 patients/cohort *CRR, competing risk regression; HR, hazard ratio; CI, confidence interval.
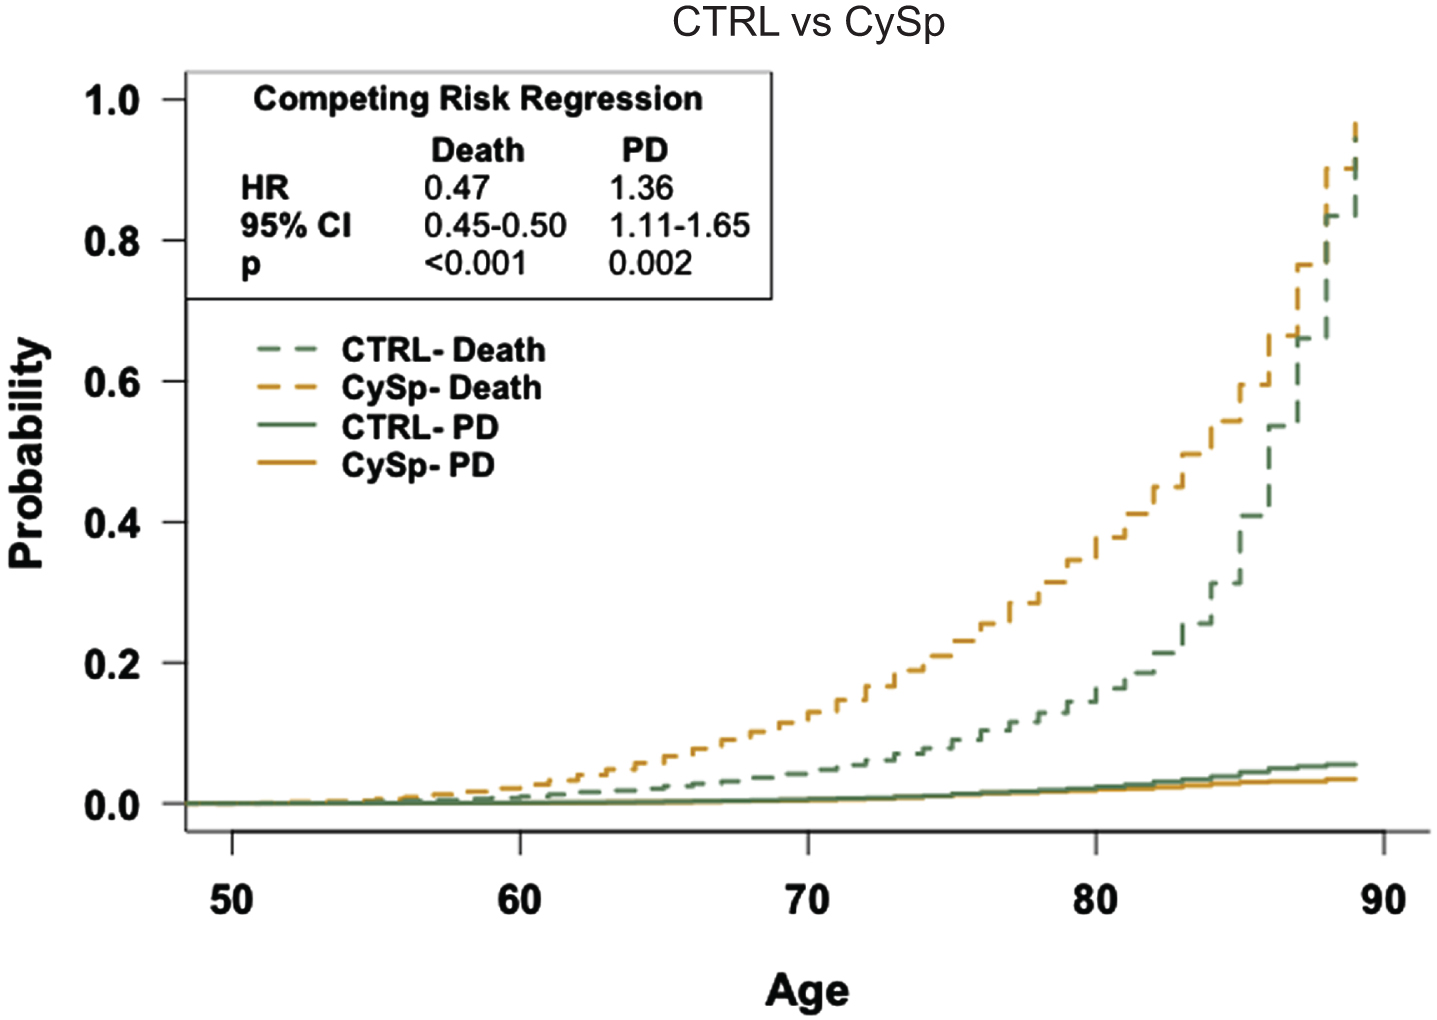
Fig. 4
The general population has an equal risk of Parkinson’s disease compared to patients prescribed sirolimus. Competing risk regression analysis of PD and death between patients prescribed sirolimus or in the general population-like control. Patients in the general population-like control have no difference in risk of PD but a decreased risk of death. n = 4,358 patients/cohort *CRR, competing risk regression; HR, hazard ratio; CI, confidence interval.
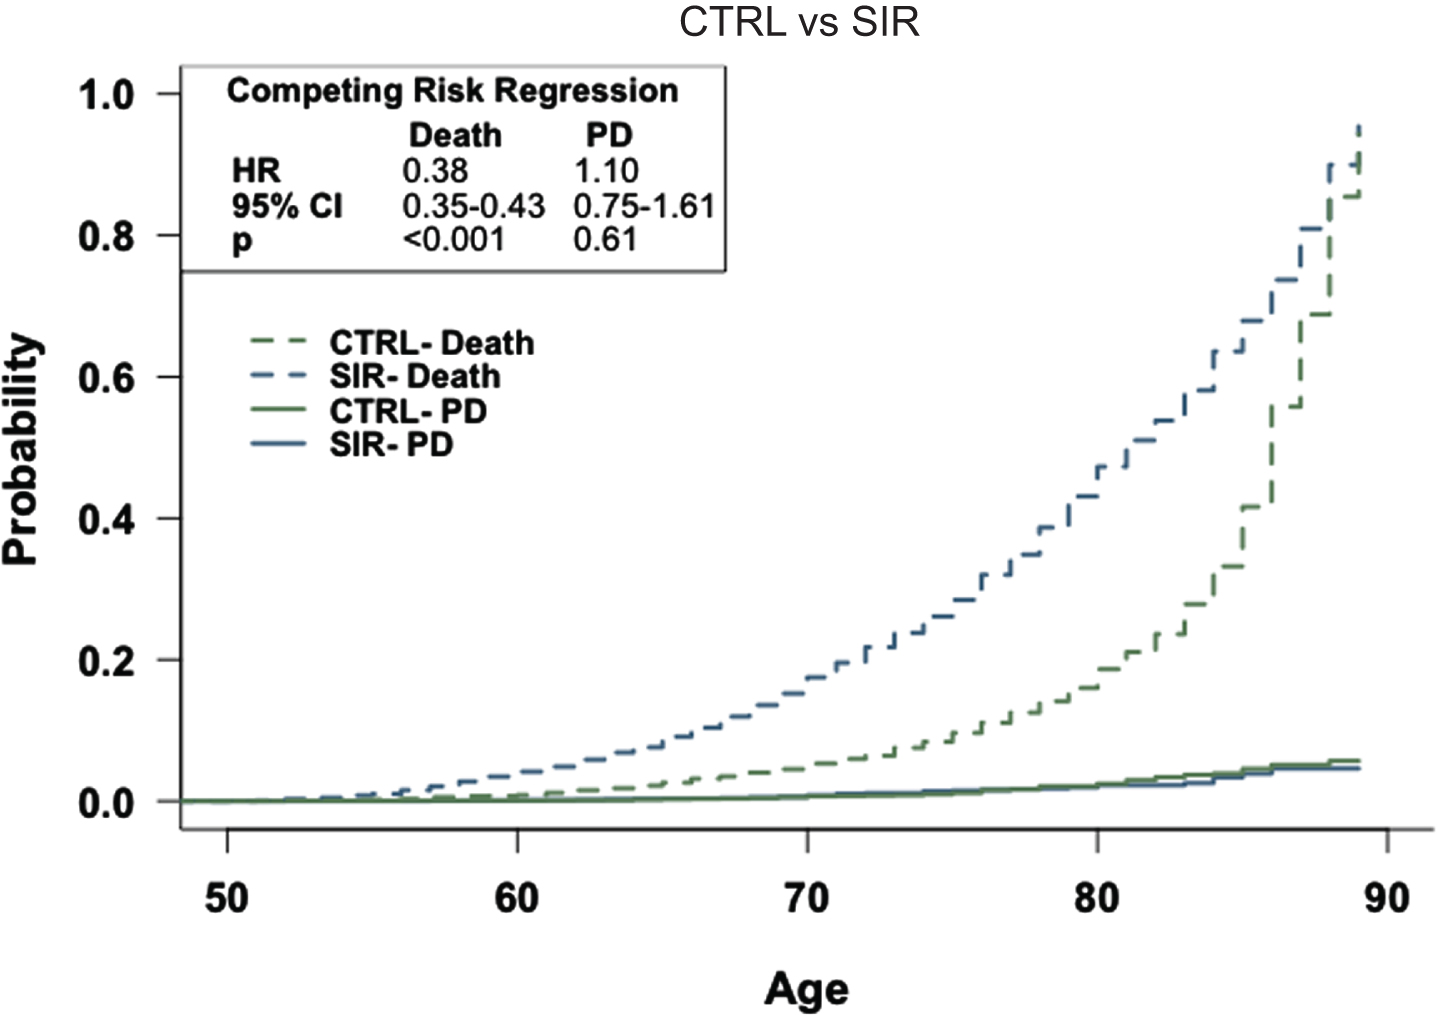
Fig. 5
Patients prescribed cyclosporine have an increased risk of Parkinson’s disease relative to patients prescribed tacrolimus. Competing risk regression analysis of PD and death between patients prescribed cyclosporine or tacrolimus. Patients prescribed cyclosporine have an increased risk of PD and death. n = 18,038 patients/cohort *CRR, competing risk regression; HR, hazard ratio; CI, confidence interval.
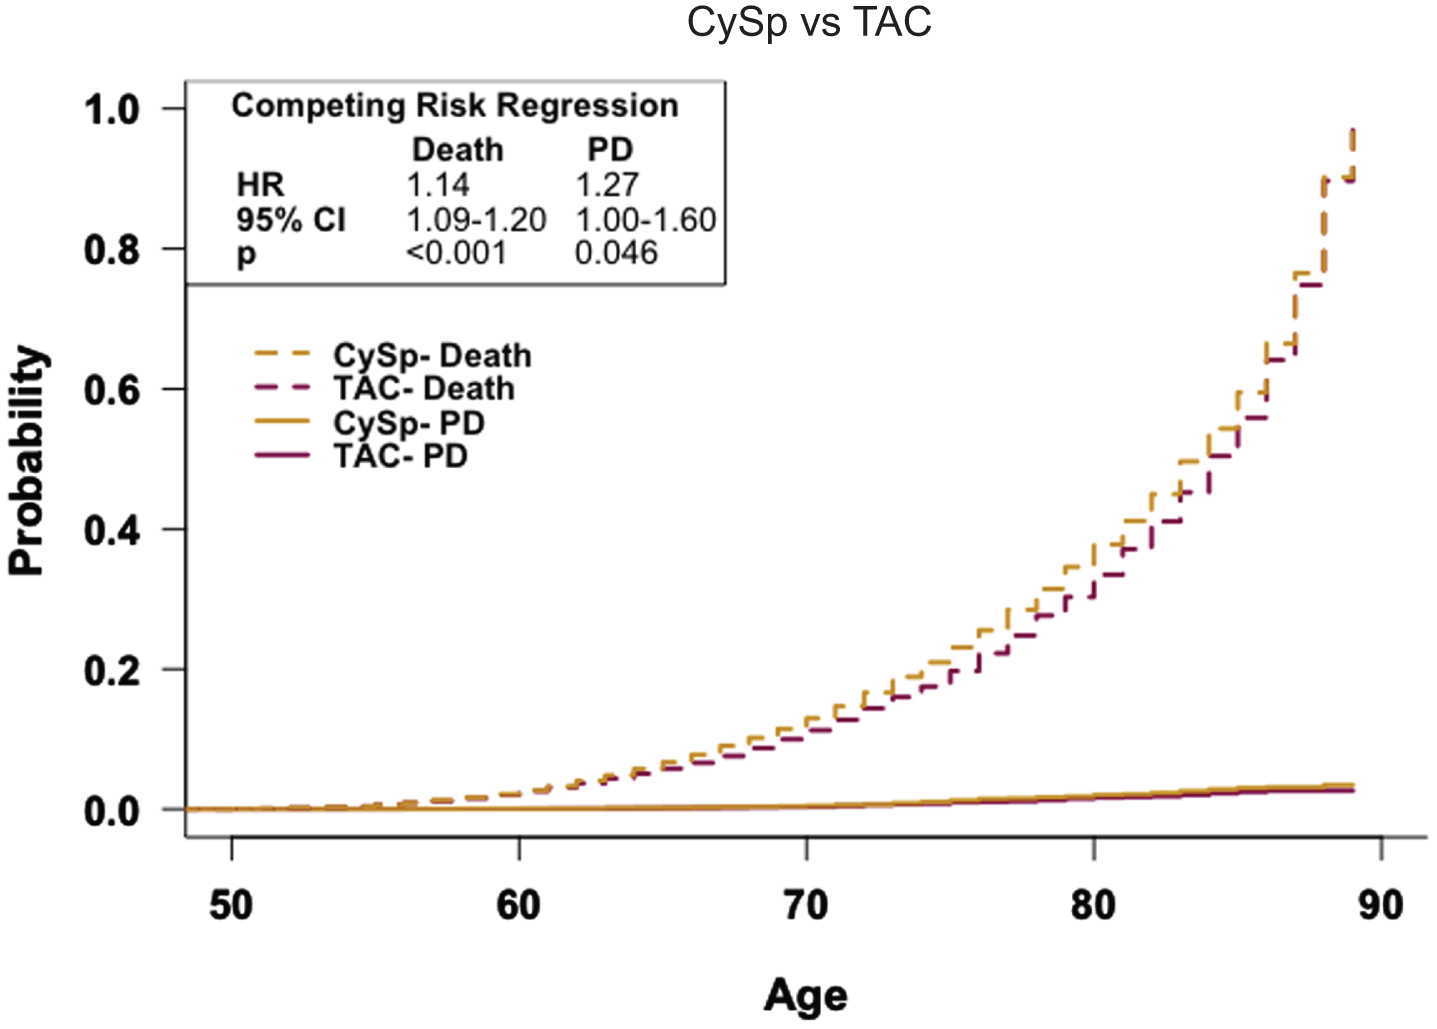
Fig. 6
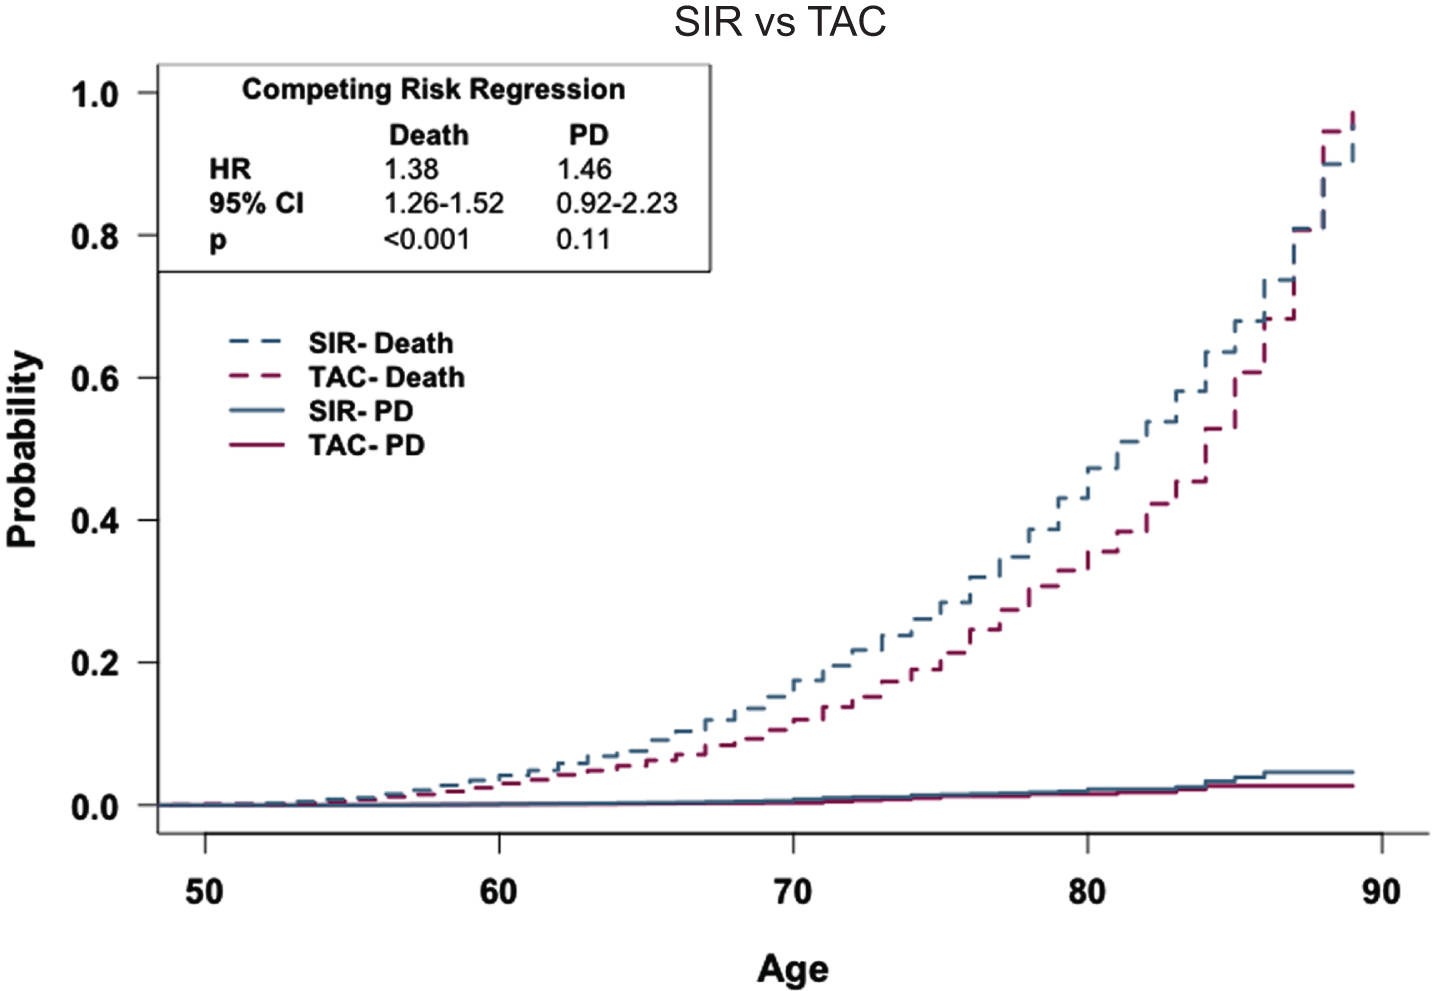
Patients prescribed sirolimus have a similar risk of Parkinson’s disease compared to patients prescribed tacrolimus. Competing risk regression analysis of patients prescribed sirolimus or tacrolimus. Patients prescribed sirolimus have a similar risk of PD but an increased risk of death. n = 4,358 patients/cohort *CRR, competing risk regression; HR, hazard ratio; CI, confidence interval.
RESULTS
Study population
The study included 194,753 adults aged 60 and older. This comprised 73,916 from the CTRL cohort, 98,442 from the TAC cohort, 18,038 from the CySp cohort, and 4,358 from the SIR cohort. Across the total population, the mean age was 71.7, with 54.7% being male. The recorded prescribed doses of each drug were as follows: TAC— 0.5, 0.75, 1, 4, or 5 mg, CySp— 25, 50, or 100 mg, and SIR— 0.5, 1, or 2 mg, and the average duration of prescription was approximately 3 years for each drug. Prior to propensity-score matching, PD prevalence was 1.2% for the CTRL cohort, 0.7% for the TAC cohort, 0.9% for the CySp cohort, and 1.1% in the SIR cohort. Following matching, all cohorts were balanced, reflected by an SMD under 0.1 for matched variables (Table 1). Bivariate analyses (Table 2) were executed on these matched cohorts to identify PD risk factors. Current age, index age (where applicable), and TBI influence the likelihood of a PD diagnosis. Males face higher PD diagnosis risks, except in the combined SIR and CTRL cohorts (Table 2). Logistic regression analyses (Table 3) highlight the impact of drug prescription on PD diagnosis, prompting deeper analysis, with detailed results provided in subsequent sections.
General population-like control
Using propensity-score matching, the CTRL cohort was aligned with the TAC, CySp, and SIR cohorts. Since patients in the CTRL cohort had never been prescribed a drug of interest, index age was not factored for these matched cohorts. When matched to the TAC cohort, both cohorts contain 73,916 patients, with an average current age of 73.0 for the CTRL cohort and 70.5 for the TAC cohort. PD prevalence is 1.2% in the CTRL cohort and 0.7% in the TAC cohort. When matched to the CySp cohort, each cohort contains 18,038 patients, with an average current age of 73.3 for the CTRL cohort and 72.4 for the CySp cohort. PD prevalence is 1.3% in the CTRL cohort and 0.9% in the CySp cohort. When matched to the SIR cohort, the cohorts contain 4,358 patients each, with an average current age of 73.3 for the CTRL cohort and 71.9 for the SIR cohort. pD prevalence is 1.4% in the CTRL cohort and 1.1% in the SIR cohort.
Logistic regression results (Table 3) indicate that patients in the CTRL cohorts are more likely to be diagnosed with PD than those in the TAC or CySp cohorts. This holds true both in unmatched cohorts and those matched by propensity scores, as well as in conditional logistic regression analyses. However, when the CTRL cohort is compared to the SIR cohort, the odds of a PD diagnosis appear similar. To assess if age affects the rate of PD occurrence while factoring in death, competing risk curves were generated for each pair (Figs. 2–4). From these analyses, it is revealed that patients in the CTRL cohorts have a heightened PD risk compared to those in the TAC or CySp cohorts. However, no difference is observed when comparing the CTRL cohort to the SIR cohort. The competing risk regressions also indicate that patients in the CTRL cohorts have a diminished likelihood of death precluding a PD diagnosis relative to all other cohorts.
Cyclosporine vs. tacrolimus
After propensity-score matching, both the CySp and TAC cohorts contain 18,038 patients. Among these matched cohorts, the average current age is 72.4 in the CySp cohort and 72.0 in the TAC cohort, with both having an average index age of 64.4. Bivariate analyses (Table 2) of the combined cohorts indicate that both current (OR: 1.10, 95% CI: 1.08–1.11) and index (OR: 1.07, 95% CI: 1.06–1.09) ages influence the odds of a PD diagnosis. Males in these cohorts have greater odds of a PD diagnosis, and race and ethnicity appear to impact odds of a PD diagnosis when contrasting the CySp cohort with the TAC cohort.
In the propensity-score matched cohorts, the PD prevalence is 0.9% in the CySp cohort and 0.7% in the TAC cohort. Unconditional logistic regressions (Table 3) suggest that patients prescribed CySp have greater odds of a PD diagnosis relative to those prescribed TAC, in both unmatched (OR: 1.31, 95% CI: 1.10–1.54) and matched (OR: 1.36, 95% CI: 1.08–1.72) cohorts. Similarly, conditional analysis (Table 3) identifies greater odds of a PD diagnosis in the CySp cohort compared to the TAC cohort (OR: 1.36, 95% CI: 1.08–1.71).
To assess if PD occurrence varies between these cohorts when factoring in age and death, a competing risk curve was analyzed (Fig. 5). The competing risk regression indicates a pronounced risk of PD for the CySp cohort compared the TAC cohort (HR: 1.27, 95% CI: 1.00–1.60). Additionally, the CySp cohort has an increased risk of earlier death relative to the TAC cohort (HR: 1.14, 95% CI: 1.09–1.20).
Sirolimus vs. tacrolimus
Upon propensity-score matching, both the SIR and TAC cohorts contain 4,358 patients. Within these matched cohorts, the average current age is 71.9 for the SIR cohort and 71.0 for the TAC cohort, with an average index age of 63.6 for both. Bivariate analyses (Table 2) of the merged SIR and TAC cohorts indicate that both current (OR: 1. 09, 95% CI: 1.05–1.12) and index (OR: 1.07, 95% CI: 1.04–1.10) ages influence the probability of a PD diagnosis. Additionally, male patients and those with TBI have increased odds of PD diagnosis, while race, but not ethnicity, appears to affect the odds of PD diagnosis within these cohorts. More details can be found in Table 2.
PD prevalence in the matched cohorts is 1.1% in the SIR cohort and 0.7% in the TAC cohort. Unconditional logistic regression (Table 3) reveals that patients in the SIR cohort have a higher likelihood of a PD diagnosis relative to those in the TAC cohort, and this holds true for both the unmatched and the propensity-score matched cohorts. Furthermore, the conditional logistic regression analysis (Table 3), which considers the pairs generated by propensity-score matching, indicates increased odds of a PD diagnosis in the SIR cohort relative to the TAC cohort.
To explore whether the incidence rate of PD varies between these cohorts based on age, while also accounting for mortality, a competing risk curve was produced and analyzed with a competing risk regression (Fig. 6). Although no significant difference in PD diagnosis risk emerges between the two cohorts when factoring in these variables, patients in the SIR cohort displayed a more pronounced risk of earlier death relative to those in the TAC cohort (HR: 1.38, 95% CI: 1.26–1.52).
DISCUSSION
PD remains a complex neurodegenerative disorder with limited therapeutic options. In this nationwide study focusing on patients aged 60 years and over, we investigated the potential of immunosuppressants with distinct mechanisms to alter the prevalence of PD. Within our study, the prevalence of PD ranges from 0.7–1.4% in propensity-score matched cohorts. Unsurprisingly, age and TBI occurrence influence PD odds in all cohorts, and in most cohorts, males have greater odds of PD diagnosis.
General population-like control
To assess the ability of each drug to reduce the probability of a subsequent PD diagnosis compared to the general population, we propensity-score matched each drug cohort to its respective CTRL cohort. Propensity-score matching ensures that the groups are balanced on covariates, minimizing potential confounding and allowing more accurate estimations of drug effects. Our results suggest that patients prescribed either of the two CNIs have a decreased risk of a subsequent PD diagnosis relative to the general population. However, our results also suggest that general immunosuppression alone is inadequate to reduce the prevalence of PD, since patients prescribed SIR showed no difference in PD diagnoses compared to CTRL.
The CTRL group, sourced from the TriNetX Diamond Network, which contains records from primary care visits, represents a broad patient demographic, mirroring the general US population. While this group might not exemplify a perfectly “healthy” control due to its potential health diversity, this variability represents a strength. A purely “healthy” control does not reflect the nuances of the general population. Our CTRL captures the intricacies of community health, providing a realistic sample. Despite the above potential reservations, the diverse cohort ensures our study’s findings are both relevant and widely applicable [26].
Taken together, our data underscore the potential of CNIs as a viable drug repurposing strategy for PD. This finding is supported by various studies that have evaluated the effects of CaN in PD. For instance, our own preclinical studies demonstrate the ability of CaN inhibition with TAC to reverse synaptic and neuronal insults induced by the toxic α-synuclein oligomers that are recognized as major players in PD neuropathology [4]. Beyond modulating inflammation, CaN is involved in long-term potentiation (LTP), neurotransmission, autophagy, and apoptosis, all of which are impaired in PD [1, 7]. LTP is a form of synaptic plasticity that is crucial for learning and memory. Hyperactive CaN reduces synaptic strength and neuronal activity and impairs LTP [7]. Disrupted LTP can lead to cognitive deficits, a non-motor symptom of PD. CaN also plays a role in the proper functioning of neurotransmission. In PD, dopamine transmission is impaired, leading to the hallmark motor symptoms of the disease. Normalizing CaN activity may aid in restoring dopamine neurotransmission to mitigate disease severity [13]. Autophagy, the process of removing and recycling damaged cell components, is impaired in PD, leading to accumulation of toxic substances which contributes to neuronal dysfunction and death. CNIs are known autophagy inducers, and restoring autophagy is a potential mechanism to clear toxic α-synuclein, representing a potential mechanism to clear PD-related pathology [1, 32, 33].
However, it is important to consider the potential risks associated with the use of immunosuppressants, such as TAC and CySp. In the context of repurposing these drugs for PD, it is essential to weigh their protective effects against PD symptoms with the inherent risks, particularly increased infection rates due to immunosuppression. Importantly, the dose-dependent nature of these drugs’ immunosuppressive effects suggests that lower, sub-immunosuppressive doses could potentially offer PD benefits while minimizing adverse risks. Future research should explore these dosing strategies and investigate localized delivery methods, such as intranasal administration, to enhance CNS drug delivery and limit systemic side effects.
Competing risk regression analyses indicate that patients prescribed TAC, CySp, or SIR have a higher likelihood of earlier death than the CTRL cohorts (Figs. 2–4). Patients are typically prescribed TAC, CySp, or SIR following a solid organ transplant, so they might have poorer overall health than patients in the CTRL cohort. Thus, their earlier death is not surprising. There is a 7% and 9% difference in deaths between the CySp and SIR cohorts compared to CTRL, respectively, while the TAC cohort’s difference is less than 1%, boosting our confidence in these results. Furthermore, it is noteworthy that certain conditions leading to kidney transplants, the most common solid organ transplant, such as chronic kidney disease, have a tentative association with PD, leading to the expectation of an increased PD risk in patients prescribed TAC and CySp [34]. Contrarily, our findings indicate a reduced risk of PD in these patients, further supporting the predicted protective effect of CNIs on PD. Importantly, given the variations in patient counts across the cohorts, CTRL groups differ in each comparison. For instance, the patients that make up the CTRL cohort in TAC vs. CTRL are not necessarily identical to patients that make up SIR vs. CTRL. Therefore, direct drug comparisons should reference the respective analyses, avoiding cross-cohort assumptions.
Cyclosporine vs. tacrolimus
Our study suggests that patients prescribed TAC exhibit a decreased prevalence of PD relative to those prescribed CySp. TAC and CySp both trigger immunosuppression by binding to immunophilins and inhibiting CaN, however, their differences lie in their ability to access and persist in the brain. TAC is known to effectively cross the blood-brain barrier, whereas CySp gets sequestered within cerebral endothelial cells, rendering it ineffective in the brain [23, 24]. Given the peripheral manifestations of prodromal PD, such as α-synuclein accumulation within the gut that potentially progresses to the brain via the vagus nerve, these findings do not contradict the results of the CySp vs. CTRL comparison [35]. Both the brain-penetrant and peripherally-restricted CNIs reduce the prevalence of PD compared to the general population. However, our findings that patients prescribed TAC have a reduced prevalence of PD compared to patients prescribed CySp suggest that the brain-penetrant CNI is more effective. This observation aligns well with the established roles of CaN in various neuronal processes pertinent to PD, as discussed above.
Sirolimus vs. tacrolimus
Our results reveal that patients prescribed TAC have a reduced prevalence of PD compared to patients prescribed SIR. Both drugs are immunosuppressants, albeit by distinctly different mechanisms. As previously mentioned, TAC inhibits CaN preventing activation of immune response genes, while SIR inhibits mTOR, thereby hindering cell cycle progression and proliferation [14]. While immunosuppression likely contributes to reducing the prevalence of PD, TAC’s additional effects, as previously discussed, make it a more potent preventative agent. It is also worth noting that while both SIR and TAC act as autophagy inducers, SIR only initiates autophagy. In contrast, TAC not only initiates but also sustains autophagy, likely enhancing its potential role in modulating PD risk [26, 32, 36]. This difference is crucial, as excessive induction of autophagy without efficient lysosomal degradation can lead to cell death, rather than promoting clearance of misfolded proteins [37]. However, the observed contrast in PD risk between these cohorts becomes less pronounced and non-significant when considering both deaths and time as influencing factors (Fig. 6; p = 0.11). This underscores the complexity of evaluating PD prevention, as deaths can preclude diagnosis and influence the interpretation of results. For instance, the possibility that a greater number of PD cases could have developed among SIR patients if they had survived further underscores the multifaceted nature of these outcomes. Thus, while our findings point towards TAC’s superiority in PD prevention, further longitudinal studies with larger cohorts are essential to conclusively delineate differences between the ability of these drugs to prevent PD.
This study has several limitations, including dependency on the accuracy of EHR data entry, with significant demographics like race or ethnicity often unrecorded, potentially affecting the analysis of PD prevalence and risk factors and limiting result generalizability. For example, patients whose race or ethnicity was designated as ‘Unknown’ could be paired during propensity-score matching while in reality their race and ethnicity may not be identical, introducing potential bias. PD identification was solely based on ICD codes, raising concerns about misdiagnosis and non-inclusion of disease severity or symptom duration— factors that can influence outcomes. The analysis was restricted to claims and EHR data from the TriNetX Diamond Network, which, while providing a rich set of longitudinal data for healthcare trends and treatment effectiveness, excludes non-claim data like over-the-counter medication and lifestyle factors that could impact PD risk. Such databases, important for global health research, may not capture clinical nuances and are subject to biases like selection bias due to their reliance on claimed healthcare encounters. The retrospective design and propensity-score matching cannot replicate the control of randomized trials and may leave unmeasured confounders. Additionally, while prescription data does not confirm drug adherence, the nature of the medications in this study— commonly used to prevent organ rejection— suggests high patient compliance. Despite these limitations, the study’s use of TriNetX data offers valuable insights into the potential impact of immunosuppressants on PD prevalence, underscoring the importance of comprehensive data collection and prospective study designs for future research.
Conclusion
Our results expand upon our previous study that used this dataset to evaluate dementia prevalence in patients prescribed CNIs relative to the general population [26]. Overall, our results reveal that CNIs, particularly TAC, decrease the prevalence of PD in large, nationwide cohorts, reinforcing findings from various preclinical studies. Given the escalating global burden of Parkinson’s disease and the limited therapeutic interventions available, the repurposing of CNIs, especially TAC, offers an urgent and promising avenue for exploration. The complex mechanisms of TAC likely operate in tandem to prevent and potentially treat PD. These observations support our hypothesis regarding TAC’s preventative role in PD, warranting further investigation into its potential therapeutic application for PD and related neurodegenerative disorders.
ACKNOWLEDGMENTS
We thank The University of Texas Medical Branch Institute for Translational Sciences for making the TriNetX platform available to us through the Clinical and Translational Science Award. We thank Drs. George Golovko and Kamil Khanipov for helping us obtain and manage the downloaded TriNetX datasets. We also thank China Smith, PA-C for her technical copyediting of this manuscript.
FUNDING
This study was supported by NIH/NIA grant R01-AG060718-01A1 to GT. This study was also partially funded by the NCATS/NIH grant UL1-TR001439 to the UTMB Institute of Translational Sciences. The content is solely the responsibility of the authors and does not necessarily represent the official views of the NIH.
CONFLICT OF INTEREST
The authors have no conflict of interest to report.
DATA AVAILABILITY
The data downloaded from the TriNetX Diamond Network can be accessed by submitting a request to TriNetX (https://live.trinetx.com). However, be aware that there may be associated costs, a data sharing agreement is mandatory, and no patient identifiable information can be obtained.
SUPPLEMENTARY MATERIAL
[1] The supplementary material is available in the electronic version of this article: https://dx.doi.org/10.3233/JPD-230313.
REFERENCES
[1] | Poewe W , Seppi K , Tanner CM , Halliday GM , Brundin P , Volkmann J , Schrag AE , Lang AE ((2017) ) Parkinson disease. Nat Rev Dis Primers 3: , 1–21. |
[2] | Poewe W ((2008) ) Non-motor symptoms in Parkinson’s disease. J Neurol 15: , 14–20. |
[3] | Gouda NA , Elkamhawy A , Cho J ((2022) ) Emerging therapeutic strategies for Parkinson’s disease and future prospects: A 2021 update. Biomedicines 10: , 371. |
[4] | Martin Z , Neugebauer V , Dineley K , Kayed R , Zhang W , Reese L , Taglialatela G ((2012) ) a-Synuclein oligomers oppose LTP and impair memory through a calcineurin-dependent mechanism. J Neurochem 120: , 440–452. |
[5] | Furman JL , Norris CM ((2014) ) Calcineurin and glial signaling: Neuroinflammation and beyond. J Neuroinflammation 11: , 158. |
[6] | Reese LC , Taglialatela G ((2010) ) Neuroimmunomodulation by calcineurin in aging and Alzheimer’s disease. Aging Dis 1: , 245. |
[7] | Saraf J , Bhattacharya P , Kalia K , Borah A , Sarmah D , Kaur H , Dave KR , Yavagal DR ((2018) ) A friend or foe: Calcineurin across the gamut of neurological disorders. Cent Sci 4: , 805–819. |
[8] | Caraveo G , Soste M , Cappelleti V , Fanning S , Van Rossum DB , Whitesell L , Huang Y , Chung CY , Baru V , Zaichick S , Picotti P , Lindquist S ((2017) ) FKBP12 contributes to α-synuclein toxicity by regulating the calcineurin-dependent phosphoproteome. Proc Natl Acad Sci U S A 114: , E11313–E11322. |
[9] | Ueda J , Uemura N , Ishimoto T , Taguchi T , Sawamura M , Nakanishi E , Ikuno M , Matsuzawa S , Yamakado H , Takahashi R ((2023) ) Ca2+-calmodulin-calcineurin signaling modulates α-synuclein transmission. Disord 38: , 1056–1067. |
[10] | Caraveo G , Auluck PK , Whitesell L , Chung CY , Baru V , Mosharov EV , Yan X , Ben-Johny M , Soste M , Picotti P , Kim H , Caldwell KA , Caldwell GA , Sulzer D , Yue DT , Lindquist S ((2014) ) Calcineurin determines toxic versus beneficial responses to α-synuclein. Proc Natl Acad Sci U S A 111: , E3544. |
[11] | Mondal R , Banerjee C , Nandy S , Roy M , Chakraborty J ((2023) ) Calcineurin inhibition protects against dopamine toxicity and attenuates behavioral decline in a Parkinson’s disease model. Cell Biosci 13: , 1–18. |
[12] | Luo J , Sun L , Lin X , Liu G , Yu J , Parisiadou L , Xie C , Ding J , Cai H ((2014) ) A calcineurin- and NFAT-dependent pathway is involved in α-synuclein-induced degeneration of midbrain dopaminergic neurons. Hum Mol Genet 23: , 6567. |
[13] | Wera S , Neytst J ((1994) ) Calcineurin as a possible new target for treatment of Parkinson’s disease. Med Hypotheses 43: , 132–134. |
[14] | Cardenas ME , Zhu D , Heitman J ((1995) ) Molecular mechanisms of immunosuppression by cyclosporine, FK506, and rapamycin. Opin Nephrol Hypertens 4: , 472–477. |
[15] | Wishart DS , Feunang YD , Guo AC , Lo EJ , Marcu A , Grant JR , Sajed T , Johnson D , Li C , Sayeeda Z , Assempour N , Iynkkaran I , Liu Y , MacIejewski A , Gale N , Wilson A , Chin L , Cummings R , Le Di , Pon A , Knox C , Wilson M ((2018) ) DrugBank 5.0: A major update to the DrugBank database for 2018. Nucleic Acids Res 46: , D1074–D1082. |
[16] | Lexicomp (2023) Tacrolimus (systemic): Drug information. In UpToDate. |
[17] | Abdul HM , Sama MA , Furman JL , Mathis DM , Beckett TL , Weidner AM , Patel ES , Baig I , Murphy MP , Levine H , Kraner SD , Norris CM ((2009) ) Cognitive decline in Alzheimer’s disease is associated with selective changes in calcineurin/NFAT signaling. Dis 29: , 12957–12969. |
[18] | JL M ((1999) ) Sirolimus approved with renal transplant indication. Am J Health Syst Pharm 56: , 2177–2178. |
[19] | Suthanthiran M , Morris RE , Strom TB ((1996) ) Immunosuppressants: Cellular and molecular mechanisms of action. Am J Kidney Dis 28: , 159–172. |
[20] | Lexicomp (2023) Cyclosporine (ciclosporin) (systemic): Drug information. In UpToDate. |
[21] | Lexicon (2023) Sirolimus (conventional): Drug information. In UpToDate. |
[22] | Abraham RT , Wiederrecht GJ ((2003) ) Immunopharmacology of rapamycin. }. Rev Immunol 14: , 483–510. |
[23] | Murakami Y , Takamatsu H , Noda A , Osoda K , Ichise R , Tatsumi M , Tabata K , Sawamoto T , Nishimura S ((2004) ) Pharmacokinetic animal PET study of FK506 as a potent neuroprotective agent. J Nucl Med 45: , 1946–1949. |
[24] | Begley DJ , Squires LK , Zloković BV , Mitrović DM , Hughes CCW , Revest PA , Greenwood J ((1990) ) Permeability of the blood-brain barrier to the immunosuppressive cyclic peptide cyclosporin A. J Neurochem 55: , 1222–1230. |
[25] | Ashburn TT , Thor KB ((2004) ) Drug repositioning: Identifying and developing new uses for existing drugs. Nat Rev Drug Discov 3: , 673–683. |
[26] | Silva JD , Taglialatela G , Jupiter DC ((2023) ) Reduced prevalence of dementia in patients prescribed tacrolimus, sirolimus, or cyclosporine. J Alzheimers Dis 95: , 585–597. |
[27] | Santos-García D , de Deus Fonticoba T , Cores Bartolomé C , Feal Painceiras MJ , García Díaz I , Íñiguez Alvarado MC , Paz JM , Jesús S , Cosgaya M , García Caldentey J et al. ((2023) ) Cognitive impairment and dementia in young onset Parkinson’s disease. J Neurol 270: , 5793–5812. |
[28] | Ho DE , Imai K , King G , Stuart EA ((2011) ) MatchIt: Nonparametric preprocessing for parametric causal inference. J Stat Softw 42: , 1–28. |
[29] | Randolph J , Falbe K ((2014) ) A step-by-step guide to propensity score matching in R. }. Assess Res Eval 19: , 1–6. |
[30] | R Core Team (2022) R: A language and environment for statistical computing. |
[31] | Sjoberg DD , Fei T (2022) tidycmprsk: Competing Risks Estimation. |
[32] | Nakagaki T , Satoh K , Ishibashi D , Fuse T , Sano K , Kamatari YO , Kuwata K , Shigematsu K , Iwamaru Y , Takenouchi T , Kitani H , Nishida N , Atarashi R ((2013) ) FK506 reduces abnormal prion protein through the activation of autolysosomal degradation and prolongs survival in prion-infected mice. Autophagy 9: , 1386–1394. |
[33] | Kim HS , Choi S Il , Jeung EB , Yoo YM ((2014) ) Cyclosporine A induces apoptotic and autophagic cell death in rat pituitary GH3 cells. One 9: , e108981. |
[34] | Kwon MJ , Kim JK , Kim JH , Kim JH , Kim MJ , Kim NY , Choi HG , Kim ES ((2023) ) Exploring the link between chronic kidney disease and Parkinson’s disease: Insights from a longitudinal study using a national health screening cohort. Nutrients 15: , 3205. |
[35] | Braak H , De Vos RAI , Bohl J , Del Tredici K ((2006) ) Gastric alpha-synuclein immunoreactive inclusions in Meissner’s and Auerbach’s plexuses in cases staged for Parkinson’s disease-related brain pathology. Lett 396: , 67–72. |
[36] | Zhou J , Tan SH , Nicolas V , Bauvy C , Yang Di N , Zhang J , Xue Y , Codogno P , Shen HM ((2013) ) Activation of lysosomal function in the course of autophagy via mTORC1 suppression and autophagosome-lysosome fusion. Cell Res 23: , 508–523. |
[37] | Lynch-Day MA , Mao K , Wang K , Zhao M , Klionsky DJ ((2012) ) The role of autophagy in Parkinson’s disease. Cold Spring Harb Perspect Med 2: , a009357. |


