
Predicting the Prognosis of Multiple System Atrophy Using Cluster and Principal Component Analysis
Abstract
Background:
Multiple system atrophy (MSA) is an intractable neurodegenerative disorder with poorly understanding of prognostic factors.
Objective:
The purpose of this retrospective longitudinal study was to explore the main predictors of survival of MSA patients with new clinical subtypes based on cluster analysis.
Methods:
A total of 153 Chinese MSA patients were recruited in our study. The basic demographic data and motor and nonmotor symptoms were assessed. Cluster and principal component analysis (PCA) were used to eliminate collinearity and search for new clinical subtypes. The multivariable Cox regression was used to find factors associated with survival in MSA patients.
Results:
The median survival time from symptom onset to death (estimated using data from all patients by Kaplan-Meier analysis) was 6.3 (95% CI = 6.1–6.7) years. The survival model showed that a shorter survival time was associated with motor principal component (PC)1 (HR = 1.71, 95% CI: 1.26–2.30, p < 0.001) and nonmotor PC3 (HR = 1.68, 95% CI: 1.31–2.10, p < 0.001) through PCA. Four clusters were identified: Cluster 1 (mild), Cluster 2 (mood disorder-dominant), Cluster 3 (axial symptoms and cognitive impairment-dominant), and Cluster 4 (autonomic failure-dominant). Multivariate Cox regression indicated that Cluster 3 (HR = 4.15, 95% CI: 1.73–9.90, p = 0.001) and Cluster 4 (HR = 4.18, 95% CI: 1.73–10.1, p = 0.002) were independently associated with shorter survival time.
Conclusion:
More serious motor symptoms, axial symptoms such as falls and dysphagia, orthostatic hypotension, and cognitive impairment were associated with poor survival in MSA via PCA and cluster analysis.
INTRODUCTION
Multiple system atrophy (MSA) is an intractable neurodegenerative disorder characterized by various combinations of parkinsonism, cerebellar ataxia, and autonomic failure, and the prevalence of MSA is 3–5/100000 in the general population [1, 2]. Two main subtypes of MSA are MSA with predominant parkinsonism (MSA-P) and MSA with prominent cerebellar ataxia (MSA-C). The etiology of MSA is unknown, the formation of glial cytoplasmic inclusions and selected neuronal loss are mostly recognized to be related with MSA [3, 4]. The prognosis for MSA varies widely, with an average survival time of 6–10 years [5–7]. A better understanding of the prognostic factors of MSA can guide the design of therapeutic interventions to extend survival and improve the quality of life of MSA patients.
Previous studies based on medical history and chief complaints found that age of onset, MSA subtype, early falls, and early autonomic symptoms including bladder or urinary symptoms and orthostatic intolerance were associated with shorter survival [7–10]. Some other studies based on limited scales found higher Unified Multiple System Atrophy Rating Scale (UMSARS) score was associated with shorter survival [11]. Some studies based on certain or several symptoms or signs assessed by objective assessment found that the risk of death was higher in patients with rapid eye movement sleep behavior disorder (RBD), degree of autonomic failure, cold hand sign, or neurogenic lower urinary tract dysfunction [12–14]. Besides, several studies investigated autonomic dysfunction, higher UMSARS score and frequent falls at baseline were independent markers for poor survival in MSA in Chinese MSA patients [11, 13, 14]. However, whether other symptoms including cognitive impairment, mood disorder, RBD and others associated with prognosis in MSA patients, especially Chinese MSA patients was rarely reported.
At present, the research on prognostic factors of MSA mainly focuses on the evaluation of clinical scales. Besides, subjective complaints and the multicollinearity among various scales in some previous studies may affect the accuracy of these results. Thus, in this study, we performed principal component analysis (PCA) to explore the main predictors of shorter survival in Chinses MSA patients based on comprehensive motor and non-motor scales. Furthermore, we also used cluster analysis techniques to investigate clinical subtypes of MSA and its prognosis.
MATERIALS AND METHODS
Study design and clinical setting
This is a retrospective longitudinal study. A total of 153 Chinese MSA patients were recruited from the movement disorder clinic and ward at Department of Neurology, Ruijin Hospital affiliated to Shanghai Jiao Tong University School of Medicine from September 2015 to August 2018. The retrospective follow-up by telephone or face-to-face interview by our neurologists lasted until March 2022. The study protocol was approved by the Ethics Committee of Ruijin Hospital affiliated to Shanghai Jiao Tong University School of Medicine. Written informed consents were obtained from all participants in the study as well.
Participants
All patients were diagnosed as probable MSA according to MSA diagnostic consensus by senior movement disorder specialists. The inclusion criteria were as follows: a parkinsonian or cerebellar syndrome with autonomic failure on the basis of MSA diagnostic consensus [15], and ability to complete the questionnaires and physical and neurological examination. The exclusion criteria were as follows: onset under 30 or over 75 years old, history of secondary neurological or psychiatric diseases such as epilepsy, brain tumor, head trauma, stroke, dementia, cerebral small-vessel disease and so on, evidence of physical illness disturbing clinical study such as hearing or vision loss, severe cardiac or respiratory disorders.
Variables and data measurement/source
At baseline evaluation, all patients received a questionnaire comprising the basic demographic data: age, gender, disease duration, and education year. We assessed disease severity using the UMSARS [16]. UMSARS Part I was used to assess motor and autonomic disability, and Part II was used to assess motor impairment. The UMSARS Part III was used to assess orthostatic hypotension defined as drops of systolic blood pressure ≥30 mmHg and/or diastolic blood pressure ≥15 mmHg. UMSARS Part IV was used to assess the severity of disability. Non-motor symptoms were evaluated with a battery of neuropsychological tests: 1) Mini-Mental State Examination (MMSE) for cognitive function; 2) 16-item odor identification test from Sniffin’ Sticks (SS-16) for olfaction; 3) RBD Screening Questionnaire (RBDSQ) for clinical possible RBD; 4) Composite autonomic symptom score (COMPASS31) for autonomic function; 5) 17-item Hamilton Rating Scale for Depression (HAMD-17); 6) Hamilton Anxiety Scale (HAMA) for anxiety. Survival time was defined as the interval from disease onset to death or the end of follow-up (March 2022). Loss to follow-up is due to change of telephone number or refusal of follow-up evaluation.
Sample size and statistical analysis
Demographic and clinical variables were presented as frequency for categorical variables, or as the mean and standard deviation for continuous variables. One-way ANOVA and χ2 tests were used to compare between the variables or clusters.
Sample size was calculated according to Cox proportional hazards regression model [17], The formula for calculating sample size was
As significant correlations existed between scales (Supplementary Table 1), we performed PCA of the motor or nonmotor symptom scales separately at first after zero centering and scaling to avoid collinearity. Principal components (PCs) whose eigenvalue exceed 1 retained. The contributions of variables to the PCs are illustrated in Supplementary Table 2. An eigenvector of independent variable was considered as large if its absolute value exceeded 0.3. Agglomerative hierarchical clustering with Ward error sum of squares algorithm was used for cluster analysis. The PCs selected in PCA analysis were imputed in multiple hierarchical cluster analyses using the Euclidian distance. The optimal number of clusters was determined using the elbow method and the dendrogram (Supplementary Figures 1 and 2). All cluster analyses and data visualizations were performed using R software (version 4.1.1) with R Studio (version 1.1.442).
Fig. 1
Kaplan-Meier survival curve for probability of death in all patients from symptom onset.
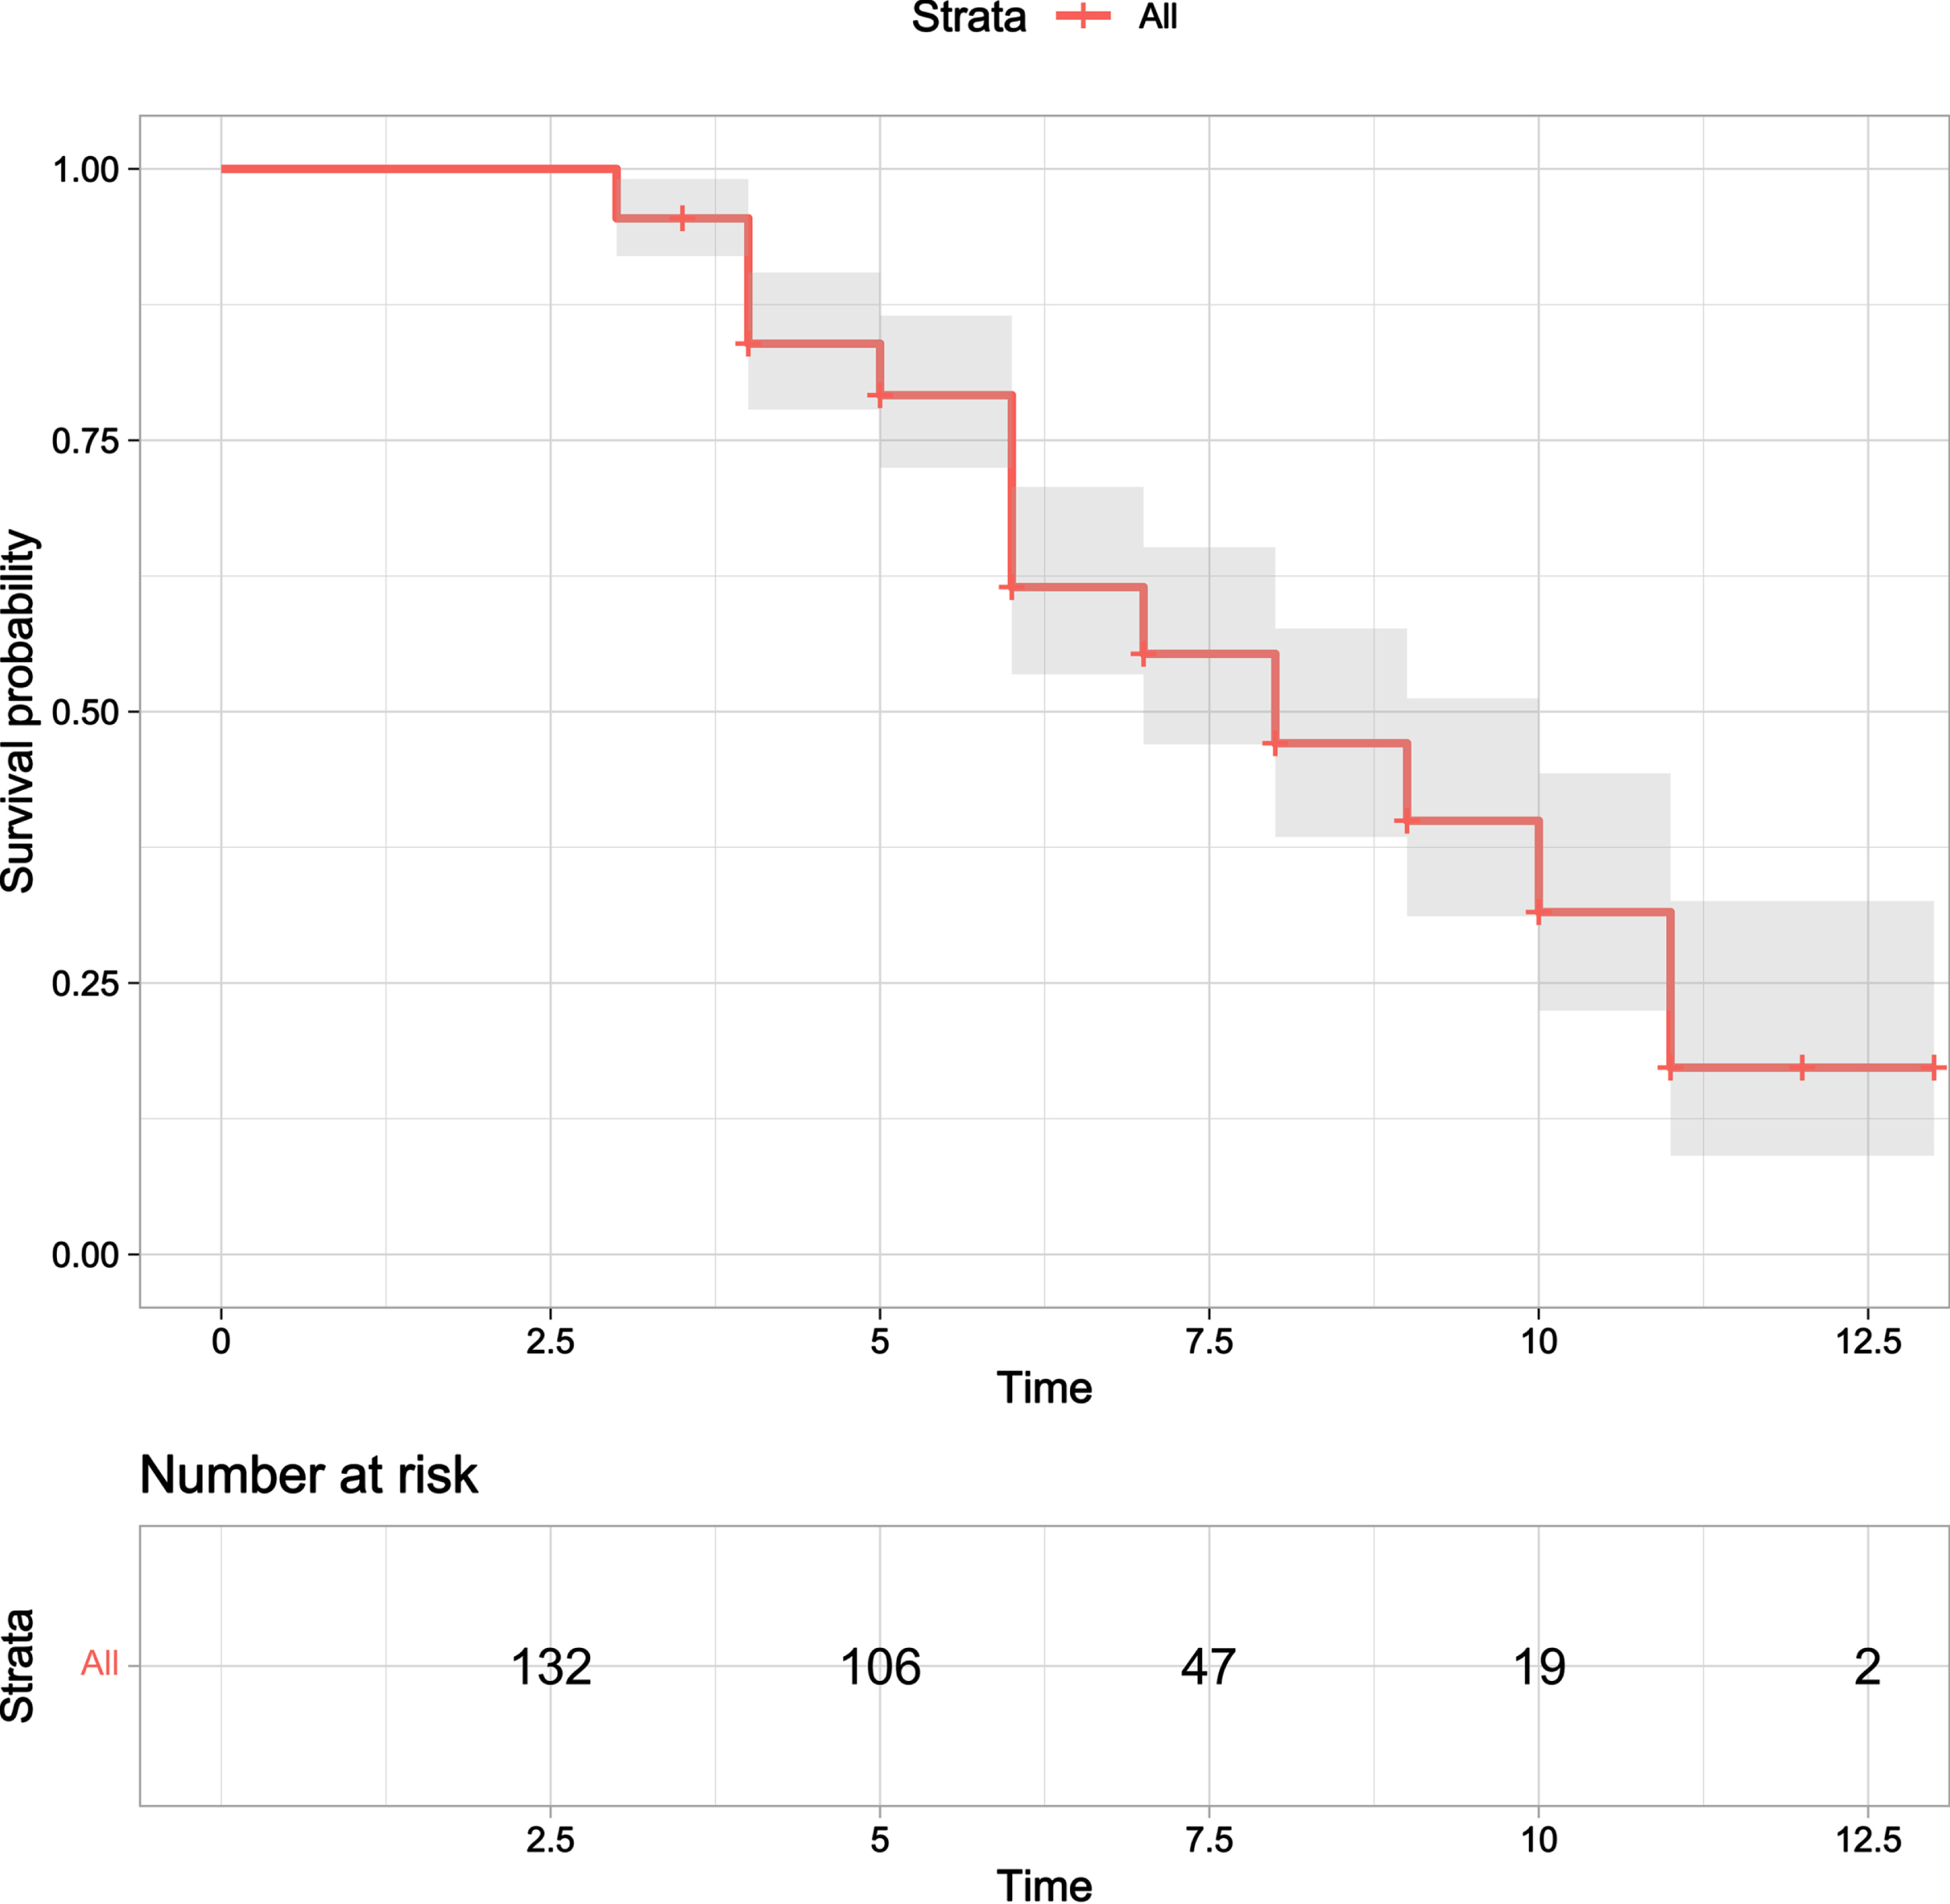
Fig. 2
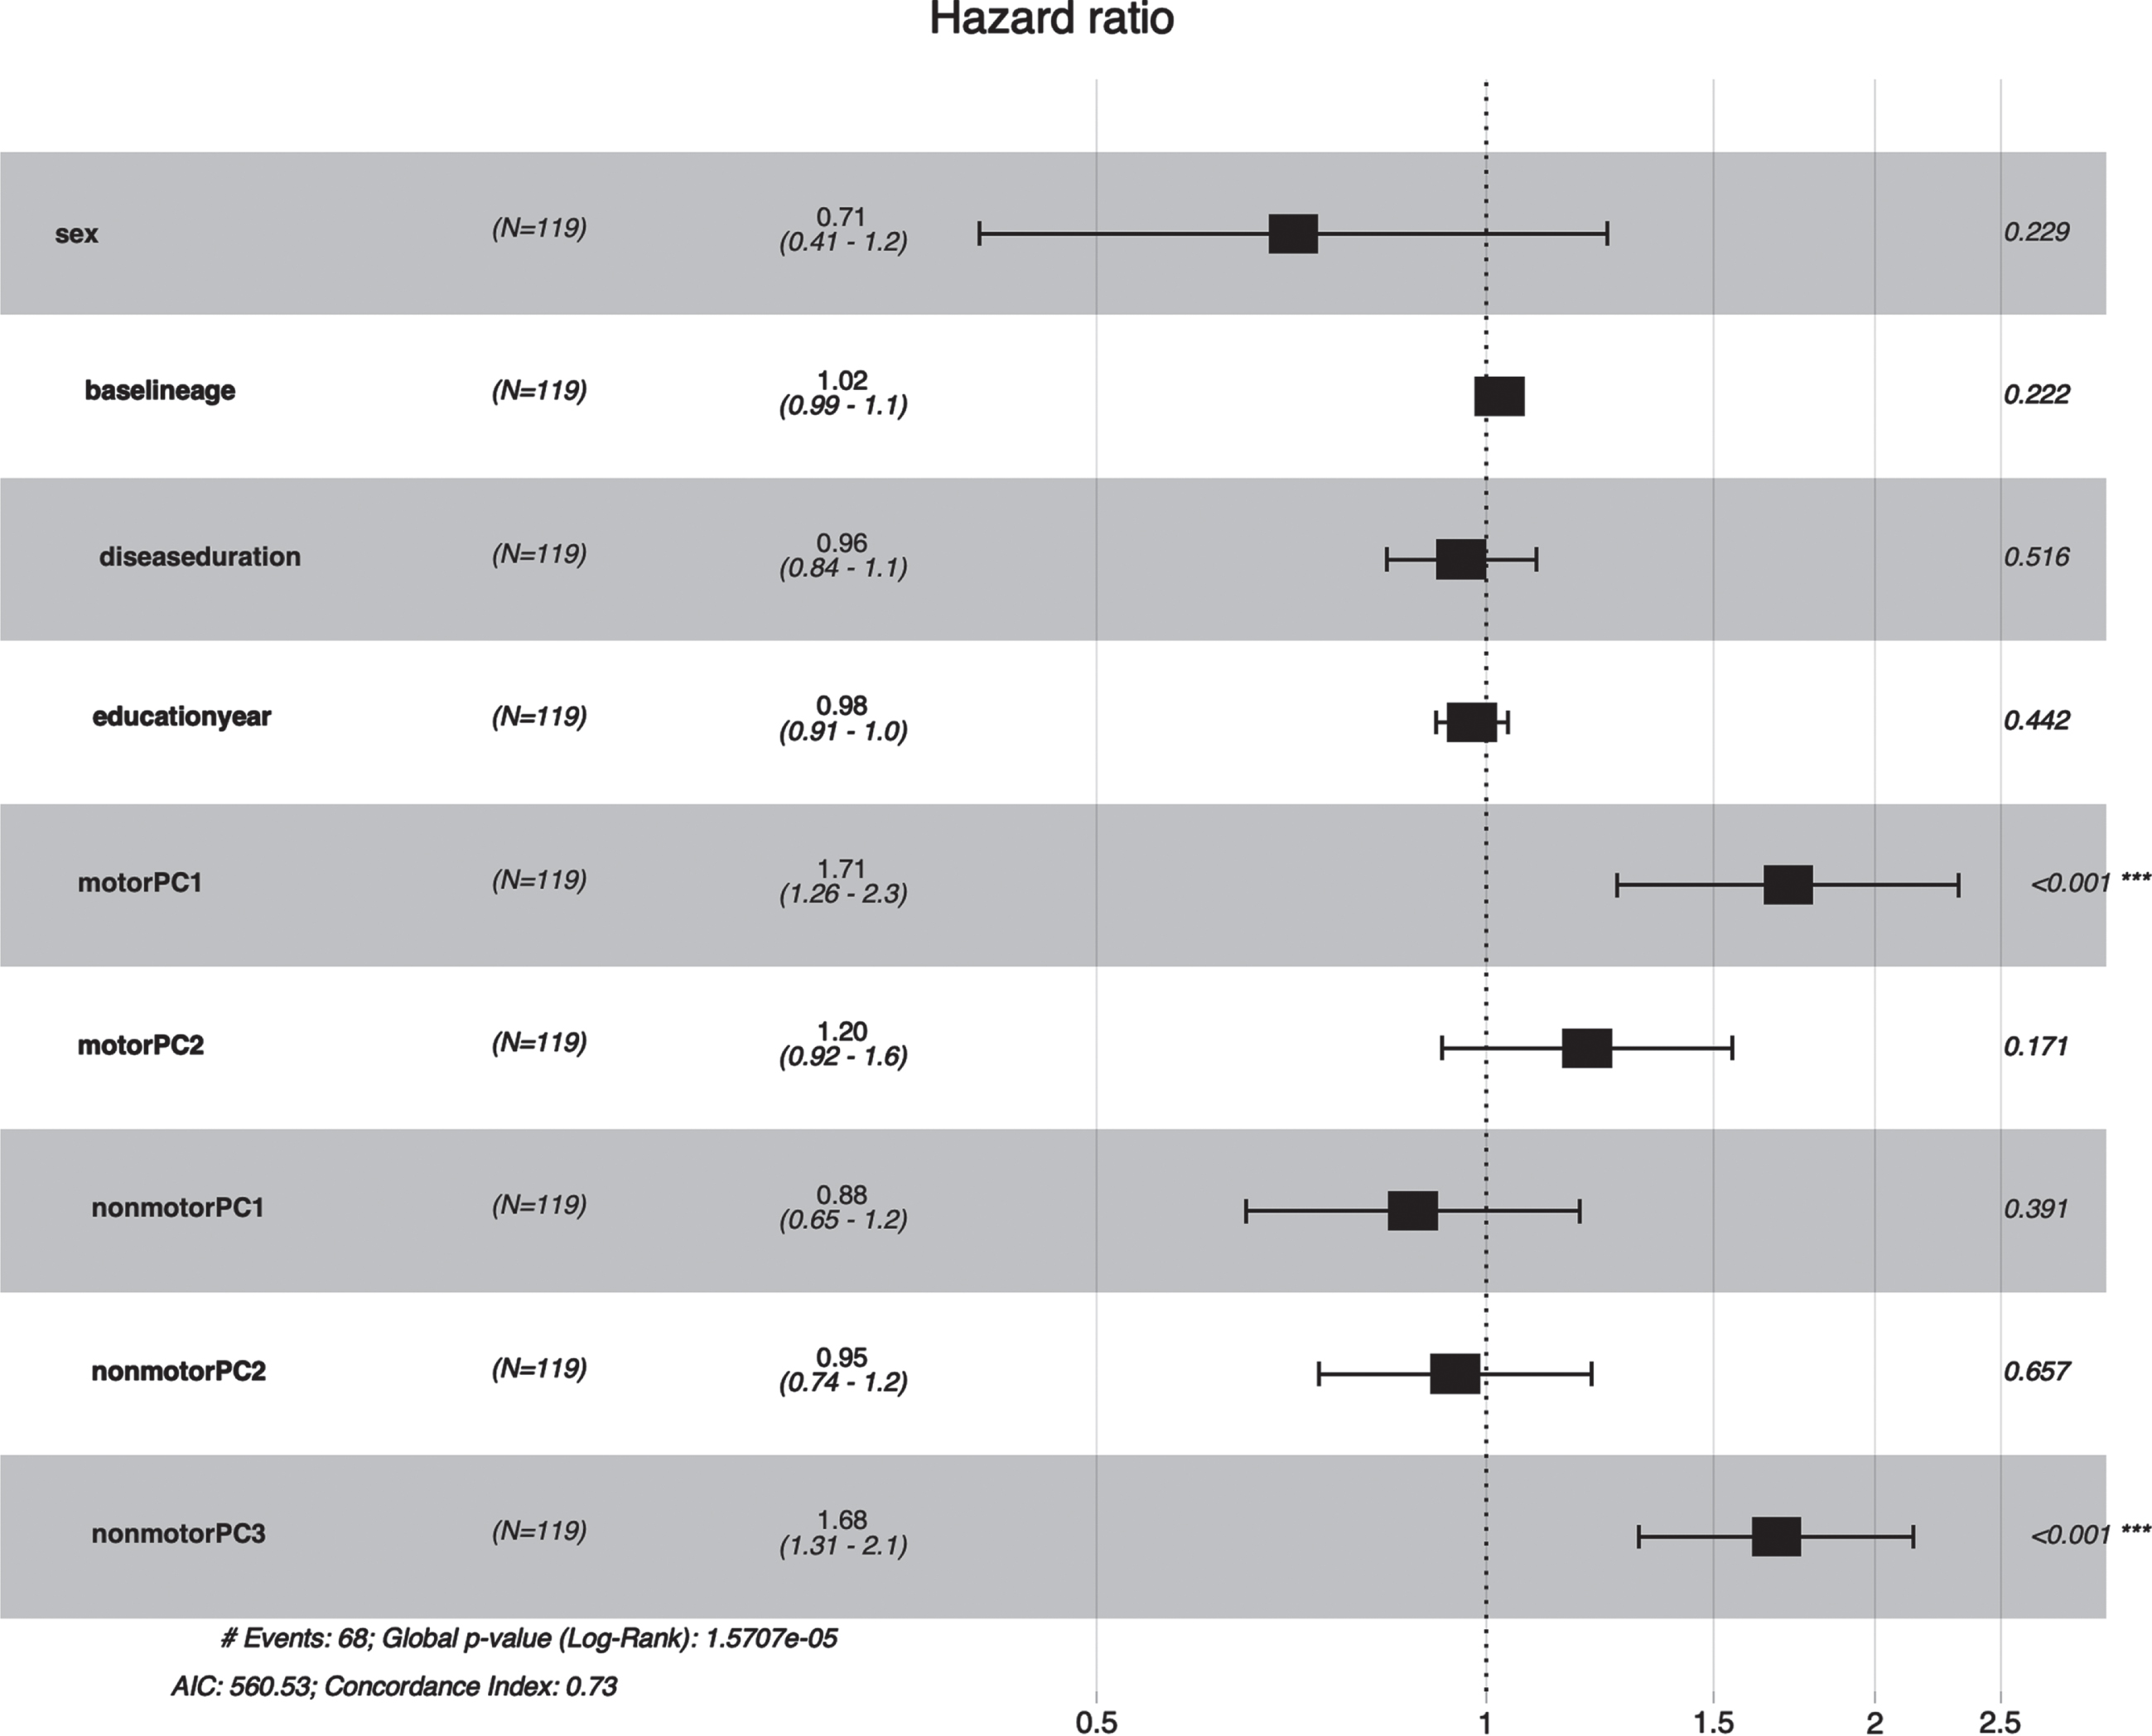
Forest plot of association between PCs and early death in MSA. Motor PC1 (HR = 1.68, 95% CI: 1.23–2.30, P value <0.001) and nonmotor PC3 (HR = 1.65, 95% CI: 1.30–2.10, p < 0.001) were associated with a shorter survival time in MSA patients.
Survival curves for overall population and each categorical cluster were estimated by the Kaplan-Meier and differences in survival were measured by the log rank test. The risk of death was calculated using the Cox proportional hazard model in multivariate analysis, adjusting age, gender, disease duration, and education year. Hazard ratio (HR) and 95% confidence interval were calculated. Significance was tested at the 5% level.
Table 1
Demographic data and clinical characteristics of patients with MSA
| MSA | N = 132 |
| Gender (Male/Female) | 73/59 |
| Age (y) | 61.79±7.39 |
| Education (>6 y/ ≤6 y) | 96/36 |
| Subtype (MSA-P/MSA-C) | 80/52 |
| Disease duration (y) | 3.42±2.00 |
| No. of death | 75 (56.8%) |
| Median survival (y) | 6.31±0.26 |
| Fall | 103 (78.0%) |
| Dysphagia | 68 (51.5%) |
| Constipation | 99 (75.0%) |
| Incontinence | 89 (67.4%) |
| UMSARS Part1 | 20.66±8.01 |
| UMSARS Part2 | 22.34±9.89 |
| UMSARS Part3 | 0.30±0.46 |
| UMSARS Part4 | 2.59±1.32 |
| COMPASS31 | 14.98±8.09 |
| RBDSQ | 4.48±2.90 |
| SS-16 | 7.78±3.73 |
| HAMD | 10.27±5.09 |
| HAMA | 11.47±5.74 |
| MMSE | 25.53±3.84 |
MSA, multiple system atrophy, UMSARS-II, the Unified Multiple System Atrophy Rating Scale, COMPASS31, Composite autonomic symptom score, RBDSQ, RBD Screening Questionnaire, SS-16, 16-item odor identification test from Sniffin’ Sticks, HAMD, 17-item Hamilton Rating Scale for Depression; HAMA, Hamilton Anxiety Scale; MMSE, Mini-Mental State Examination.
Table 2
Characteristics of the four clusters in MSA patients
| Cluster 1 | Cluster 2 | Cluster 3 | Cluster 4 | p* | |
| (N = 26) | (N = 31) | (N = 35) | (N = 27) | ||
| Gender (M/F) | 17/9 | 16/15 | 14/21 | 18/9 | 0.115 (3 vs. 1,4) |
| Age | 60.0±8.1 | 62.8±7.3 | 61.3±6.9 | 61.1±6.7 | 0.540 |
| Education (>6 y / ≤6 y) | 21/5 | 24/7 | 20/15 | 21/6 | 0.142 |
| Subtype (MSA-P/MSA-C) | 10/16 | 23/8 | 27/8 | 10/19 | 0.001 (1,2 vs. 3,4) |
| Disease Duration | 2.2±1.2 | 4.06±2.4 | 3.7±1.9 | 3.2±1.8 | 0.002 (1 vs. 2,3) |
| Fall | 16 | 26 | 30 | 21 | 0.113 (1 vs. 3) |
| Dysphagia | 10 | 15 | 30 | 9 | <0.001(3 vs. 1,2,4) |
| Constipation | 14 | 29 | 24 | 22 | 0.004(1 vs. 2,4; 3 vs. 2) |
| Incontinence | 10 | 21 | 26 | 22 | 0.005 (1 vs. 2, 3, 4) |
| UMSARS Part1 | 12.7±5.8 | 22.0±7.7 | 24.8±5.9 | 20.2±7.7 | <0.001 (1 vs. 2,3,4; 3 vs. 4) |
| UMSARS Part2 | 12.0±5.8 | 24.9±10.4 | 29.1±5.8 | 20.1±9.8 | <0.001 (1 vs. 2,3,4; 3 vs. 4) |
| UMSARS Part3 | 0.04±0.20 | 0.06±0.25 | 0.34±0.48 | 0.70±0.46 | <0.001(4 vs. 1,2,3; 3 vs. 1,2) |
| UMSARS Part4 | 1.4±0.7 | 2.7±1.3 | 3.2±1.1 | 2.6±1.3 | <0.001(1 vs. 2,3,4) |
| COMPASS31 | 9.3±6.5 | 16.1±6.6 | 14.0±8.4 | 19.6±7.9 | <0.001(1 vs. 2,3,4; 3 vs. 4) |
| RBDSQ | 4.2±2.8 | 5.1±2.8 | 3.3±2.7 | 5.2±2.8 | 0.030(3 vs. 2,4) |
| SS-16 | 9.6±3.5 | 6.9±3.7 | 6.2±3.9 | 8.7±2.9 | 0.001(3 vs. 1,4; 2 vs. 1) |
| HAMD | 5.6±3.3 | 14.2±3.6 | 12.2±3.8 | 7.1±4.6 | <0.001 (2 vs. 1,3,4; 3 vs. 1,4) |
| HAMA | 5.9±3.5 | 15.8±4.6 | 12.2±4.5 | 9.5±5.4 | <0.001(2 vs. 1,3,4; 3 vs. 1,4; 4 vs. 1) |
| MMSE | 28.0±2.0 | 27.1±2.2 | 22.0±4.5 | 25.3±2.8 | <0.001(3 vs. 1,2,4; 4 vs. 1,2) |
| motor PC1 | –1.0±0.6 | –0.19±1.0 | 0.56±0.64 | –0.12±0.79 | <0.001(1 vs. 2,3,4; 3 vs. 2,4) |
| motor PC2 | –0.39±1.2 | 0.11±0.96 | 0.48±0.90 | –0.29±0.77 | 0.002 (3 vs. 1,4) |
| nonmotor PC1 | –0.87±0.61 | 0.98±0.68 | 0.16±0.71 | –0.65±0.83 | <0.001(2 vs. 1,3,4; 3 vs. 1,4) |
| nonmotor PC2 | 0.59±0.70 | 0.43±0.68 | –0.94±1.03 | 0.00±0.73 | <0.001 (3 vs. 1,2,4; 1 vs. 4) |
| nonmotor PC3 | –0.78±0.61 | –0.44±0.56 | 0.09±1.02 | 0.99±0.71 | <0.001 (4 vs. 3,2,1; 1 vs. 3) |
MSA, Multiple system atrophy; UMSARS-II, the Unified Multiple System Atrophy Rating Scale; COMPASS31, Composite autonomic symptom score; RBDSQ, RBD Screening Questionnaire; SS-16, 16-item odor identification test from Sniffin’ Sticks; HAMD, 17-item Hamilton Rating Scale for Depression; HAMA, Hamilton Anxiety Scale; MMSE, Mini-Mental State Examination; PC, principal component. *compared by One-way ANOVA and χ2 tests.
RESULTS
There were 153 MSA patients at baseline. 21 patients were removed from further analysis because of losing contact (13), refusal of follow-up (5), and re-diagnosis (3). 132 MSA patients (MSA-P/MSA-C 80/52; male/female 73/59; mean age 61.79±7.39 years; mean disease duration 3.42±2.00 years) were finally included in this study (Supplementary Figure 3). Demographic and clinical characteristics of MSA patients were listed in Table 1. 75 patients died, and 57 patients were still alive at the time of the last visit. The median survival time from symptom onset to death (estimated using data from all patients by Kaplan-Meier analysis) was 6.3 (95% CI = 6.1–6.7) years of primary cohorts (Fig. 1). Due to the incomplete clinical evaluation of individual patients, 119 MSA patients were ultimately included in PCA and cluster analysis.
Fig. 3
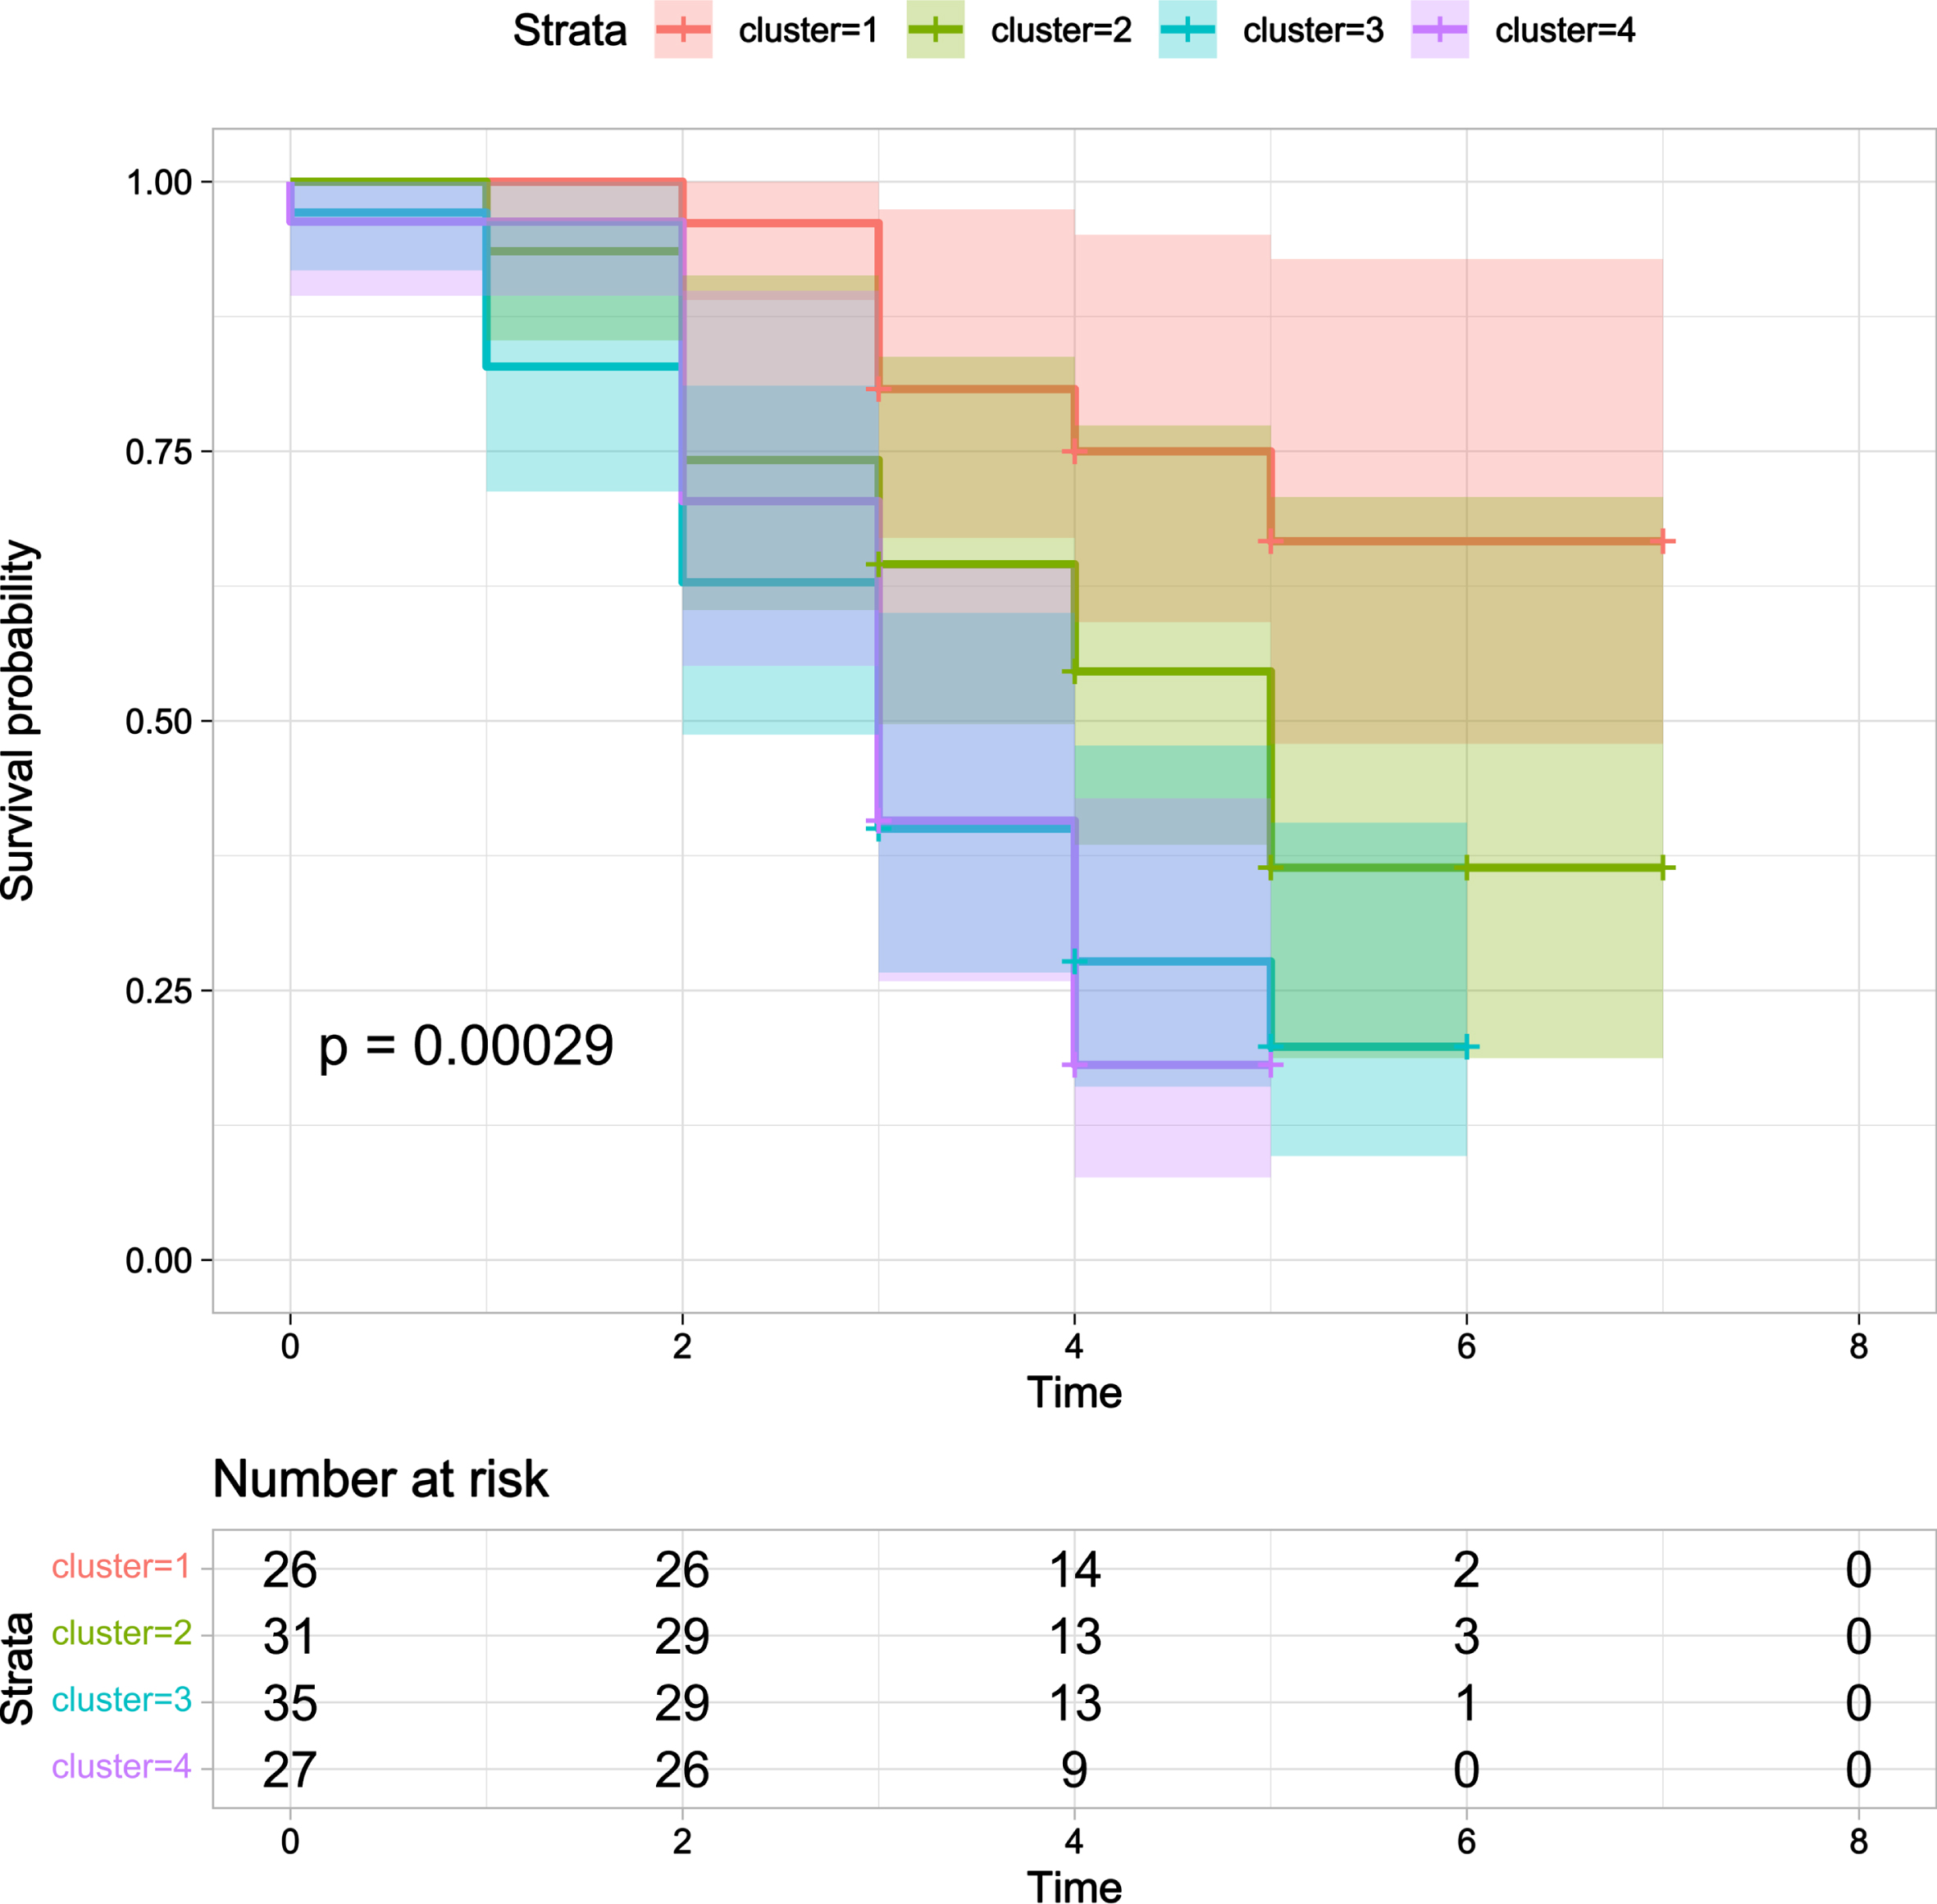
Kaplan-Meier survival curve for probability of death in four clusters. Cluster 1 (orange line) had the longer survival time in Kaplan-Meier analysis while Cluster 3 (blue line) and Cluster 4 (red line) had the shorter survival time (p < 0.001).
PCA of clinical symptoms and Cox regression analysis of the PCs
For motor PCA, the eigenvalues of the first 2 PCs were greater than 1, and the 2 PCs can explain nearly 64% of the total variation. For nonmotor PCA, the eigenvalues of the first 3 PCs were greater than 1, and the 3 PCs can explain nearly 59% of the total variation. Based on the loading matrix (Supplementary Table 2), these PCs can be characterized as follows: motor PC1, mainly explained by UMSARS I and II; motor PC2, mainly explained by axial symptoms including falls and dysphagia; nonmotor PC1, mainly explained by depression and anxiety (assessed by HAMD and HAMA); nonmotor PC2, mainly explained by MMSE and SS-16; nonmotor PC3, mainly explained by UMSARS III and COMPASS-31.
In multivariate analysis using the Cox proportional hazard model, the 5 PCs were selected as the independent variables and death as the dependent variable, adjusting age, gender, disease duration, and education year. The survival model showed that a shorter survival time was associated with motor PC1 (HR = 1.71, 95% CI: 1.26–2.30, p < 0.001) and nonmotor PC3 (HR = 1.68, 95% CI: 1.31–2.10, p < 0.001) (Fig. 2).
Cluster analysis
Results from the hierarchical clustering on the 5 PCs are reported in Table 2. Cluster 1 (n = 26) patients were slightly affected in all domains. Cluster 2 (n = 31) patients were characterized by severe mood disorder with relatively longer disease duration. Cluster 3 (n = 35) patients were characterized by obvious axial symptoms and cognitive impairment. Cluster 4 (n = 27) patients were characterized by severe autonomic dysfunction especially orthostatic hypotension.
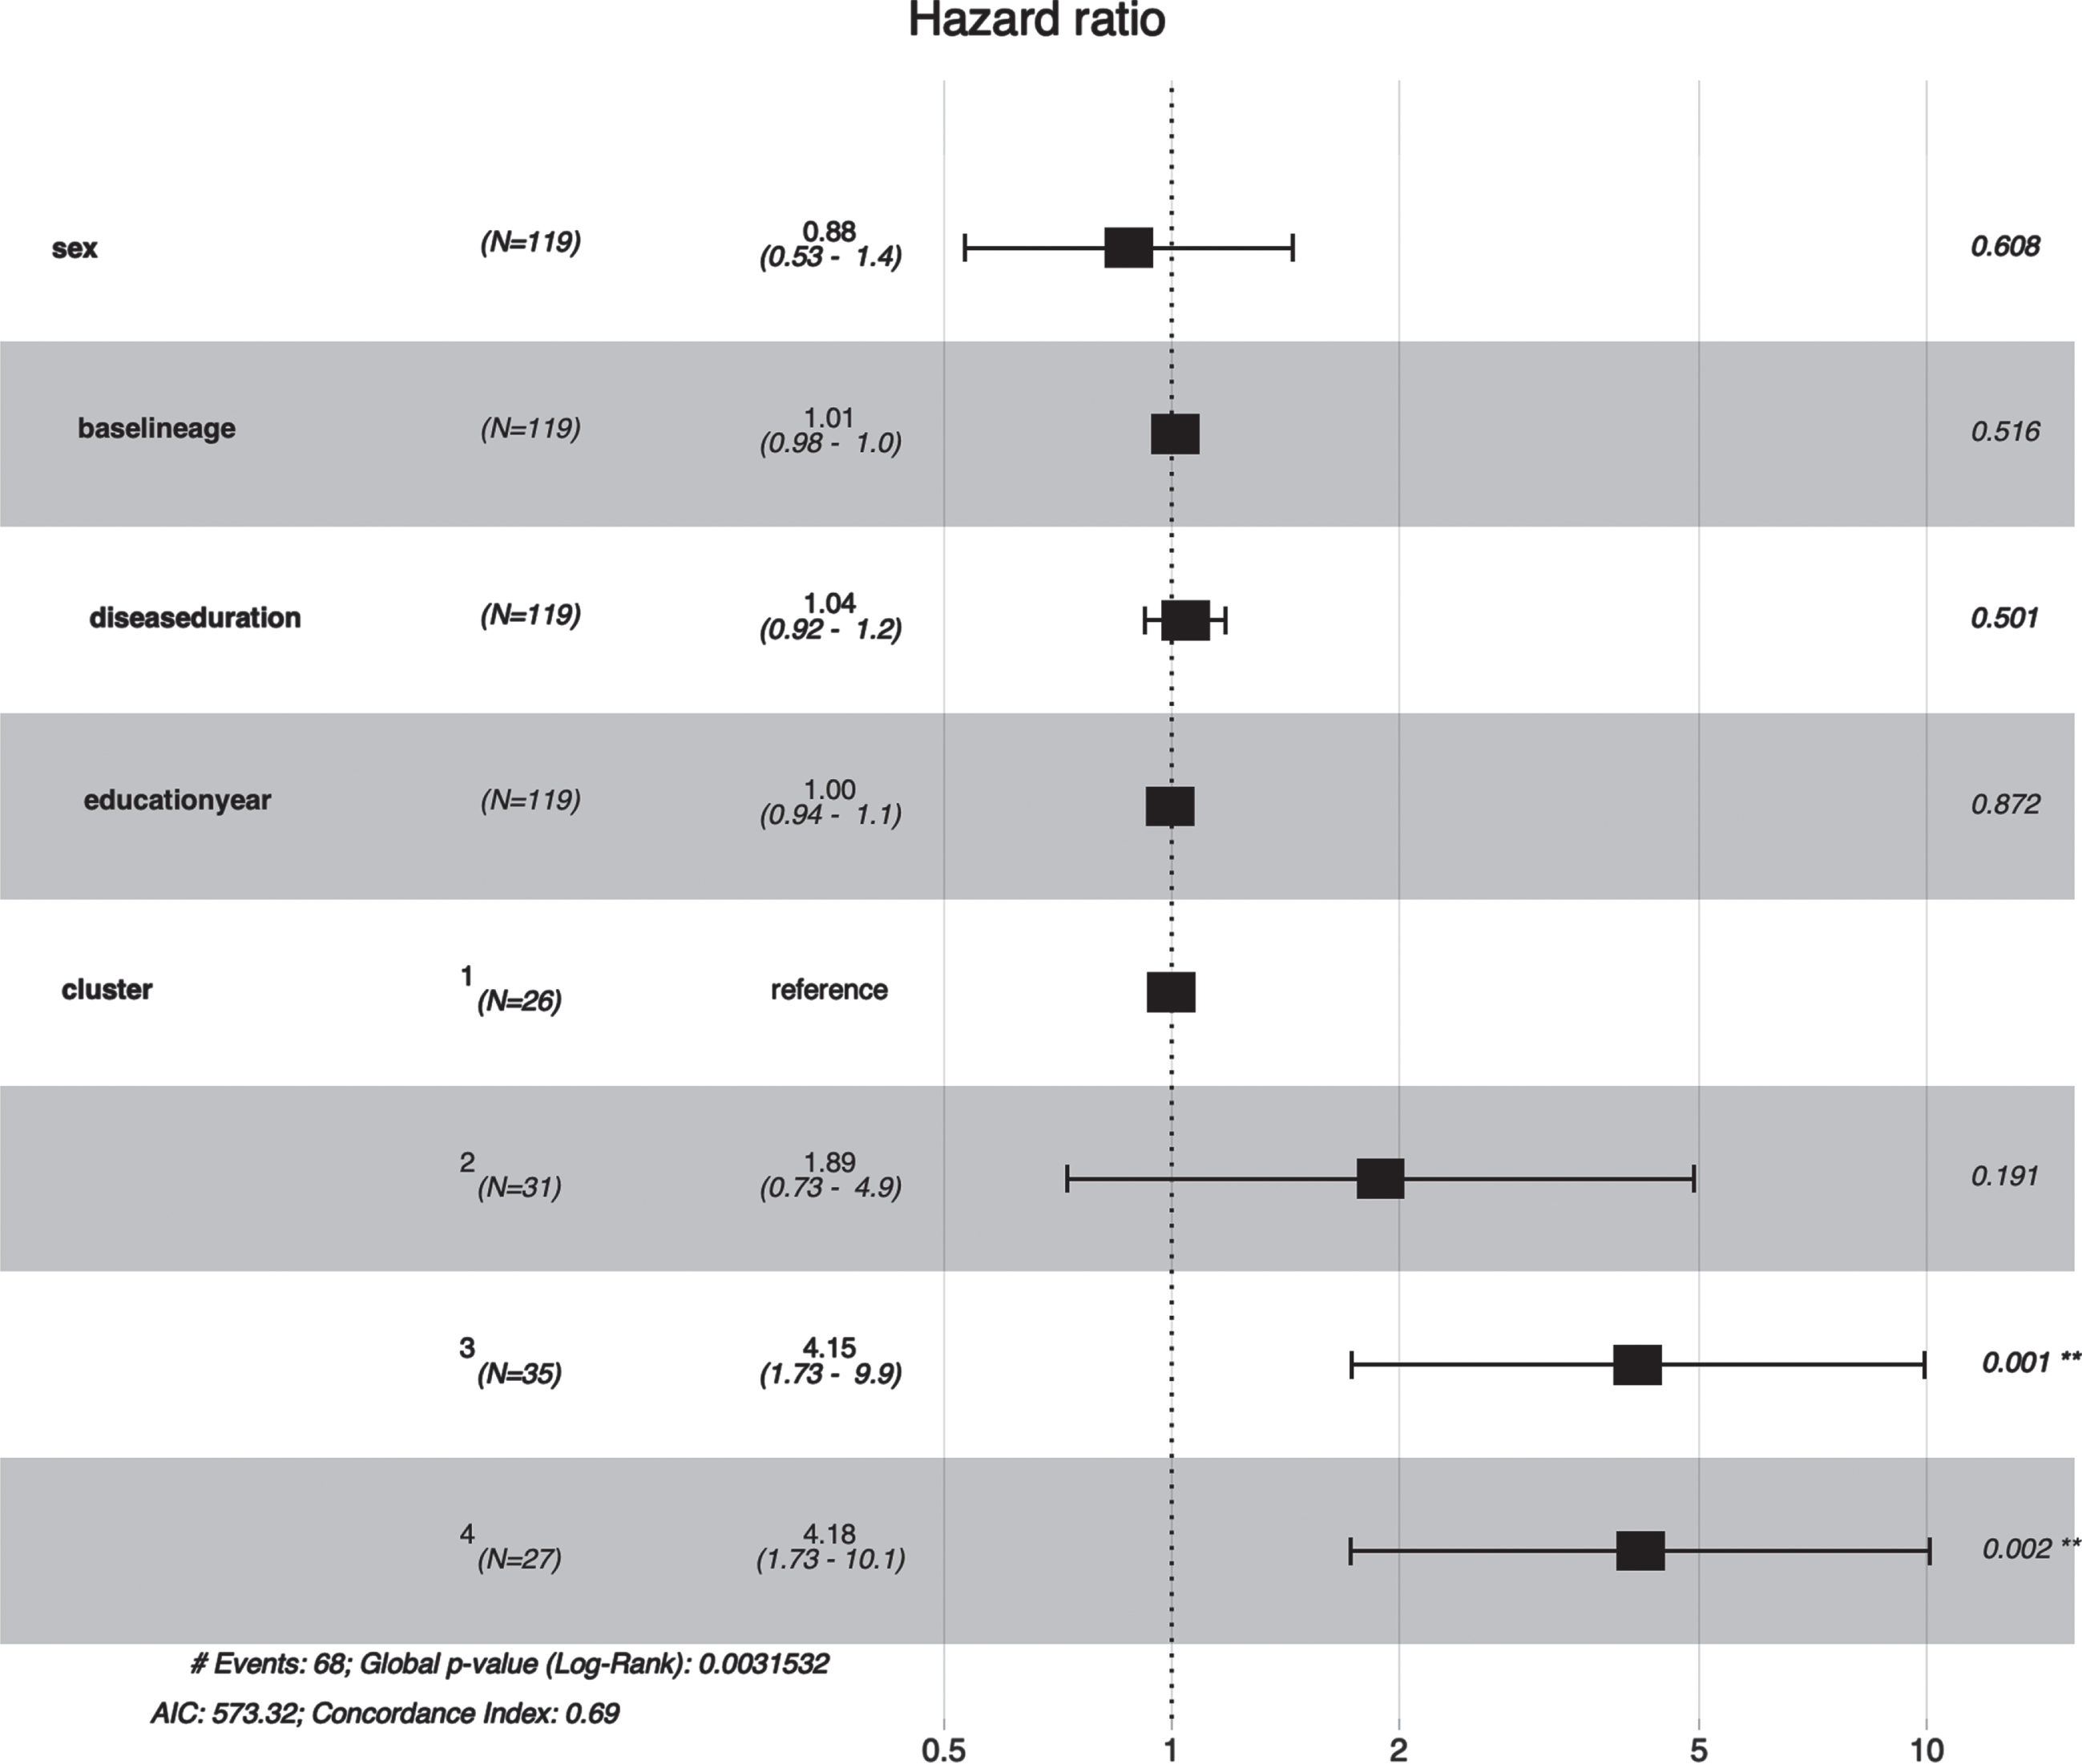
Cluster 1 had the longer survival time in Kaplan-Meier analysis while Cluster 3 and Cluster 4 had the shorter survival time (p < 0.001) (Fig. 3). Furthermore, the multivariate Cox regression indicated that Cluster 3 (HR = 4.15, 95% CI: 1.73–9.90, p = 0.001) and Cluster 4 (HR = 4.18, 95% CI: 1.73–10.1, p = 0.002) were independently associated with shorter survival time after adjusting age, gender, disease duration, and education year (Fig. 4).
Fig. 4
Forest plot of association between clusters and early death in MSA. Cluster 3 (HR = 4.15, 95% CI: 1.73–9.90, P value = 0.001) and Cluster 4 (HR = 4.18, 95% CI: 1.73–10.1, p = 0.002) were associated with a shorter survival time in MSA patients.
DISCUSSION
The present study is a retrospective longitudinal study including comprehensive survival predictors including demographic data and detailed motor and nonmotor scales. Considering the correlations between scales, PCA was performed first to avoid collinearity. Cox regression model revealed negative associations of motor PC1 (mainly explained by UMSARS I and II) and nonmotor PC3 (mainly explained by autonomic dysfunction, especially orthostatic hypotension) with a shorter survival time. Then we used hierarchical cluster analysis to group MSA patients. Four clusters were identified: Cluster 1 (mild), Cluster 2 (mood disorder-dominant), Cluster 3 (axial symptoms and cognitive impairment-dominant), and Cluster 4 (autonomic failure-dominant). Further analysis revealed that Cluster 3 and 4 were independently associated with shorter survival. After PCA and cluster analysis, we identified several independent survival factors of MSA including more serious motor symptoms based on UMSARS scores, axial symptoms such as falls and dysphagia, orthostatic hypotension, and cognitive impairment at baseline.
The present study reported that the median survival time of Chinese MSA patients was 6.31 (95% CI = 6.1–6.7) years, similar with the results of another study in Chinese patients [11], however, shorter than that of western countries [6–8, 12]. The patients included in our study did not show a high proportion of MSA-C subtypes. Based on PCA and cluster analysis, MSA subtype were not associated with survival time, consistent with the results of previous studies [6, 8, 11, 18, 19]. Additionally, the study on autopsy-confirmed MSA indicated no significant difference on survival time between subtypes [20], which revealed that the population or subtypes might be not important on survival time of MSA.
Our study found that nonmotor PC3 was associated with short survival and cluster 4 had a shorter survival time. These results indicated that autonomic dysfunction is an important factor in predicting MSA survival. A large retrospective study pointed out that the initial onset of either autonomic or motor symptoms did not influence length of survival, autonomic severity score may predict unfavorable survival during disease development [8]. Another prospective cohort study also highlighted that shorter survival were associated with the progression of autonomic dysfunction over time, particularly with current higher supine diastolic blood pressure and current more severe orthostatic hypotension, rather than the type of initial symptoms [19]. These results were consistent with our study. Several studies found the associations between initial symptoms and prognosis. MSA patients with autonomic onset had a worse prognosis than those with motor onset in some studies [11, 21]. Some pathophysiological studies attempted to find out the mechanism of association between autonomic failure and poor prognosis in MSA. There was a severe depletion of serotonergic neurons in the nucleus raphe magnus, raphe obscurus, raphe pallidus, and ventrolateral medulla in MSA [22]. Depletion of serotonergic neurons may lead to impaired control of sympathetic outflow. The spinal intermediolateral cell column and medullary serotonergic system, which regulates the cardiovascular and respiratory systems, could be responsible for poor prognosis in patients with MSA [23]. A study on autopsy-confirmed MSA patients with sudden death exhibited marked involvement of the medullary serotonergic neurons, the involvement of the medullary catecholaminergic or cholinergic neurons did not differ between the groups [24].
Our study also supported the importance of orthostatic hypotension in the death of MSA patients. Vasopressin neurons in the paraventricular nucleus projecting to the intermediolateral cell column may contribute to the control of blood pressure. In addition, the rostral ventrolateral medulla which is a critical area for the tonic maintenance of sympathetic vasomotor tone is also associated with orthostatic hypotension in MSA [25]. Similarly, a study reported increased daytime blood pressure variability were predictive of death in patients with MSA, which supports the value of ambulatory blood pressure recording for assessing autonomic failure in MSA patients [26].
The present study found motor PC1, mainly explained by UMSARS scores, was associated with poor survival. Consistently, the same association between UMSARS scores and shorter survival has been recognized in previous studies [11, 19]. Previous study also emphasized the importance about progression over time of UMSARS scores for poor survival [19], which indicated that rapid progression with more widespread neurodegeneration results in shorter survival time. In our further cluster analysis, axial symptoms and cognitive impairment-dominant presented shorter survival time. Falls are a common symptom in MSA patients, which represent the involvement of axial symptoms. Frequent falls were also an adverse factor for the prediction of MSA survival in other studies [8, 11]. Dysphagia, another common presentation of axial symptoms, was also associated with prognosis in previous studies. A previous study reported pharyngeal anomalies was associated with poorer prognosis [27]. Our study also found worse cognitive impairment in Cluster 3 which had shorter survival time. This may be due to the fact that the worse cognitive function accompanied by worse self-care ability accelerates the disease progress. Mood disorder was not associated with poor prognosis according to PCA and cluster analysis.
There are some limitations in our study. Our study is a retrospective study, but we have made a detailed record and evaluation of the patient’s information. Further longitudinal follow-up studies can collect more detailed information related to disease progression. Another limitation is that the diagnosis of MSA lacks postmortem evaluation and is diagnosed by senior movement disorder specialists based on the second consensus criteria for probable MSA. In addition, the number of patients included in this study is not the largest because of loss of contact during the follow-up, which needs to be gradually improved in further clinical research. Further prospective longitudinal follow-up studies with larger sample size involving serology, pathology, and imaging to explore the progression and survival of MSA are warranted, which requires a more comprehensive and rigorous experimental design in the early stages of the study.
Conclusions
Our study on a large Chinese MSA patient population confirmed the median survival time of Chinese MSA patients was 6.31 years. We identified several independent survival factors of MSA including more serious motor symptoms based on UMSARS scores, axial symptoms such as falls and dysphagia, orthostatic hypotension, and cognitive impairment via PCA and cluster analysis. The further study should focus on the mechanism of influencing the survival of MSA patients through imaging, serology, pathology, and other indicators.
FUNDING
The study was supported by the grants from the National Natural Science Foundation of China (81971187, 82201561) and Shanghai Municipal Science and Technology Major Project (2018SHZDZX05).
ACKNOWLEDGMENTS
The authors thank all subjects for their participation in the study.
CONFLICT OF INTEREST
The authors have no conflict of interest to report.
DATA AVAILABILITY
The data that support the findings of this study are available from the corresponding author upon reasonable request.
SUPPLEMENTARY MATERIAL
[1] The supplementary material is available in the electronic version of this article: https://dx.doi.org/10.3233/JPD-225127.
References
[1] | Claassen DO ((2022) ) Multiple system atrophy. Continuum (Minneap Minn) 28: , 1350–1363. |
[2] | Hu WZ , Cao LX , Yin JH , Zhao XS , Piao YS , Gu WH , Ma JH , Wan ZR , Huang Y ((2022) ) Non-motor symptoms in multiple system atrophy: A comparative study with Parkinson’s disease and progressive supranuclear palsy. Front Neurol 13: , 1081219. |
[3] | Ubhi K , Low P , Masliah E ((2011) ) Multiple system atrophy: A clinical and neuropathological perspective. Trends Neurosci 34: , 581–590. |
[4] | Kaji S , Maki T , Ishimoto T , Yamakado H , Takahashi R ((2020) ) Insights into the pathogenesis of multiple system atrophy: Focus on glial cytoplasmic inclusions. Transl Neurodegener 9: , 7. |
[5] | Kim HJ , Jeon BS , Lee JY , Yun JY ((2011) ) Survival of Korean patients with multiple system atrophy. Mov Disord 26: , 909–912. |
[6] | Low PA , Reich SG , Jankovic J , Shults CW , Stern MB , Novak P , Tanner CM , Gilman S , Marshall FJ , Wooten F , Racette B , Chelimsky T , Singer W , Sletten DM , Sandroni P , Mandrekar J ((2015) ) Natural history of multiple system atrophy in the USA: A prospective cohort study. Lancet Neurol 14: , 710–719. |
[7] | Wenning GK , Geser F , Krismer F , Seppi K , Duerr S , Boesch S , Köllensperger M , Goebel G , Pfeiffer KP , Barone P , Pellecchia MT , Quinn NP , Koukouni V , Fowler CJ , Schrag A , Mathias CJ , Giladi N , Gurevich T , Dupont E , Ostergaard K , Nilsson CF , Widner H , Oertel W , Eggert KM , Albanese A , del Sorbo F , Tolosa E , Cardozo A , Deuschl G , Hellriegel H , Klockgether T , Dodel R , Sampaio C , Coelho M , Djaldetti R , Melamed E , Gasser T , Kamm C , Meco G , Colosimo C , Rascol O , Meissner WG , Tison F , Poewe W ((2013) ) The natural history of multiple system atrophy: A prospective European cohort study. Lancet Neurol 12: , 264–274. |
[8] | Coon EA , Sletten DM , Suarez MD , Mandrekar JN , Ahlskog JE , Bower JH , Matsumoto JY , Silber MH , Benarroch EE , Fealey RD , Sandroni P , Low PA , Singer W ((2015) ) Clinical features and autonomic testing predict survival in multiple system atrophy. Brain 138: , 3623–3631. |
[9] | Kühnel L , Raket LL , Åström DO , Berger AK , Hansen IH , Krismer F , Wenning GK , Seppi K , Poewe W , Molinuevo J ((2022) ) Disease progression in multiple system atrophy-novel modeling framework and predictive factors. Mov Disord 37: , 1719–1727. |
[10] | De Pablo-Fernández E , Lees AJ , Holton JL , Warner TT ((2019) ) Prognosis and neuropathologic correlation of clinical subtypes of Parkinson disease. JAMA Neurol 76: , 470–479. |
[11] | Cao B , Zhang L , Zou Y , Wei Q , Ou R , Chen Y , Shang HF ((2018) ) Survival analysis and prognostic nomogram model for multiple system atrophy. Parkinsonism Relat Disord 54: , 68–73. |
[12] | Giannini G , Mastrangelo V , Provini F , Droghini A , Cecere A , Barletta G , Mignani F , Guaraldi P , Cortelli P , Calandra-Buonaura G ((2020) ) Progression and prognosis in multiple system atrophy presenting with REM behavior disorder, Neurology 94: , e1828–e1834. |
[13] | Cao B , Liang Y , Zhang LY , Hou YB , Ou RW , Wei QQ , Shang H ((2021) ) The cold hand sign in multiple system atrophy: Frequency-associated factors and its impact on survival. Front Aging Neurosci 13: , 767211. |
[14] | Xing T , Ma J , Jia C , Ou T ((2020) ) Neurogenic lower urinary tract dysfunction predicts prognosis in patients with multiple system atrophy. Clin Auton Res 30: , 247–254. |
[15] | Wenning GK , Stankovic I , Vignatelli L , Fanciulli A , Calandra-Buonaura G , Seppi K , Palma JA , Meissner WG , Krismer F , Berg D , Cortelli P , Freeman R , Halliday G , Höglinger G , Lang A , Ling H , Litvan I , Low P , Miki Y , Panicker J , Pellecchia MT , Quinn N , Sakakibara R , Stamelou M , Tolosa E , Tsuji S , Warner T , Poewe W , Kaufmann H ((2022) ) The Movement Disorder Society criteria for the diagnosis of multiple system atrophy. Mov Disord 37: , 1131–1148. |
[16] | Carmona-Abellan M , Del Pino R , Murueta-Goyena A , Acera M , Tijero B , Berganzo K , Gabilondo I , Gómez-Esteban JC ((2021) ) Multiple system atrophy: Clinical, evolutive and histopathological characteristics of a series of cases. Neurologia (Engl Ed), doi: 10.1016/j.nrl.2021.04.007. |
[17] | Hsieh FY , Lavori PW ((2000) ) Sample-size calculations for the Cox proportional hazards regression model with nonbinary covariates. Control Clin Trials 21: , 552–560. |
[18] | Watanabe H , Saito Y , Terao S , Ando T , Kachi T , Mukai E , Aiba I , Abe Y , Tamakoshi A , Doyu M , Hirayama M , Sobue G ((2002) ) Progression and prognosis in multiple system atrophy: An analysis of 230 Japanese patients. Brain 125: , 1070–1083. |
[19] | Foubert-Samier A , Pavy-Le Traon A , Guillet F , Le-Goff M , Helmer C , Tison F , Rascol O , Proust-Lima C , Meissner WG ((2020) ) Disease progression and prognostic factors in multiple system atrophy: A prospective cohort study. Neurobiol Dis 139: , 104813. |
[20] | Figueroa JJ , Singer W , Parsaik A , Benarroch EE , Ahlskog JE , Fealey RD , Parisi JE , Sandroni P , Mandrekar J , Iodice V , Low PA , Bower JH ((2014) ) Multiple system atrophy: Prognostic indicators of survival. Mov Disord 29: , 1151–1157. |
[21] | Sakushima K , Nishimoto N , Nojima M , Matsushima M , Yabe I , Sato N , Mori M , Sasaki H ((2015) ) Epidemiology of multiple system atrophy in Hokkaido, the northernmost island of Japan. Cerebellum 14: , 682–687. |
[22] | Benarroch EE , Schmeichel AM , Low PA , Parisi JE ((2004) ) Involvement of medullary serotonergic groups in multiple system atrophy. Ann Neurol 55: , 418–422. |
[23] | Tada M , Kakita A , Toyoshima Y , Onodera O , Ozawa T , Morita T , Nishizawa M , Takahashi H ((2009) ) Depletion of medullary serotonergic neurons in patients with multiple system atrophy who succumbed to sudden death. Brain 132: , 1810–1819. |
[24] | Riku Y , Watanabe H , Mimuro M , Iwasaki Y , Ito M , Katsuno M , Sobue G , Yoshida M ((2017) ) Non-motor multiple system atrophy associated with sudden death: Pathological observations of autonomic nuclei. J Neurol 264: , 2249–2257. |
[25] | Coon EA , Cutsforth-Gregory JK , Benarroch EE ((2018) ) Neuropathology of autonomic dysfunction in synucleinopathies. Mov Disord 33: , 349–358. |
[26] | Pavy-Le Traon A , Foubert-Samier A , Ory-Magne F , Fabbri M , Senard JM , Meissner WG , Rascol O , Amar J ((2022) ) Ambulatory blood pressure and drug treatment for orthostatic hypotension as predictors of mortality in patients with multiple system atrophy. Eur J Neurol 29: , 1025–1034. |
[27] | El Fassi N , Gallois Y , Crestani S , Fichaux-Bourrin P , Ory F , Fabbri M , Pavyle Traon A , Woisard V ((2022) ) Pharyngolaryngeal semiology and prognostic factors in multiple system atrophy. Eur Arch Otorhinolaryngol 279: , 4473–4483. |


